), 罗万银1(), 车雪华1,2, 王芳1, 逯军峰1, 邹松兵3
), Wanyin Luo1(), Xuehua Che1,2, Fang Wang1, Junfeng Lu1, Songbing Zou3
), 罗万银1(), 车雪华1,2, 王芳1, 逯军峰1, 邹松兵3
), Wanyin Luo1(), Xuehua Che1,2, Fang Wang1, Junfeng Lu1, Songbing Zou3
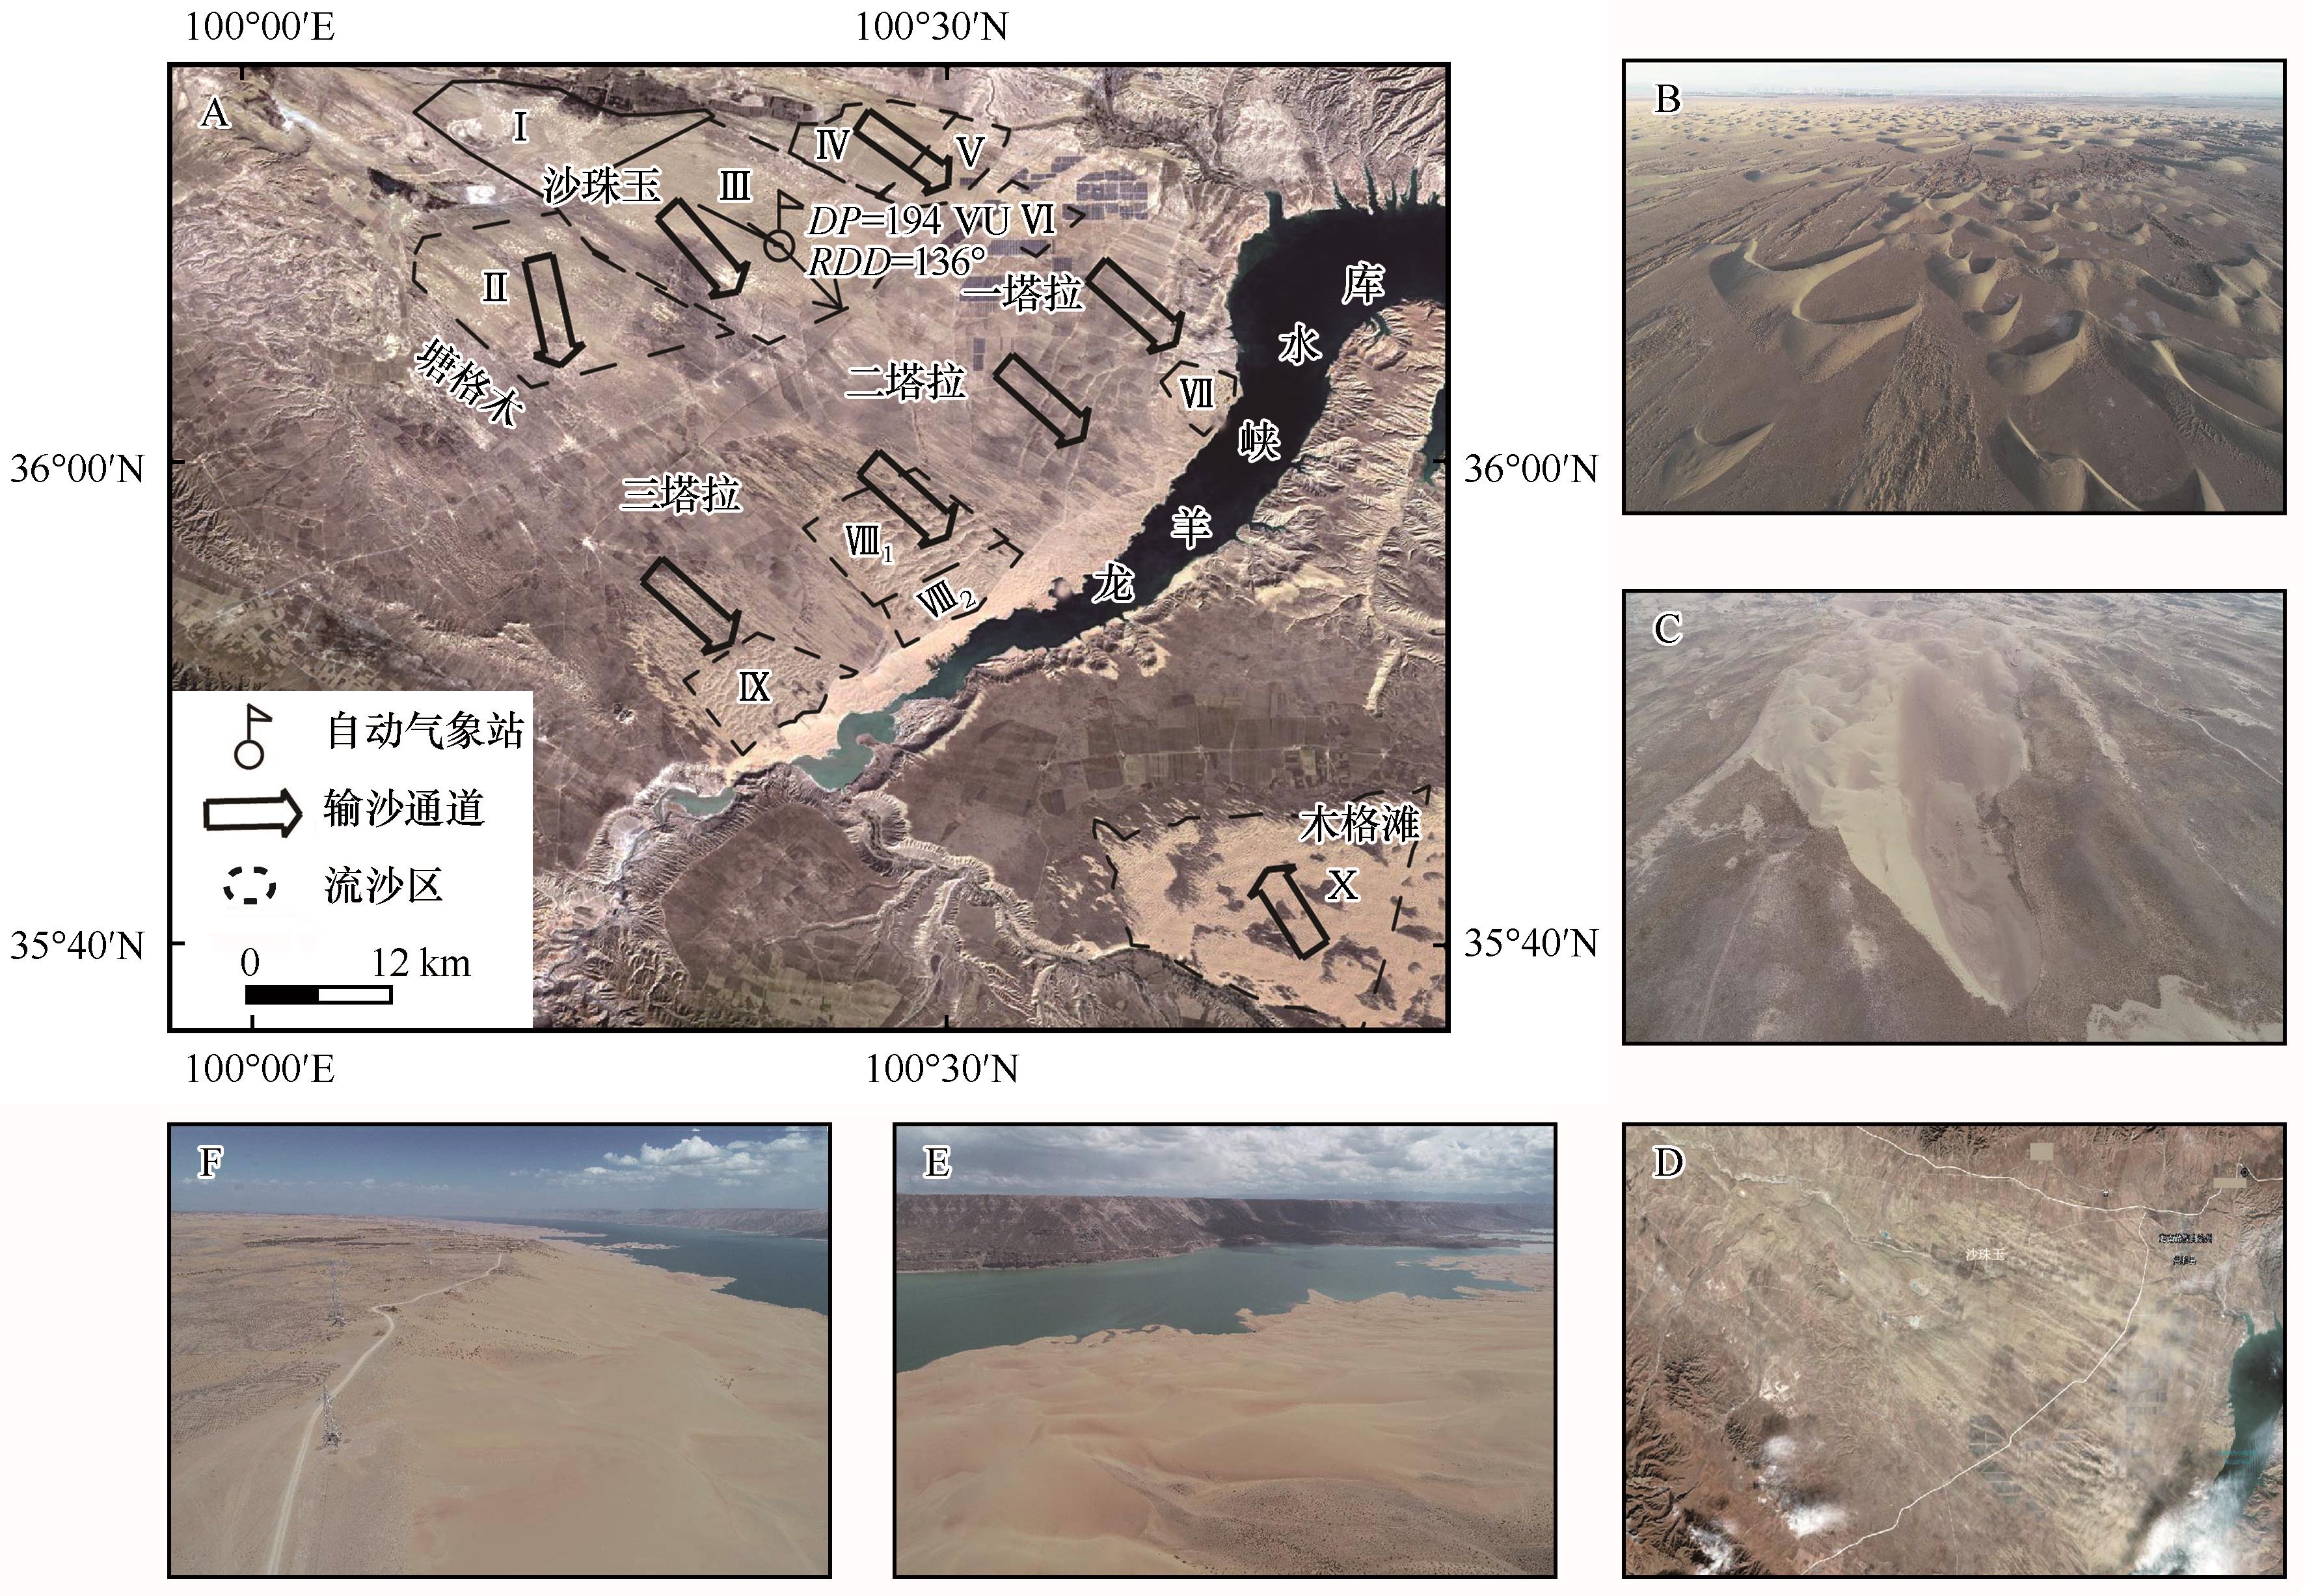
图1. 龙羊峡库区周围景观格局及输沙通道分布(A:流沙区输沙通道分布,Ⅰ—Ⅹ代表流沙区;B和C为不同区域的沙源,其中B为二塔拉分布的沙丘,C为三塔拉的巨型风蚀坑;D为卫星监测的沙尘暴(2021年1月10日);E和F为风沙入库现状(2020年8月)。库区东南侧(木格滩)分布有连片的沙丘,沙丘发育更成熟,而库区西北侧(塔拉滩)沙丘呈现不连续分布,发育程度轻,沙丘高度低)
Fig.1. Landscape and sand transport corridors around Longyangxia Reservoir (A: The sand transport corridors of major sand areas, and Ⅰ—Ⅹ represent the different sandy land areas. Figure B and C represent the sand source in different area, figure B shows the dune in ErTala, figure C represents the mega-blowout in SanTala; Figure D represents the sand storm monitored by satellite; Figure E and F are the current situation of sand transported into the reservoir. In the southeast side of the reservoir area (Mugetan sandy-land), continuous dunes are distributed, which are more mature, while in the northwest side of the reservoir area (Talatan sandy-land), dunes are scattered, lightly developed and with low dune height)