


0 引言
土壤线虫是土壤生态系统中重要的生物类群[1-2],在食物网中占重要地位,存在于食物网各营养级和能量通道,并在促进能量流动和物质循环、维持土壤生态系统的稳定性等方面发挥着关键作用[3-4]。土壤线虫群落具有营养特异性,且对生境干扰非常敏感,是评价土壤食物网质量和土壤生物学功能的有效工具,也是理想的环境指示生物[5-6]。在腾格里沙漠和科尔沁沙地的相关研究表明,植被恢复过程显著影响土壤线虫群落数量和线虫营养类群丰度[7-8]。Kitagami等[9]发现土壤pH值是影响线虫群落结构的关键因子。植被多样性较高的生物群落中土壤线虫群落发育更好,结构更复杂[6,10]。研究土壤线虫有助于揭示土壤生态系统的结构和功能,因此,土壤线虫群落变化对评价植被-土壤系统恢复过程具有重要意义。
梭梭(Haloxylon ammodendron)是C4荒漠灌木,对干旱、风沙、盐碱和养分贫瘠环境的适应性较强,具有育苗、栽植易成活和生长迅速等特征,是中国西北干旱地区固沙造林的主要树种[11-13]。半个多世纪以来,在西北干旱区开展荒漠化防治和生态建设,大面积种植梭梭于沙化土地和流动沙丘上,区域生态结构得到明显改善[13-15]。随着梭梭种植面积的增加,其生态效益及人工固沙生态系统的稳定性受到越来越多的关注。过去对梭梭的光合生理和水分利用特性以及灌木生长发育过程中土壤理化性质和微生物的变化进行了大量研究[14-18],揭示了梭梭林生态系统的土壤演变过程。土壤养分和微生物分布会影响土壤线虫群落的繁殖发育,因此,梭梭恢复会引起土壤线虫群落变化。然而,针对固沙梭梭恢复过程中土壤线虫群落演替研究较少。基于此,本文以河西走廊中段临泽荒漠绿洲过渡带不同种植年限梭梭林为研究对象,探究梭梭固沙年限和土壤环境对土壤线虫结构的影响,旨在了解流动沙地建立人工植被后土壤线虫群落的演变规律,为揭示荒漠土壤食物网结构对植被恢复的响应机制提供理论依据。
1 材料与方法
1.1 研究区概况
研究区位于河西走廊中部临泽县平川绿洲边缘(39°09′—39°19′N、100°02′—100°21′E,海拔1 375~1 393 m)。年平均气温约7.6 ℃,年蒸发量2 390 mm,年降水量110 mm,集中在7—9月。盛行风向为西北,年均风速约3.2 m·s-1,风沙活动集中在3—5月,大风日数(>17 m·s-1)超过15 d,地下水埋深3~8 m[15]。绿洲边缘主要的天然灌木为泡泡刺(Nitraria tangutorum)和沙拐枣(Calligonum mongolicum),泡泡刺主要分布于丘间低地,沙拐枣分布于平缓沙丘。一年生草本植物包括碱蓬(Suaeda przewalskii)、雾冰藜(Bassia dasyphylla)、白茎盐生草(Halogeton arachnoideus)和沙蓬(Agriophyllum squarrosum)等,天然植被盖度在3%~15%。该地区在20世纪70年代中期开始种植以梭梭为主的固沙灌木,2000年以来,实施了以固沙造林为重点的生态修复和建设项目,在绿洲边缘形成了不同时间序列的梭梭人工林景观[11]。
1.2 调查取样
前人研究表明,流动沙丘的土壤质地(砂、粉砂、黏粒含量)和有机质随时间变化无显著差异,表明在种植前土壤特征相似[14]。2020年9月,选择流动沙地(对照,0 a)及不同建植年限(3、6、11、19、28 a和46 a)的梭梭林样地(图1),共7个处理。每个处理建立3个重复样方(20 m×20 m),共21个样方,样方间距>100 m。对照样地的每个样方中随机布设10个点,采集10个土样(0~10 cm),将10个样混合为一个复合样。不同建植年限梭梭林样地的每个样方中选择长势相近的5棵梭梭,对其生长状况基茎、株高、冠幅、枯枝率进行调查取样。土壤取样方法:在每棵梭梭冠层下和冠层外分别随机布设2个点,冠层下和冠层外分别布设10(5×2)个点,去除表层凋落物,采集10个(0~10 cm)土样,将10个土样混合为一个复合样。土壤样本采集后,将每个混合样分两组,一组风干,过2 mm筛分析土壤pH、电导率(EC)和土壤粒度,过<0.05 mm筛分析土壤有机碳(SOC)、总氮(TN)和总磷(TP)等。另一组在4 ℃冰箱中保存,用于提取线虫。
图1
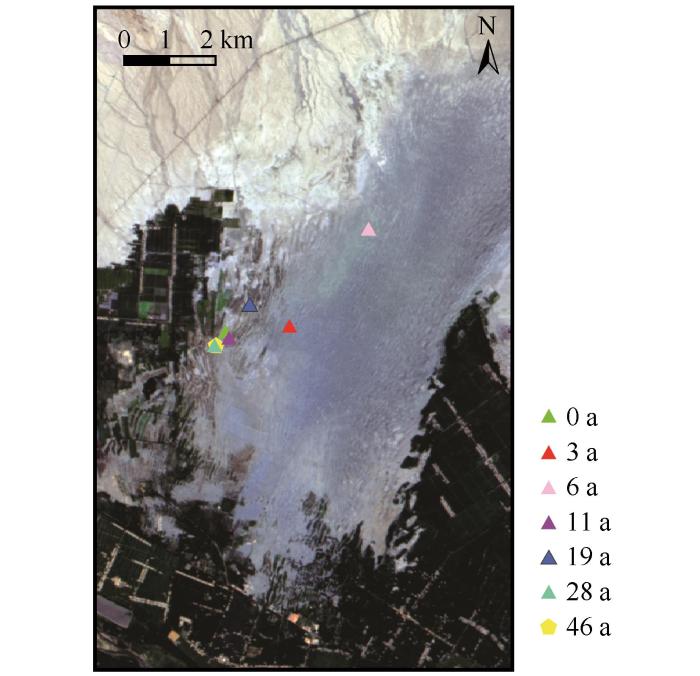
图1
临泽县荒漠-绿洲过渡带采样点分布
Fig.1
Distribution of sampling sites in a desert-oasis ecotone of Linze county
1.3 土壤理化性质分析
1.4 土壤线虫群落分析
1.4.1 线虫分离和鉴定
1.4.2 线虫生态指数
线虫生态指数计算方法如下[21]:
丰富度指数(Species richness index,SR)
香农-威纳多样性指数(Shannon-Wiener index,H')
均匀度指数(Evenness index,J)
优势度指数(Simpson dominance index,
总成熟度指数(Maturity index,MMI)
线虫通路指数(Nematode channel ratio,NCR)
式中:S为鉴定分类单元的数目;N为线虫总数;Pi 为第i个分类单元中个体所占比例;v(i)是自由生活线虫属i的cp值;f (i)是自由生活线虫属在线虫种群中所占比重;上标“cp1-5”表示参与计算的cp1-5功能团中的线虫;B和F分别表示线虫总数中BF和FF的相对丰度。
富集指数(Enrichment index,EI)
结构指数(Structure index,SI)
式中:e为食物网富集成分,指食真菌线虫c-p值为2和食细菌线虫c-p值为1的类群;b为食物网基础成分,指食细菌线虫和食真菌线虫c-p值为2的类群;s为食物网结构成分,指食细菌线虫、食真菌线虫和杂食线虫c-p值为3~5的类群及捕食线虫c-p值为2~5的类群。
1.4.3 线虫群落区系分析
结构指数SI用来指示干扰或恢复过程土壤食物网结构变化,富集指数EI评价土壤食物网养分富集状况,以及对外界干扰的响应和恢复状况。线虫群落区系分析根据线虫群落EI和SI绘制散点图,不同样地线虫群落EI和SI所处象限可以指示土壤养分富集状况、环境受到的扰动及食物网结构稳定性,综合反映土壤生态系统的恢复状况[22]。
1.5 数据分析
为保证数据的正态性,将线虫总数和营养类群丰度进行lg(X+1)变换。采用双因素方差分析(Two-way ANOVA)比较不同固沙年限和采样位置间土壤化学性质、线虫营养类群和生态指数的显著性差异(P<0.05),统计分析使用SPSS 25.0软件。采用CANOCO 4.5进行冗余分析(RDA)来检测土壤化学性质对线虫属的影响,采用蒙特卡罗排列(499个排列)检验多元分析的显著性(P<0.05)。作图使用Origin 2019软件。
2 结果
2.1 不同固沙年限梭梭林地土壤化学性状
梭梭固沙年限和取样位置显著影响土壤化学性质(P<0.05,表1)。土壤EC、TC、TN、TP、SOC、C/N、AP和AK含量均随梭梭固沙年限增加显著积累,梭梭冠层下土壤pH、EC、SOC、AP和AK显著高于冠层外,而梭梭冠层下土壤AN显著低于冠层外。与无植被沙丘(0 a)相比,梭梭生长46 a后其冠层下土壤EC、TC、TN、TP、SOC、C/N、AN、AP和AK含量分别增加了6.6、0.9、0.9、0.5、6.9、3.1、0.2、9.1、4.3倍。梭梭固沙林19 a时其冠层下pH显著高于0 a和28 a。
表1 不同固沙年限土壤化学性质
Table 1
| 种植 年限/a | pH | 电导率EC/(μS·cm-1) | 全碳TC/(g·kg-1) | 全氮TN/(g·kg-1) | 全磷TP/(g·kg-1) | |||||||||
|---|---|---|---|---|---|---|---|---|---|---|---|---|---|---|
| 冠层下 | 冠层外 | 冠层下 | 冠层外 | 冠层下 | 冠层外 | 冠层下 | 冠层外 | 冠层下 | 冠层外 | |||||
| 0 | 9.28±0.16Ac | 9.28±0.16Aa | 130.27±3.93Ae | 130.27±3.93Ac | 4.98±0.11Ad | 4.98±0.11Ac | 0.28±0.04Ac | 0.28±0.04Ac | 0.46±0.02Ad | 0.46±0.02Ac | ||||
| 3 | 10.05±0.13Aab | 9.41±0.08Ba | 306.00±10.39Ade | 130.00±5.20Bc | 5.32±0.03Ad | 5.13±0.20Abc | 0.22±0.00Ad | 0.19±0.01Ad | 0.49±0.01Acd | 0.47±0.01Ac | ||||
| 6 | 10.08±0.02Aab | 9.59±0.25Ba | 438.00±91.39Acd | 202.27±68.49Bbc | 6.96±0.53Ac | 6.28±0.19Ab | 0.30±0.01Ac | 0.21±0.02Ad | 0.56±0.02Acd | 0.53±0.04Abc | ||||
| 11 | 10.03±0.05Aab | 9.61±0.21Ba | 522.00±100.64Ac | 231.00±51.10Bab | 7.40±0.16Abc | 6.32±0.50Ab | 0.38±0.03Ab | 0.28±0.02Ac | 0.57±0.00Ac | 0.54±0.03Abc | ||||
| 19 | 10.09±0.01Aa | 9.57±0.37Ba | 713.67±96.26Abc | 253.10±15.53Bab | 8.43±0.88Aab | 7.63±0.92Aa | 0.38±0.01Ab | 0.33±0.00Abc | 0.68±0.07Aab | 0.65±0.08Aa | ||||
| 28 | 9.87±0.20Ab | 9.59±0.23Ba | 721.00±71.34Ab | 287.63±104.60Bab | 8.72±1.65Aa | 7.87±1.34Aa | 0.52±0.01Aa | 0.39±0.07Aa | 0.67±0.08Aabc | 0.64±0.08Aa | ||||
| 46 | 9.98±0.12Aab | 9.47±0.15Ba | 987.00±227.66Aa | 321.67±45.01Ba | 9.64±0.23Aa | 8.29±0.78Aa | 0.52±0.03Aa | 0.38±0.02Aab | 0.70±0.10Aa | 0.63±0.06Aab | ||||
| 年限 | *** | ns | *** | * | *** | *** | *** | *** | *** | * | ||||
| 位置 | *** | *** | ns | ns | ns | |||||||||
| 年限×位置 | *** | *** | ns | ns | ns | |||||||||
| 种植年限/a | 土壤有机碳SOC/(g·kg-1) | 碳氮比C/N | 速效氮AN/(mg·kg-1) | 速效磷AP/(mg·kg-1) | 速效钾AK/(mg·kg-1) | |||||||||
| 冠层下 | 冠层外 | 冠层下 | 冠层外 | 冠层下 | 冠层外 | 冠层下 | 冠层外 | 冠层下 | 冠层外 | |||||
| 0 | 0.35±0.03Ad | 0.35±0.03Ad | 1.29±0.11Ad | 1.29±0.11Ac | 25.38±2.13Ab | 25.38±2.13Abc | 2.33±0.29Ac | 2.33±0.29Ad | 103.33±5.77Ad | 103.33±5.77Ad | ||||
| 3 | 0.42±0.04Ad | 0.30±0.02Bd | 1.95±0.19Ad | 1.57±0.04Ac | 20.96±0.52Bcd | 21.93±0.16Ac | 2.52±0.50Ac | 2.79±0.18Ad | 120.00±0.00Ad | 96.67±5.77Bd | ||||
| 6 | 1.22±0.09Ac | 0.71±0.13Bcd | 4.02±0.41Ac | 3.39±0.87Ab | 19.63±0.65Bd | 22.81±1.62Ac | 3.40±0.81Ac | 3.56±0.89Acd | 210.00±65.57Ac | 130.00±17.32Bd | ||||
| 11 | 1.63±0.13Ab | 1.14±0.19Bbc | 4.38±0.66Abc | 4.06±0.78Ab | 19.86±1.15Bd | 29.56±1.56Aab | 13.37±0.46Ab | 5.84±2.12Bbc | 353.33±41.63Ab | 156.67±15.28Bcd | ||||
| 19 | 1.89±0.07Ab | 1.31±0.22Bb | 4.91±0.14Aab | 4.04±0.62Ab | 23.04±0.91Bbcd | 30.26±1.21Aab | 13.94±4.70Ab | 6.45±1.52Bb | 380.00±0.00Ab | 200.00±20.00Bc | ||||
| 28 | 2.80±0.54Aa | 1.85±0.62Ba | 5.33±0.92Aa | 4.63±0.72Aab | 24.33±0.73Bbc | 30.84±1.26Aab | 26.85±3.47Aa | 11.92±2.40Ba | 510.00±60.83Aa | 300.00±26.46Bb | ||||
| 46 | 2.76±0.13Aa | 2.03±0.20Ba | 5.28±0.43Aa | 5.37±0.82Aa | 29.39±1.09Ba | 33.76±1.52Aa | 23.45±3.29Aa | 11.11±2.09Ba | 546.67±25.17Aa | 453.33±94.52Ba | ||||
| 年限 | *** | *** | *** | *** | * | * | *** | *** | *** | *** | ||||
| 位置 | *** | ns | ** | *** | *** | |||||||||
| 年限×位置 | *** | ns | ns | * | ns | |||||||||
2.2 不同固沙年限土壤线虫群落组成
梭梭固沙年限和取样位置显著影响线虫总数(P<0.05)。随梭梭固沙年限增加,冠层下线虫总数显著增加,冠层外呈先增大后降低,冠层下线虫总数显著高于冠层外。梭梭固沙年限对BF和OP有显著影响,取样位置对BF和FF有显著影响。随梭梭固沙年限增加,BF数量显著增加,OP数量呈先增加后降低。BF为优势营养类群,占线虫总数的50.3%~94.1%,依次为FF、OP和PP。无植被沙丘和固沙46 a梭梭林地未发现OP和PP(表2)。
表2 不同固沙年限土壤线虫总数及营养类群
Table 2
| 固沙 年限/a | 线虫总数 | 食细菌线虫BF | 食真菌线虫FF | 植物寄生线虫PP | 捕食/杂食线虫OP | |||||
|---|---|---|---|---|---|---|---|---|---|---|
| 冠层下 | 冠层外 | 冠层下 | 冠层外 | 冠层下 | 冠层外 | 冠层下 | 冠层外 | 冠层下 | 冠层外 | |
| 0 | 5.33±1.31Ad | 5.33±1.31Ab | 4.00±0.00Ad | 4.00±0.00Ab | 1.33±0.31Ab | 1.33±0.31Aab | 0.00±0.00Aa | 0.00±0.00Ab | 0.00±0.00Ab | 0.00±0.00Ab |
| 3 | 44.33±10.18Acd | 11.67±3.15Bab | 36.33±11.16Acd | 8.33±3.15Bab | 6.67±0.58Aab | 1.00±0.73Bb | 0.00±0.00Aa | 2.33±0.08Aa | 1.33±0.31Ab | 0.00±0.00Ab |
| 6 | 99.33±22.72Abc | 61.33±11.67Ba | 85.67±24.53Abc | 47.00±9.04Bab | 8.67±1.57Aab | 8.33±1.79Ba | 0.00±0.00Aa | 1.00±0.73Aab | 5.00±1.73Ab | 5.00±1.73Aab |
| 11 | 143.33±45.52Aab | 62.00±12.05Ba | 116.00±23.81Ab | 52.33±13.14Ba | 6.33±0.69Aab | 7.33±1.51Bab | 0.00±0.00Aa | 0.00±0.00Ab | 20.00±6.00Aa | 2.33±1.04Ab |
| 19 | 148.67±43.94Aab | 61.67±12.53Ba | 123.00±28.58Ab | 49.00±12.26Bab | 8.67±1.77Aab | 1.33±0.31Bab | 1.67±0.89Aa | 1.00±0.73Aab | 15.33±5.15Aa | 10.33±2.45Aa |
| 28 | 136.33±40.34Ab | 60.00±11.68Ba | 129.00±43.38Ab | 54.33±18.46Ba | 6.00±1.29Aab | 3.33±0.77Bab | 1.33±0.31Aa | 0.00±0.00Ab | 0.00±0.00Ab | 2.33±1.04Ab |
| 46 | 228.00±61.46Aa | 41.00±16.64Bab | 213.33±54.80Aa | 38.67±10.34Bab | 13.67±2.51Aa | 2.33±0.08Bab | 0.00±0.00Aa | 0.00±0.00Ab | 1.00±0.73Ab | 0.00±0.00Ab |
| 年限 | ** | * | ** | * | ns | ns | ns | ns | * | * |
| 位置 | *** | *** | * | ns | ns | |||||
| 年限× 位置 | * | ** | ns | ns | ns | |||||
本研究共鉴定15个属,其中BF属6个,FF、PP和OP各3个属。无植被沙丘3个属,其他固沙年限梭梭林中线虫属8~11个(表3)。Eucephalobus和Acrobeloides在各固沙年限中均为优势属。Paraphelenchus在无植被沙丘、固沙3 a和11 a为优势属;Tylolaimophorus和Psilenchus分别仅在固沙6 a和3 a的冠层外为优势属;Aporcelaimium在固沙11 a冠层下和固沙19 a冠层外为优势属。Eumonhystera,Ceratoplectus,Filenchus,Rotylenchus和Discolaimus分别只出现在固沙6、46、3、19 a和6 a梭梭林。线虫群落主要以cp-2类群为代表。
表3 不同固沙年限土壤线虫属的营养类型、c-p值和优势度
Table 3
| 线虫属 | 营养类型 | c-p值 | 线虫属的优势度 | |||||||||||||
|---|---|---|---|---|---|---|---|---|---|---|---|---|---|---|---|---|
| 0 a | 3 a | 6 a | 11 a | 19 a | 28 a | 46 a | ||||||||||
| 冠层下 | 冠层外 | 冠层下 | 冠层外 | 冠层 下 | 冠层外 | 冠层下 | 冠层外 | 冠层下 | 冠层外 | 冠层下 | 冠层外 | 冠层下 | 冠层外 | |||
| Mesorhabditis | BF | 1 | — | — | ++ | — | ++ | ++ | ++ | ++ | ++ | ++ | — | ++ | ++ | — |
| Eucephalobus | BF | 2 | +++ | +++ | +++ | ++ | +++ | +++ | +++ | ++ | +++ | +++ | +++ | +++ | +++ | +++ |
| Acrobeles | BF | 2 | — | — | ++ | +++ | +++ | +++ | ++ | +++ | ++ | ++ | +++ | ++ | ++ | ++ |
| Acrobeloides | BF | 2 | +++ | +++ | +++ | +++ | +++ | +++ | +++ | +++ | +++ | +++ | +++ | +++ | +++ | +++ |
| Eumonhystera | BF | 2 | — | — | — | — | — | ++ | — | — | — | — | — | — | — | — |
| Ceratoplectus | BF | 2 | — | — | — | — | — | — | — | — | — | — | — | — | ++ | — |
| Paraphelenchus | FF | 2 | +++ | +++ | ++ | +++ | ++ | ++ | ++ | +++ | ++ | — | ++ | ++ | ++ | ++ |
| Aphelenchoides | FF | 2 | — | — | — | — | ++ | — | — | — | ++ | — | — | — | — | — |
| Tylolaimophorus | FF | 3 | — | — | ++ | — | ++ | +++ | ++ | ++ | ++ | ++ | ++ | — | + | ++ |
| Filenchus | PP | 2 | — | — | — | +++ | — | — | — | — | — | — | — | — | — | — |
| Psilenchus | PP | 2 | — | — | — | +++ | — | ++ | — | — | ++ | — | + | — | — | — |
| Rotylenchus | PP | 3 | — | — | — | — | — | — | — | — | ++ | ++ | — | — | — | — |
| Prodorylaimium | OP | 5 | — | — | — | — | — | — | + | — | ++ | ++ | — | — | — | — |
| Aporcelaimium | OP | 5 | — | — | ++ | — | ++ | ++ | +++ | ++ | ++ | +++ | — | ++ | + | — |
| Discolaimus | OP | 5 | — | — | — | — | ++ | — | — | — | — | — | — | — | — | — |
2.3 不同固沙年限土壤线虫生态指数及区系分析
梭梭固沙年限显著影响线虫生态指数(P<0.05),
表明土壤食物网功能和结构发生显著变化。SR、H'、J、λ和MMI值在不同固沙年限间差异显著,随固沙年限增加,SR、H'和J值呈先增加后降低,λ值呈先下降后增加。H'值在固沙6 a和19 a较高,λ值在固沙19 a最低,MMI值在固沙6 a和19 a冠层外显著高于其他年限,19 a时出现最大值。NCR值在不同固沙年限间无显著差异,其随固沙年限增加而增加。取样位置仅对J值有显著影响,其冠层内显著低于冠层外(表4)。线虫区系分析显示,不同固沙年限梭梭林地土壤线虫区系均位于D象限,表明土壤养分贫瘠,线虫群落受到干扰和胁迫,土壤食物网退化。不同固沙年限梭梭林地中EI无显著差异,SI差异显著,SI在固沙19 a梭梭林中最高,取样位置显著影响SI,其冠层下显著高于冠层外(图2)。
表4 不同固沙年限线虫生态指数
Table 4
| 固沙 年限/a | 丰富度指数 | 香农-维纳多样性指数 | 均匀度指数 | 优势度指数 | 总成熟度指数 | 线虫通路指数 | ||||||
|---|---|---|---|---|---|---|---|---|---|---|---|---|
| 冠层下 | 冠层外 | 冠层下 | 冠层外 | 冠层下 | 冠层外 | 冠层下 | 冠层外 | 冠层下 | 冠层外 | 冠层下 | 冠层外 | |
| 0 | 0.40±0.06e | 0.40±0.06c | 0.23±0.40Ab | 0.23±0.40Ac | 0.33±0.07Ab | 0.33±0.07Ab | 0.83±0.29Aa | 0.83±0.29Aa | 2.00±0.00Aa | 2.00±0.00Ab | 0.83±0.29Aa | 0.83±0.29Aa |
| 3 | 1.33±0.18bc | 1.19±0.32ab | 1.11±0.33Aa | 0.75±0.10Ab | 0.84±0.10Ba | 0.93±0.12Aa | 0.40±0.11Ab | 0.50±0.00Ab | 2.13±0.13Aa | 2.00±0.00Ab | 0.82±0.07Aa | 0.67±0.58Aa |
| 6 | 2.04±0.19a | 1.65±0.42a | 1.38±0.16Aa | 1.59±0.08Aa | 0.76±0.01Ba | 0.88±0.08Aa | 0.33±0.04Ab | 0.40±0.07Abc | 2.15±0.09Aa | 2.39±0.24Aa | 0.89±0.10Aa | 0.74±0.30Aa |
| 11 | 1.38±0.23bc | 1.30±0.36ab | 1.17±0.18Aa | 0.96±0.38Ab | 0.70±0.08Bab | 0.81±0.08Aa | 0.48±0.15Ab | 0.38±0.14Abc | 2.33±0.60Aa | 2.04±0.14Ab | 0.96±0.04Aa | 0.86±0.17Aa |
| 19 | 1.42±0.02b | 1.31±0.25ab | 1.30±0.09Aa | 1.22±0.34Aab | 0.72±0.03Bab | 0.77±0.05Aa | 0.32±0.06Ab | 0.24±0.02Ac | 2.42±0.09Aa | 2.45±0.13Aa | 0.94±0.05Aa | 0.98±0.03Aa |
| 28 | 0.96±0.26cd | 0.95±0.33abc | 1.12±0.11Aa | 0.95±0.39Ab | 0.77±0.09Ba | 0.78±0.15Aa | 0.40±0.07Ab | 0.48±0.18Abc | 2.01±0.02Aa | 2.06±0.10Ab | 0.94±0.06Aa | 0.92±0.14Aa |
| 46 | 0.87±0.10d | 0.86±0.24bc | 1.07±0.07Aa | 0.81±0.23Ab | 0.64±0.03Bab | 0.78±0.15Aa | 0.45±0.03Ab | 0.53±0.12Ab | 2.00±0.05Aa | 2.02±0.04Ab | 0.94±0.01Aa | 0.92±0.09Aa |
| 年限 | *** | ns | * | * | * | * | * | * | ns | ** | ns | ns |
| 位置 | ns | ns | ** | ns | ns | ns | ||||||
| 年限× 位置 | ns | ns | ns | ns | ns | ns | ||||||
图2
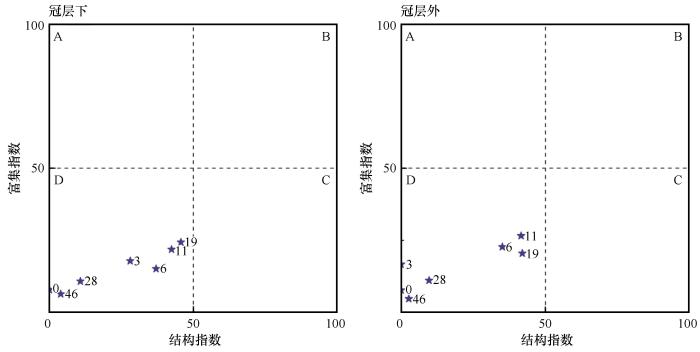
图2
不同固沙年限土壤线虫群落区系
Fig.2
Nematode flora of soil in different sand-fixation years
2.4 土壤线虫群落和环境因子的关系
冠层外土壤化学性质对线虫属分布无显著影响(P>0.05),因此只分析冠层下结果。RDA结果表明,使用蒙特卡罗检验模型和排序轴均达到显著水平(P<0.05,表5)。第一轴和第二轴特征值分别为0.4279和0.0327(第一轴:F=26.2,P=0.002;所有轴:F=5.4,P=0.002),线虫属和环境因子相关系数分别为0.933和0.426,累计解释了线虫属分布的46.06%。土壤线虫属与环境因子排序图显示,Eumonhystera、Rotylenchus和Filenchus与EC、C/N、SOC、TP、pH和TN呈负相关;Ceratoplectus与TN呈正相关;Paraphelenchus和Eucephalobus与EC和SOC呈正相关;Acrobeles、Acrobeloides和Discolaimus与pH、TP和C/N呈正相关;Prodorylaimium和Aporcelaimium与TN呈负相关(图3)。所选环境因子对线虫属总变异解释率为47.80%,EC的解释率为32.7%,其次是C/N(6.0%)、SOC(4.0%)、TP(2.9%)、pH(1.2%)和TN(1.0%,图4)。EC、C/N和SOC对线虫属有显著影响,TP、pH和TN无显著影响。
表5 线虫属与环境因子的RDA排序综述
Table 5
| RDA轴 | 1 | 2 | 3 | 4 |
|---|---|---|---|---|
| 蒙特卡罗排列检验 | R2=0.476 F=26.2 P=0.002*** | |||
| 特征值 | 0.4279 | 0.0327 | 0.0106 | 0.005 |
| 累积解释变异/% | 42.79 | 46.06 | 47.12 | 47.61 |
| 线虫属相关性 | 0.9333 | 0.4264 | 0.3507 | 0.3215 |
| 累计解释拟合变异/% | 89.3 | 96.12 | 98.33 | 99.36 |
图3
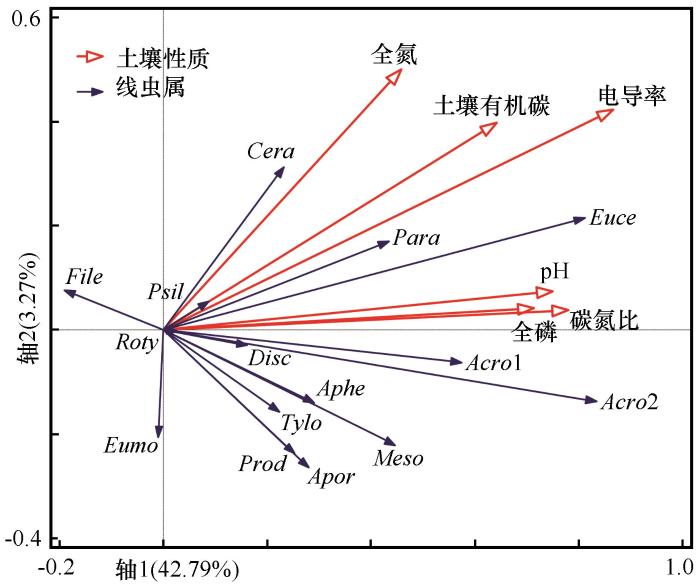
图3
土壤线虫属与环境因子的冗余分析
Fig.3
Redundancy analysis diagram of the relationships between soil nematode genera and environmental factors
图4
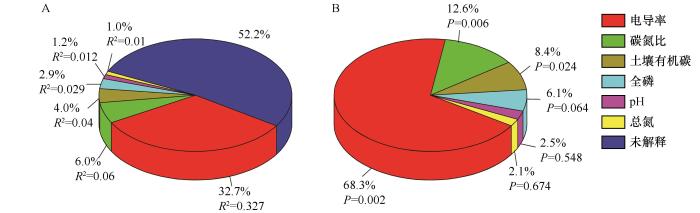
图4
环境因子解释的总变异比例(A)和总解释变异(B)
Fig.4
Proportions of total variation (A) and total explained variation (B) explained by individual environmental factors
3 讨论
3.1 梭梭固沙年限对土壤线虫群落组成和多样性影响
随梭梭固沙年限增加,BF显著增加,FF无显著变化,由于土壤盐分积累抑制了微生物活性,真菌比细菌对盐碱更敏感,高盐分可能产生不利于真菌生长的底物[27-28]。BF通过有机物分解在土壤养分矿化和循环中发挥关键作用[3-4]。本研究发现BF是优势营养类群,说明线虫主要食物来源是微生物生物量,能量通道以细菌为主,由于BF以细菌为营养来源,细菌在中碱性土壤中占优势[29],土壤有机质的输入促进细菌生物量生长[30],该结果证实了Guan等[8]的研究。PP以植物为食物来源,植物直接影响PP数量,预计随植物生物量增加PP会显著增加,然而仅在梭梭固沙3 a和19 a冠层外发现PP,可能是由于梭梭根系分泌物抑制了PP生长[31]。OP对环境干扰表现出更高的敏感性,因为OP是k策略者,拥有比其他营养类群高的cp值[22]。在无植被沙丘和固沙46 a梭梭林未发现OP,可能是由于无植被沙丘风蚀严重和固沙46 a梭梭林发生退化造成环境扰动所致,固沙19 a时OP丰度最高,说明梭梭固沙19 a植被-土壤系统较其他年限稳定。
固沙梭梭林的建立和生长发育过程中,线虫群落生态指数显著变化,表明固沙梭梭的生长通过提供适宜的微生境和丰富的能量通道来增加线虫多样性[6,8],线虫的多样性较高可能与更少的外界干扰和稳定的地表有关。线虫群落对土壤环境干扰敏感,MMI可评价土壤干扰程度,固沙19 a时MMI值达到最大,表明梭梭生长19 a植被-土壤生态系统最为稳定。梭梭冠层下和冠层外线虫区系均分布于D象限,表明在荒漠生态系统恢复过程中土壤养分相对贫瘠,土壤线虫群落受到一定干扰和胁迫[22]。随梭梭种植年限增加,结构指数SI和富集指数EI呈先增加后降低趋势,且SI在19 a梭梭林中最高,表明梭梭林建立显著提高了土壤食物网对可利用资源的响应敏感性,随梭梭生长土壤食物资源逐渐增加,食物网结构变复杂,土壤养分富集状况向好,食物网逐渐稳定,19 a梭梭林土壤食物网结构化程度最高,土壤生态系统最为稳定。这是因为土壤食物网的调控方式以自下而上为主,即能量来源碎屑的质量和数量决定了食物网的功能和结构[32],由于在梭梭生长后期出现严重的退化现象,导致所提供的食物来源较少,致使固沙19 a后的梭梭林土壤食物网受到胁迫。
3.2 土壤线虫群落对土壤因子的响应
图5
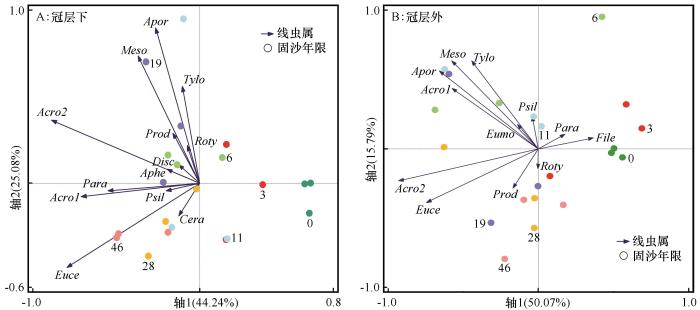
图5
不同固沙年限线虫属分布
Fig.5
Distribution of nematode genera in different sand-fixation years
随梭梭固沙年限增加,植物凋落物和细粒物质的输入显著增加了土壤养分,梭梭冠层下逐渐形成“肥岛”和“盐岛”效应[14,35],这种聚集效应作用于土壤线虫,影响线虫属分布。本研究表明梭梭恢复过程中土壤EC、C/N和SOC作为主要的非生物因子显著增加,对解释线虫属分布具有显著贡献。而Guan等[8]在科尔沁沙地发现柠条(Caragana microphylla)恢复过程中SOC和TN是影响线虫群落的主要因子。Kitagami等[9]发现土壤pH是影响线虫群落结构的关键非生物因子,通过改变土壤微生物量间接影响线虫的生态功能。梭梭是稀盐盐生植物,对土壤盐分有明显的聚集作用[11,23],进而对线虫属的分布产生较大贡献(68.3%)。线虫群落对土壤环境变化的响应具有属依赖,本研究表明食细菌线虫Eumonhystera、植食性线虫Rotylenchus和Filenchus适宜生存于低盐度的环境,Ceratoplectus偏爱高氮的环境,Paraphelenchus和Eucephalobus适于生存在高盐分和高有机碳的环境。这说明线虫随土壤环境变化迁移到其熟悉的栖息地,不同线虫属对生境表现出不同的偏爱[5]。土壤环境通过对真菌、细菌和根系产生的有机物等可利用食物来源的影响来间接影响线虫属分布[33]。梭梭固沙年限和土壤环境是影响该荒漠生态系统中线虫群落结构的重要驱动力。
4 结论
梭梭固沙年限对土壤线虫总数、食细菌线虫(BF)、捕食/杂食线虫(OP)丰度和生态指数(SR、H'、J、λ和MMI值)有显著影响。梭梭固沙年限对线虫群落的影响主要是通过植被演替和土壤性质的变化来反映。土壤环境对梭梭冠层下线虫群落分布有显著影响,EC、C/N和SOC是影响线虫群落组成的关键非生物因子。固沙梭梭林的建立显著改变了土壤线虫群落结构,提高了土壤食物网稳定性。土壤线虫群落变化可以反映荒漠绿洲过渡带植被-土壤系统的演变过程。
参考文献
Ecology of plant and free-living nematodes in natural and agricultural soil
[J].
Nematodes as soil indicators: functional and biodiversity aspects
[J].
Effects of experimental nitrogen and/or phosphorus additions on soil nematode communities in a secondary tropical forest
[J].
The abundance,diversity,and metabolic footprint of soil nematodes is highest in high elevation alpine grasslands
[J].
Soil nematode community structure in a Chinese sand dune system
[J].
Nematodes as an indicator of plant-soil interactions associated with desertification
[J].
Soil nematode community succession in stabilized sand dunes in the Tengger Desert,China
[J].
Variation of soil nematode community composition with increasing sand-fixation year of Caragana microphylla:bioindication for desertification restoration
[J].
Effects of microhabitats and soil conditions on structuring patterns of nematode communities in Japanese cedar (Cryptomeria japonica) plantation forests under temperate climate conditions
[J].
The effects of vegetation cover on soil nematode communities in various biotopes disturbed by industrial emissions
[J].
Ecological effects of desertification control and desertified land reclamation in an oasis-desert ecotone in an arid region:a case study in Hexi Corridor, Northwest China
[J].
Genetic variation in seed and seedling traits of six Haloxylon ammodendron shrub provenances in desert areas of China
[J].
Leaf C∶N∶P stoichiometrical and morphological traits of Haloxylon ammodendron over plantation age sequences in an oasis-desert ecotone in North China
[J].
Soil properties and herbaceous characteristics in an age sequence of Haloxylon ammodendron plantations in an oasis-desert ecotone of northwestern China
[J].
Long-term impacts of shrub plantations in a desert-oasis ecotone: accumulation of soil nutrients, salinity and development of herbaceour layer
[J].
Soil water utilization characteristics of Haloxylon ammodendron plantation with different age during summer
[J].
不同水分条件下梭梭和多花柽柳苗期光合特性及抗旱性比较
[J].
Relationship between presence of the desert shrub Haloxylon ammodendron and microbial communities in two soils with contrasting textures
[J].
Feeding habits in soil nematode families and genera-an outline for soil ecologists
[J].
The use of nematodes in ecological soil classification and assessment concepts
[J].
A framework for soil food web diagnostics: extension of the nematode faunal analysis concept
[J].
Seasonal and spatial variation in nematode communities in a Negev Desert Ecosystem
[J].
Nematode communities in the artificially vegetated belt with or without irrigation in the Tengger Desert, China
[J].
Nitrogen addition regulates soil nematode community composition through ammonium suppression
[J].
Microbial biomass and activity in salt affected soils under and conditions
[J].
Soil fertility,salinity and nematode diversity influenced by Tamarix ramosissima in different habitats in an arid desert oasis
[J].
Contrasting soil pH effects on fungal and bacterial growth suggest functional redundancy in carbon mineralization
[J].
Plant species effects on soil nematode communities in experimental grasslands
[J].
Resource quality in a soil food web
[J].
Plant species identity and diversity effects on different trophic levels of nematodes in the soil food web
[J].

 甘公网安备 62010202000688号