戈壁沙漠沙尘向青藏高原传输路径和传输机制:以2020年4月一次沙尘事件为例
Transport of dust from Gobi Desert to the Tibetan Plateau and its dynamic mechanism: a case study of a dust event in April of 2020
戈壁沙漠沙尘向青藏高原传输路径和传输机制:以2020年4月一次沙尘事件为例 |
| 陈俊言, 贯雅雯, 张越, 陈渔, 毕鸿儒, 娄高僮, 郭馨阳, 王洋, 陈思宇 |
|
Transport of dust from Gobi Desert to the Tibetan Plateau and its dynamic mechanism: a case study of a dust event in April of 2020 |
| Junyan Chen, Yawen Guan, Yue Zhang, Yu Chen, Hongru Bi, Gaotong Lou, Xinyang Guo, Yang Wang, Siyu Chen |
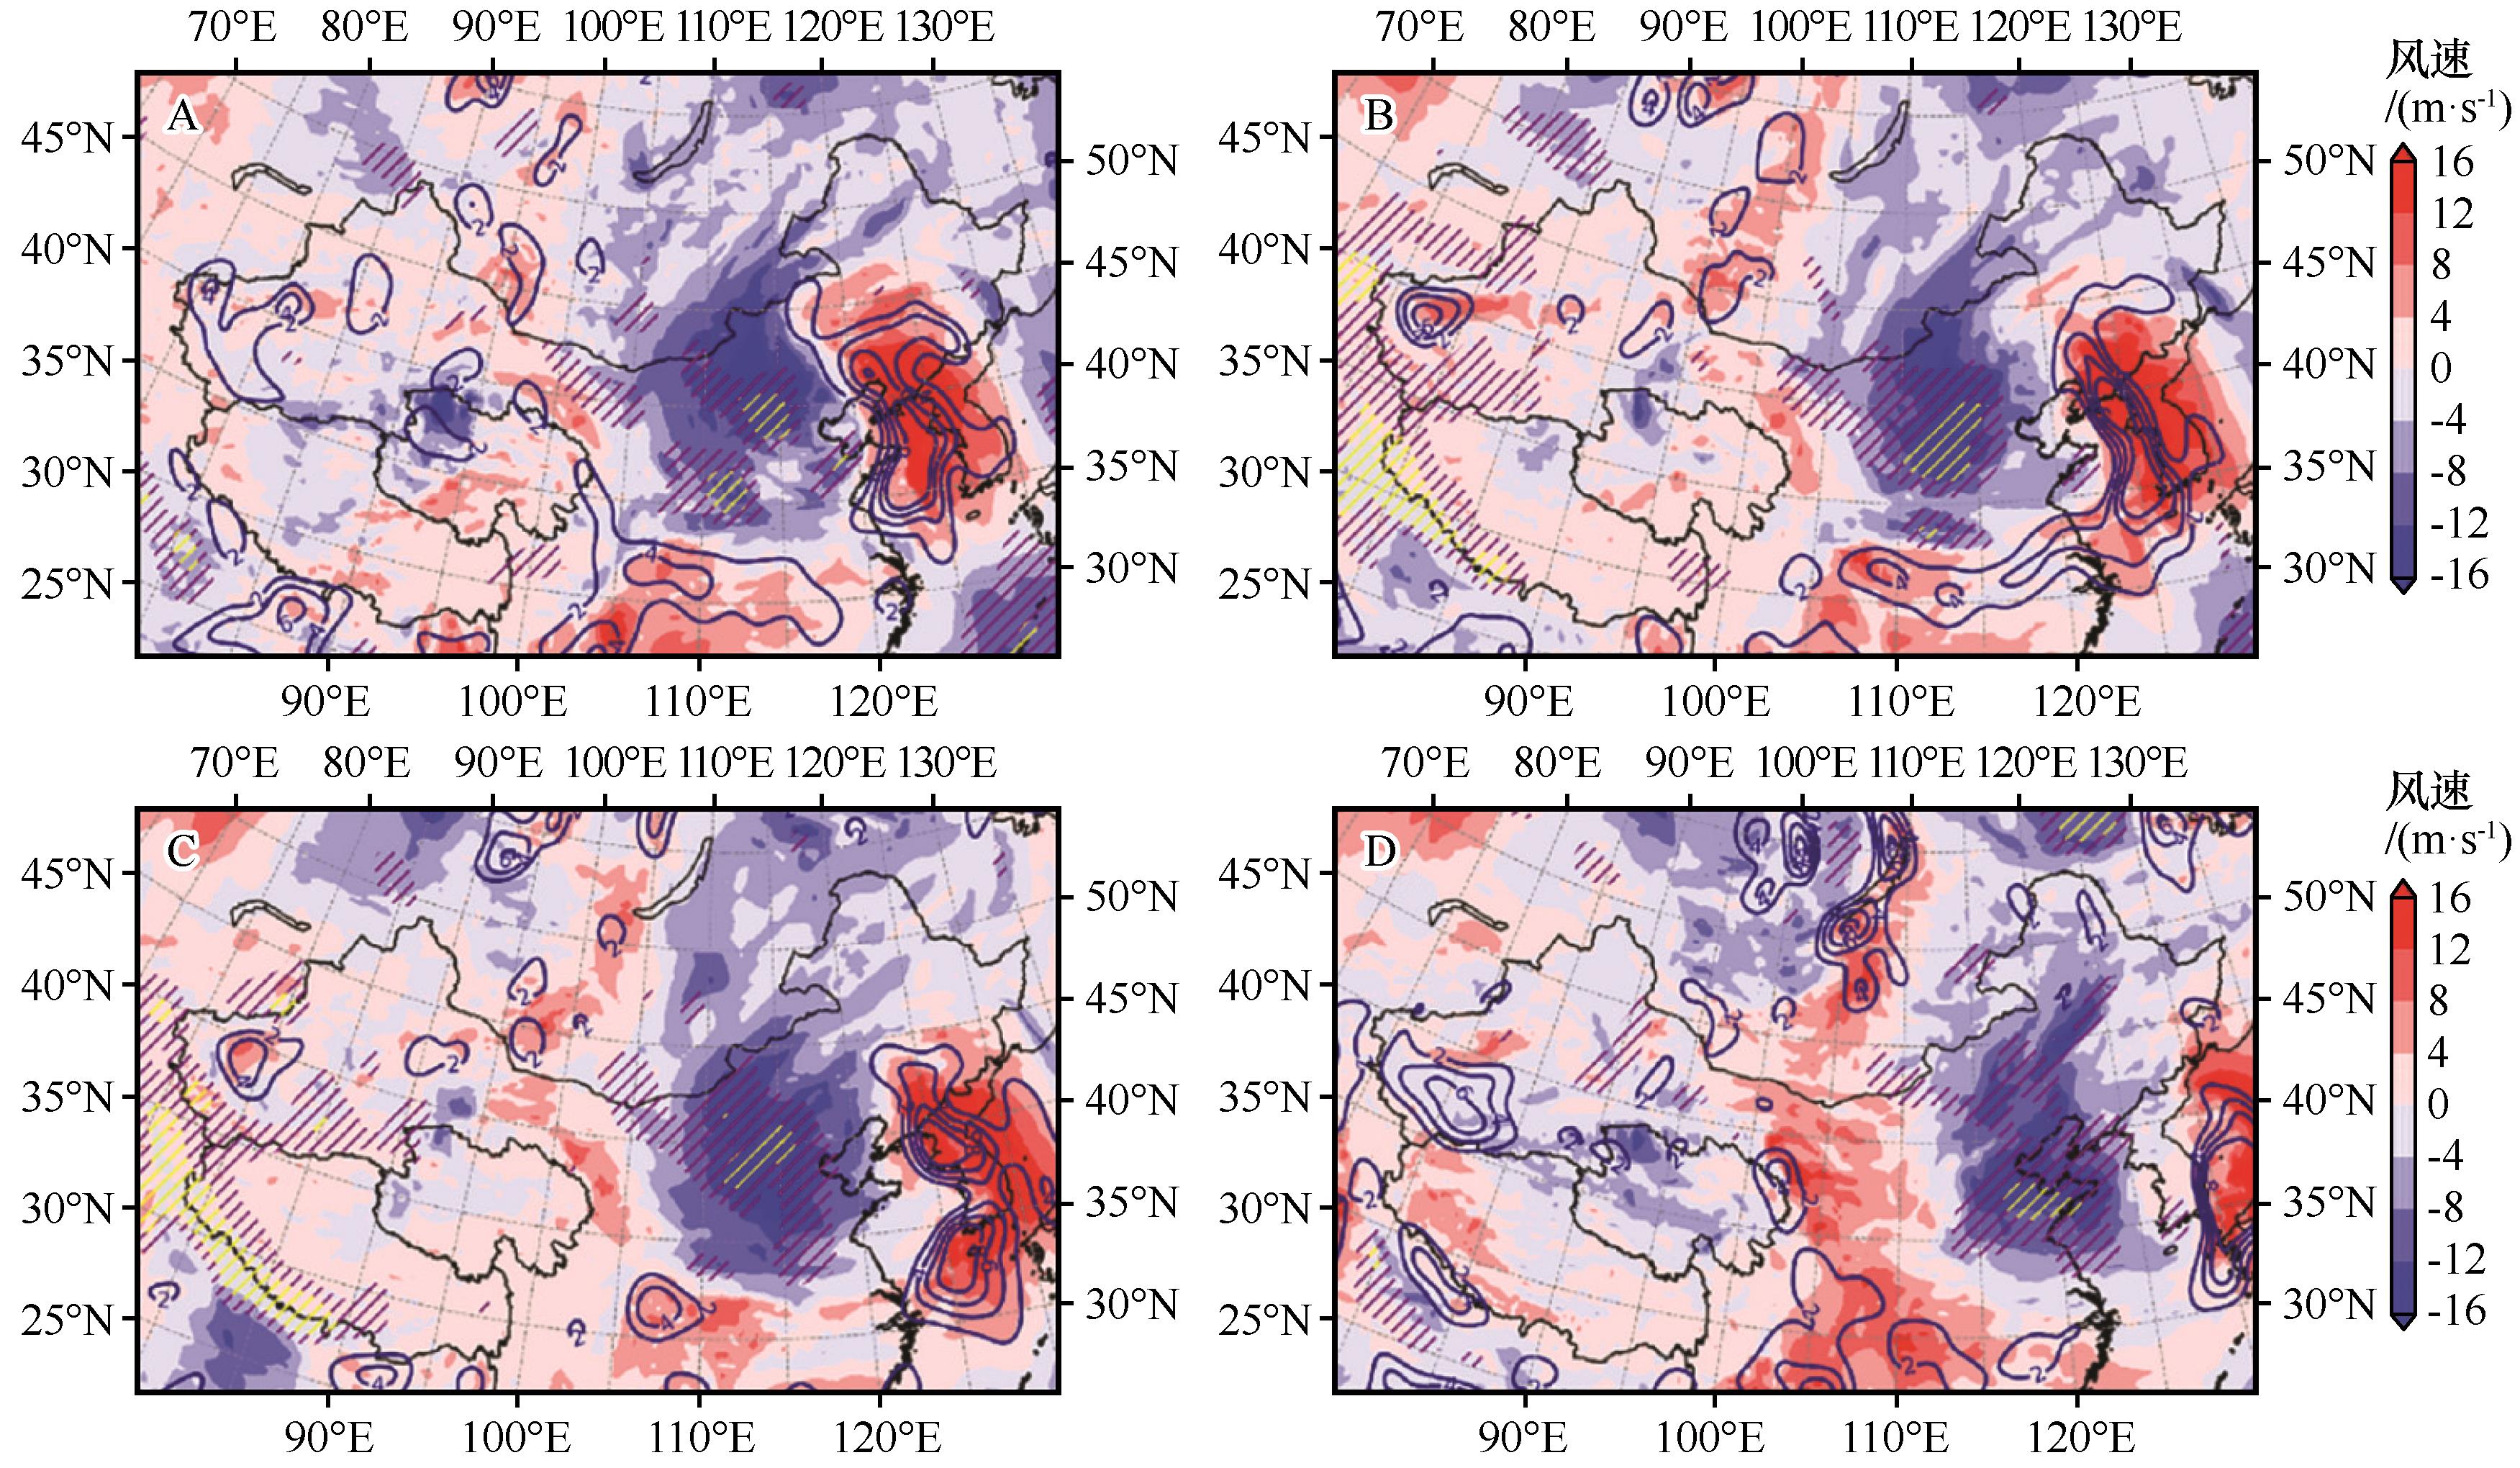
| 图9 4月16日12:00(A)、18:00(B)和17日00:00(C)、06:00(D)经向风速场(蓝色表示北风,红色表示南风,单位m·s-1,水平分辨率0.25 |
| Fig.9 Meridional wind speed field at 12:00 (A) and 18:00 (B) on April 16th, and at 00:00 (C) and 06:00(D) on April 17th (blue indicates north wind, red indicates south wind, unit m·s-1, horizontal resolution 0.25 |
|
|