基于多源观测数据的强沙尘天气过程诊断
Diagnosis of severe dust weather process based on multi-source observational data
基于多源观测数据的强沙尘天气过程诊断 |
| 王悦, 衣娜娜, 姜学恭, 宁贵财, 苏练, 夏海云 |
|
Diagnosis of severe dust weather process based on multi-source observational data |
| Yue Wang, Nana Yi, Xuegong Jiang, Guicai Ning, Lian Su, Haiyun Xia |
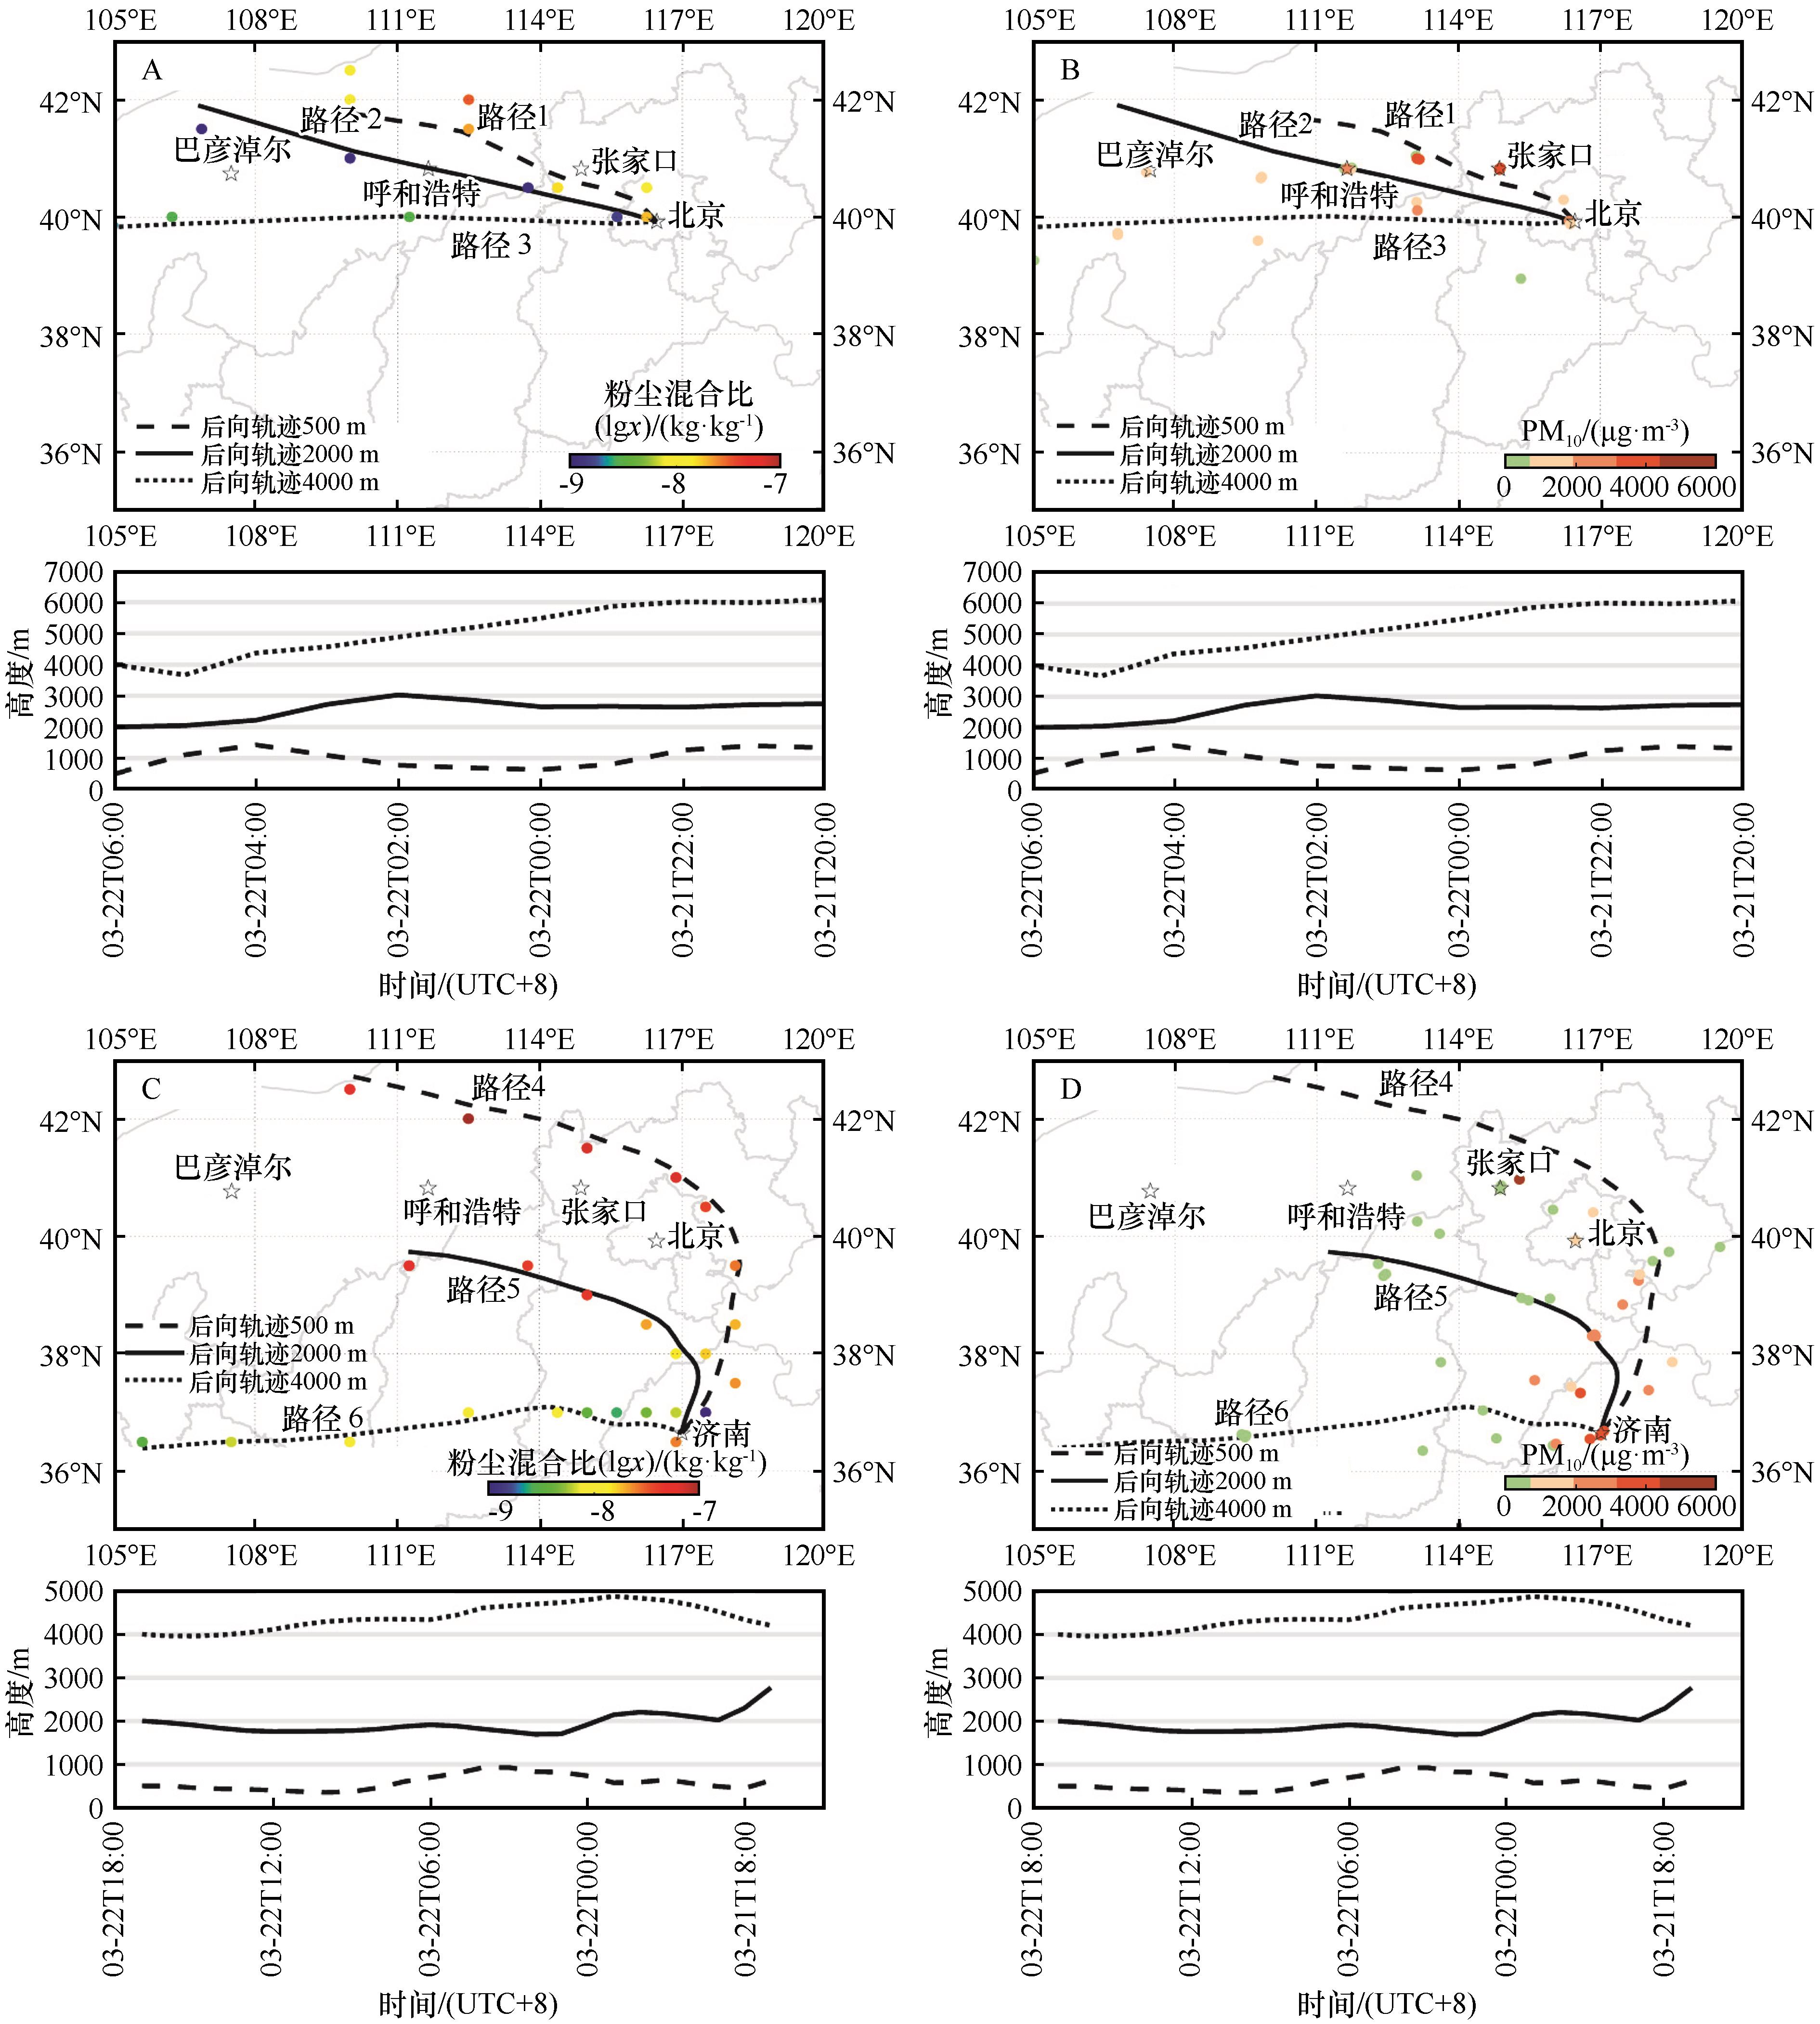
| 图9 沙尘天气后向轨迹。A,C图中轨迹上MERRA2 Dust Mixing Ratio浓度分布;B,D轨迹上地面PM10的浓度分布。虚线为500 m气团路径,实线为2 000 m气团路径,点线为4 000 m气团路径 |
| Fig.9 Backward trajectory during dust pollution weather events. (A, C) spatial distribution of MERRA-2 Dust Mixing Ratio; (B, D) spatial distribution of ground PM10 concentration along the route of dust pollution weather event, respectively. The dashed line is the 500 m air mass path, the dashed line is the 2 000 m air mass path, and the dash dot line is the 4 000 m air mass path |
|
|