中国沙漠 ›› 2024, Vol. 44 ›› Issue (2): 172-184.DOI: 10.7522/j.issn.1000-694X.2023.00164
• • 上一篇
丁涵泳1( ), 康汉青1,2(), 吕晶晶1
收稿日期:2023-08-24
修回日期:2023-11-24
出版日期:2024-03-20
发布日期:2024-03-19
通讯作者:
康汉青
作者简介:康汉青(E-mail: 002651@nuist.edu.cn)基金资助:
Hanyong Ding1(), Hanqing Kang1,2(), Jingjing Lv1
Received:2023-08-24
Revised:2023-11-24
Online:2024-03-20
Published:2024-03-19
Contact:
Hanqing Kang
摘要:
针对2021年3月华北两次强沙尘暴过程,研究了10款土壤湿度产品在沙尘源地(戈壁沙漠地区)的空间分布,并选择了其中4款(ERA5、 GLDAS、NCEP/FNL 和 SMAP L3)驱动WRF-CMAQ对两次沙尘暴过程进行模拟。最后结合110个受沙尘影响城市的实际观测结果,对4款产品的模拟效果进行评估,以研究其对两次沙尘过程模拟准确性和实用性的影响。结果表明:(1)仅基于卫星反演的产品,普遍存在缺测区域,且空间分布的异质性较强,4款产品中仅SMAP L3表现较好;“开放环”模型产品和经过卫星数据同化的模型产品在空间分布上均一性较强,质量较高。(2)在沙尘源地,ERA5、ERA5-Land和SMAP L3中的土壤湿度较低,AMSR2-JAXA、GLDAS、GLEAM、NCEP/FNL和SMAP L4中的土壤湿度相对较高。(3)第一次沙尘过程中4款产品对PM10浓度的预测都有一定的低估;第二次沙尘过程中ERA5和SMAP L3高估而NCEP/FNL和GLDAS低估了统计站点的PM10浓度;模拟值的高低与其所基于的沙尘源地土壤湿度均值呈负相关。在两次沙尘暴过程的模拟结果中,SMAP L3和ERA5两款产品表现较好,GLDAS次之,而NCEP/FNL产品造成了对沙尘浓度的明显低估。
中图分类号:
丁涵泳, 康汉青, 吕晶晶. 土壤湿度产品对2021年3月华北强沙尘暴模拟结果的影响[J]. 中国沙漠, 2024, 44(2): 172-184.
Hanyong Ding, Hanqing Kang, Jingjing Lv. Impact of soil moisture products on the simulation results of super sandstorms during March of 2021 in North China[J]. Journal of Desert Research, 2024, 44(2): 172-184.
| 数据产品 | 产品简介 | 分辨率 | 研究变量 | |
|---|---|---|---|---|
| 时间 | 空间 | |||
| 基于卫星反演产品 | ||||
| AMSR2-JAXA | 日本宇宙航空研究开发机构(JAXA)根据搭载在全球变化观测任务——水资源1号卫星(GCOM-W1)上的用于测量地球表面的先进微波扫描辐射计(AMSR),基于频率和偏振指数查找表的算法开发的土壤湿度产品[ | ~12 h | 0.1° | Geophysical Data |
| AMSR2-LPRM | 荷兰阿姆斯特丹自由大学联合美国航空航天局(NASA)根据AMSR数据开发的陆表参数反演模型算法(LPRM)土壤湿度产品 | ~12 h | 0.1° | soil_moisture_x |
| SMAP L3 | 土壤湿度主-被动探测卫星(SMAP)基于L2观测数据的“每日增强全球复合射频”土壤湿度数据(SMAP_L3_SM_P_E) | 1 d | 9 km | soil_moisture_scav |
| SMOS | 土壤湿度与海洋盐度(SMOS)是ESA地球探索者(Earth Explorers)项目的第二项任务,观测陆地表层(前几厘米)的土壤湿度和海洋表面盐度[ | ~1 h | ~40 km | Soil_Moisture |
| “开放环”模型产品 | ||||
| EAR5-Land | 欧洲中期天气预报中心(ECMWF)第五代陆面再分析数据集(ERA5-Land)是专门针对陆地过程的高分辨率再分析数据产品,受到ERA5气象场的驱动,在用于陆地表面交换的单一碳-水分块状欧洲中心方案模型(CHTESSEL)模拟下生成,未与集成预报系统(IFS)的大气模块或海洋波浪模型耦合[ | 1 h | 0.1° | swvl1 |
| GLDAS | 全球陆面数据同化系统 (GLDAS) 由NASA、戈达德太空飞行中心(GSFC)、美国国家海洋和大气管理局(NOAA)和国家环境预报中心(NCEP)的科学家共同开发[ | 3 h | 0.25° | SoilMoi0_10cm_inst |
| 经过卫星数据同化的模型产品 | ||||
| ERA5 | 欧洲中期天气预报中心(ECMWF)发布的第五代再分析数据集[ | 1 h | 0.25° | SWVL1_GDS0_DBLY |
| GLEAM | 全球陆地蒸发阿姆斯特丹模型(GLEAM)是一套专门用于通过卫星数据估算陆地蒸发和根区土壤湿度的算法。在GLEAM中,土壤湿度的卫星观测值与方程预测的第一土壤层的模拟水分含量同化[ | 1 d | 0.25° | SMsurf |
| NCEP/FNL | 美国国家环境预报中心再分析数据集(NCEP/FNL),基于全球陆面数据同化系统(GLDAS) | 6 h | 0.25° | SOILW_P0_2L106_GLL0 |
| SMAP L4 | 土壤湿度主-被动探测卫星(SMAP)L4产品通过将SMAP数据集中的亮温数据同化到陆面模型中而获得[ | 3 h | 9 km | sm_surface_analysis |
表1 土壤湿度产品数据集分类与属性
Table 1 Classification and attributes of soil moisture product datasets
| 数据产品 | 产品简介 | 分辨率 | 研究变量 | |
|---|---|---|---|---|
| 时间 | 空间 | |||
| 基于卫星反演产品 | ||||
| AMSR2-JAXA | 日本宇宙航空研究开发机构(JAXA)根据搭载在全球变化观测任务——水资源1号卫星(GCOM-W1)上的用于测量地球表面的先进微波扫描辐射计(AMSR),基于频率和偏振指数查找表的算法开发的土壤湿度产品[ | ~12 h | 0.1° | Geophysical Data |
| AMSR2-LPRM | 荷兰阿姆斯特丹自由大学联合美国航空航天局(NASA)根据AMSR数据开发的陆表参数反演模型算法(LPRM)土壤湿度产品 | ~12 h | 0.1° | soil_moisture_x |
| SMAP L3 | 土壤湿度主-被动探测卫星(SMAP)基于L2观测数据的“每日增强全球复合射频”土壤湿度数据(SMAP_L3_SM_P_E) | 1 d | 9 km | soil_moisture_scav |
| SMOS | 土壤湿度与海洋盐度(SMOS)是ESA地球探索者(Earth Explorers)项目的第二项任务,观测陆地表层(前几厘米)的土壤湿度和海洋表面盐度[ | ~1 h | ~40 km | Soil_Moisture |
| “开放环”模型产品 | ||||
| EAR5-Land | 欧洲中期天气预报中心(ECMWF)第五代陆面再分析数据集(ERA5-Land)是专门针对陆地过程的高分辨率再分析数据产品,受到ERA5气象场的驱动,在用于陆地表面交换的单一碳-水分块状欧洲中心方案模型(CHTESSEL)模拟下生成,未与集成预报系统(IFS)的大气模块或海洋波浪模型耦合[ | 1 h | 0.1° | swvl1 |
| GLDAS | 全球陆面数据同化系统 (GLDAS) 由NASA、戈达德太空飞行中心(GSFC)、美国国家海洋和大气管理局(NOAA)和国家环境预报中心(NCEP)的科学家共同开发[ | 3 h | 0.25° | SoilMoi0_10cm_inst |
| 经过卫星数据同化的模型产品 | ||||
| ERA5 | 欧洲中期天气预报中心(ECMWF)发布的第五代再分析数据集[ | 1 h | 0.25° | SWVL1_GDS0_DBLY |
| GLEAM | 全球陆地蒸发阿姆斯特丹模型(GLEAM)是一套专门用于通过卫星数据估算陆地蒸发和根区土壤湿度的算法。在GLEAM中,土壤湿度的卫星观测值与方程预测的第一土壤层的模拟水分含量同化[ | 1 d | 0.25° | SMsurf |
| NCEP/FNL | 美国国家环境预报中心再分析数据集(NCEP/FNL),基于全球陆面数据同化系统(GLDAS) | 6 h | 0.25° | SOILW_P0_2L106_GLL0 |
| SMAP L4 | 土壤湿度主-被动探测卫星(SMAP)L4产品通过将SMAP数据集中的亮温数据同化到陆面模型中而获得[ | 3 h | 9 km | sm_surface_analysis |
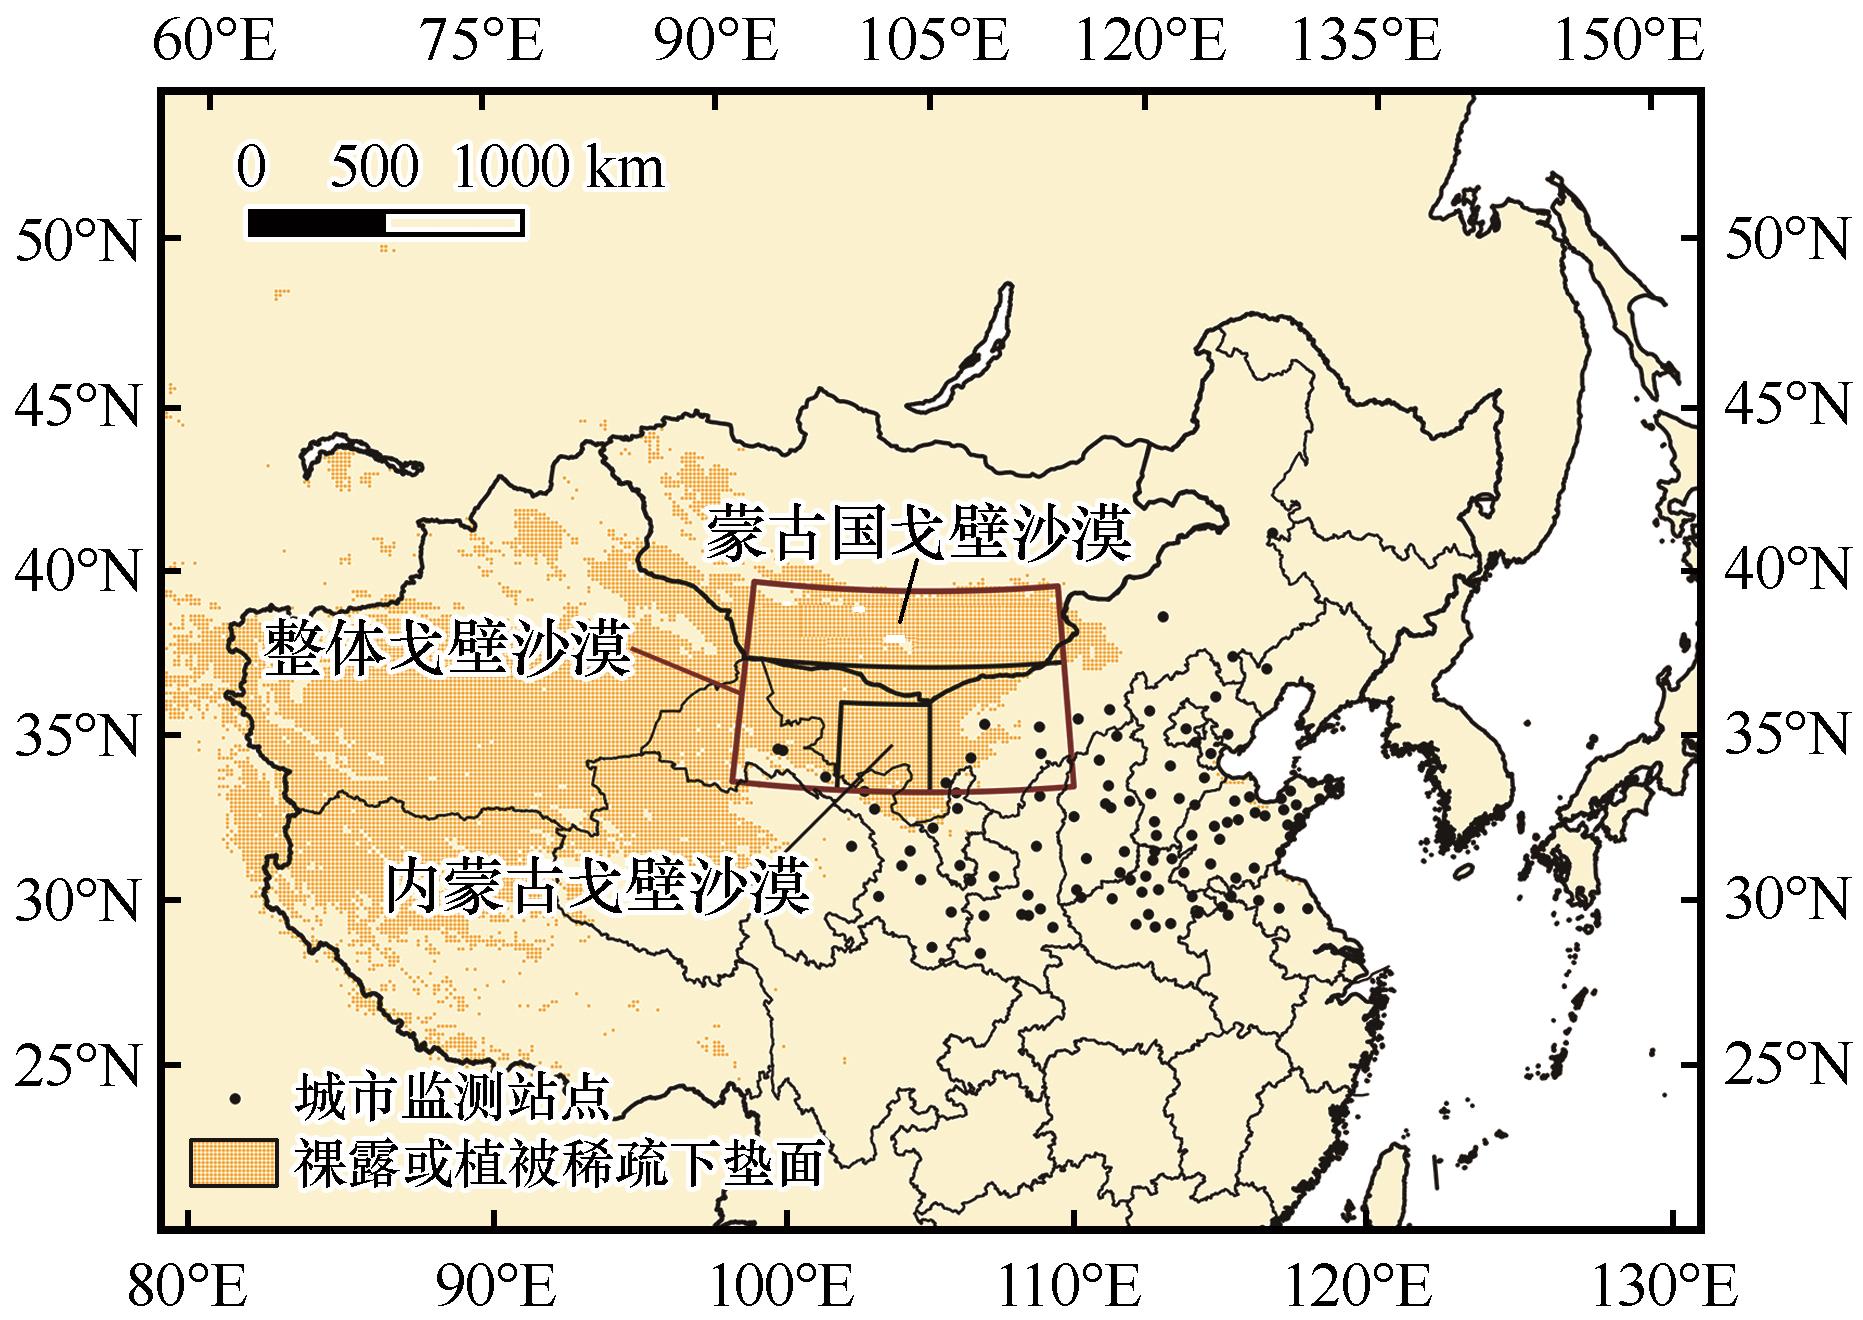
图1 WRF-CMAQ模拟区域注:基于自然资源部标准地图服务网站标准地图(审图号:GS(2020)4632号)制作,底图边界无修改
Fig.1 WRF-CMAQ simulation domain
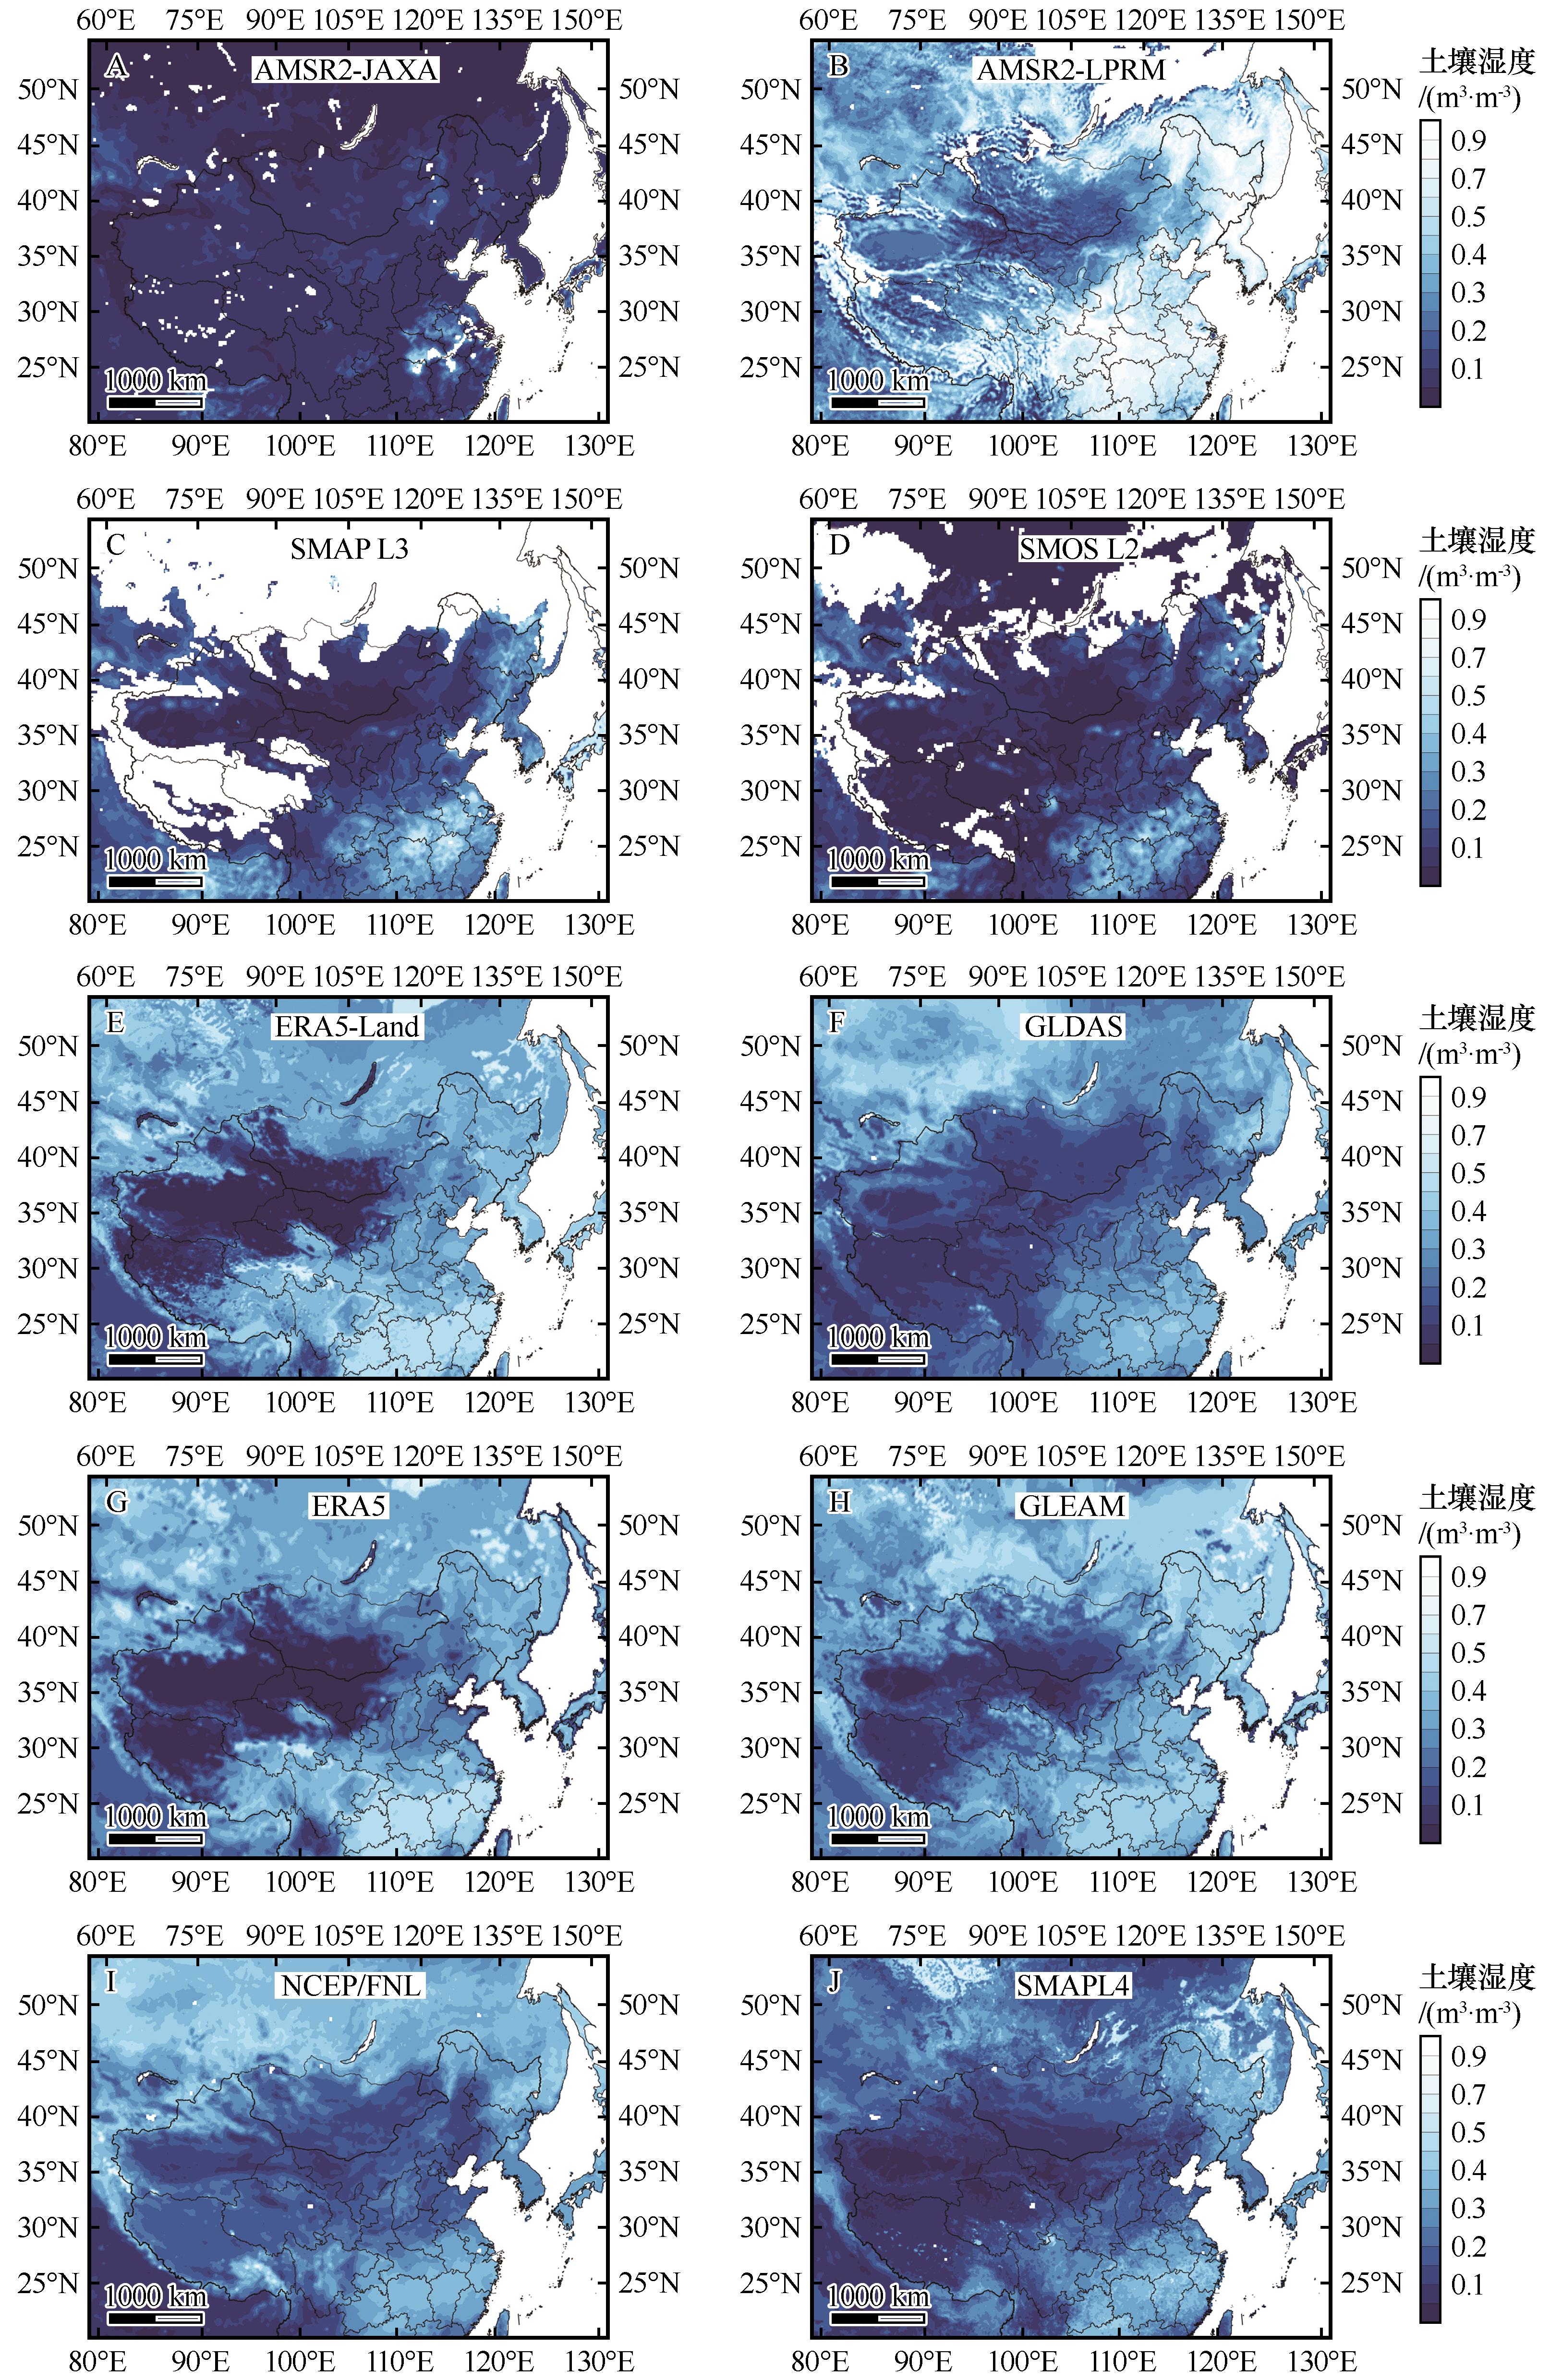
图2 2021年3月7日至31日AMSR2-JAXA(A)、AMSR2-LPRM(B)、SMAP L3(C)、SMOS L2(D)、ERA5-Land(E)、GLDAS(F)、ERA5(G)、GLEAM(H)、NCEP/FNL(I)、SMAP L4 (J)产品土壤湿度平均空间分布注:基于自然资源部标准地图服务网站标准地图(审图号:GS(2020)4632号)制作,底图边界无修改
Fig.2 Average spatial distribution of soil moisture for the products AMSR2-JAXA (A),AMSR2-LPRM (B), SMAP L3 (C), SMOS L2 (D), ERA5-Land (E), GLDAS (F), ERA5 (G), GLEAM (H), NCEP/FNL (I), SMAP L4(J) from March 7 to March 31, 2021
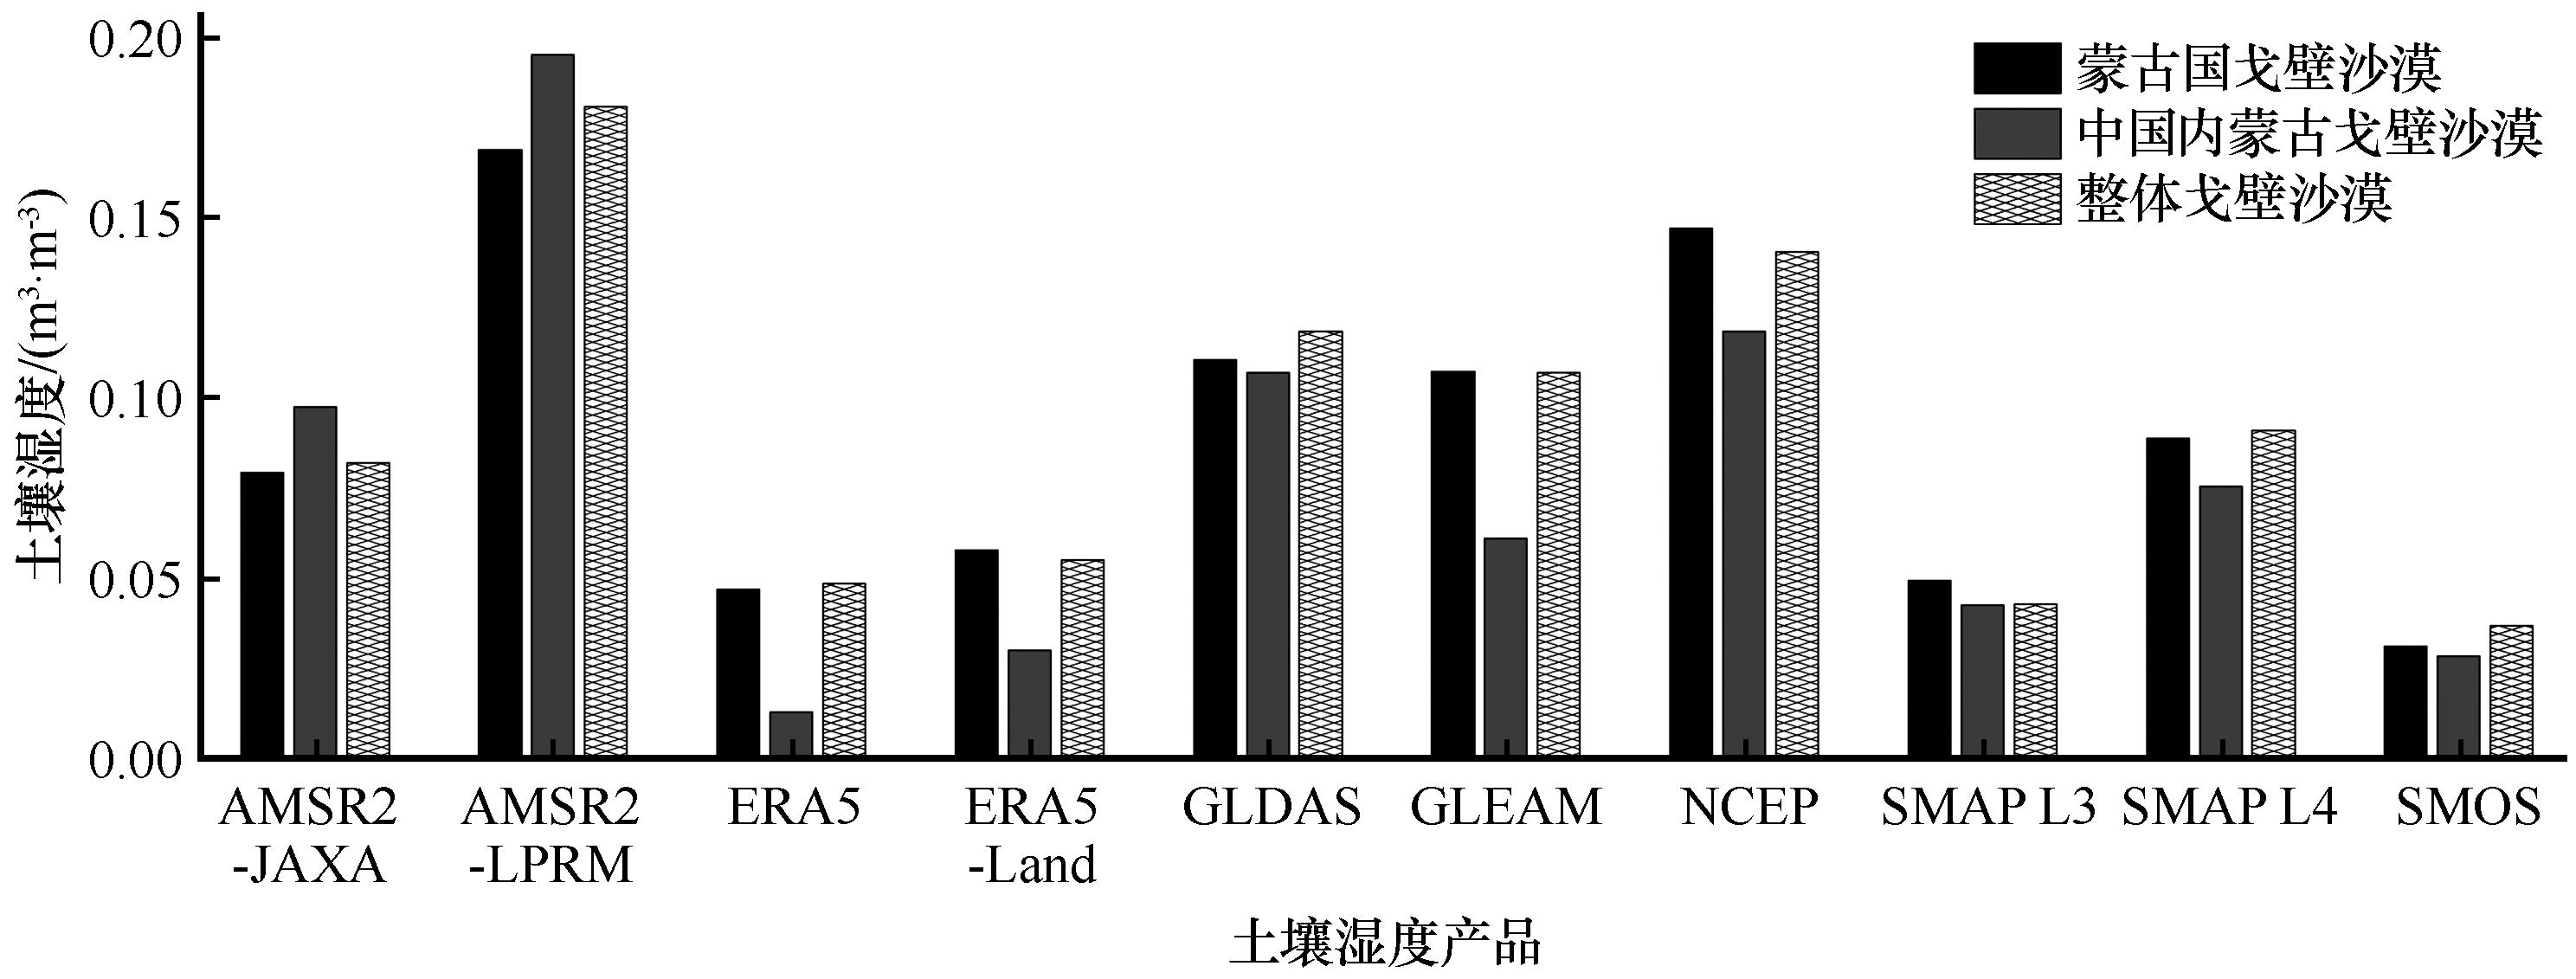
图3 戈壁沙漠地区2021年3月7日至3月31日平均土壤湿度
Fig.3 Average soil moisture in the Gobi Desert region from March 7 to March 31, 2021
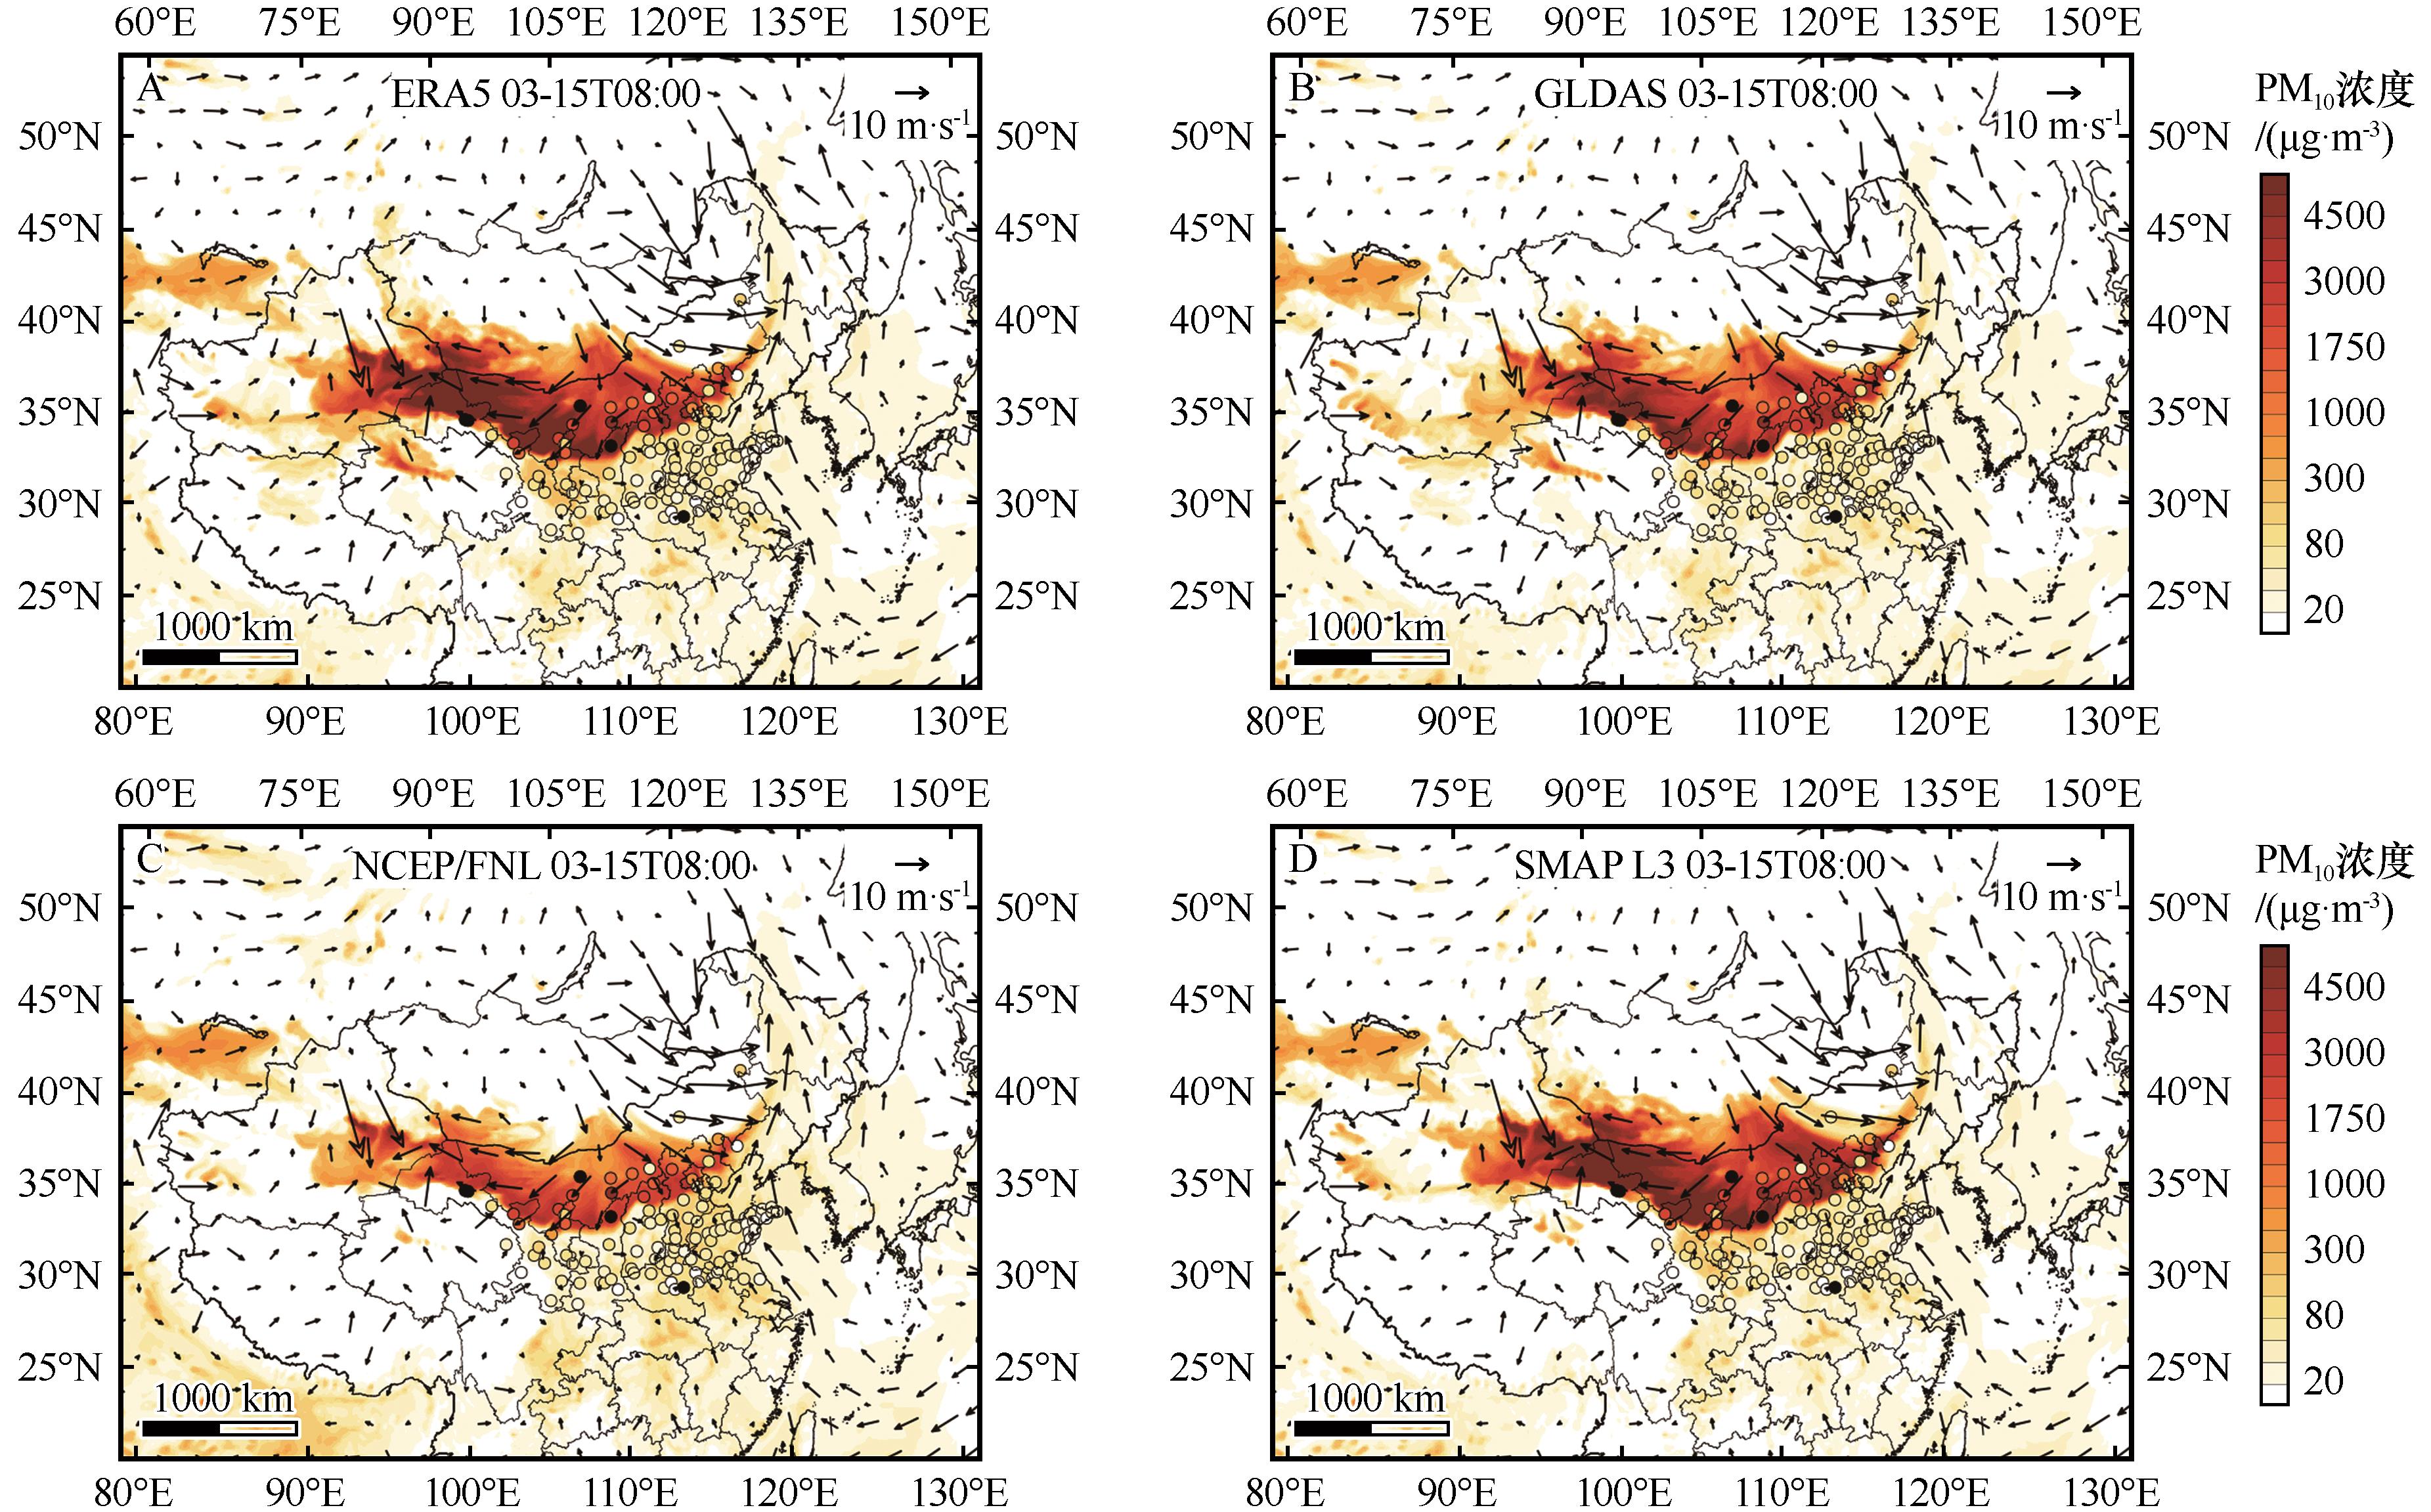
图4 2021年3月15日08:00 ERA5(A)、GLDAS(B)、NCEP/FNL(C)、SMAP L3(D)的PM10浓度模拟结果与110座站点观测值(图中圆圈表示城市站点观测结果,填色图表示模拟结果,使用共同的色标)注:基于自然资源部标准地图服务网站标准地图(审图号:GS(2020)4632号) 制作,底图边界无修改
Fig.4 The PM10 concentration simulation results of ERA5(A), GLDAS(B), NCEP/FNL(C), SMAP L3 (D) on March 15, 2021 at 08:00, compared with the observed values at 110 sites (the circles in the figure represent the observed results at city sites, the colored contours represents the simulation results, using a common color bar)
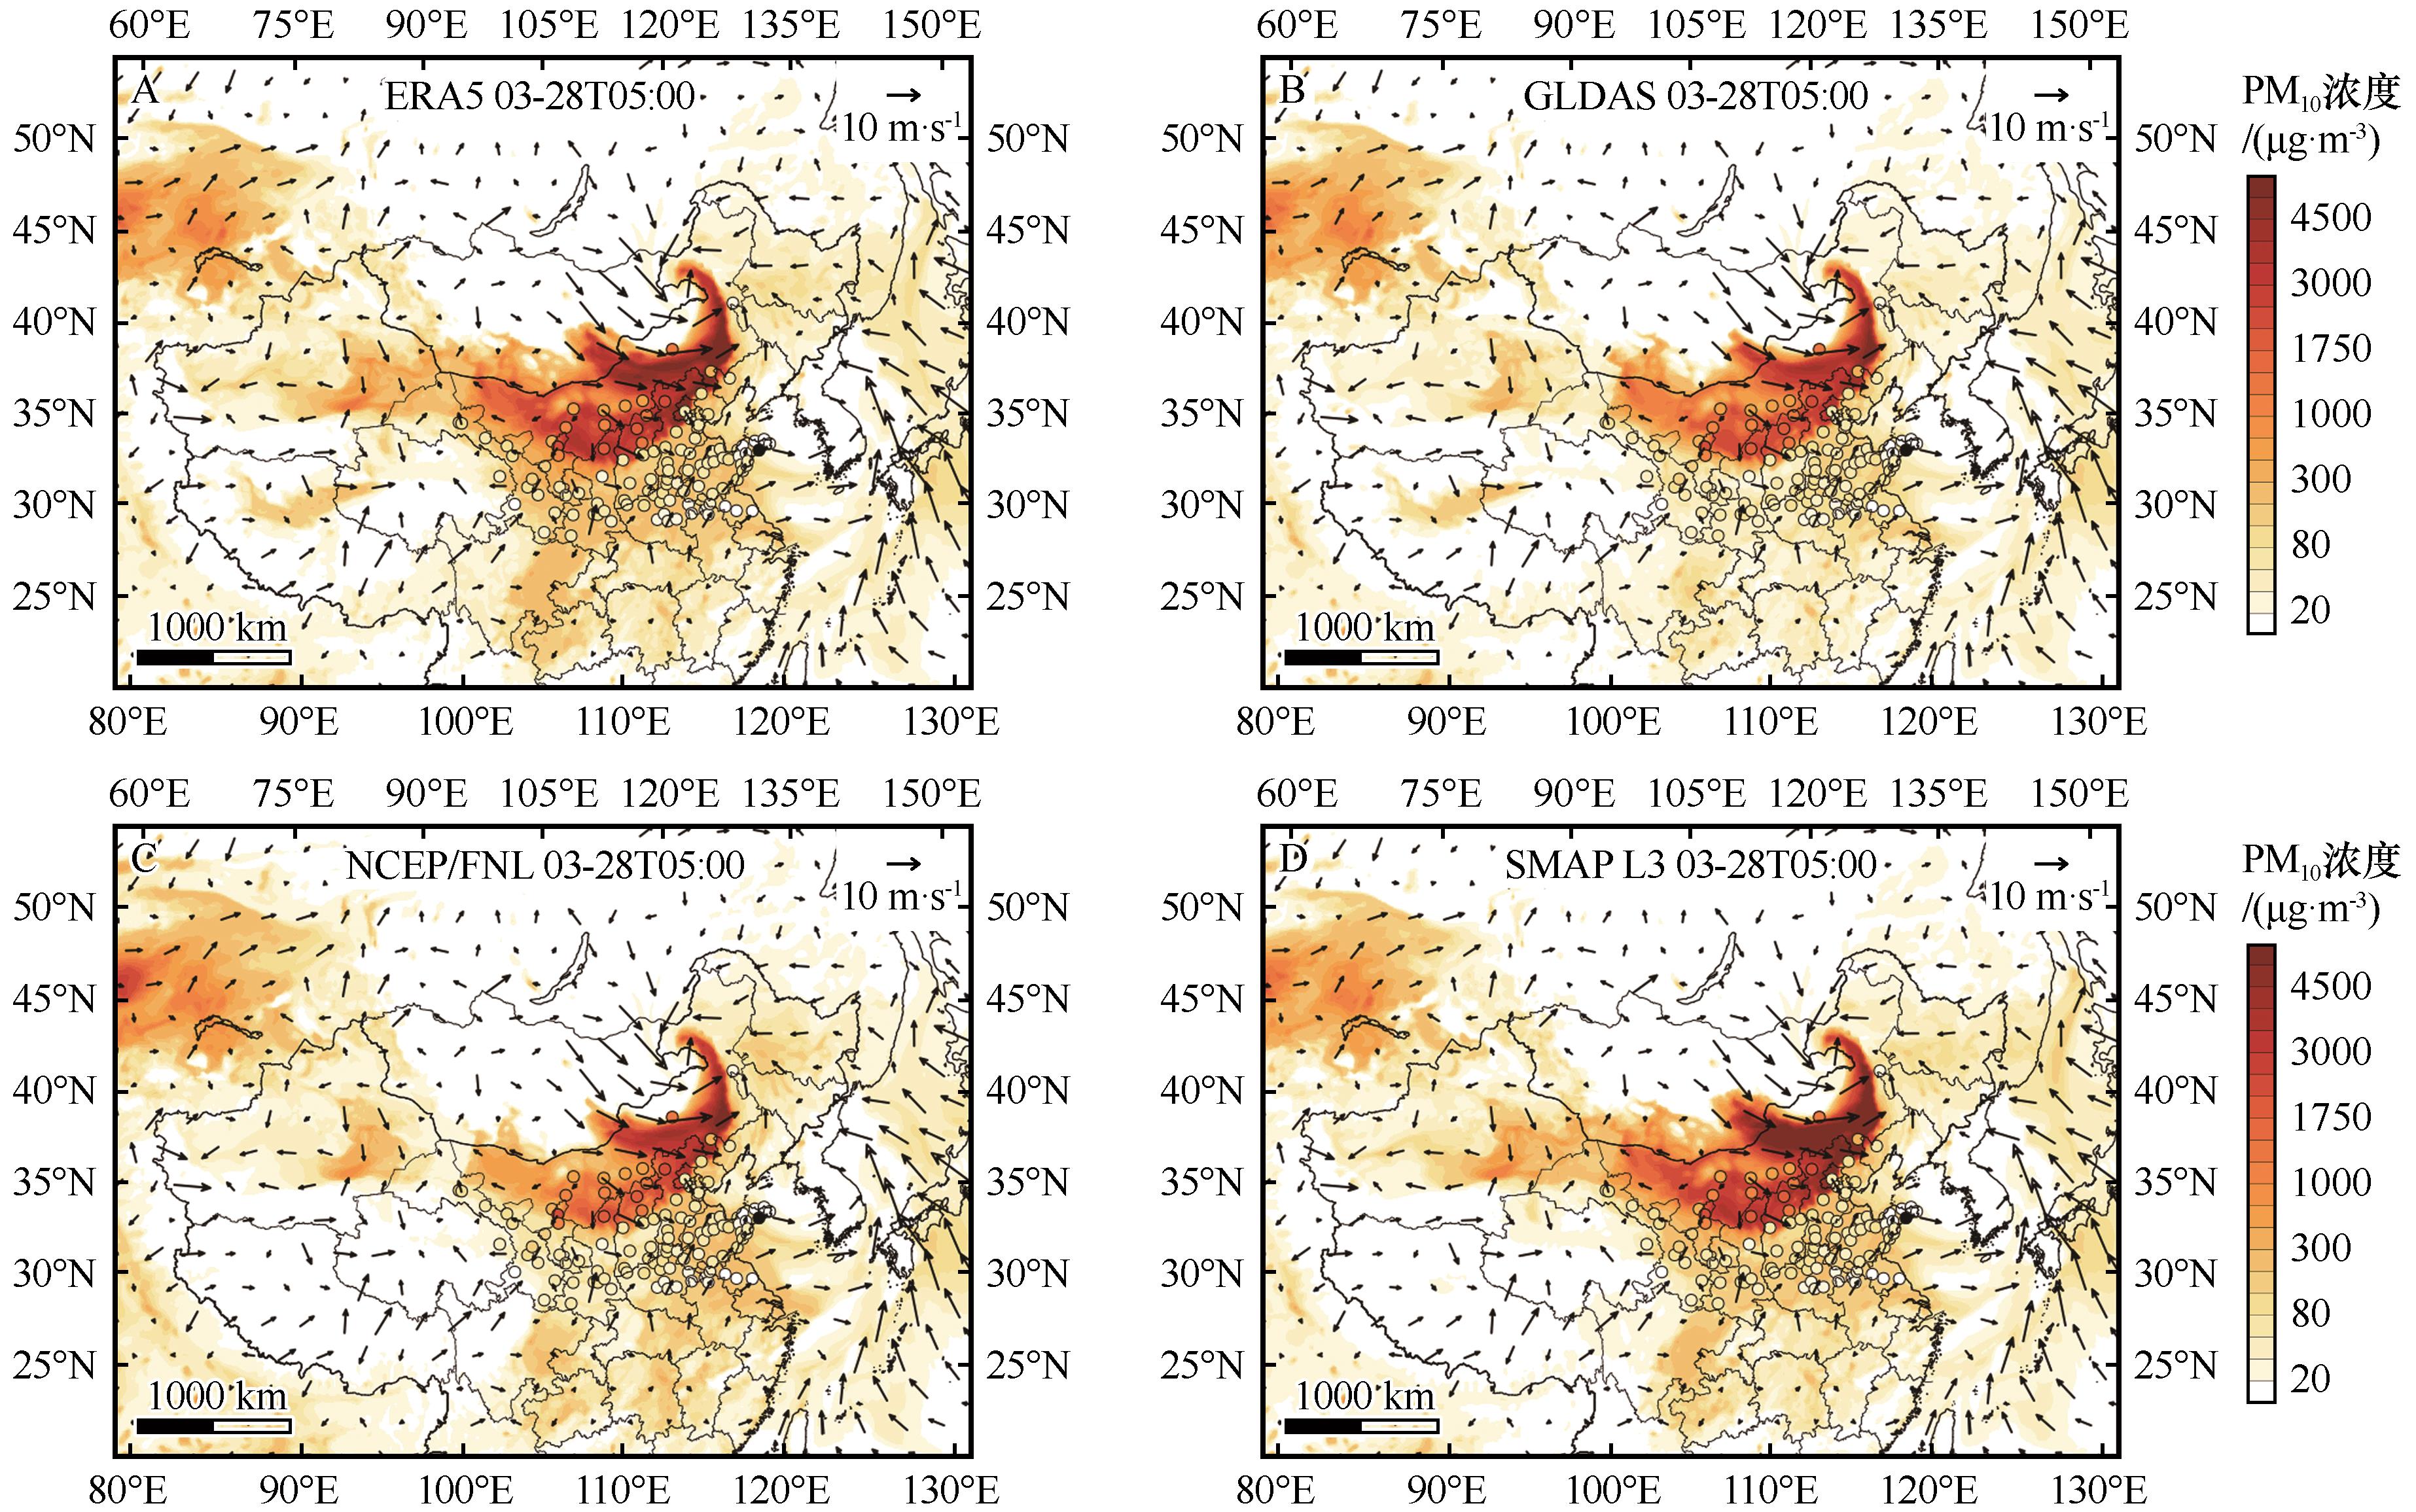
图5 2021年3月28日05:00 ERA5(A)、GLDAS(B)、NCEP/FNL(C)、SMAP L3(D)的PM10浓度模拟结果与110座站点观测值(图中圆圈表示城市站点观测结果,填色图表示模拟结果,使用共同的色标)注:基于自然资源部标准地图服务网站标准地图(审图号:GS(2020)4632号)制作,底图边界无修改
Fig.5 The PM10 concentration simulation results of ERA5 (A), GLDAS (B), NCEP/FNL (C), SMAP L3 (D) on March 28, 2021 at 05:00, compared with the observed values at 110 sites (the circles in the figure represent the observed results at city sites, the colored contours represents the simulation results, using a common color bar)
土壤湿度 数据产品 | 第一次沙尘暴过程 | 第二次沙尘暴过程 | ||||||||
|---|---|---|---|---|---|---|---|---|---|---|
| R | Bias /(μg·m-3) | RMSE /(μg·m-3) | NMB /% | FGE | R | Bias /(μg·m-3) | RMSE /(μg·m-3) | NMB /% | FGE | |
| ERA5 | 0.55 | -199.27 | 915.72 | -32.08 | 0.14 | 0.76 | 86.84 | 535.14 | 26.86 | 0.11 |
| GLDAS | 0.60 | -278.67 | 879.84 | -37.31 | 0.15 | 0.78 | -139.72 | 501.01 | -28.88 | 0.16 |
| NCEP/FNL | 0.54 | -434.60 | 965.30 | -58.64 | 0.19 | 0.75 | -161.01 | 550.59 | -31.74 | 0.18 |
| SMAP L3 | 0.61 | -82.28 | 895.02 | -7.16 | 0.12 | 0.77 | 120.35 | 587.95 | 35.55 | 0.12 |
表2 两次沙尘暴过程PM10 模拟结果与观测值的相关系数、偏差、均方根误差、归一化均值偏差和分数总误差
Table 2 R, Bias, RMSE, NMB, and FGE of PM10 between model simulations and observations in two sandstorm events
土壤湿度 数据产品 | 第一次沙尘暴过程 | 第二次沙尘暴过程 | ||||||||
|---|---|---|---|---|---|---|---|---|---|---|
| R | Bias /(μg·m-3) | RMSE /(μg·m-3) | NMB /% | FGE | R | Bias /(μg·m-3) | RMSE /(μg·m-3) | NMB /% | FGE | |
| ERA5 | 0.55 | -199.27 | 915.72 | -32.08 | 0.14 | 0.76 | 86.84 | 535.14 | 26.86 | 0.11 |
| GLDAS | 0.60 | -278.67 | 879.84 | -37.31 | 0.15 | 0.78 | -139.72 | 501.01 | -28.88 | 0.16 |
| NCEP/FNL | 0.54 | -434.60 | 965.30 | -58.64 | 0.19 | 0.75 | -161.01 | 550.59 | -31.74 | 0.18 |
| SMAP L3 | 0.61 | -82.28 | 895.02 | -7.16 | 0.12 | 0.77 | 120.35 | 587.95 | 35.55 | 0.12 |
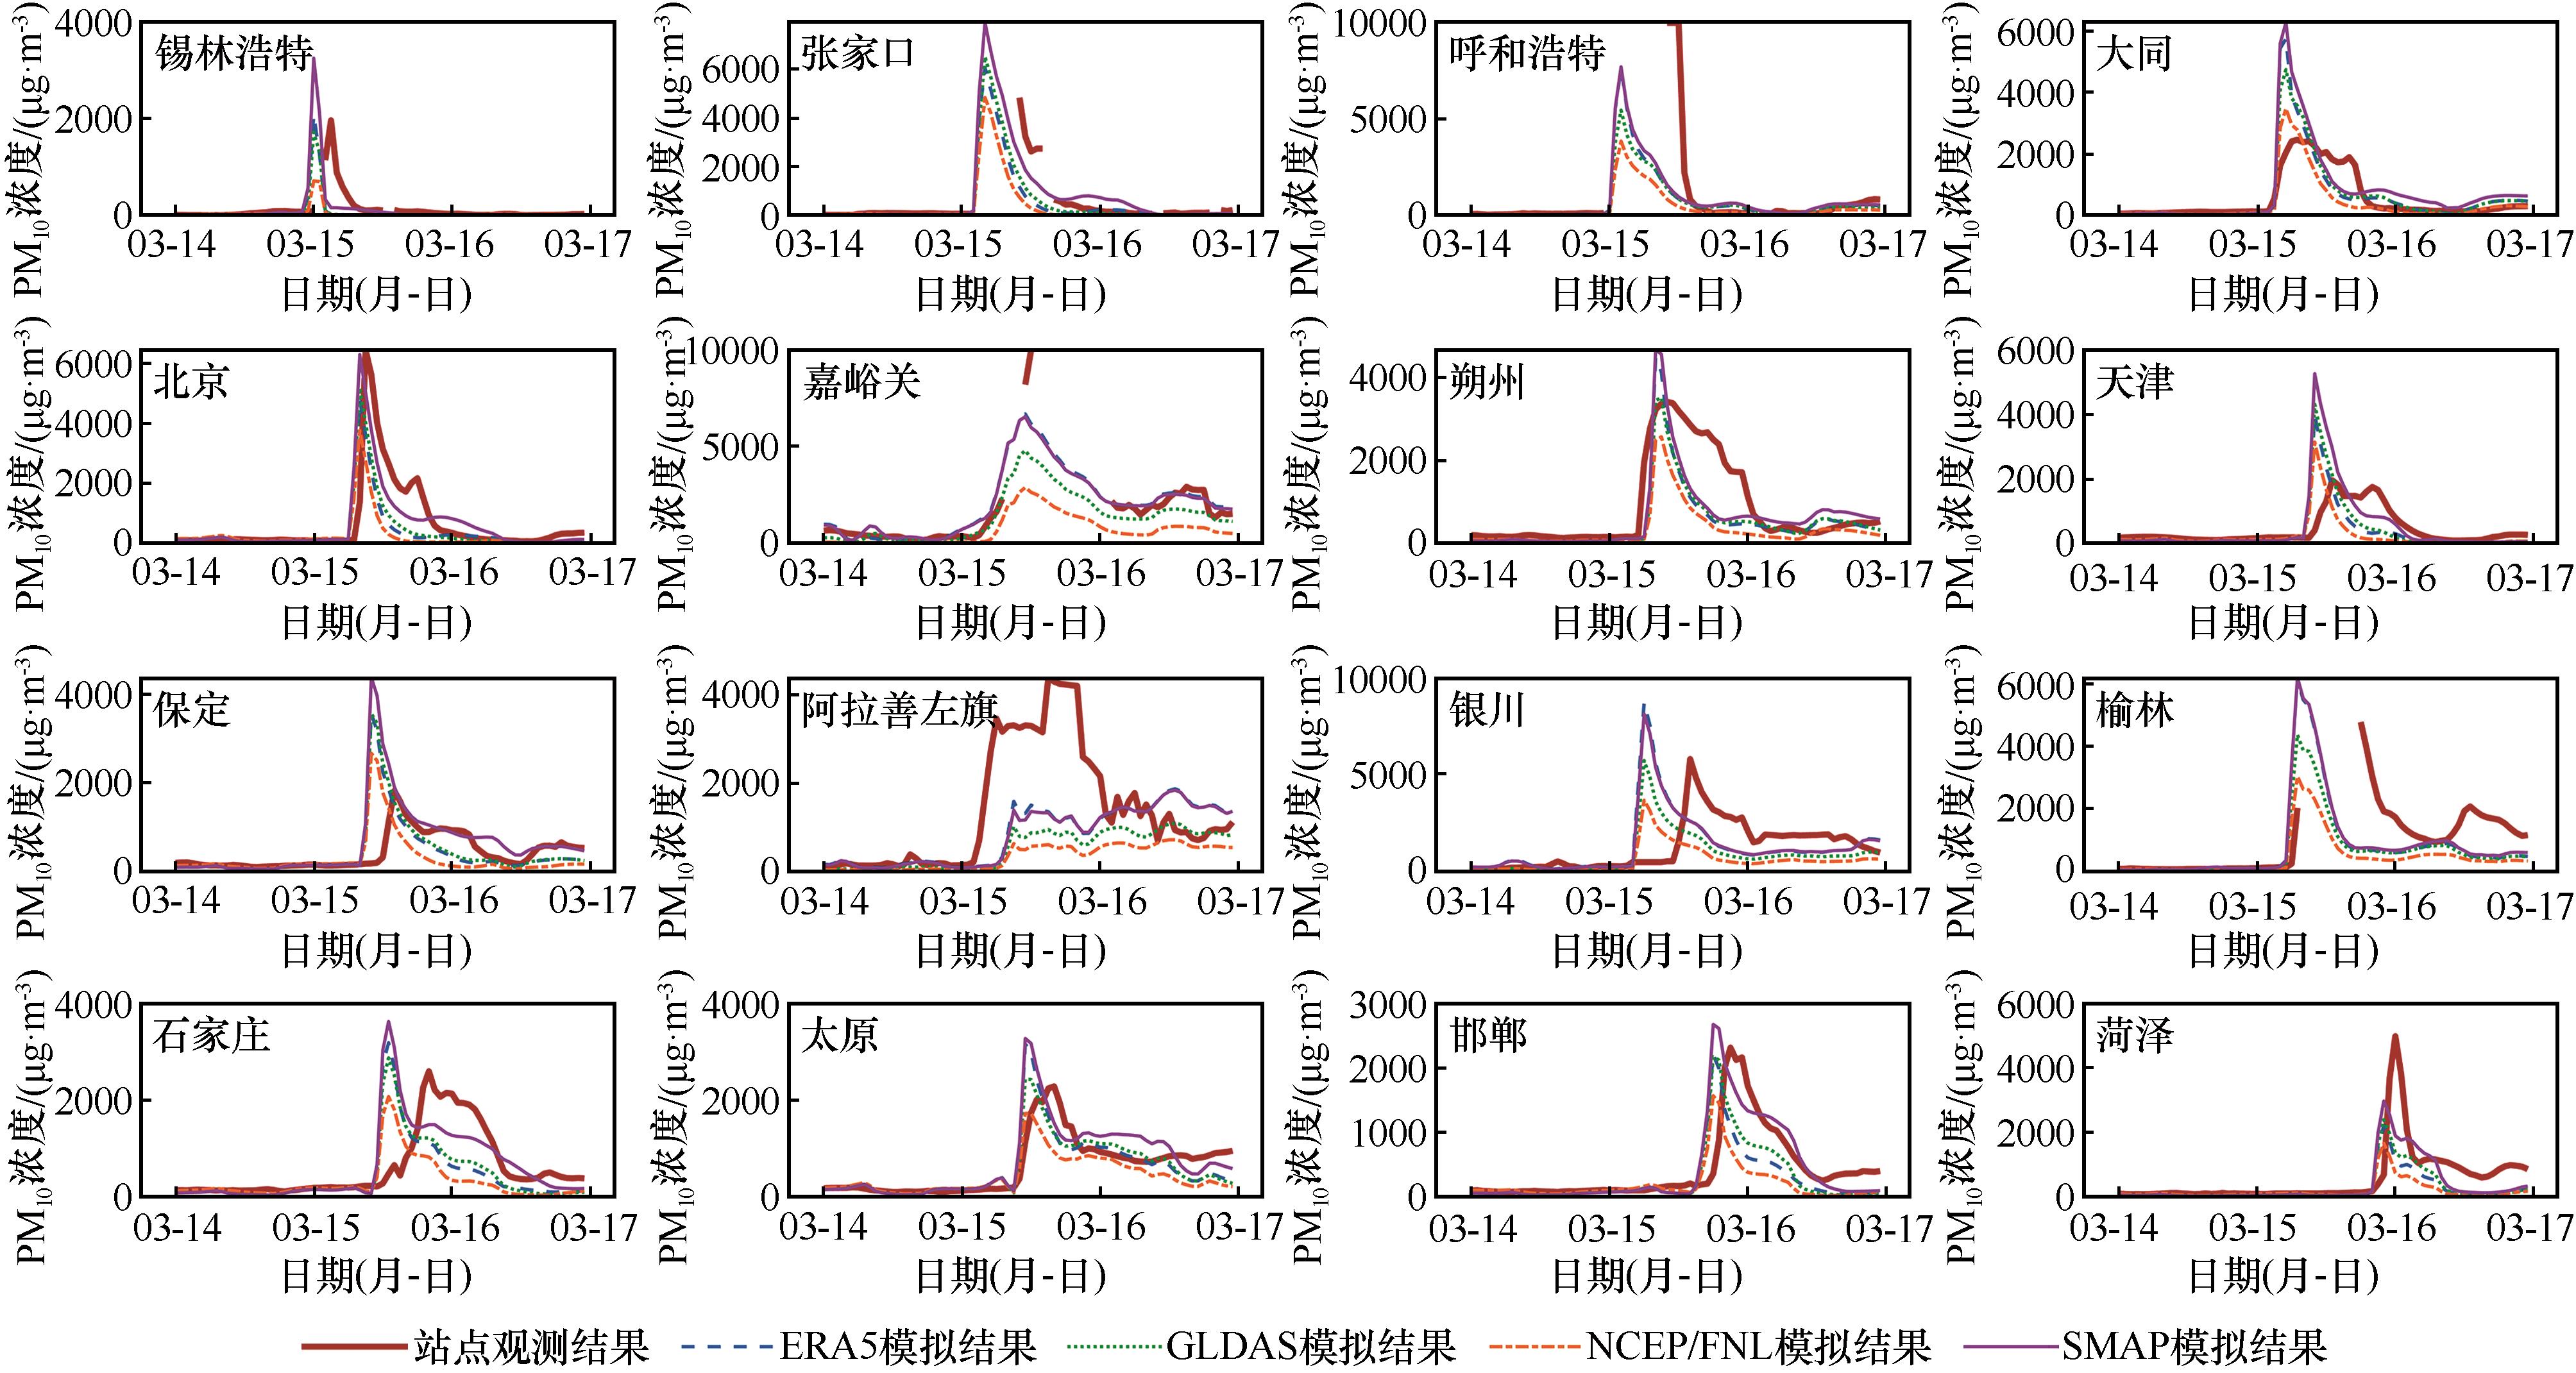
图6 16座受沙尘暴影响城市2021年3月14日00:00至16日23:00 PM10观测值与模拟结果时间序列
Fig.6 Time series of observed and simulated PM10 values in 16 cities affected by sandstorms from 00:00 on March 14 to 23:00 on March 16, 2021
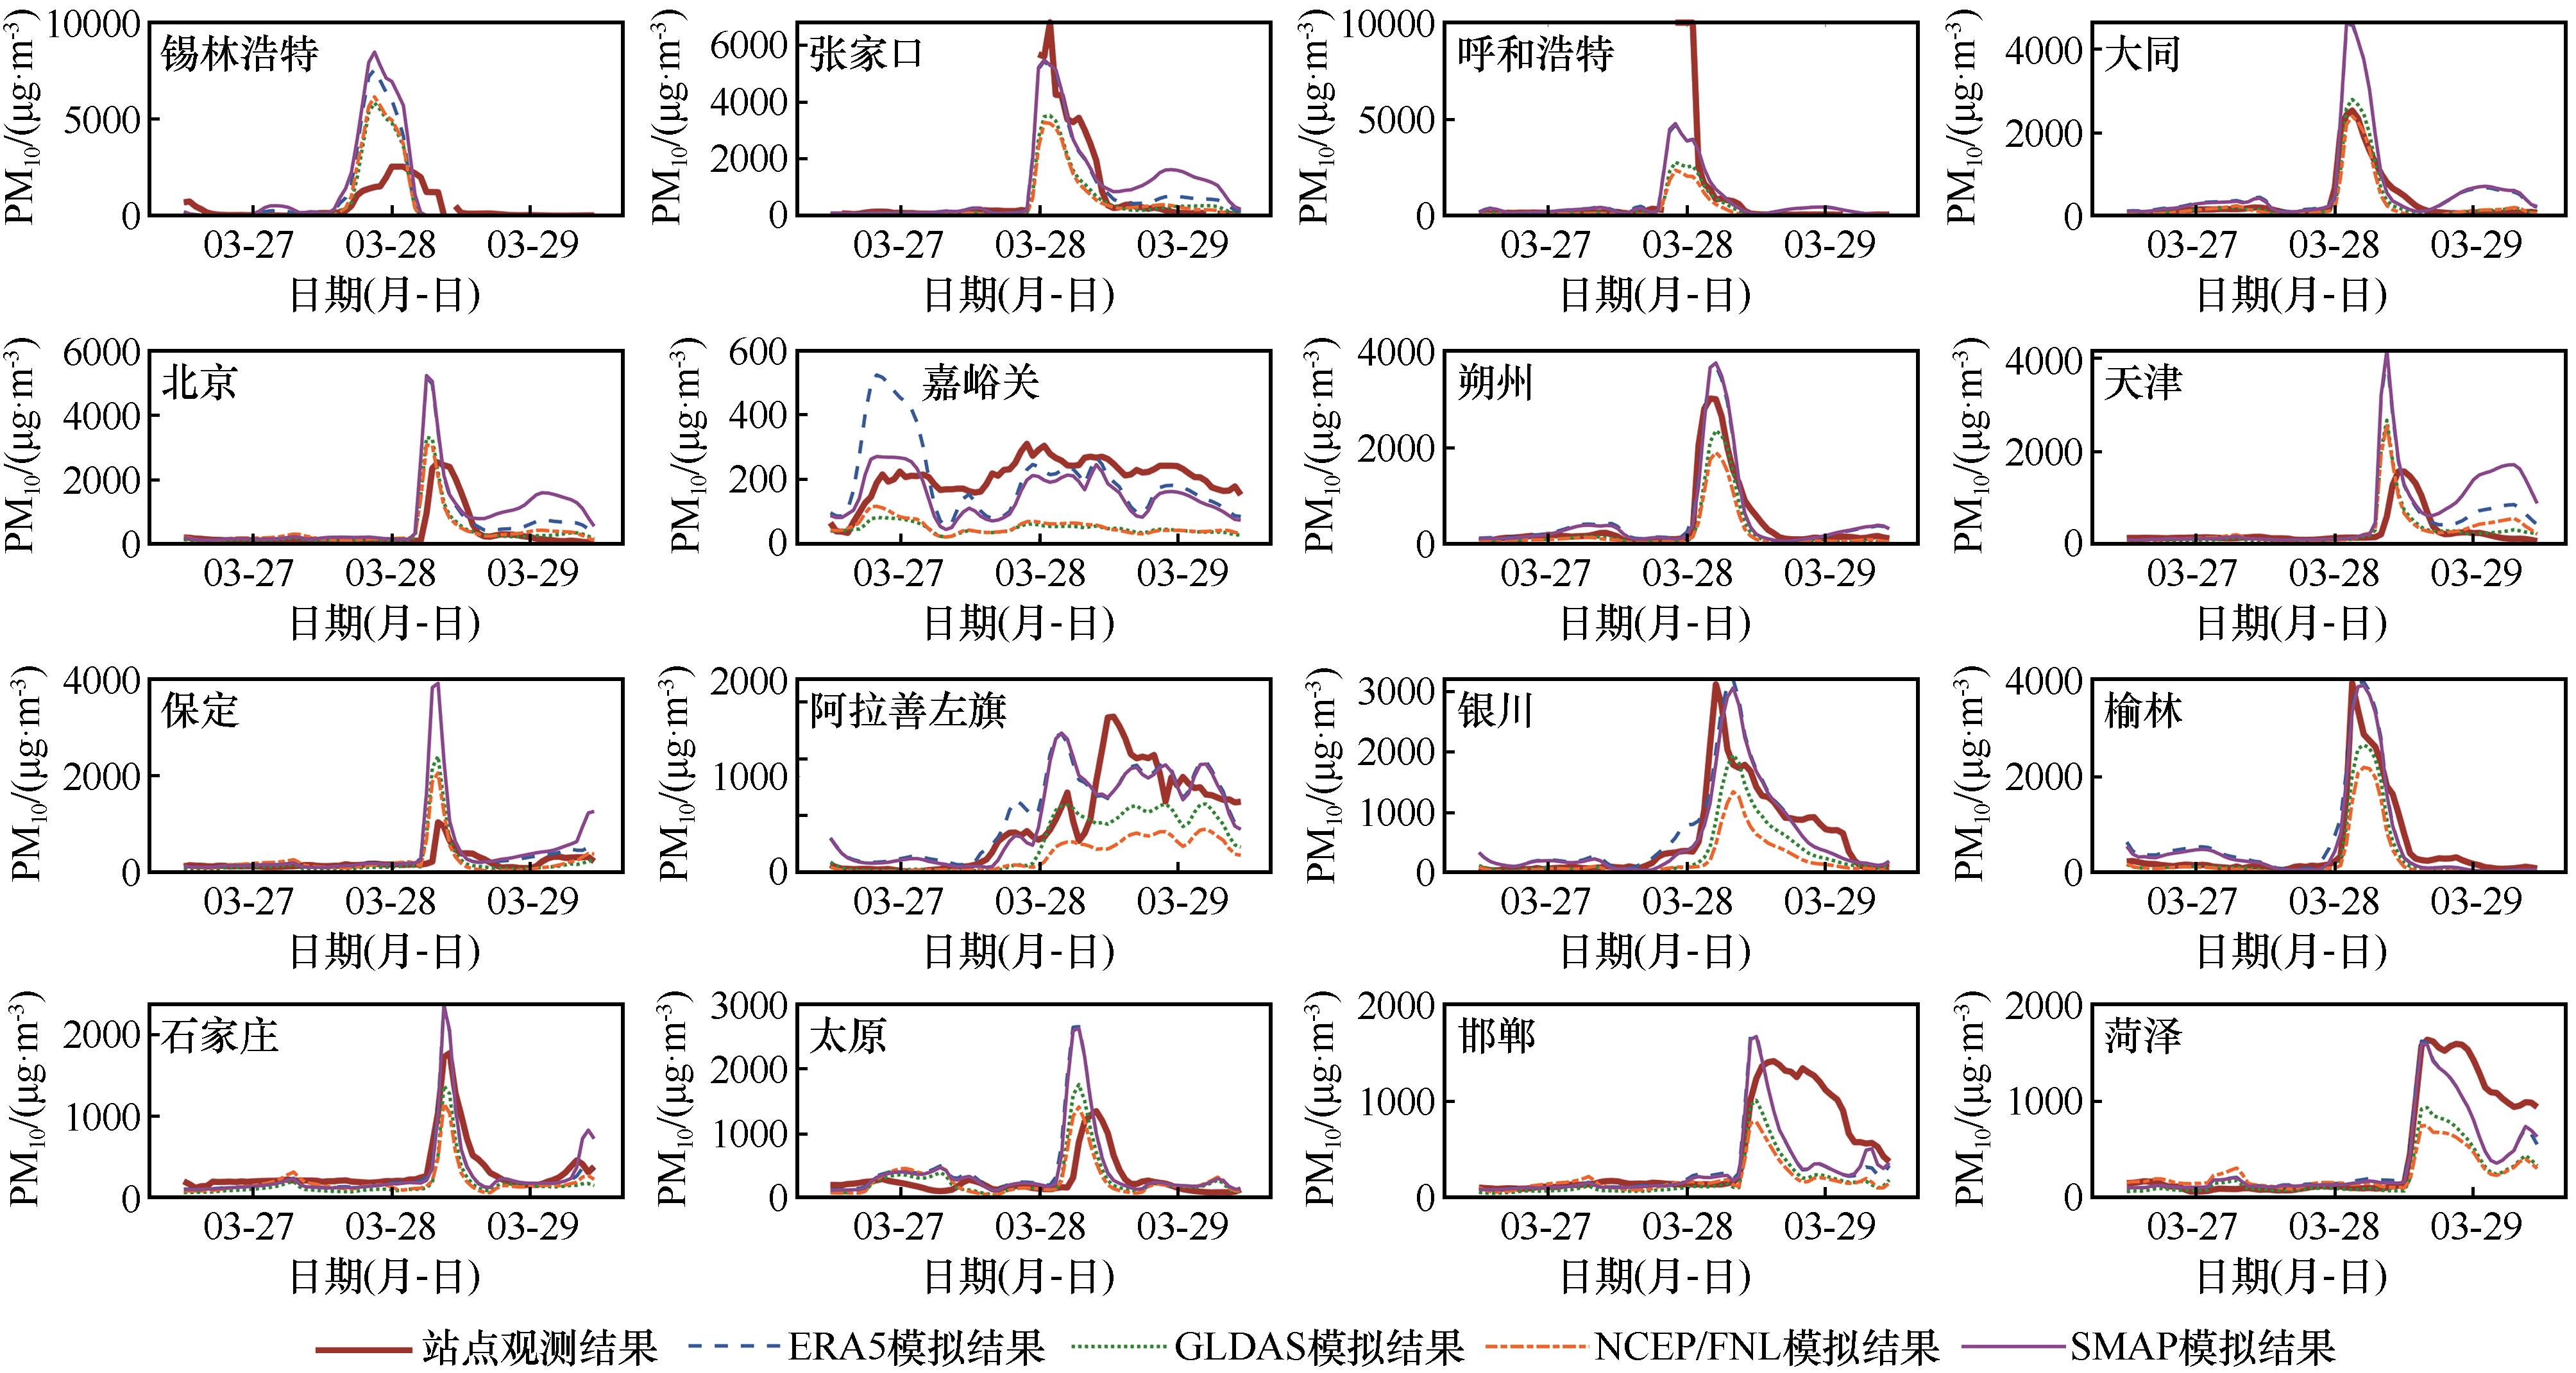
图7 16座受沙尘暴影响城市2021年3月26日12:00至29日12:00 PM10观测值与模拟结果时间序列
Fig.7 Time series of observed and simulated PM10 values in 16 cities affected by sandstorms from 12:00 on March 26 to 12:00 on March 29, 2021
土壤湿度 数据产品 | 第一次沙尘暴过程 | 第二次沙尘暴过程 | ||||||||
|---|---|---|---|---|---|---|---|---|---|---|
| R | Bias /(μg·m-3) | RMSE /(μg·m-3) | NMB /% | FGE | R | Bias /(μg·m-3) | RMSE /(μg·m-3) | NMB /% | FGE | |
| ERA5 | 0.79 | -159.96 | 719.95 | -24.52 | 0.10 | 0.82 | 91.36 | 519.97 | 29.77 | 0.10 |
| GLDAS | 0.79 | -249.22 | 721.24 | -30.67 | 0.11 | 0.80 | -139.71 | 468.18 | -27.70 | 0.15 |
| NCEP/FNL | 0.78 | -425.65 | 840.49 | -53.88 | 0.15 | 0.77 | -163.52 | 520.33 | -30.95 | 0.17 |
| SMAP L3 | 0.80 | -34.76 | 724.65 | -0.13 | 0.10 | 0.81 | 130.64 | 577.98 | 40.51 | 0.11 |
表3 经同步峰值处理的两次沙尘暴过程PM10 模拟结果与观测值的相关系数、偏差、均方根误差、归一化均值偏差和分数总误差
Table 3 R, Bias, RMSE, NMB, and FGE of PM10 between model simulations and observations in two sandstorm events after synchronous peak adjustment
土壤湿度 数据产品 | 第一次沙尘暴过程 | 第二次沙尘暴过程 | ||||||||
|---|---|---|---|---|---|---|---|---|---|---|
| R | Bias /(μg·m-3) | RMSE /(μg·m-3) | NMB /% | FGE | R | Bias /(μg·m-3) | RMSE /(μg·m-3) | NMB /% | FGE | |
| ERA5 | 0.79 | -159.96 | 719.95 | -24.52 | 0.10 | 0.82 | 91.36 | 519.97 | 29.77 | 0.10 |
| GLDAS | 0.79 | -249.22 | 721.24 | -30.67 | 0.11 | 0.80 | -139.71 | 468.18 | -27.70 | 0.15 |
| NCEP/FNL | 0.78 | -425.65 | 840.49 | -53.88 | 0.15 | 0.77 | -163.52 | 520.33 | -30.95 | 0.17 |
| SMAP L3 | 0.80 | -34.76 | 724.65 | -0.13 | 0.10 | 0.81 | 130.64 | 577.98 | 40.51 | 0.11 |
| 1 | Filonchyk M.Characteristics of the severe March 2021 Gobi Desert dust storm and its impact on air pollution in China[J].Chemosphere,2022,287(3):132219. |
| 2 | Yin Z C, Wan Y, Zhang Y J,et al.Why super sandstorm 2021 in North China?[J].National Science Review,2022,9(3):nwab165. |
| 3 | 高美玲,杨桂芳.我国北方沙尘暴的成因分析及防治对策[J].科协论坛(下半月),2012(4):125-126. |
| 4 | 张莉,李继峰,常春平,等.风速分辨率对土壤风蚀模数计算结果的影响[J].中国沙漠,2022,42(3):21-30. |
| 5 | Shao Y P.A model for mineral dust emission[J].Journal of Geophysical Research:Atmospheres,2001,106(D17):20239-20254. |
| 6 | Shao Y P.Physics and Modelling of Wind Erosion[M].Dordrecht,Netherlands:Springer,2008. |
| 7 | Shao Y, Raupach M R, Findlater P A.Effect of saltation bombardment on the entrainment of dust by wind[J].Journal of Geophysical Research:Atmospheres,1993,98(D7):12719-12726. |
| 8 | Alfaro S C, Gaudichet A, Gomes L,et al.Modeling the size distribution of a soil aerosol produced by sandblasting[J].Journal of Geophysical Research:Atmospheres,1997,102(D10):11239-11249. |
| 9 | Kok J F, Parteli E J, Michaels T I,et al.The physics of wind-blown sand and dust[J].Reports on Progress in Physics,2012,75(10):106901. |
| 10 | Vova O, Kappas M, Rafiei Emam A.Comparison of satellite soil moisture products in Mongolia and their relation to grassland condition[J].Land,2019,8(9):142. |
| 11 | Wang A H, Zeng X B, Guo D L.Estimates of global surface hydrology and heat fluxes from the Community Land Model (CLM4.5) with four atmospheric forcing datasets[J].Journal of Hydrometeorology,2016,17(9):2493-2510. |
| 12 | Wang A H, Shi X L.A multilayer soil moisture dataset based on gravimetric method in China and its characteristics[J].Journal of Hydrometeorology,2019,20(8):1721-1736. |
| 13 | 魏巍,张稳定,陈焕盛,等.库布齐沙漠治理对京津冀地区空气质量影响:2017年5月3-6日沙尘天气模拟[J].中国沙漠,2020,40(1):77-87. |
| 14 | 陈思宇,贯雅雯,赵丹,等.东亚沙尘气候效应对地面温度日较差影响的数值模拟[J].中国沙漠,2022,42(3):127-138. |
| 15 | Beck H E, Pan M, Miralles D G,et al.Evaluation of 18 satellite-and model-based soil moisture products using in situ measurements from 826 sensors[J].Hydrology and Earth System Sciences,2021,25(1):17-40. |
| 16 | Liu W C, Wang J X, Xu F L,et al.Validation of four satellite-derived soil moisture products using ground-based in situ observations over Northern China[J].Remote Sensing,2022,14(6):1419. |
| 17 | 刘冲,赵天良,熊洁,等.1991-2010年全球沙尘气溶胶排放量气候特征及其大气环流影响因子[J].中国沙漠,2015,35(4):959-970. |
| 18 | Yu X, Wang T J, Liu C,et al.Numerical studies on a severe dust storm in East Asia using WRF-Chem[J].Atmospheric and Climate Sciences,2017,7(1):92-116. |
| 19 | Zeng Y, Wang M H, Zhao C,et al.WRF-Chem v3.9 simulations of the East Asian dust storm in May 2017:modeling sensitivities to dust emission and dry deposition schemes[J].Geoscientific Model Development,2020,13(4):2125-2147. |
| 20 | Lee J H, Lee S H.Modeling a severe wintertime Asian dust event observed in the East Asia region:sensitivity of the WRF-Chem dust emission schemes[J].Atmospheric Pollution Research,2022,13(12):101599. |
| 21 | Zhao J Q, Ma X Y, Wu S Q,et al.Dust emission and transport in Northwest China:WRF-Chem simulation and comparisons with multi-sensor observations[J].Atmospheric Research,2020,241(1):104978. |
| 22 | Ma S Q, Zhang X L, Gao C,et al.Multimodel simulations of a springtime dust storm over northeastern China:implications of an evaluation of four commonly used air quality models (CMAQ v5.2.1,CAMx v6.50,CHIMERE v2017r4,and WRF-Chem v3.9.1)[J].Geoscientific Model Development,2019,12(11):4603-4625. |
| 23 | Kim S, Liu Y Y, Johnson F M,et al.A global comparison of alternate AMSR2 soil moisture products:Why do they differ?[J].Remote Sensing of Environment,2015,161:43-62. |
| 24 | Kerr Y H, Waldteufel P, Wigneron J P,et al.Soil moisture retrieval from space:the Soil Moisture and Ocean Salinity (SMOS) mission[J].IEEE Transactions on Geoscience and Remote Sensing,2001,39(8):1729-1735. |
| 25 | Kerr Y H, Waldteufel P, Wigneron J P,et al.The SMOS mission:new tool for monitoring key elements of the global water cycle[J].Proceedings of the IEEE,2010,98(5):666-687. |
| 26 | 杨娜,汤燕杰,张宁馨,等.基于SMOS、SMAP数据的青藏高原季风及植被生长季土壤水分长消特征研究[J].遥感技术与应用,2022,37(6):1373-1384. |
| 27 | 曲学斌,林聪,辛孝飞,等.ERA5-Land、MERRA2再分析资料在呼伦贝尔地区的适用性研究[J].沙漠与绿洲气象,2022,16(5):24-30. |
| 28 | Rodell M, Houser P R, Jambor U,et al.The global land data assimilation system[J].Bulletin of the American Meteorological Society,2004,85(3):381-394. |
| 29 | Miralles D G, Holmes T R H, De Jeu R A M,et al.Global land-surface evaporation estimated from satellite-based observations[J].Hydrology and Earth System Sciences,2011,15(2):453-469. |
| 30 | Nadeem A A, Zha Y Y, Shi L S,et al.Multi-scale assessment of SMAP level 3 and level 4 soil moisture products over the soil moisture network within the ShanDian River (SMN-SDR) Basin,China[J].Remote Sensing,2022,14(4):982. |
| 31 | Foroutan H, Young J, Napelenok S,et al.Development and evaluation of a physics-based windblown dust emission scheme implemented in the CMAQ modeling system[J].Journal of Advances in Modeling Earth Systems,2017,9(1):585-608. |
| 32 | Li M, Zhang Q, Kurokawa J I,et al.MIX:a mosaic Asian anthropogenic emission inventory under the international collaboration framework of the MICS-Asia and HTAP[J].Atmospheric Chemistry and Physics,2017,17(2):935-963. |
| 33 | Guenther A B, Jiang X, Heald C L,et al.The Model of Emissions of Gases and Aerosols from Nature version 2.1 (MEGAN2.1):an extended and updated framework for modeling biogenic emissions[J].Geoscientific Model Development,2012,5(6):1471-1492. |
| 34 | 陈泓羽,吴静,李纯斌,等.卫星土壤水分产品在青藏高原地区的适用性评价[J].生态学报,2020,40(24):9195-9207. |
| 35 | Shrestha K L, Kondo A, Kaga A,et al.High-resolution modeling and evaluation of ozone air quality of Osaka using MM5-CMAQ system[J].Journal of Environmental Sciences,2009,21(6):782-789. |
| 36 | Spyrou C, Solomos S, Bartsotas N S,et al.Development of a dust source map for WRF-Chem model based on MODIS NDVI[J].Atmosphere,2022,13(6):868. |
| 37 | Wu Q S, Liu H X, Wang L,et al.Evaluation of AMSR2 soil moisture products over the contiguous United States using in situ data from the International soil moisture network[J].International Journal of Applied Earth Observation and Geoinformation,2016,45(B):187-199. |
| 38 | 陆峥,韩孟磊,卢麾,等.基于AMSR2多频亮温的黑河流域中上游土壤水分估算研究[J].遥感技术与应用,2020,35(1):33-47. |
| 39 | Gomis-Cebolla J, Rattayova V, Salazar-Galán S,et al.Evaluation of ERA5 and ERA5-land reanalysis precipitation datasets over Spain (1951-2020)[J].Atmospheric Research,2023,284(15):106606. |
| 40 | Liang P, Chen B, Yang X P,et al.Revealing the dust transport processes of the 2021 mega dust storm event in northern China[J].Science Bulletin,2022,67(1):21-24. |
| 41 | Kong K, Nandintsetseg B, Shinoda M,et al.Seasonal variations in threshold wind speed for saltation depending on soil temperature and vegetation:a case study in the Gobi Desert[J].Aeolian Research,2021,52:1-10. |
| 42 | Mccarthy C, Sternberg T, Hoshino B,et al.Preserving the Gobi:identifying potential UNESCO world heritage in Mongolia's Gobi Desert[J].Journal of Asia-Pacific Biodiversity,2022,15(4):500-517. |
| 43 | Heiner M, Galbadrakh D, Kiesecker J.Encyclopedia of the World's Biomes[M].Berlin,Germany:Elsevier,2020:78-84. |
| [1] | 王伊蒙, 范亚秋, 龙川, 柳本立. 基于文献记录的敦煌地区历史时期沙尘天气序列重建[J]. 中国沙漠, 2024, 44(2): 162-171. |
| [2] | 陈思宇, 杜世康, 毕鸿儒, 赵丹, 张越, 陈渔, 娄高僮, 陈俊言. 沙尘天气识别和预报方法研究综述[J]. 中国沙漠, 2024, 44(1): 11-21. |
| [3] | 廖承贤, 王海兵, 刘茜雅, 李悦. 以计算流体动力学模型(CFD)模拟的戈壁地表风沙两相流运动特征[J]. 中国沙漠, 2023, 43(6): 71-78. |
| [4] | 李亚云, 成巍, 王宁, 李欣, 高睿. 塔克拉玛干沙漠和戈壁沙漠春季沙尘暴特征及其气象影响因素对比[J]. 中国沙漠, 2023, 43(4): 1-9. |
| [5] | 张正偲, 潘凯佳, 张焱, 韩兰英. 中国西北戈壁区沙尘暴过程中近地层风沙运动特征[J]. 中国沙漠, 2023, 43(2): 130-138. |
| [6] | 陈京平, 余子莹, 杨帆, 王蜜, 胡涵, 倪观忠, 高鑫, 王鑫. 塔克拉玛干沙漠腹地沙尘暴和地表沙物质粒度特征[J]. 中国沙漠, 2023, 43(2): 150-158. |
| [7] | 秦豪君, 杨晓军, 马莉, 王一丞, 傅朝, 张君霞, 陆正奇. 2000—2020年中国西北地区区域性沙尘暴特征及成因[J]. 中国沙漠, 2022, 42(6): 53-64. |
| [8] | 陈仕阳, 杨荣, 苏永中, 杜泽玉. 河西绿洲农田土壤呼吸特征及其对长期施肥的响应[J]. 中国沙漠, 2022, 42(3): 178-186. |
| [9] | 史忠林, 张信宝, 张润川. 2021年“3·15”沙尘暴沙尘来源核素示踪研究[J]. 中国沙漠, 2022, 42(2): 1-5. |
| [10] | 柳本立, 彭婉月, 刘树林, 杨婷. 2021年3月中旬东亚中部沙尘天气地面起尘量及源区贡献率估算[J]. 中国沙漠, 2022, 42(1): 79-86. |
| [11] | 李玲萍, 李岩瑛, 李晓京, 王博, 胡丽莉. 河西走廊不同强度冷锋型沙尘暴环流和动力特征[J]. 中国沙漠, 2021, 41(5): 219-228. |
| [12] | 靳婷, 彭晓庆, 王萍. 脉动风场下跃移沙粒对风的响应时间[J]. 中国沙漠, 2020, 40(2): 100-108. |
| [13] | 王娟, 李兴财. 沙尘暴过程中5~7 000 m高度大气电场及其对颗粒带电量影响[J]. 中国沙漠, 2020, 40(1): 23-28. |
| [14] | 蒋盈沙, 高艳红, 潘永洁, 李霞. 青藏高原及其周边区域沙尘天气的时空分布特征[J]. 中国沙漠, 2019, 39(4): 83-91. |
| [15] | 李璠, 肖建设, 祁栋林, 李林. 柴达木盆地沙尘暴天气影响因素[J]. 中国沙漠, 2019, 39(2): 144-150. |
| 阅读次数 | ||||||
|
全文 |
|
|||||
|
摘要 |
|
|||||
©2018中国沙漠 编辑部
地址: 兰州市天水中路8号 (730000)
电话:0931-8267545
Email:caiedit@lzb.ac.cn;desert@lzb.ac.cn

 甘公网安备 62010202000688号