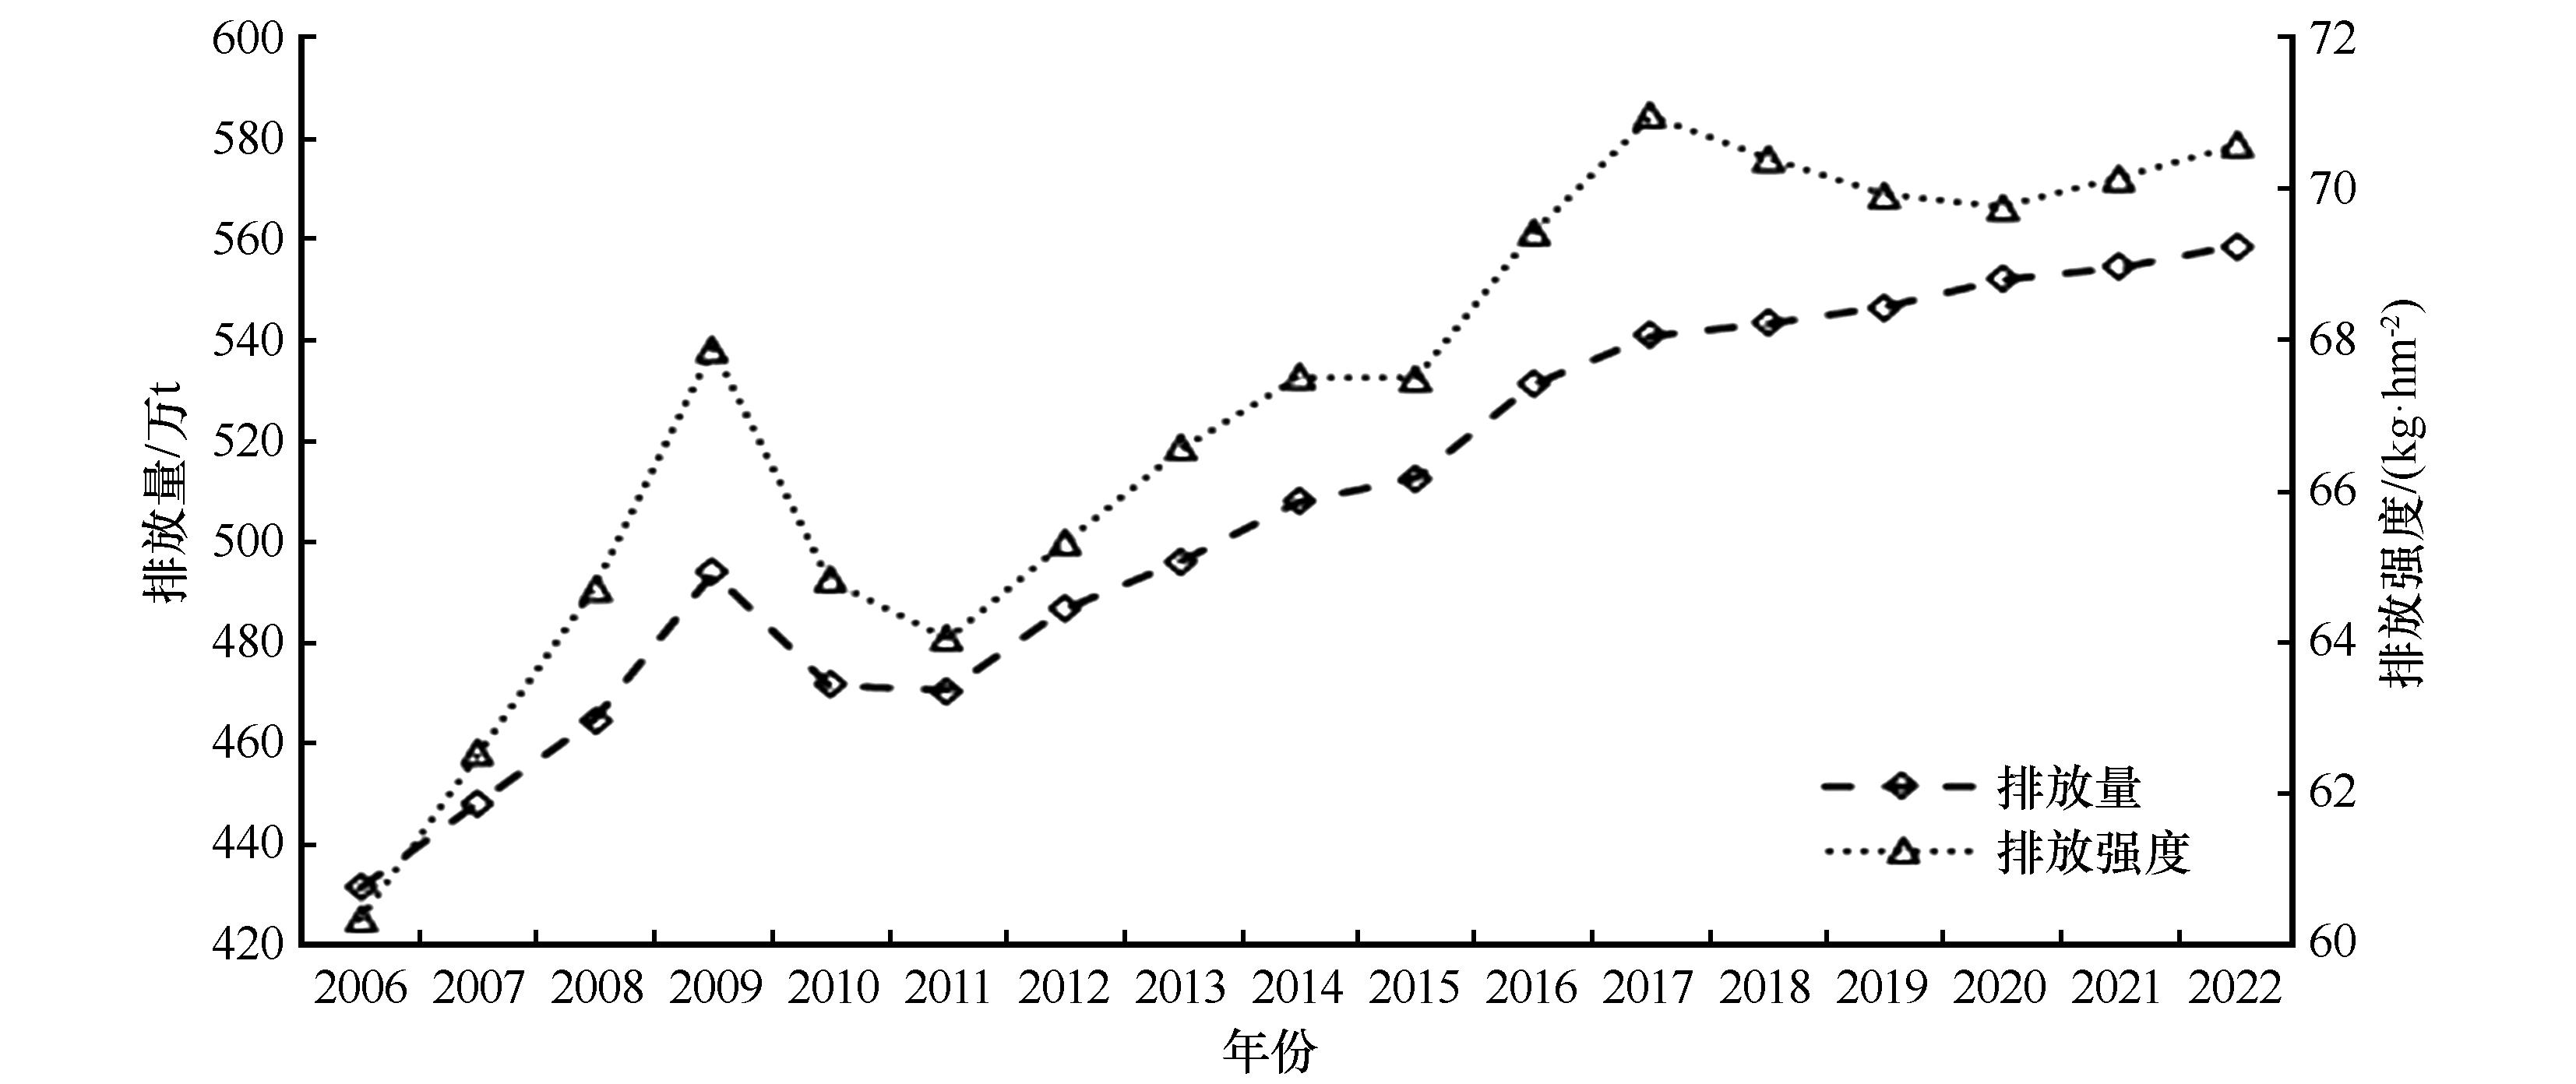
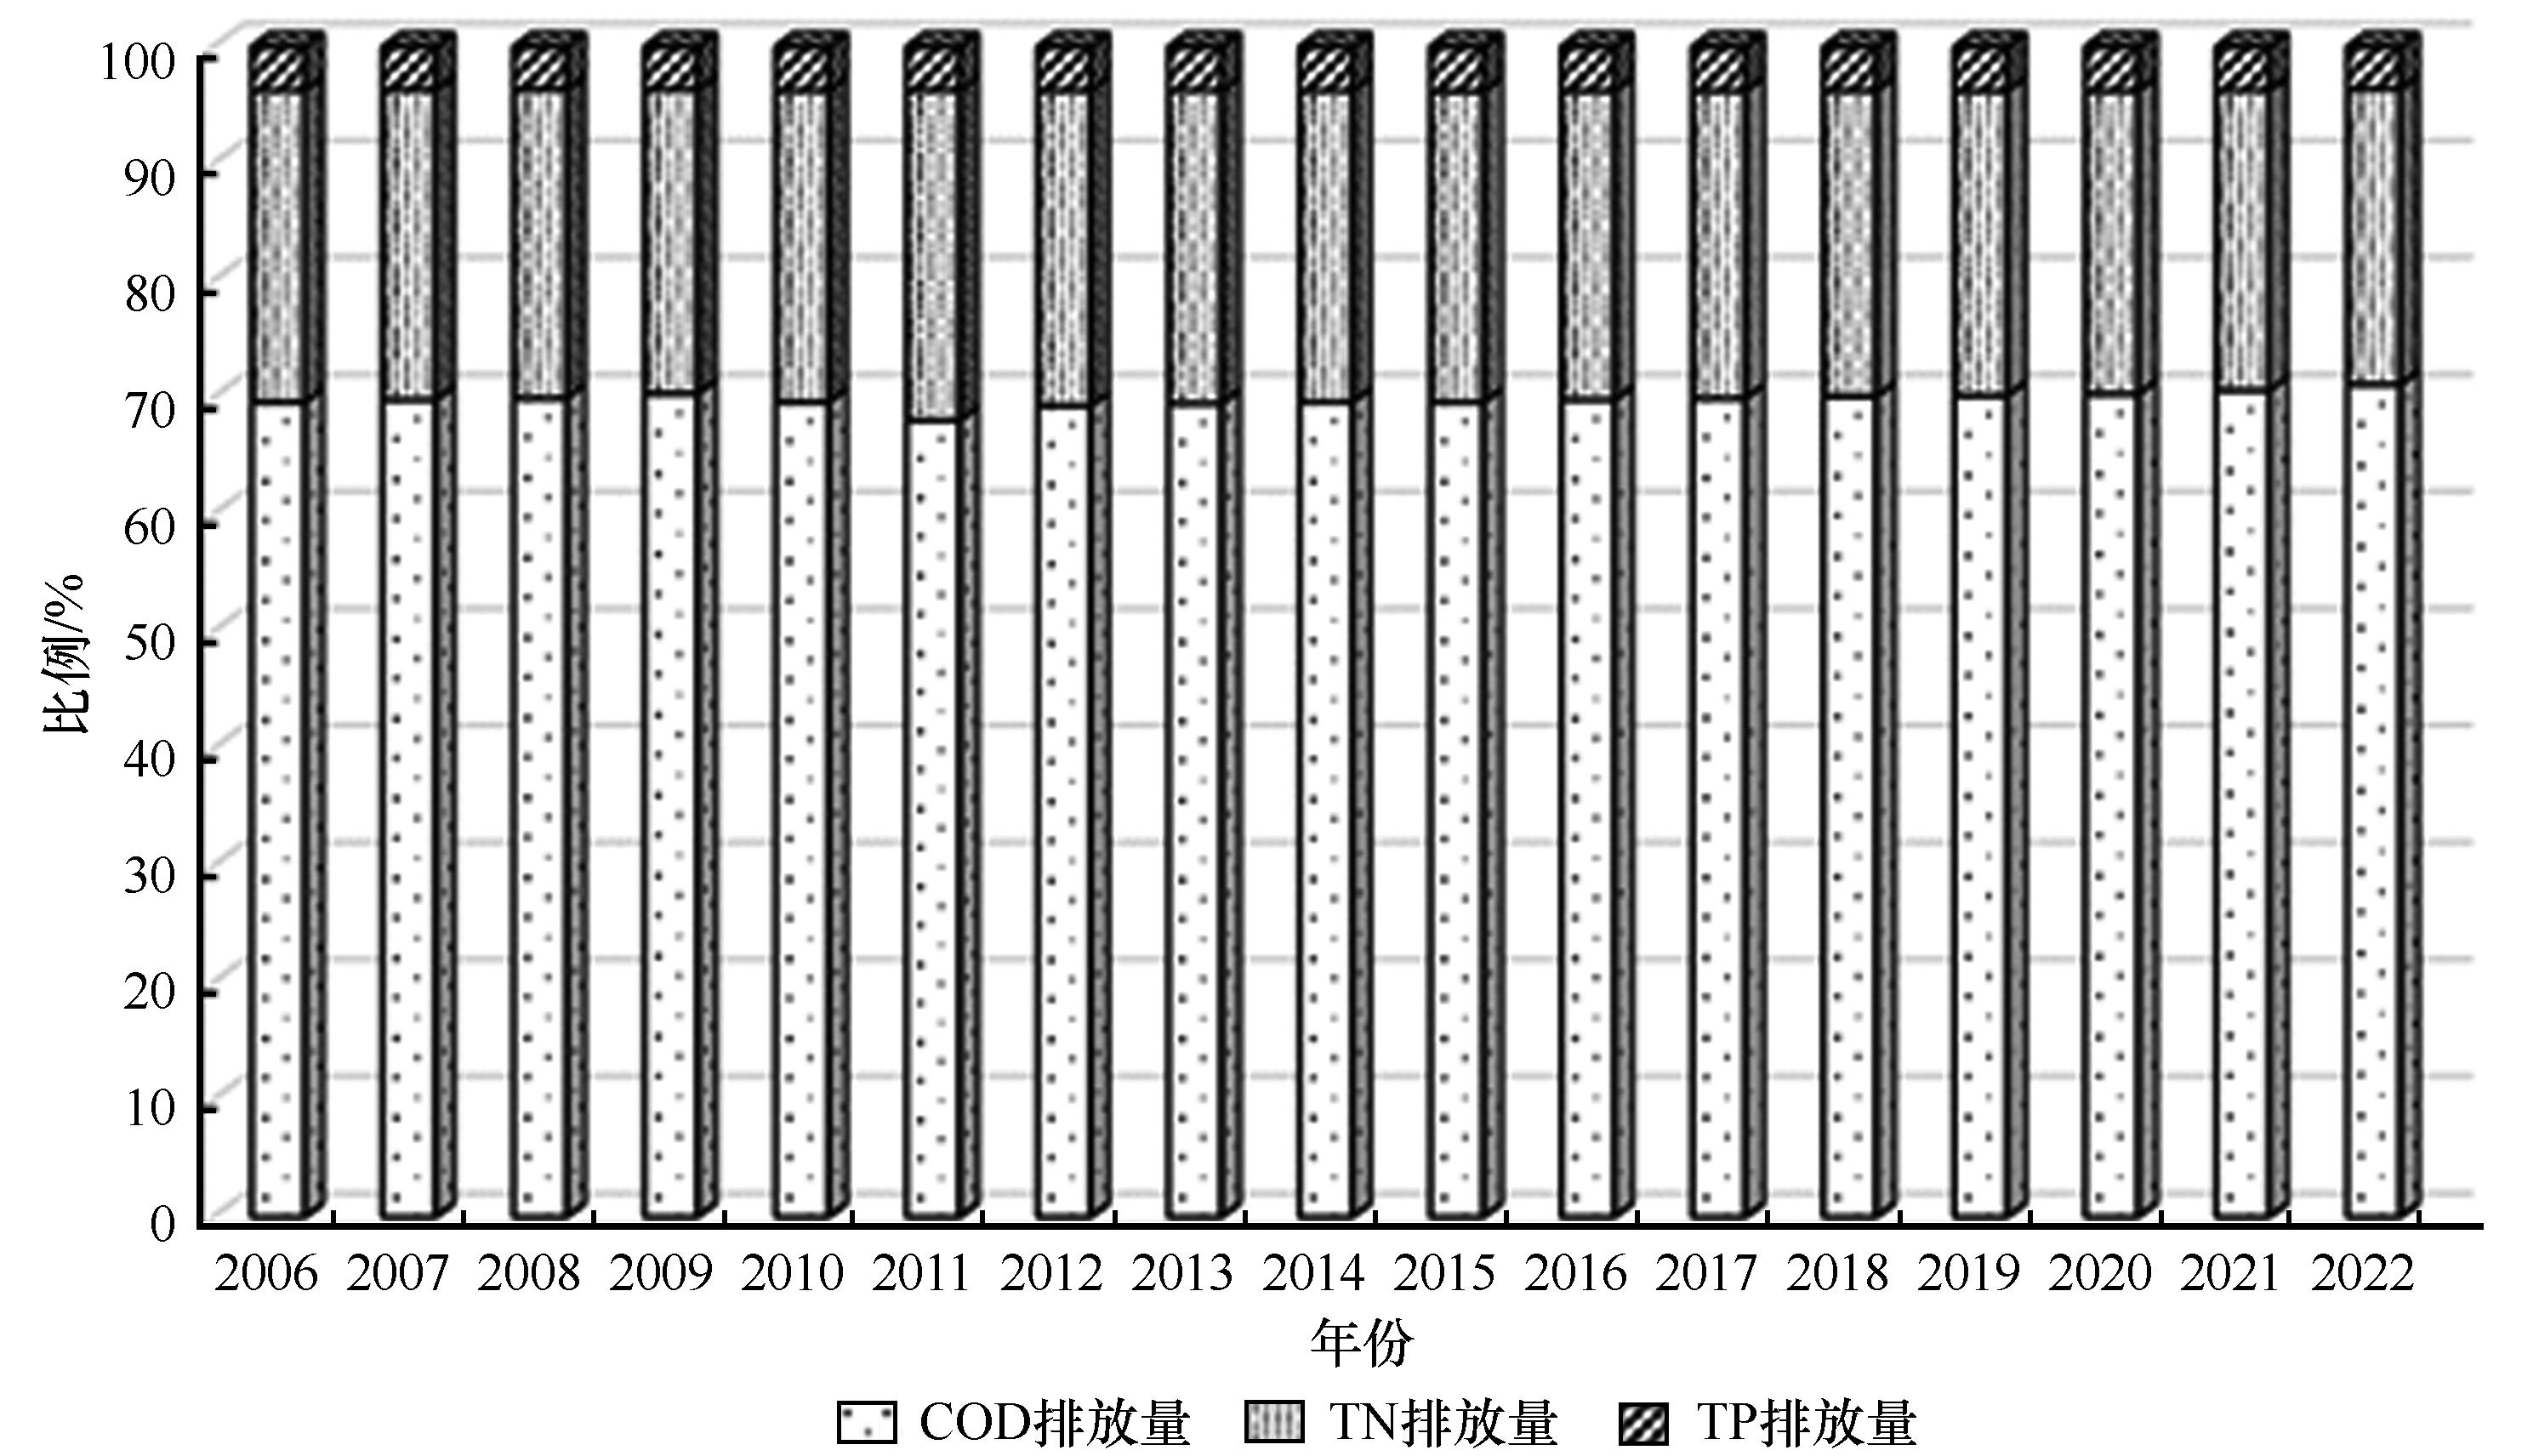
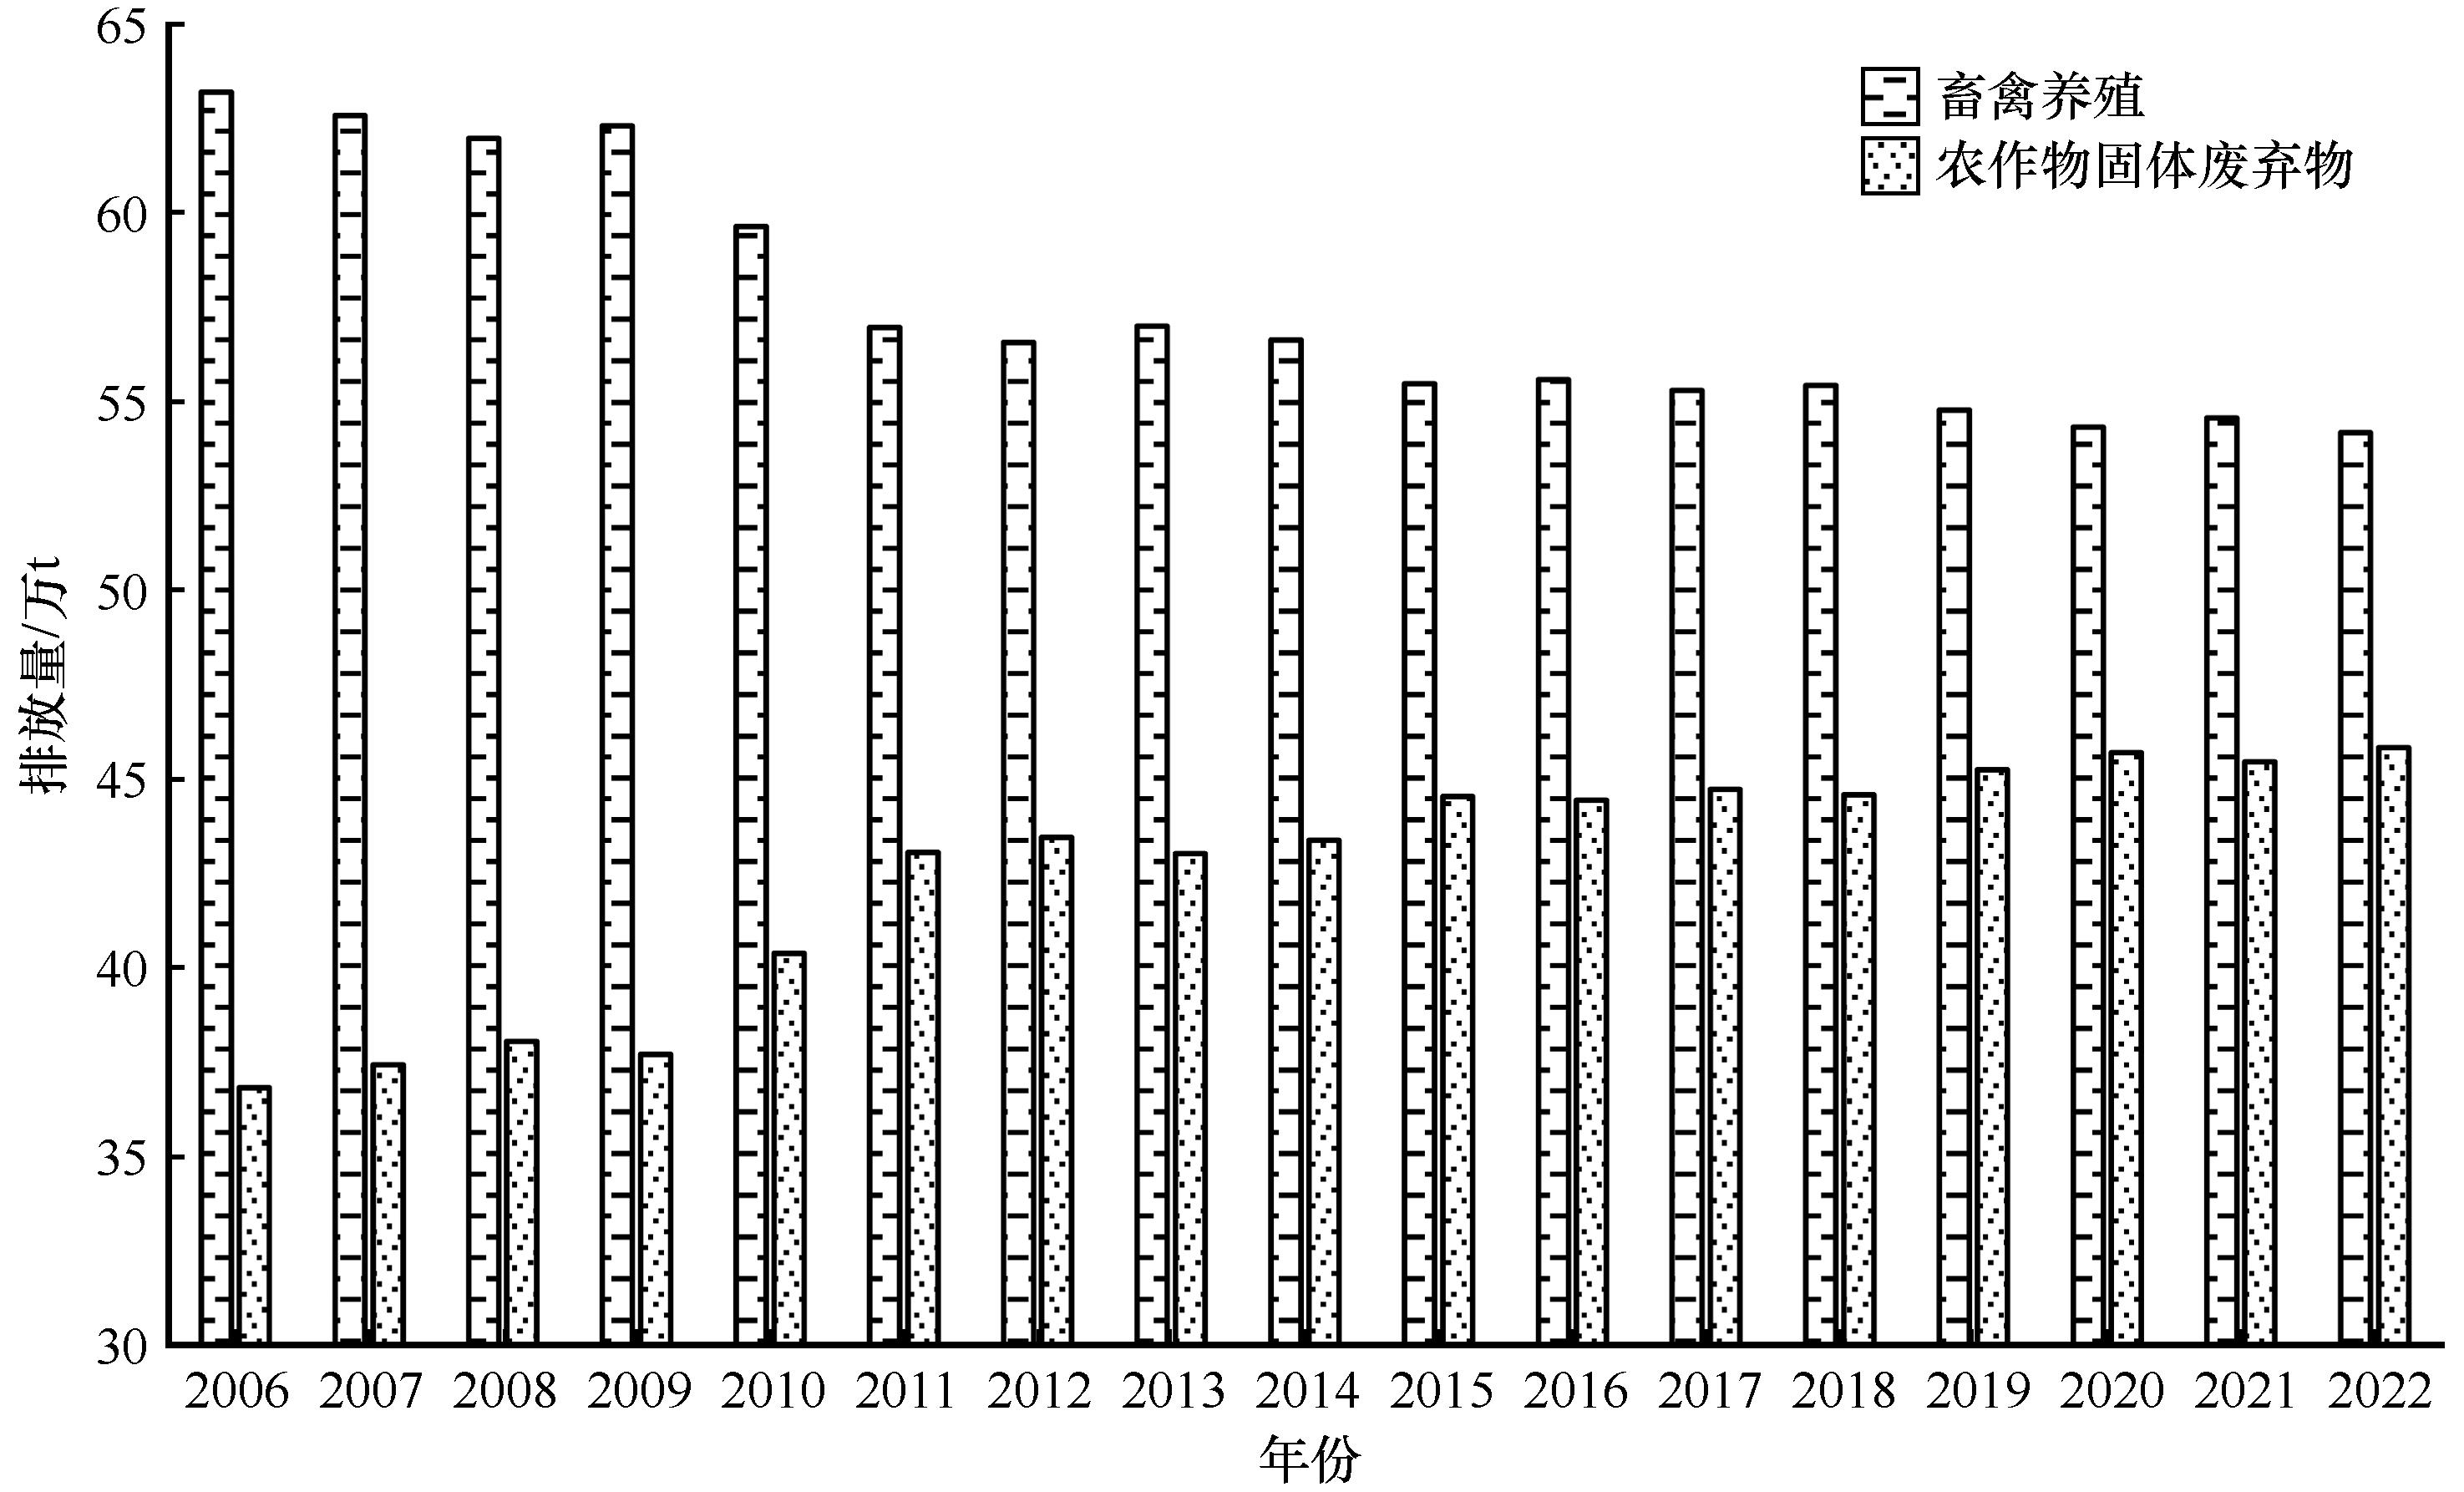
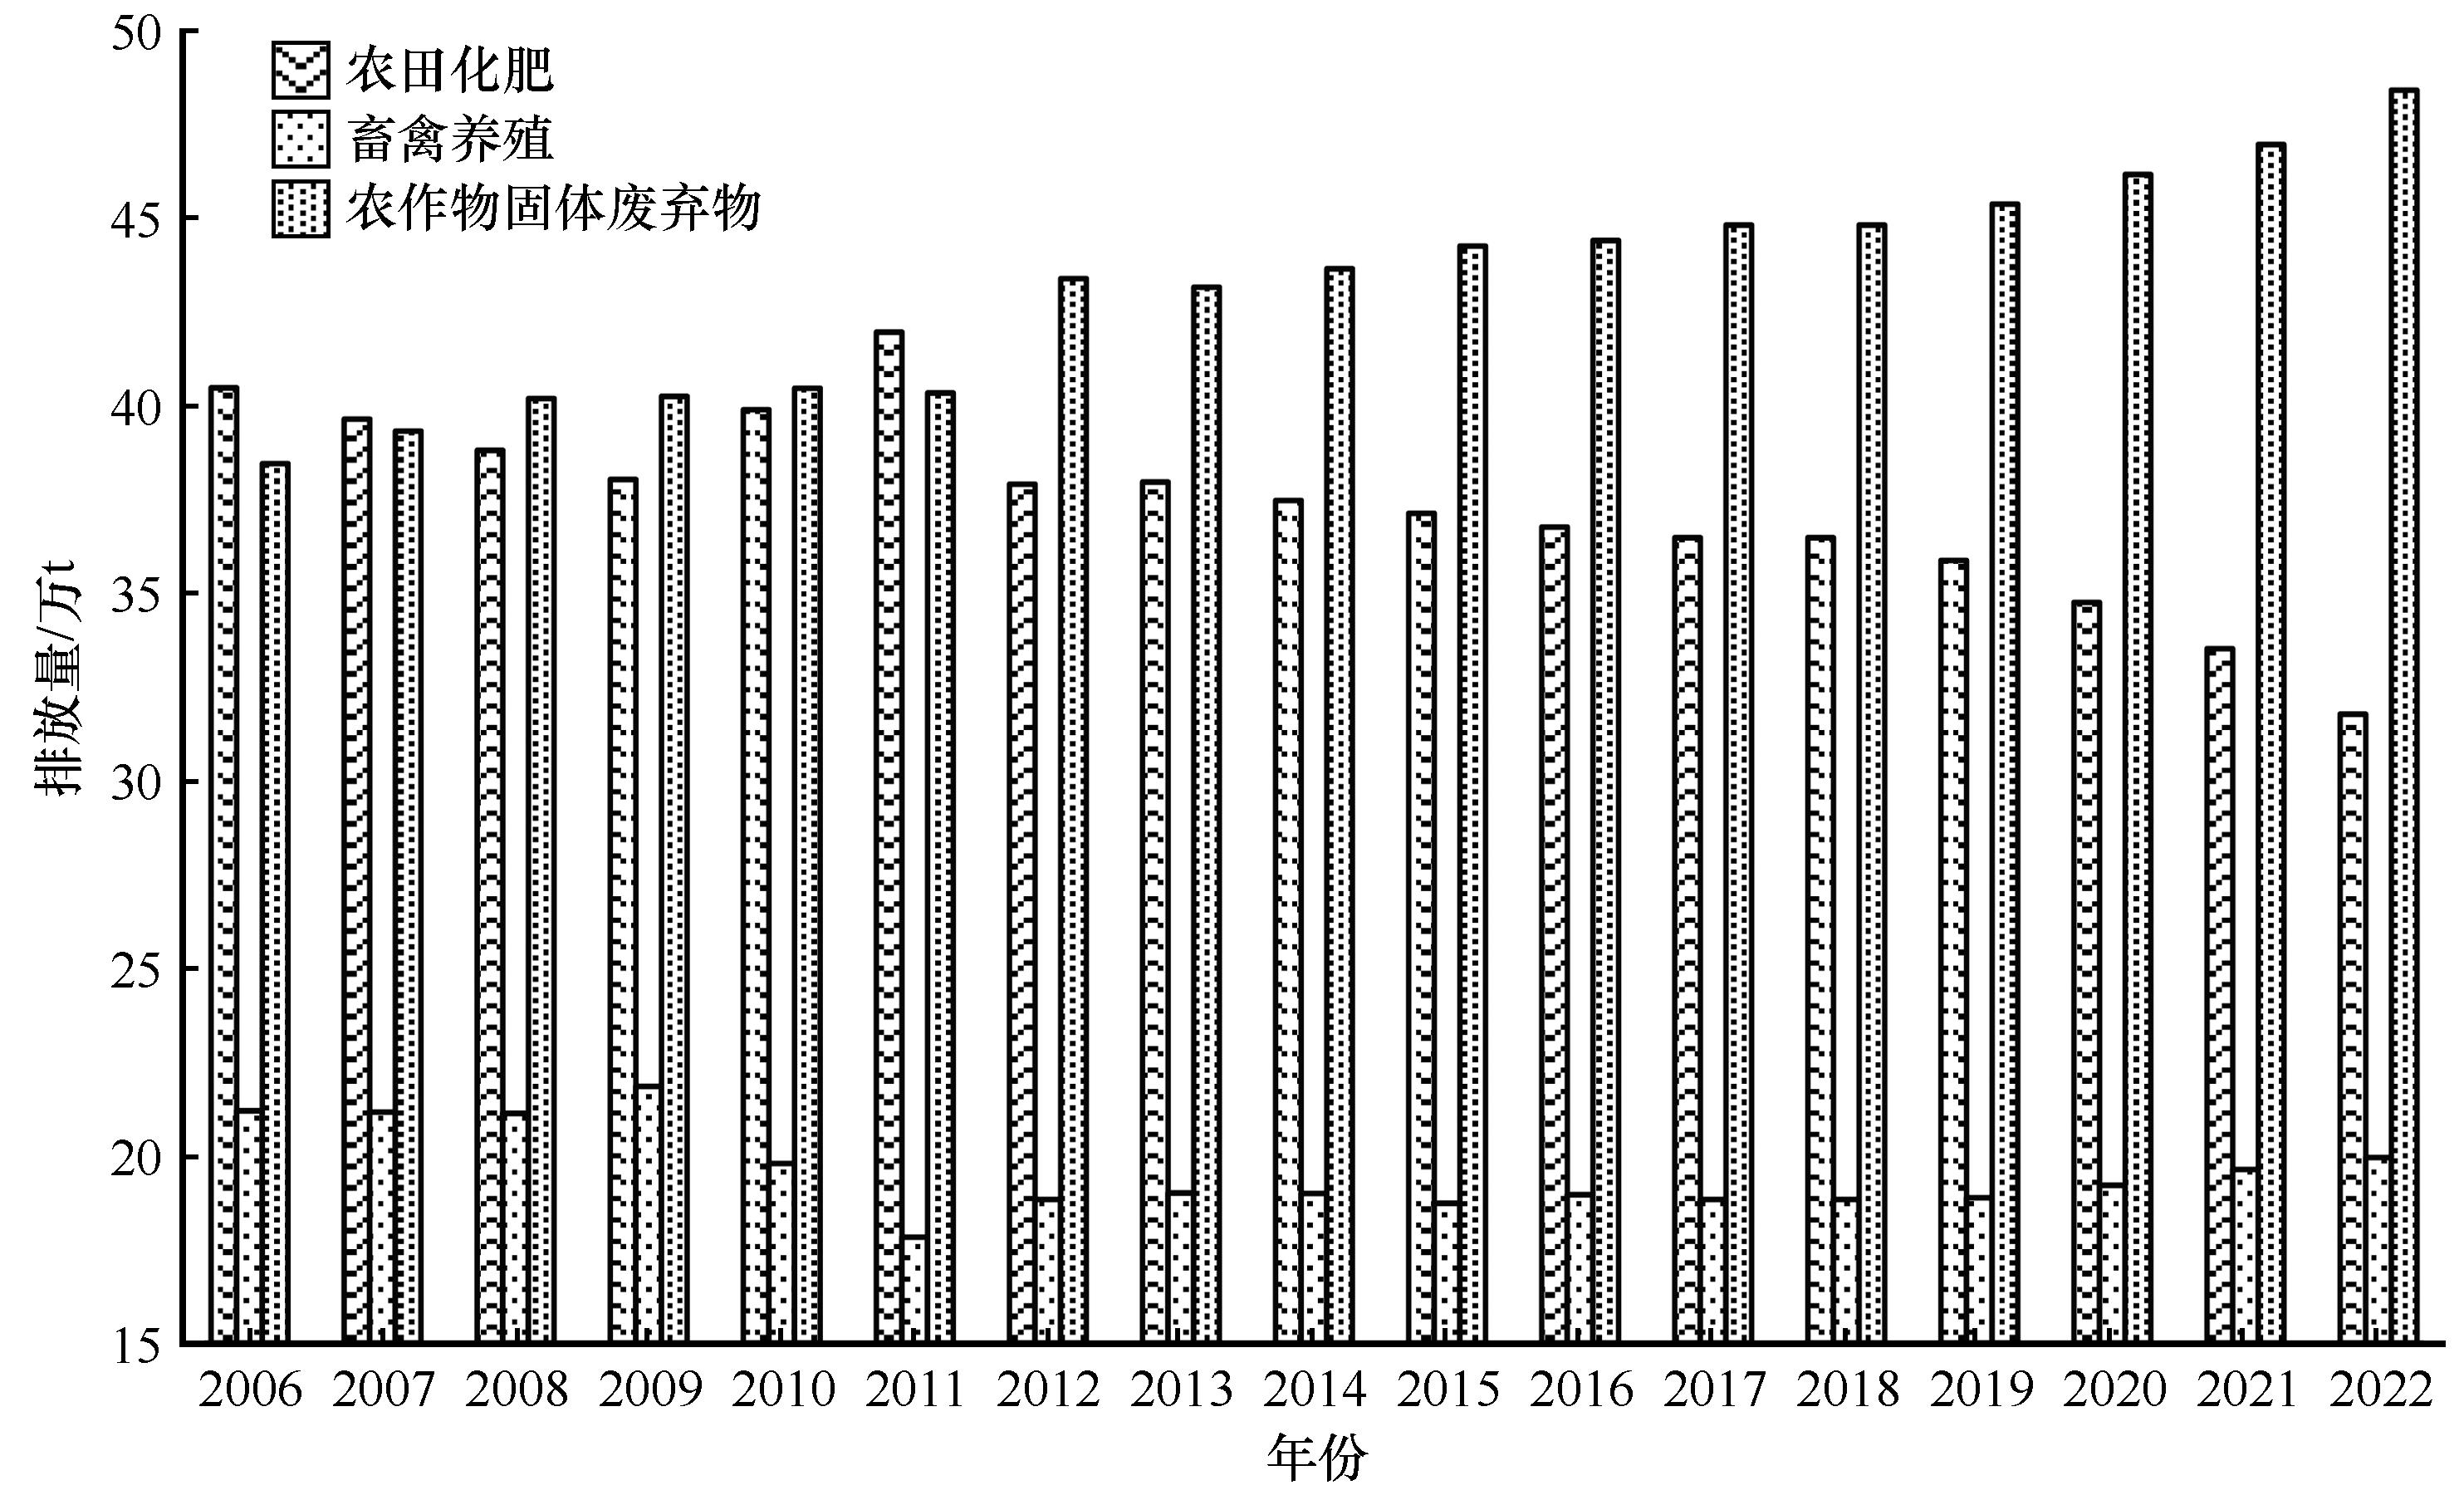
| 1 |
马军旗,乐章.中国农业面源污染的空间差异与影响因素分析[J].农业现代化研究,2021,42(6):1137-1145.
|
| 2 |
马恩朴,蔡建明,林静,等.近30年中国农业源氮磷排放的格局特征与水环境影响[J].自然资源学报,2021,36(3):752-770.
|
| 3 |
王建华,钭露露,王缘.环境规制政策情境下农业市场化对畜禽养殖废弃物资源化处理行为的影响分析[J].中国农村经济,2022(1):93-111.
|
| 4 |
David A.Economic evaluation of agricultural pollution control options for China[J].Journal of Integrative Agriculture,2015,14(6):1045-1056.
|
| 5 |
陶园,王少丽,管孝艳,等.青海省农业面源污染源特征分析[J].农业工程学报,2019,35(10):164-172.
|
| 6 |
孙曼,宋涛.甘肃省黄河流域科技创新与产业发展时空格局及协同发展模式[J].中国沙漠,2021,41(4):140-151.
|
| 7 |
贾陈忠,乔扬源.基于等标污染负荷法的山西省农业面源污染特征研究[J].中国农业资源与区划,2021,42(3):141-149.
|
| 8 |
姚玉璧,王润元,邓振镛,等.黄河上游主要产流区气候变化及其对水资源的影响:以甘南高原为例[J].中国沙漠,2007,27(5):903-909.
|
| 9 |
韩谞,潘保柱,陈越,等.黄河水环境特征与氮磷负荷时空分布[J].环境科学,2021,42(12):5786-5795.
|
| 10 |
程清平,钟方雷,左小安,等.美丽中国与联合国可持续发展目标(SDGs)结合的黑河流域水资源承载力评价[J].中国沙漠,2020,40(1):204-214.
|
| 11 |
李光勤,方徐兵.黄河流域绿色发展水平时空演变特征[J].中国沙漠,2021,41(4):129-139.
|
| 12 |
张郁,刘洁,杨青山.黑龙江垦区农业生产与面源污染的脱钩分析与调控模拟[J].经济地理,2017,37(6):177-182.
|
| 13 |
夏永秋,赵娣,严星,等.我国农业面源污染过程模拟的困境与展望[J].农业环境科学学报,2022,41(11):2327-2337.
|
| 14 |
陶园,徐静,任贺靖,等.黄河流域农业面源污染时空变化及因素分析[J].农业工程学报,2021,37(4):257-264.
|
| 15 |
谢晓琳,钱锋,赵健,等.流域农业面源污染防治科学问题与技术研发需求[J].环境科学学报,2023,43(12):152-157.
|
| 16 |
胡雪涛,陈吉宁,张天柱.非点源污染模型研究[J].环境科学,2002(3):124-128.
|
| 17 |
Mohammed H, Yohannes F, Zeleke G.Validation of agricultural non-point source pollution model in Kori watershed,South Wollo,Ethiopia[J].International Journal of Applied Earth Observation and Geoinformation,2004,6(2):97-109.
|
| 18 |
陈玉成,杨志敏,陈庆华.基于“压力-响应”态势的重庆市农业面源污染的源解析[J].中国农业科学,2008,41(8):2362-2369.
|
| 19 |
李海鹏,张俊彪.中国农业面源污染与经济发展关系的实证研究[J].长江流域资源与环境,2009(6):585-590.
|
| 20 |
葛继红,周曙东.农业面源污染的经济影响因素分析:基于1978-2009年的江苏省数据[J].中国农村经济,2011(5):72-81.
|
| 21 |
赖斯芸,杜鹏飞,陈吉宁.基于单元分析的非点源污染调查评估方法[J].清华大学学报(自然科学版),2004(9):1184-1187.
|
| 22 |
陈敏鹏,陈吉宁,赖斯芸.中国农业和农村污染的清单分析与空间特征识别[J].中国环境科学,2006(6):751-755.
|
| 23 |
张维理,武淑霞,冀宏杰.中国农业面源污染形势估计及控制对策 Ⅰ. 21世纪初期中国农业面源污染的形势估计[J].中国农业科学,2004,37(7):1008-1017.
|
| 24 |
梁流涛,冯舒怡,曲福田.农业面源污染形成机制:理论与实证[J].中国人口·资源与环境,2010(4):74-80.
|
| 25 |
汪慧玲,卢锦培,白婧.中国农业污染物影子价格及其污染成本研究[J].吉林大学社会科学学报,2014,54(5):40-48.
|
| 26 |
吴义根,冯开文,李谷成.人口增长、结构调整与农业面源污染:基于空间面板STIRPAT模型的实证研究[J].农业技术经济,2017(3):75-87.
|
| 27 |
徐新悦,岳梦凡,李建国,等.滨海地区畜禽养殖户污染防治意愿影响因素及其响应机理:以盐城市为例[J].自然资源学报,2019,34(9):1974-1986.
|
| 28 |
虞慧怡,扈豪,曾贤刚.我国农业面源污染的时空分异研究[J].干旱区资源与环境,2015,29(9):1-6.
|
| 29 |
史常亮,李赟,朱俊峰.劳动力转移、化肥过度使用与面源污染[J].中国农业大学学报,2016,21(5):169-180.
|
| 30 |
吴义根,冯开文,李谷成.我国农业面源污染的时空分异与动态演进[J].中国农业大学学报,2017,22(7):184-197.
|
 ), 牛雯琦1, 王江姣2(

 甘公网安备 62010202000688号