Lusheng Ding. Observation and numerical simulation of the protective effect of the reed-bundle sand control system along the Golmud-Korla Railway[J]. Journal of Desert Research, 2024, 44(3): 42-50.
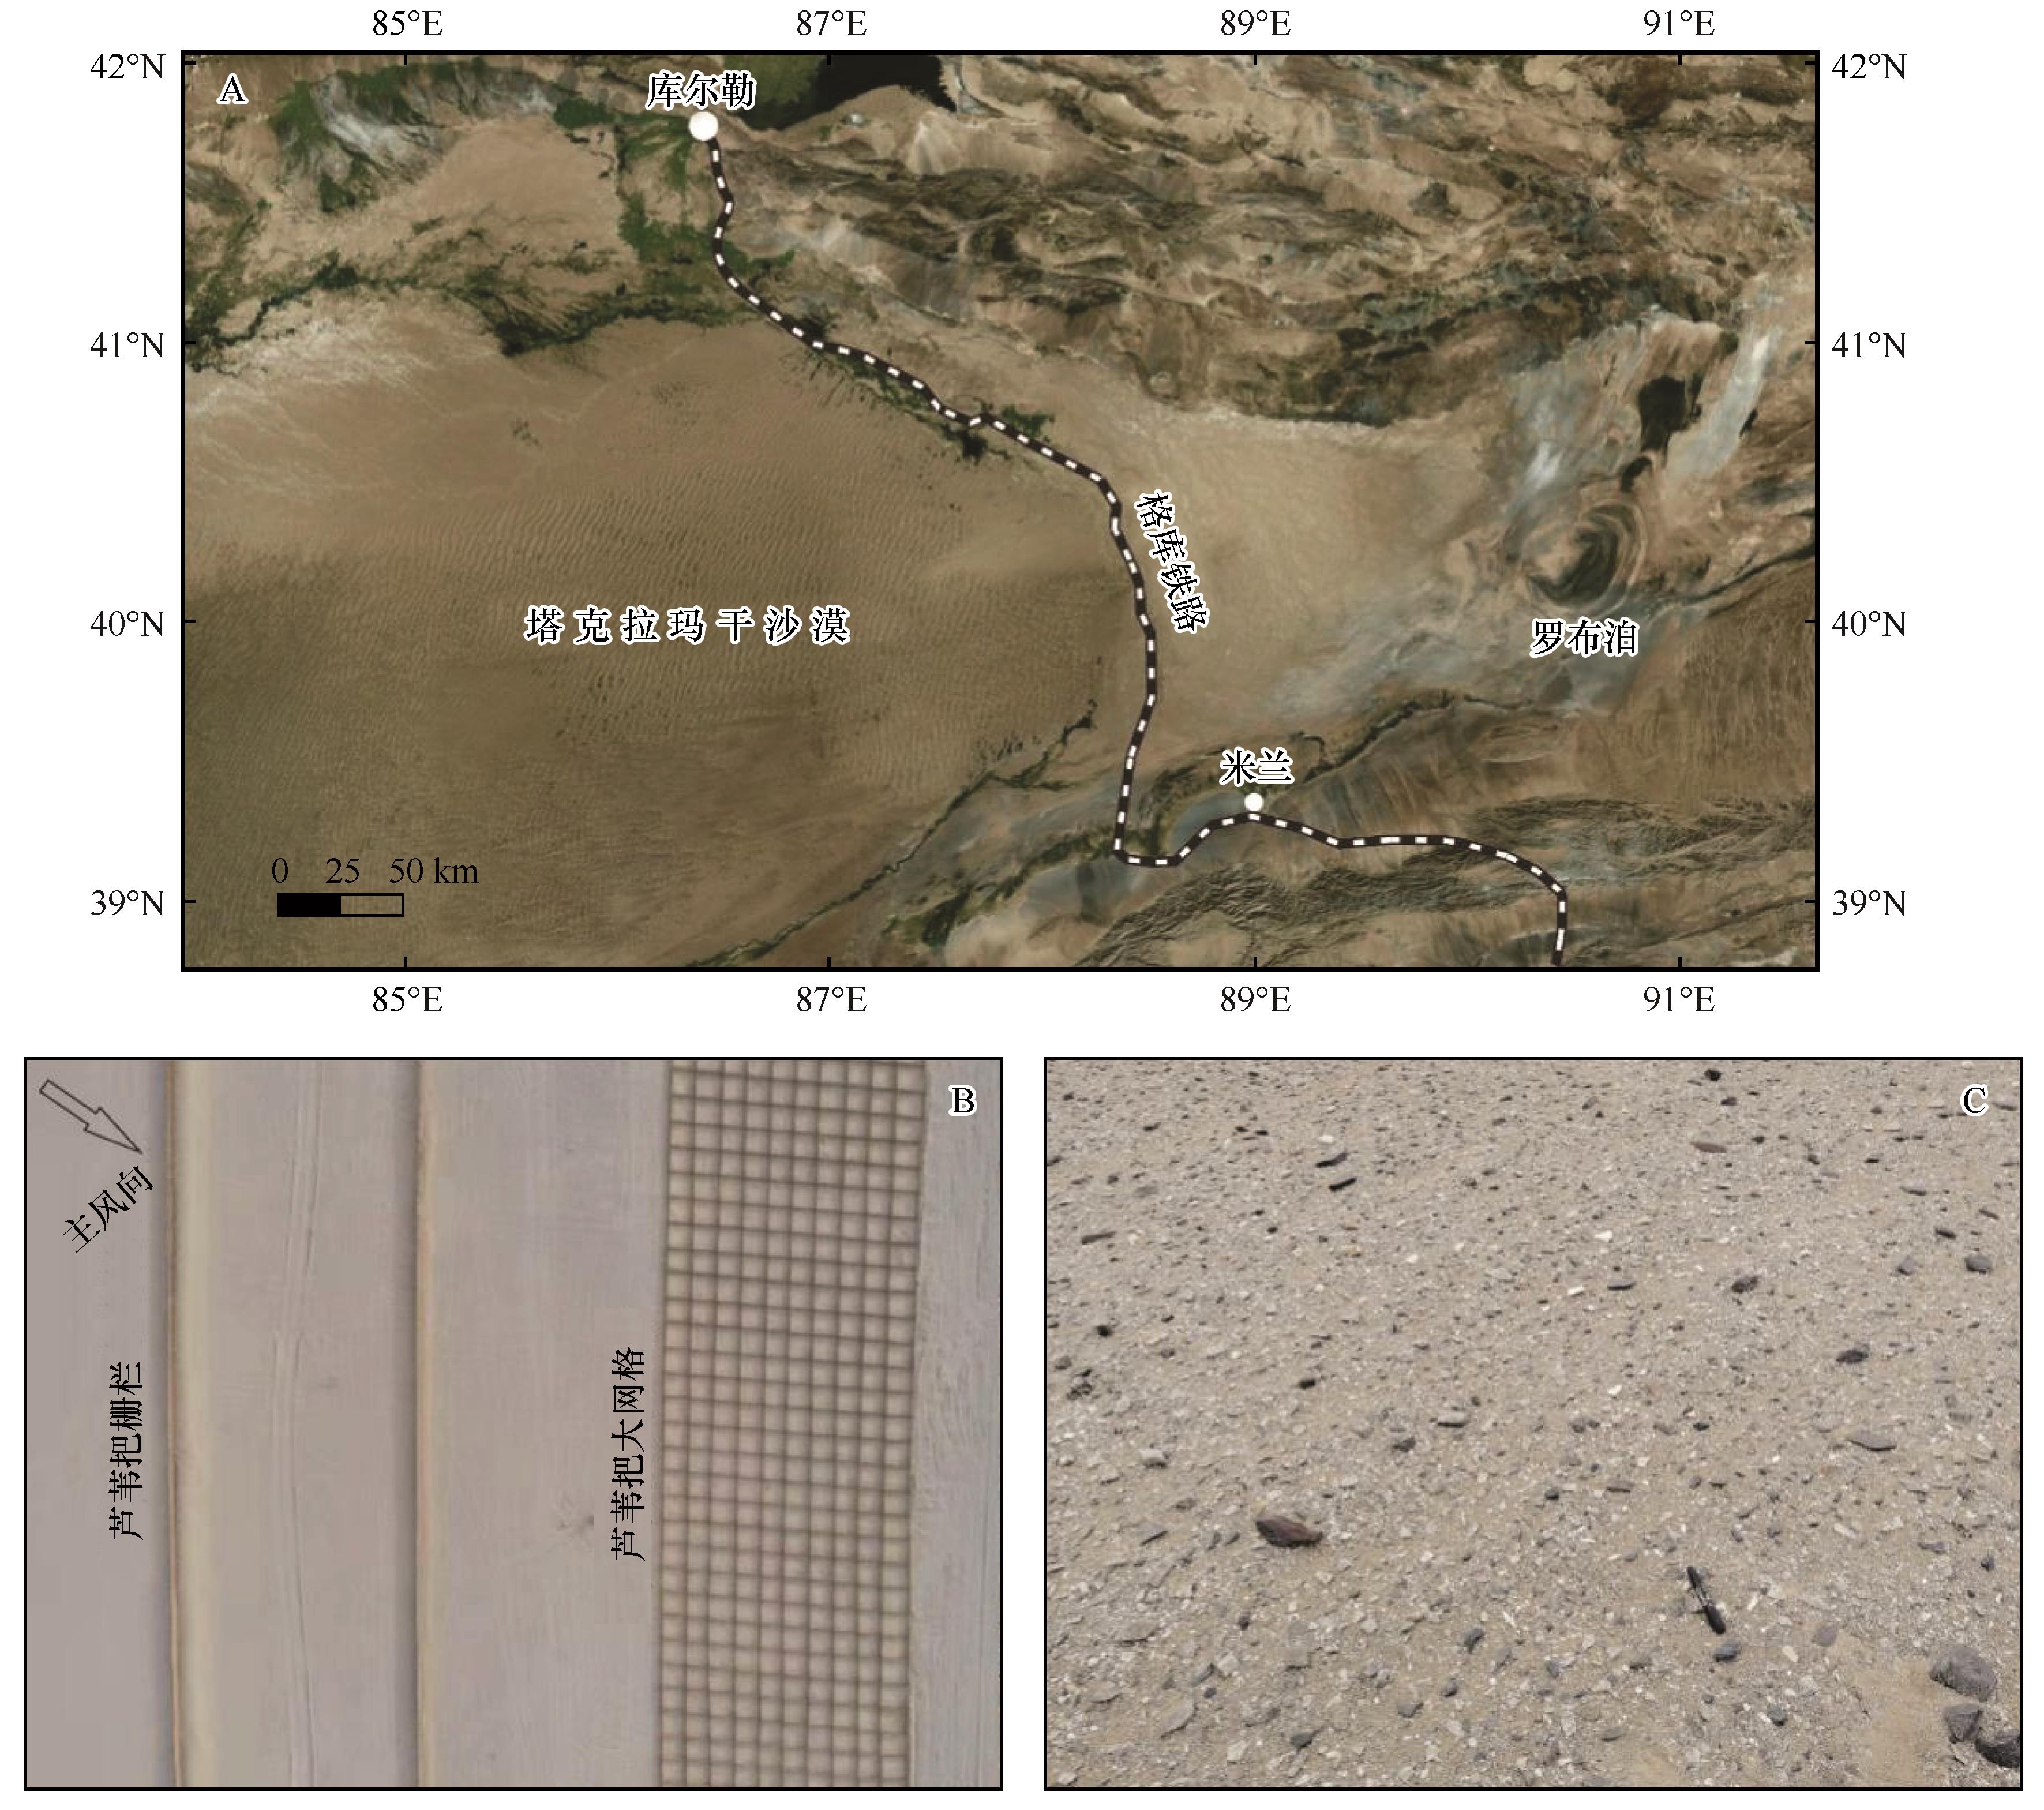
Fig.1 Schematic diagram of the Xinjiang section of the Golmud-Korla Railway (A), aerial photograph of the reed-bundle sand control system (B) and gobi surface photo (C) in the gobi area of Milan along the Golmud-Korla Railway
Fig.1 Schematic diagram of the Xinjiang section of the Golmud-Korla Railway (A), aerial photograph of the reed-bundle sand control system (B) and gobi surface photo (C) in the gobi area of Milan along the Golmud-Korla Railway
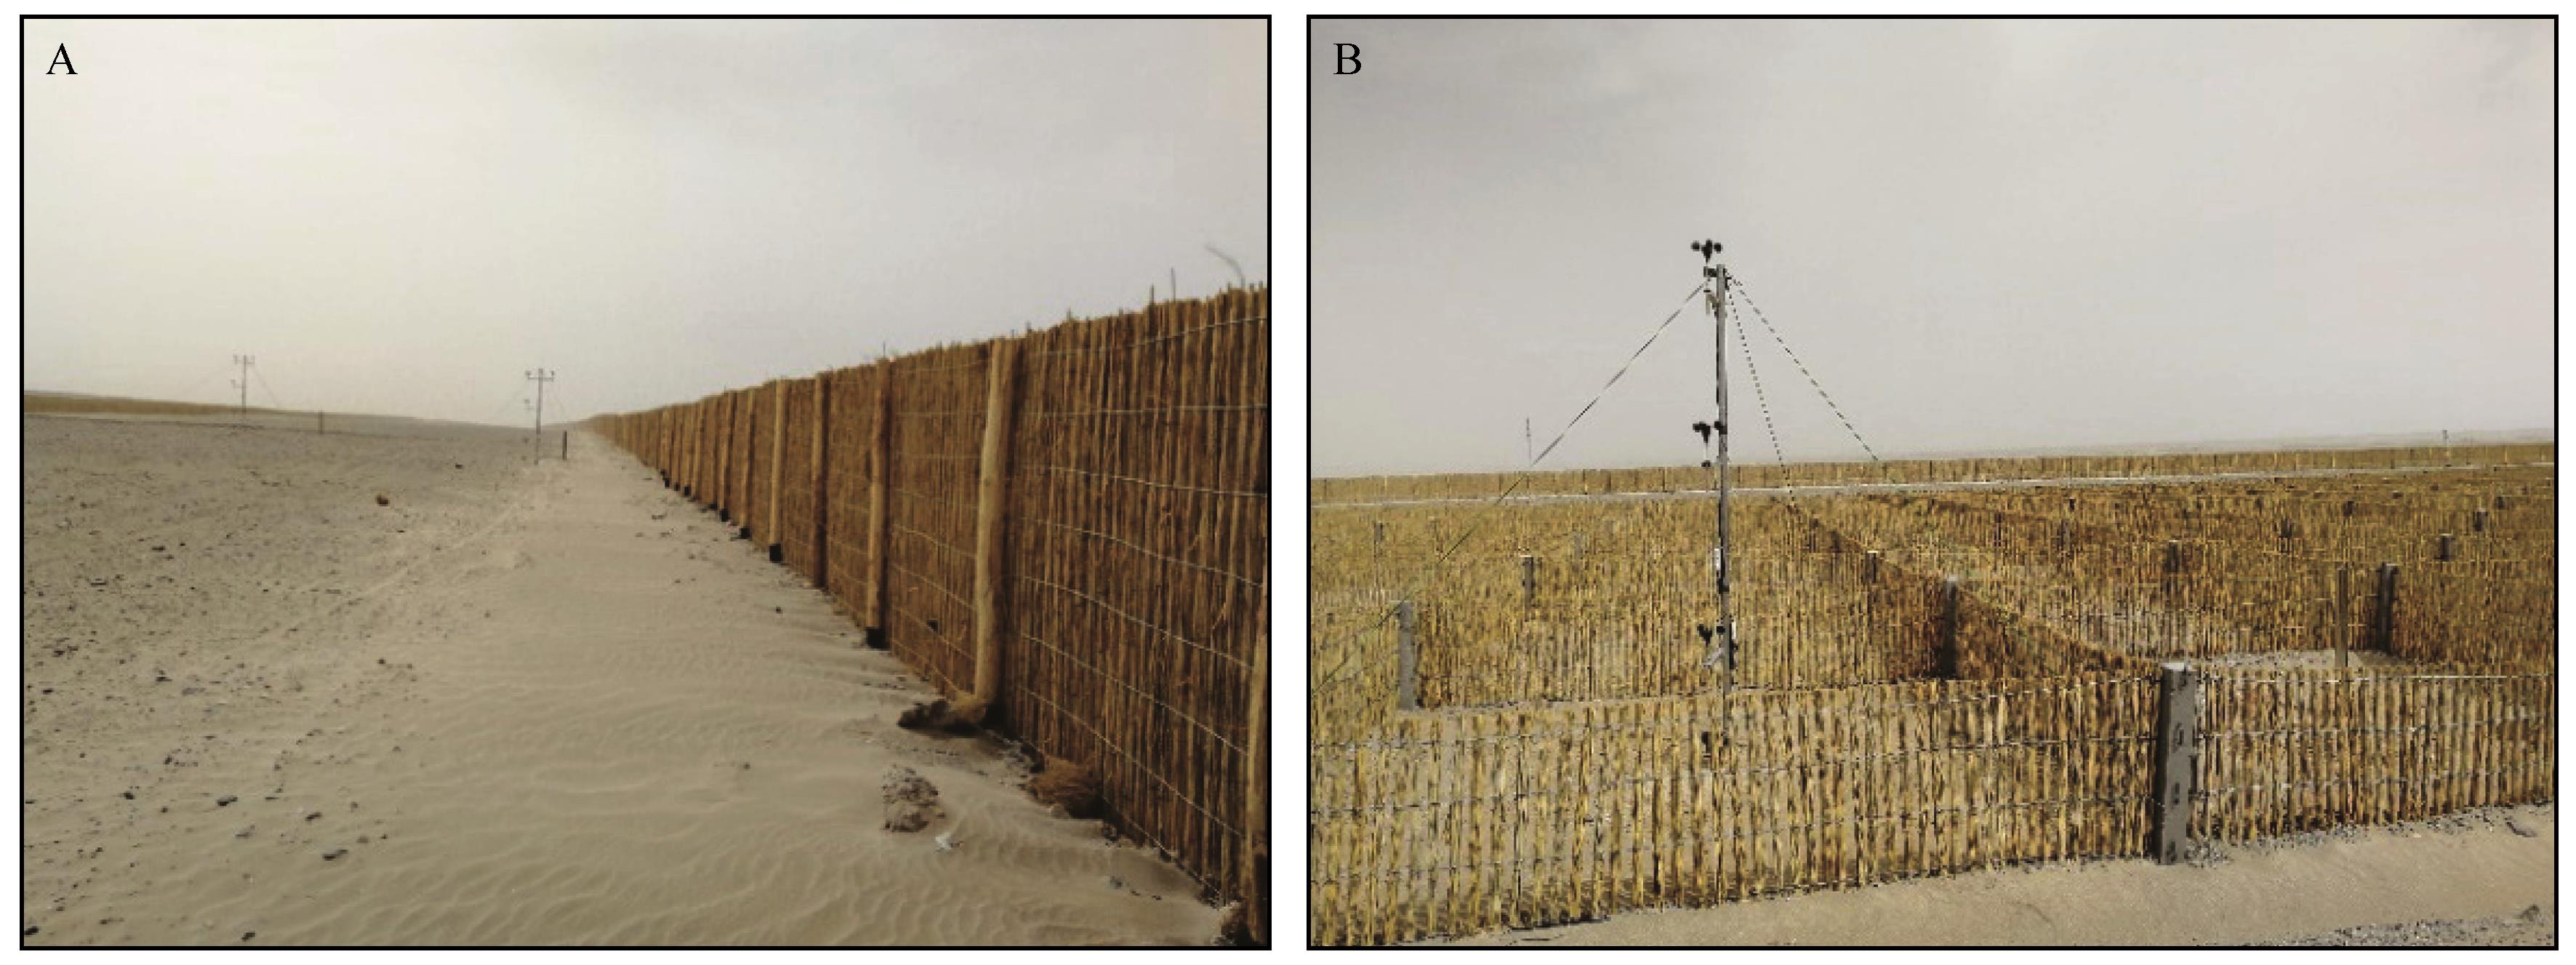
Fig.2 Observation of the flow field and sand transport rate of reed-bundle sand fences (A) and large reed checkerboards (B) in Milan gobi area of the Golmud-Korla Railway
Fig.2 Observation of the flow field and sand transport rate of reed-bundle sand fences (A) and large reed checkerboards (B) in Milan gobi area of the Golmud-Korla Railway
Fig.3 Numerical simulation domain and boundary condition setting (A), model setting (B) and grid division (C)
Fig.3 Numerical simulation domain and boundary condition setting (A), model setting (B) and grid division (C)
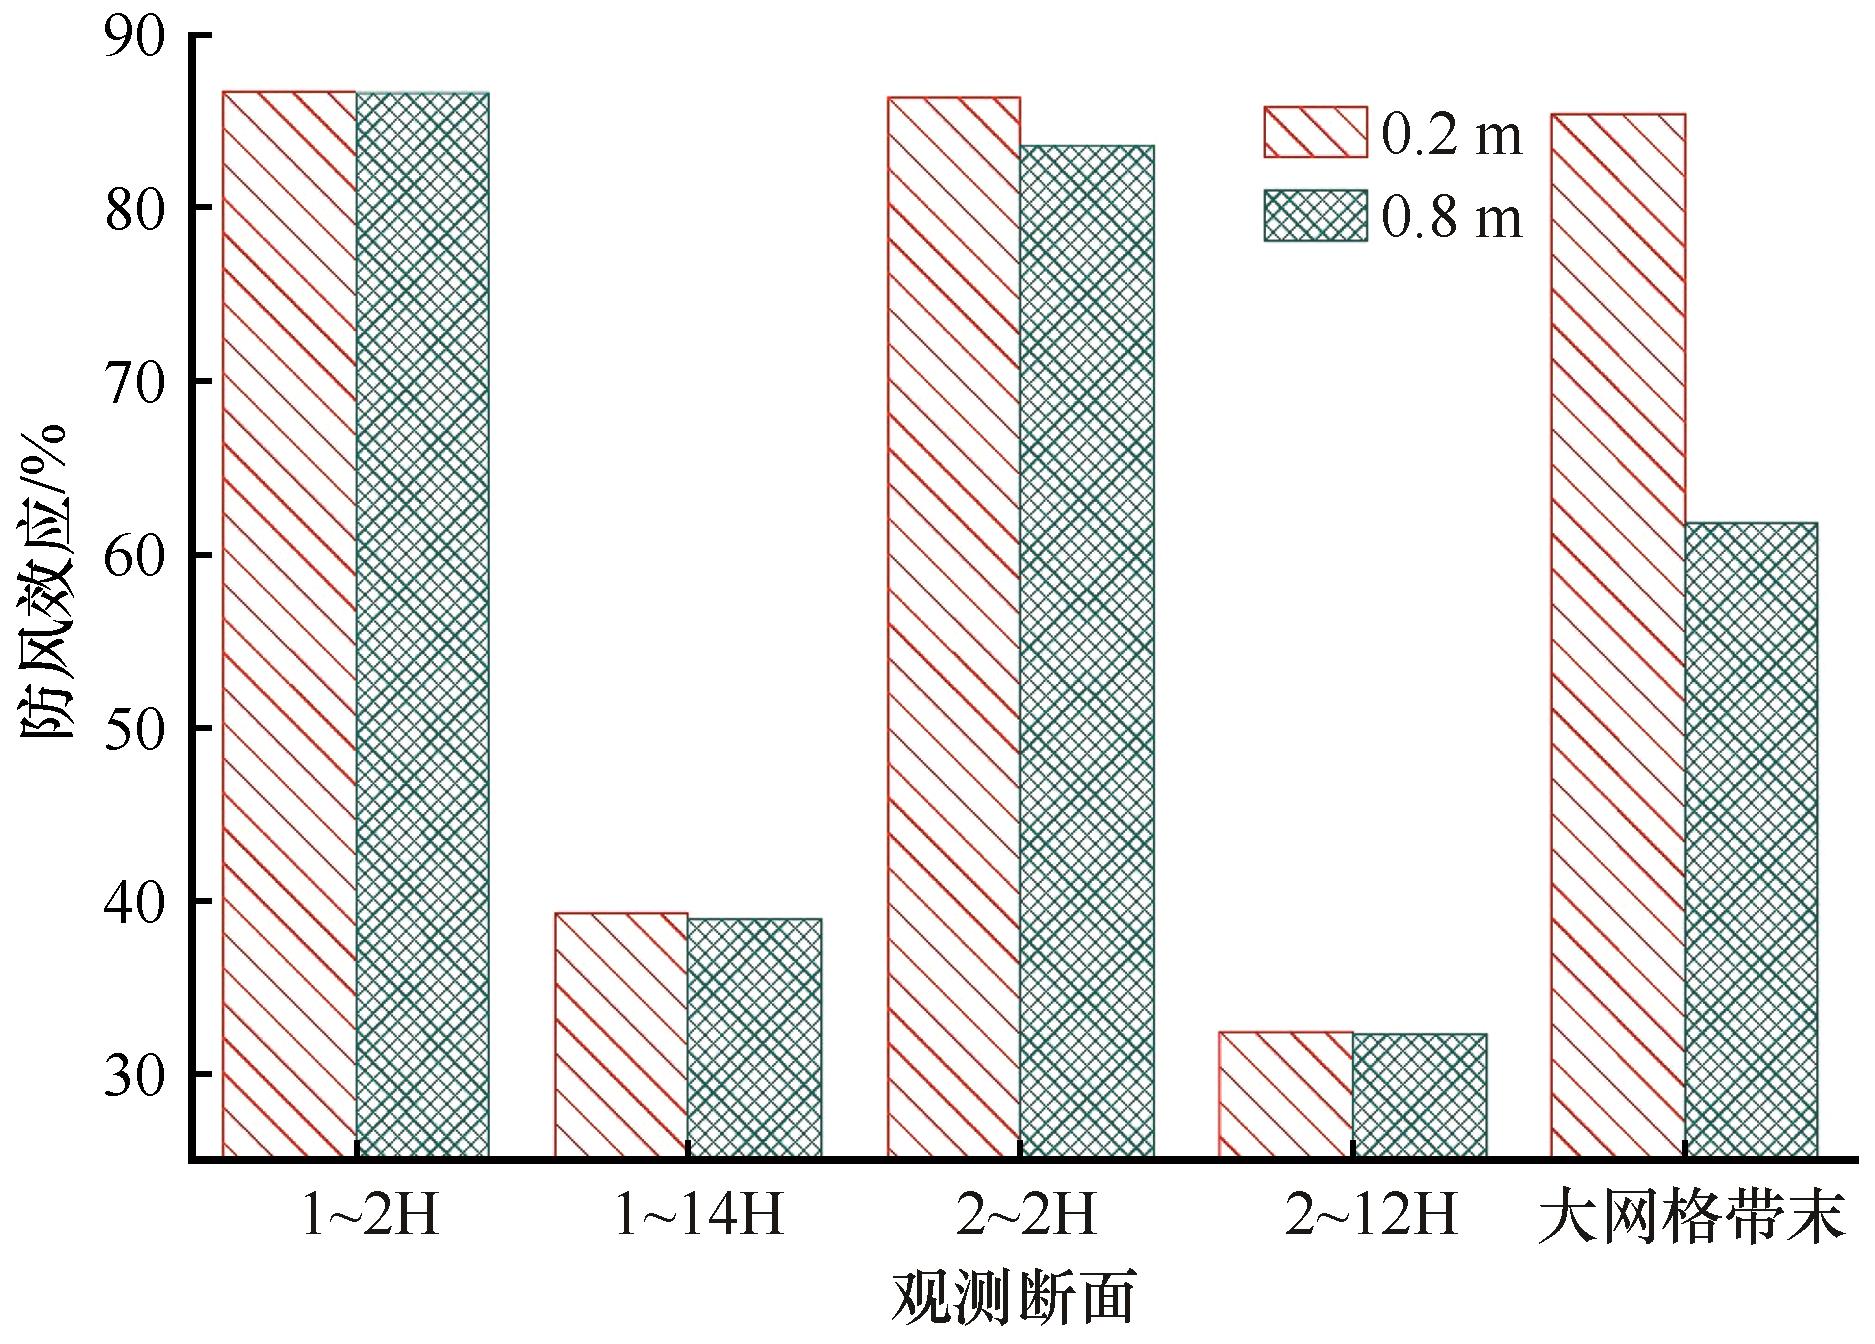
Fig.4 Variation of wind protection effect of sand control system along the observed section
Fig.4 Variation of wind protection effect of sand control system along the observed section
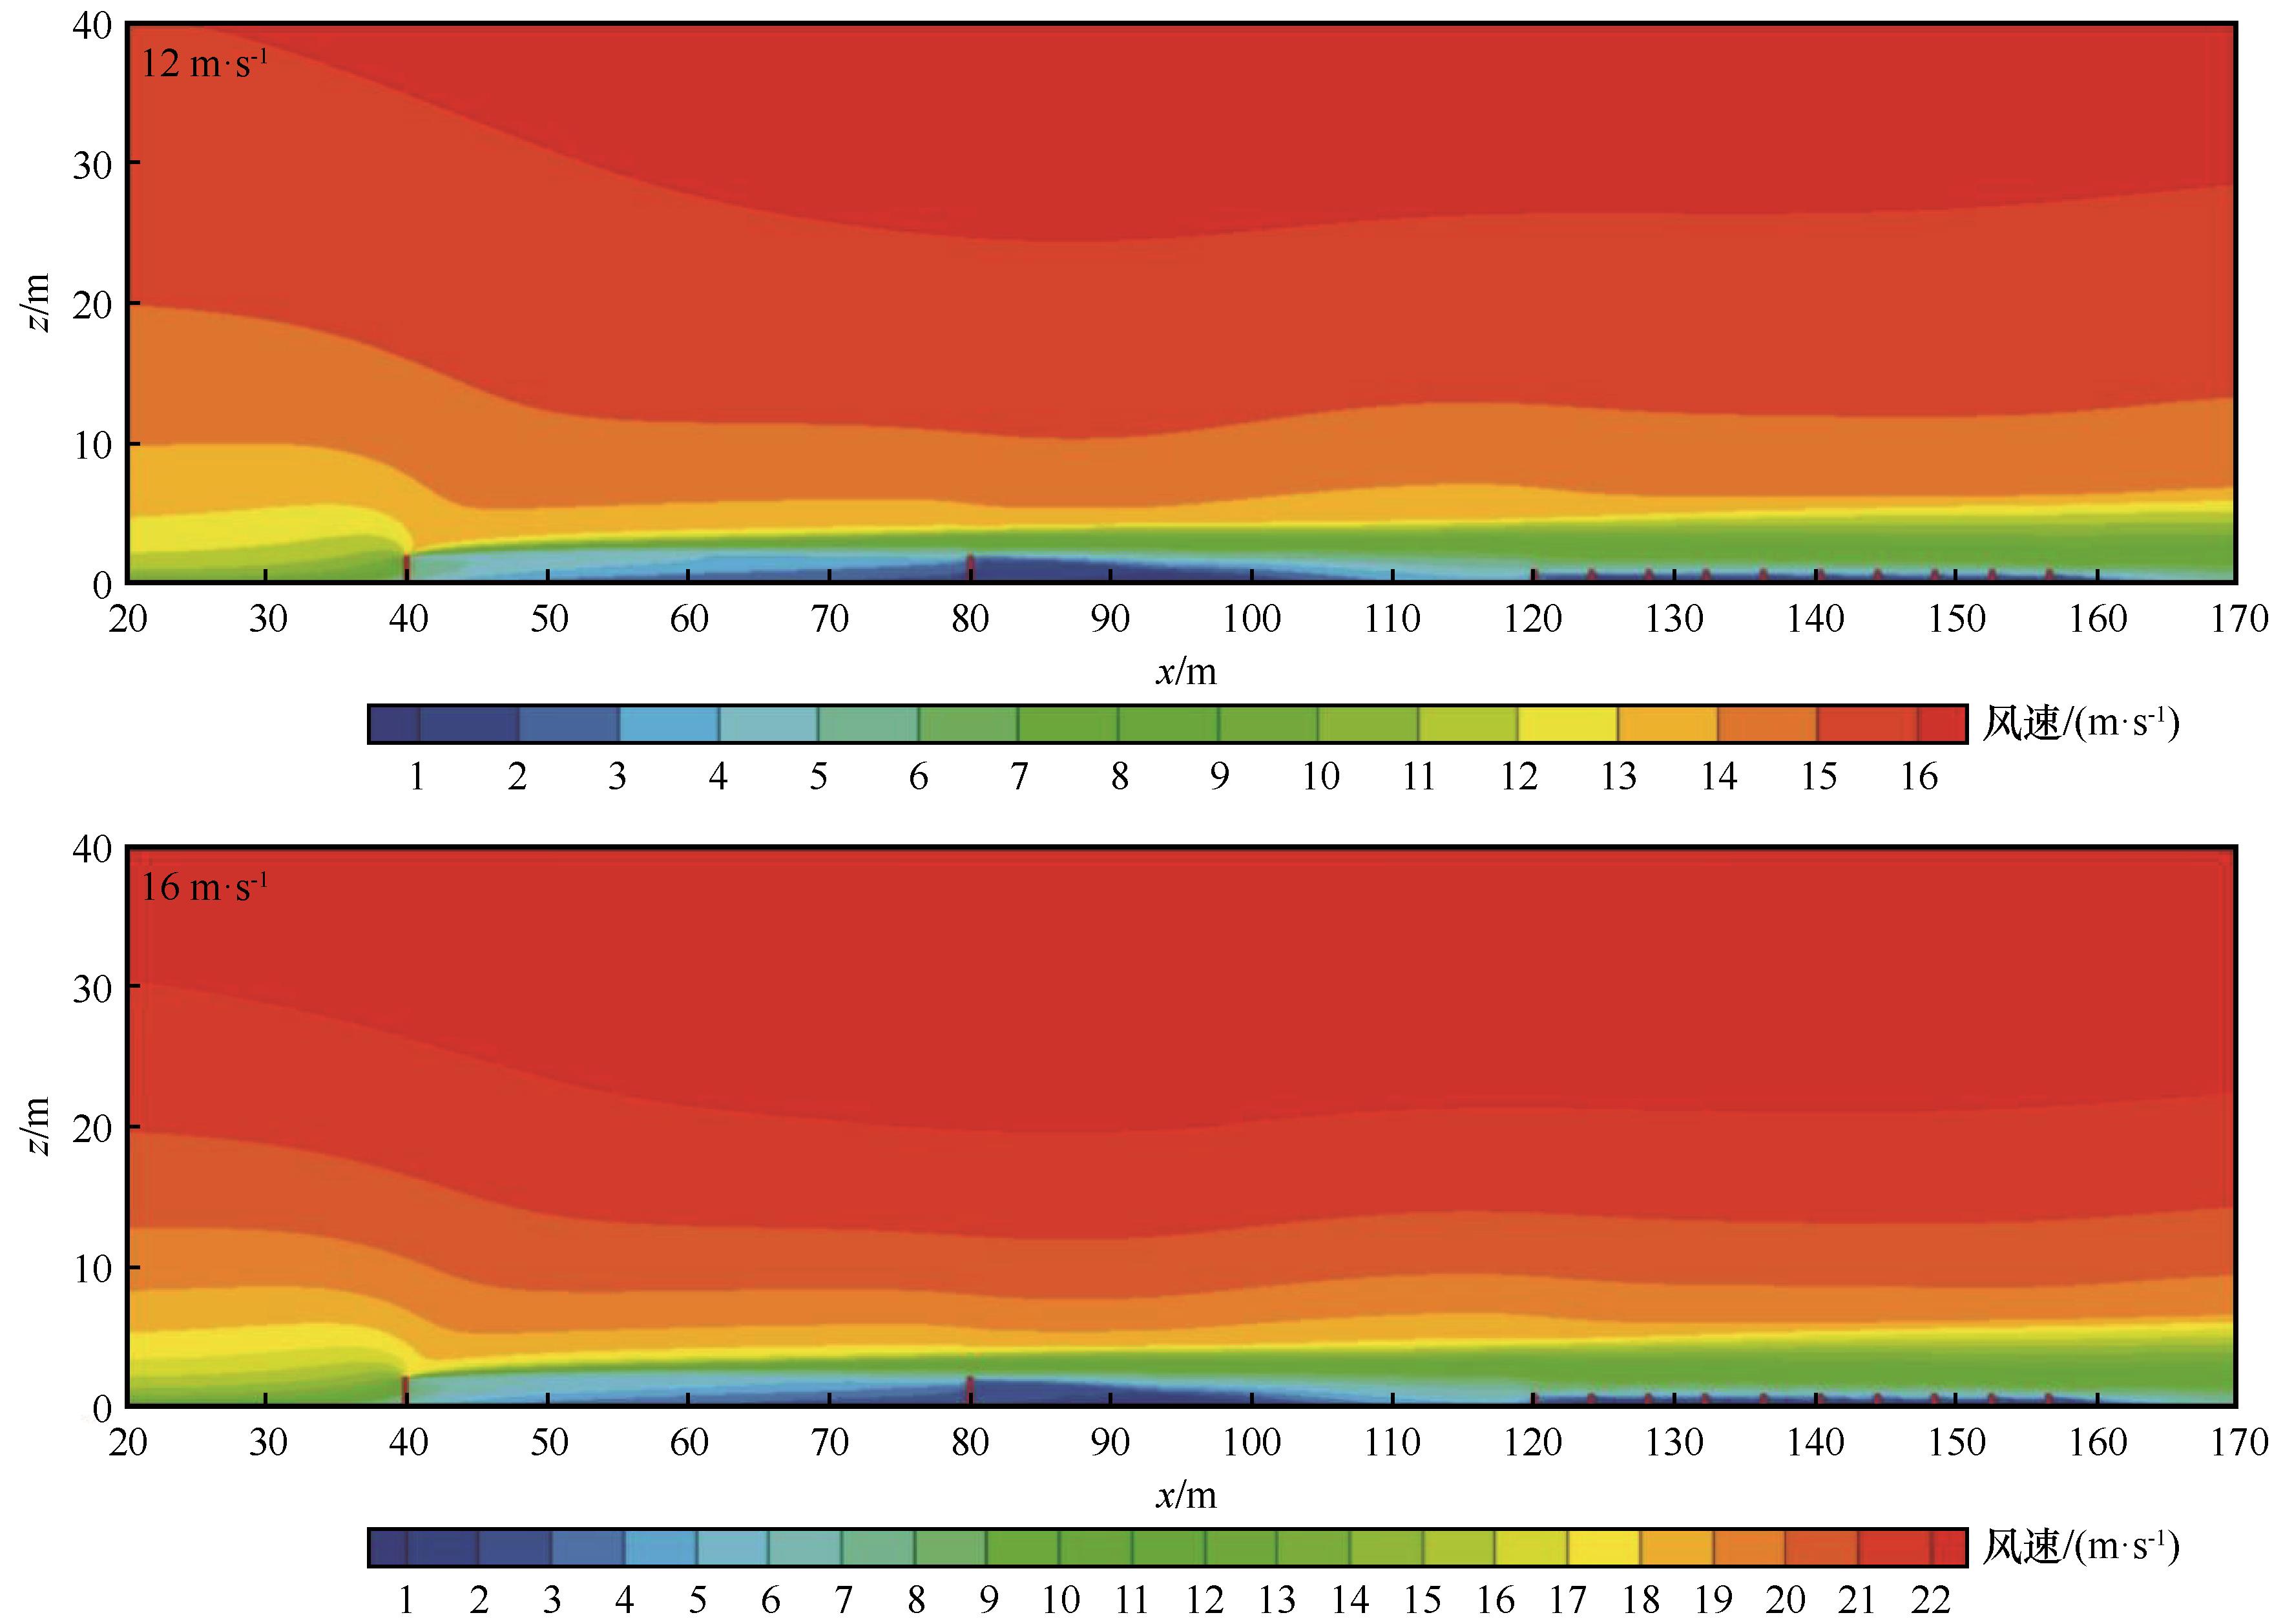
Fig.5 Flow field cloud image of the reed-bundle sand control system under inlet wind speeds of 12 m·s-1 and 16 m·s-1
Fig.5 Flow field cloud image of the reed-bundle sand control system under inlet wind speeds of 12 m·s-1 and 16 m·s-1
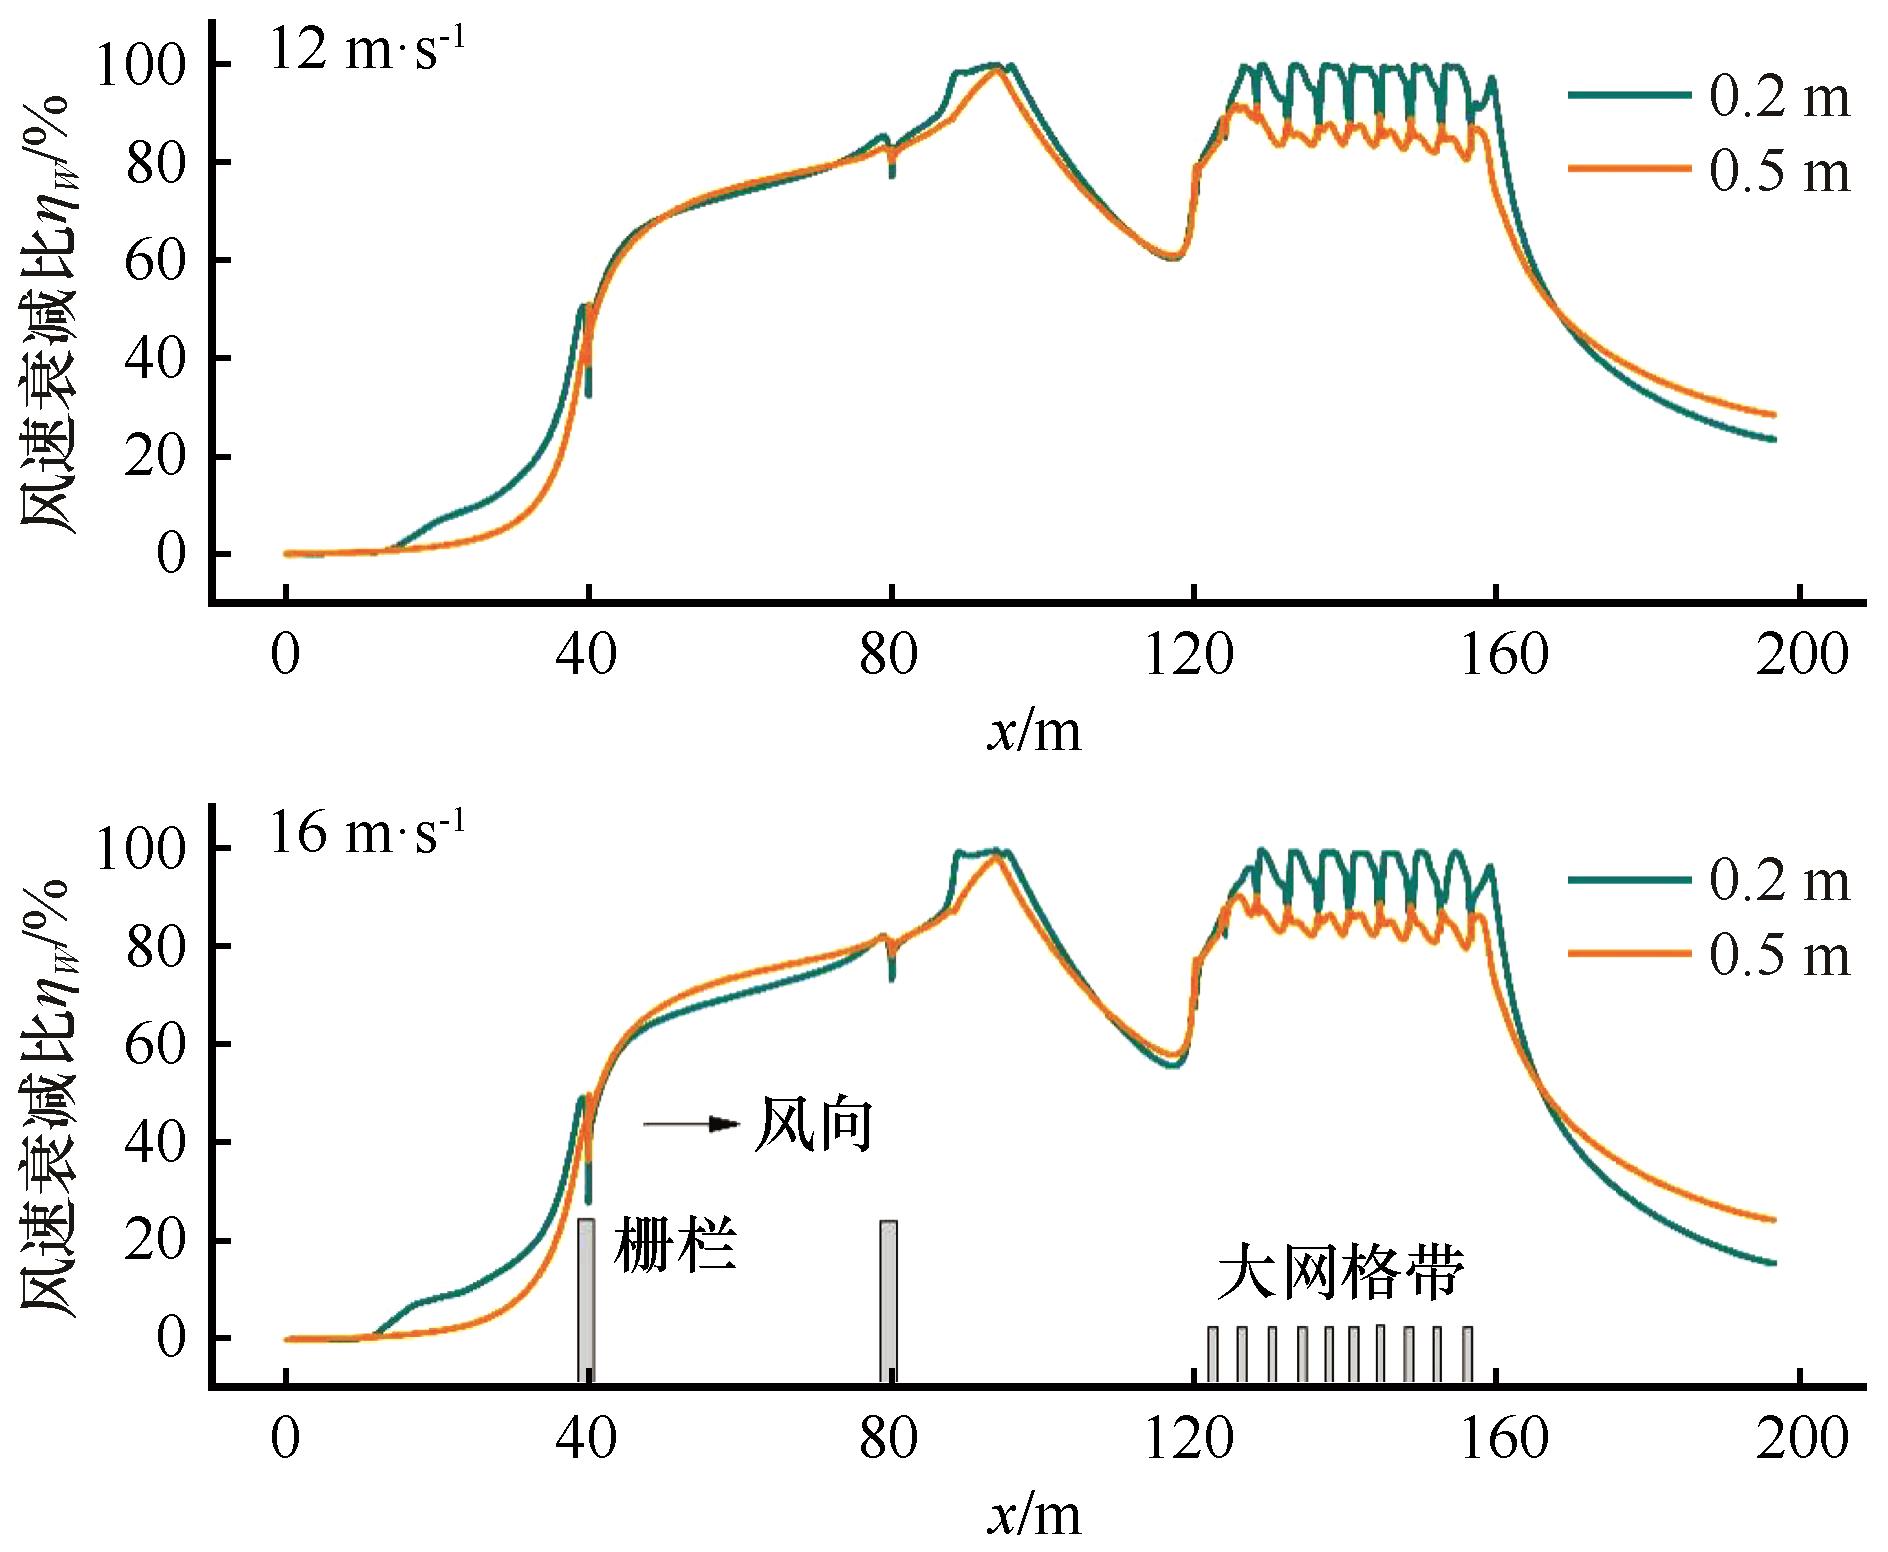
Fig.6 Wind speed reduction ratio of the reed-bundle sand control system under inlet wind speeds of 12 m·s-1 and 16 m·s-1
Fig.6 Wind speed reduction ratio of the reed-bundle sand control system under inlet wind speeds of 12 m·s-1 and 16 m·s-1
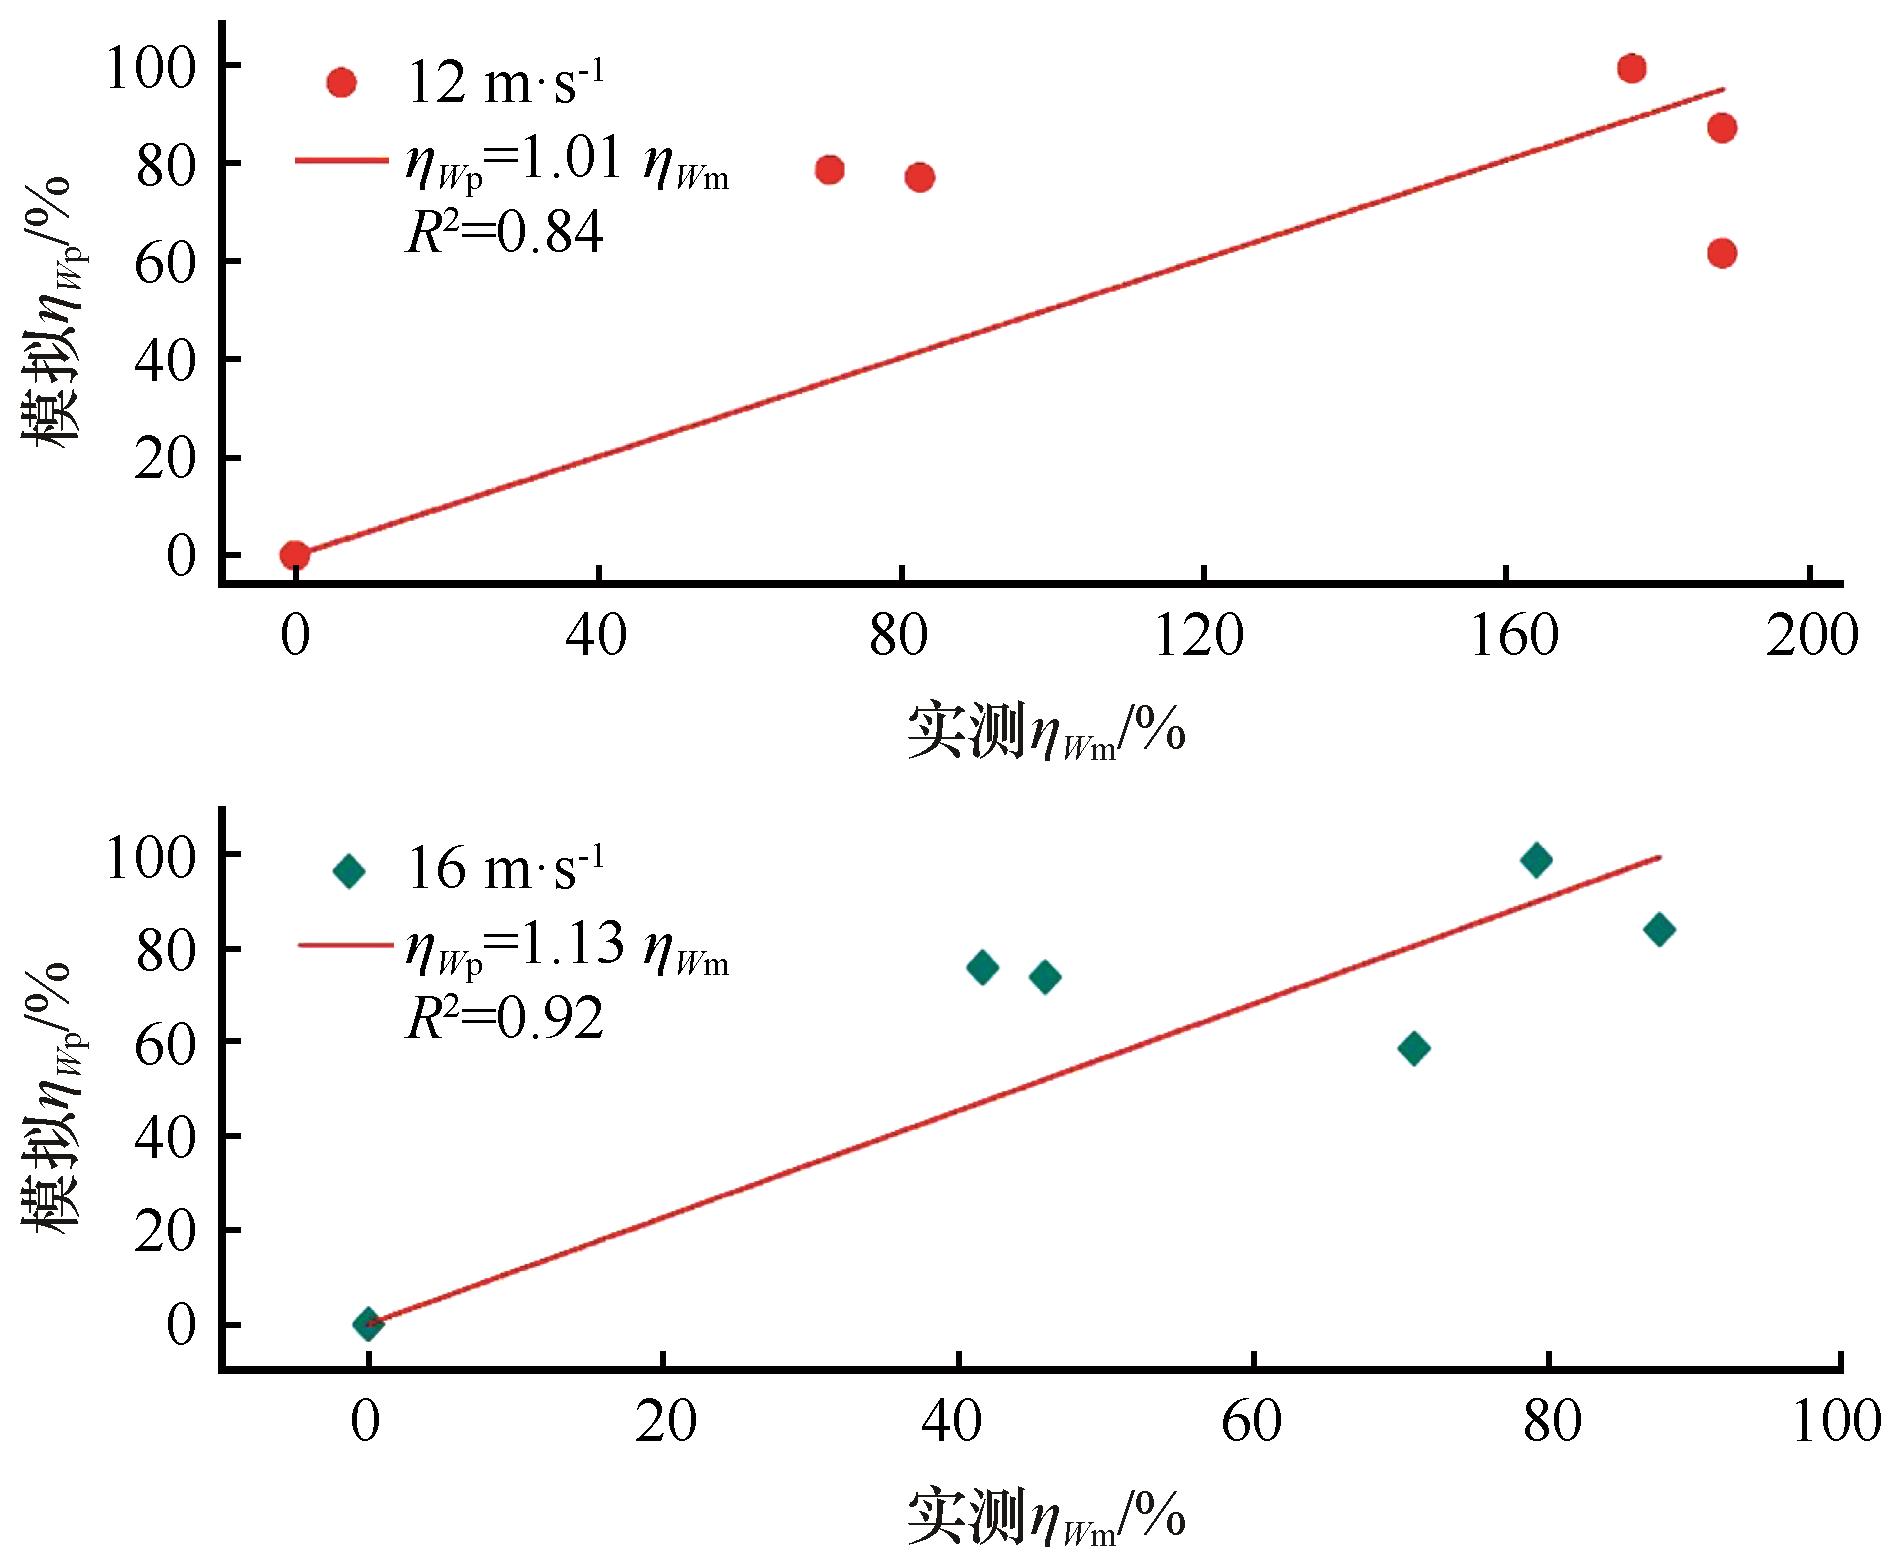
Fig.7 Comparison of wind speed attenuation ratio at 0.2 m height between numerical simulation and observation
Fig.7 Comparison of wind speed attenuation ratio at 0.2 m height between numerical simulation and observation
Fig.8 Variation of the sand flux (A) and sand control efficiency (B) along the observed section of the sand control system
Fig.8 Variation of the sand flux (A) and sand control efficiency (B) along the observed section of the sand control system
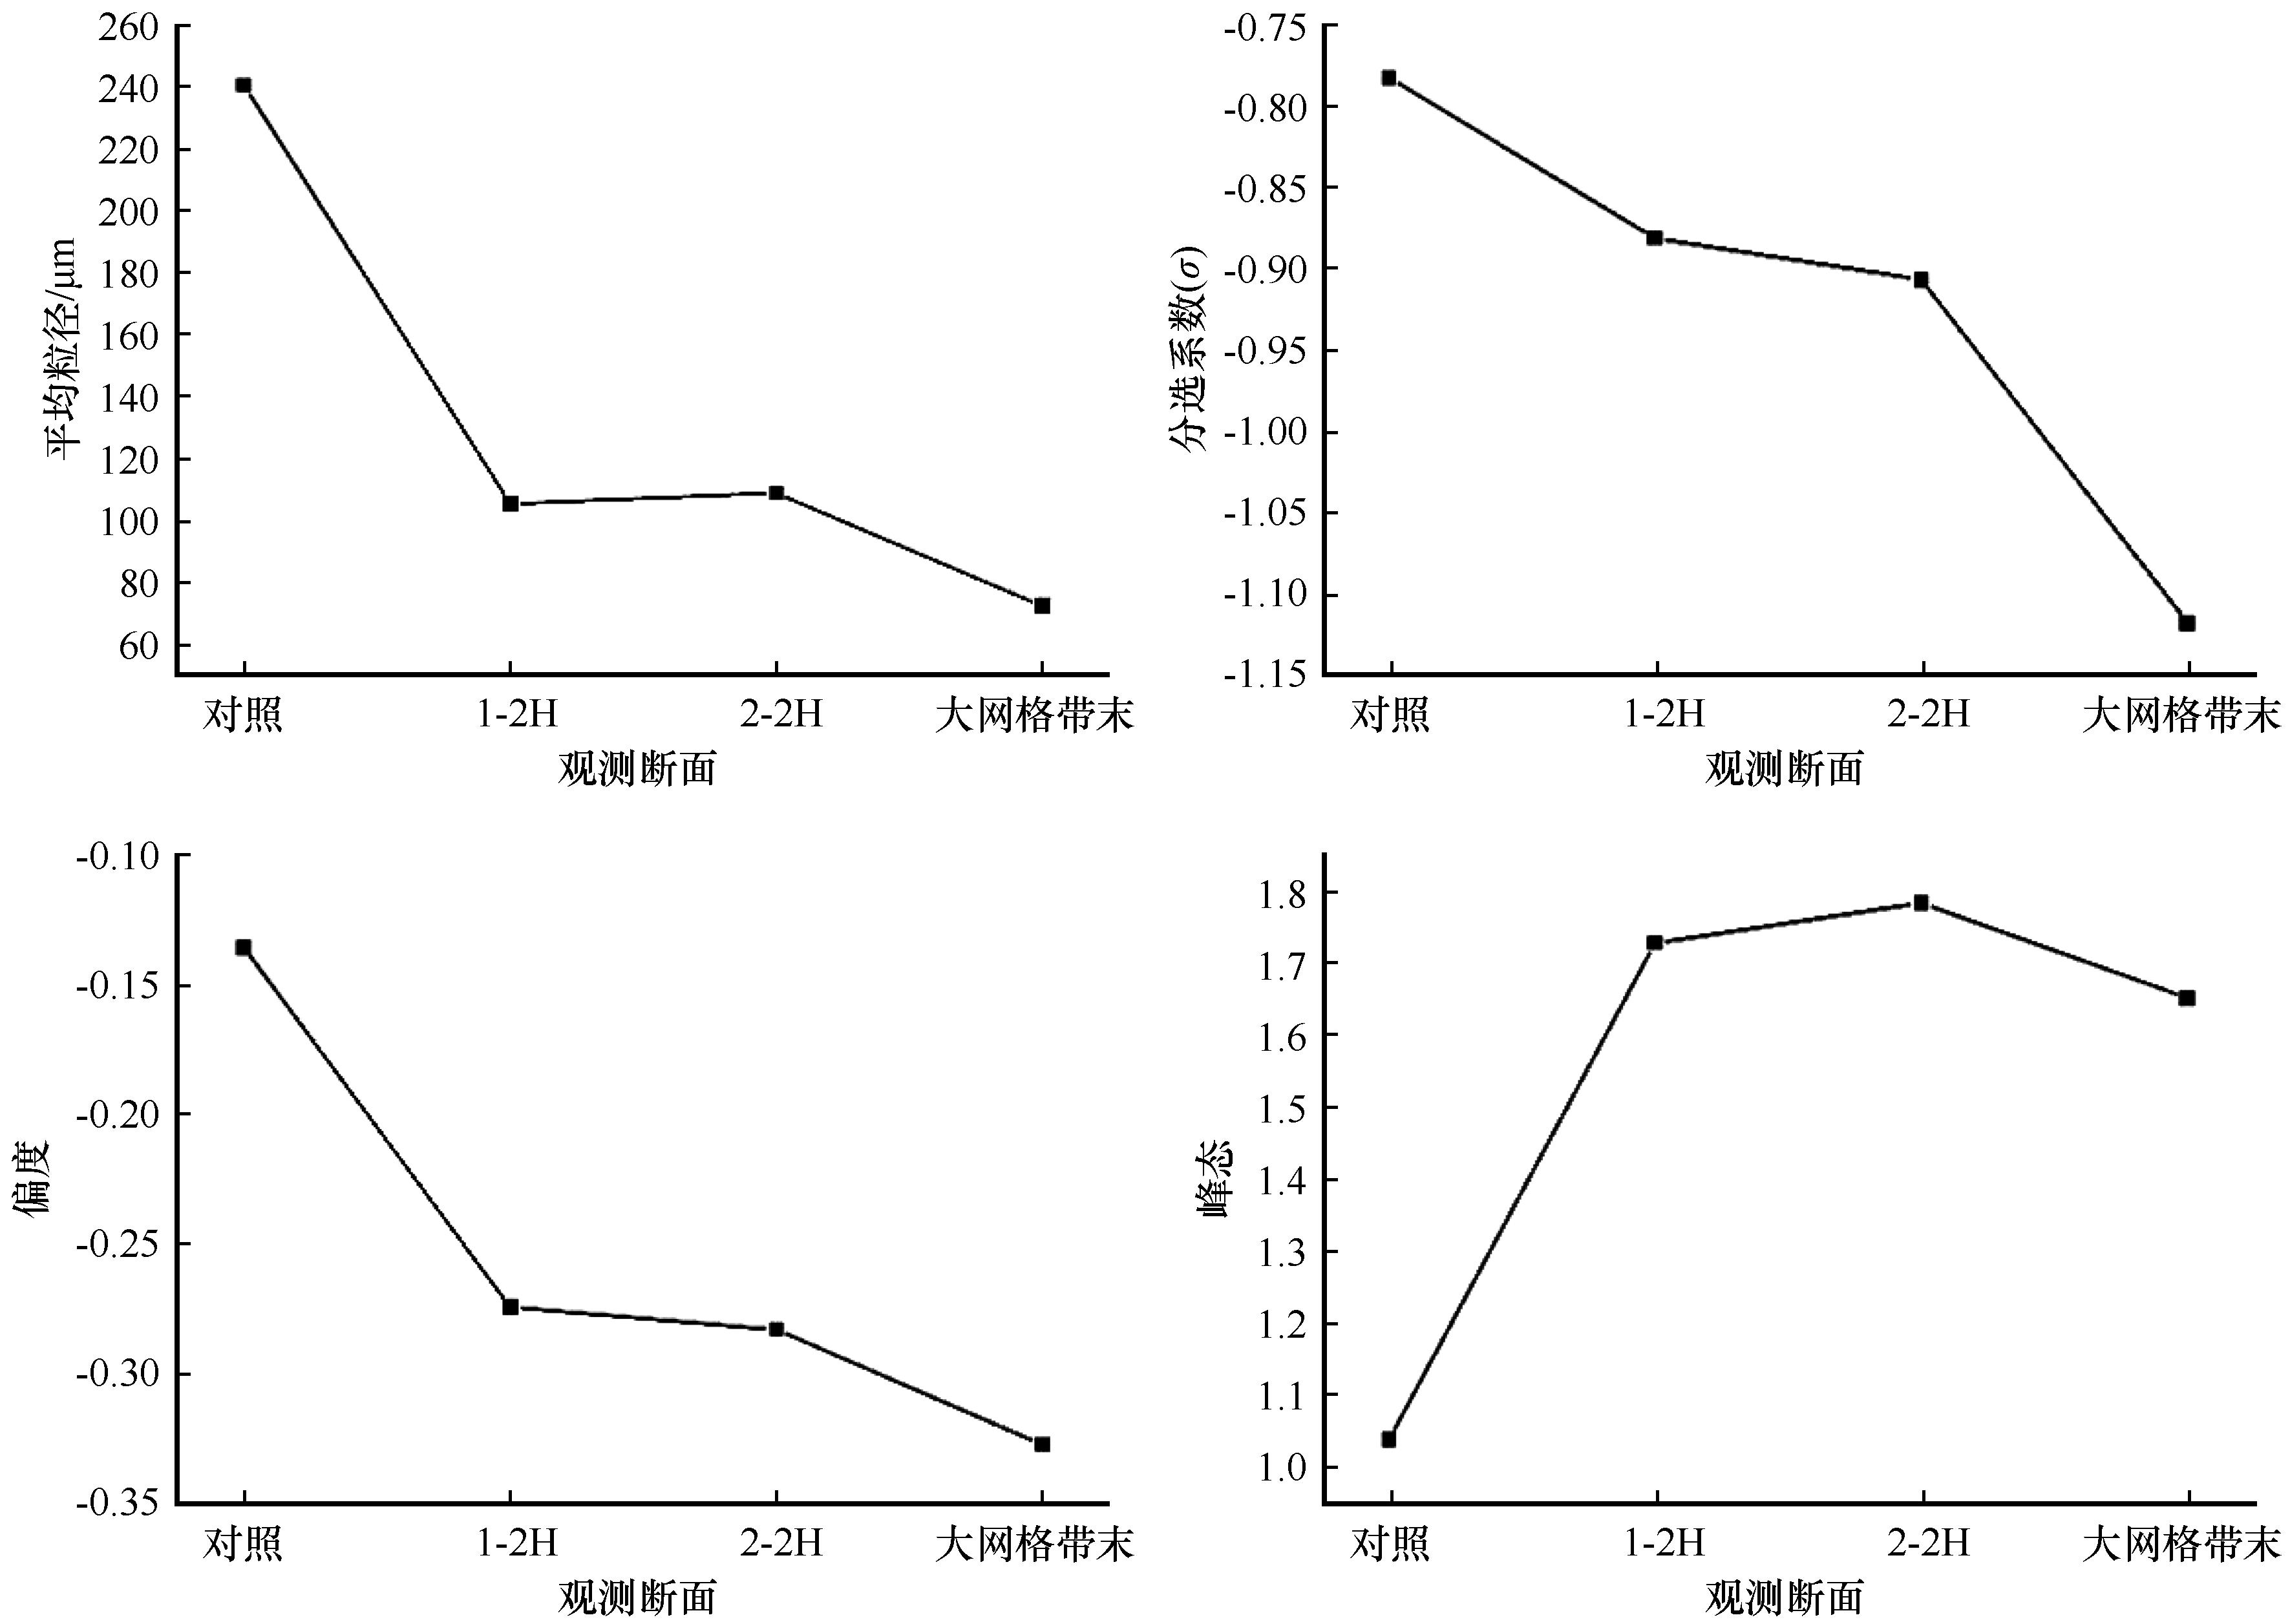
Fig.9 Variation of grain size parameters along the observed section of the sand control system
Fig.9 Variation of grain size parameters along the observed section of the sand control system
Wang T, Qu J, Ling Y,et al.Shelter effect efficacy of sand fences:a comparison of systems in a wind tunnel[J].Aeolian Research,2018,30:32-40.
11
Niu B, Tan L, Zhang X,et al.Targeted control of sand hazards for a railway in extremely arid regions using fingerprinting approaches[J].Geomorphology,2020,361:107189.
12
Tan L H, An Z S, Zhang K C,et al.Intermittent aeolian saltation over a gobi surface:threshold,saltation layer height,and high‐frequency variability[J].Journal of Geophysical Research:Earth Surface,2020,125(1):JF005329.
13
Dong Z, Lu J, Man D,et al.Equations for the near‐surface mass flux density profile of wind‐blown sediments[J].Earth Surface Processes and Landforms,2011,36(10):1292-1299.
14
Folk R L, Ward W C.Brazos River bar [Texas]:a study in the significance of grain size parameters[J].Journal of Sedimentary Research,1957,27(1):3-26.
Gillies J A, Etyemezian V, Nikolich G,et al.Effectiveness of an array of porous fences to reduce sand flux:Oceano Dunes,Oceano CA[J].Journal of Wind Engineering and Industrial Aerodynamics,2017,168:247-259.
17
Bean A, Alperi R W, Federer C A.A method for categorizing shelterbelt porosity[J].Agricultural Meteorology,1975,14:417-429.
18
Li B, Sherman D J.Aerodynamics and morphodynamics of sand fences:a review[J].Aeolian Research,2015,17:33-48.

 )
)