中国沙漠 ›› 2021, Vol. 41 ›› Issue (6): 249-261.DOI: 10.7522/j.issn.1000-694X.2021.00154
邵梅1,2( ), 罗万银1(), 车雪华1,2, 王芳1, 逯军峰1, 邹松兵3
收稿日期:2021-10-09
修回日期:2021-11-04
出版日期:2021-11-20
发布日期:2021-12-17
通讯作者:
罗万银
作者简介:罗万银(E-mail: wyluo@lzb.ac.cn)基金资助:
Mei Shao1,2(), Wanyin Luo1(), Xuehua Che1,2, Fang Wang1, Junfeng Lu1, Songbing Zou3
Received:2021-10-09
Revised:2021-11-04
Online:2021-11-20
Published:2021-12-17
Contact:
Wanyin Luo
摘要:
风沙活动威胁着龙羊峡水库的安全运营,查清沙害来源和入库量对于防治水患和沙害具有重要意义。基于1987、1995、2003、2013、2019年的Landsat卫星影像,利用COSI-Corr技术监测了龙羊峡库区不同时空的沙丘移动特征,并重新评估库区近32 a的潜在风沙入库量。结果显示:(1)1987—2019年龙羊峡库区沙丘平均移动速率为5.81 m·a-1,呈先加速(1987—2003年)后减速(2003—2013年)再加速(2013—2019年)趋势;沙丘移动方向在132.81°—165.82°范围内,与该区主风向一致。(2)近32 a向龙羊峡水库输送的潜在风沙量可达7.82×10⁷ m3(1.20×10⁸ t)。上风向塔拉滩潜在输送量为7.38×10⁷ m3(1.14×10⁸ t),下风向木格滩仅贡献了0.44×10⁷ m3(0.68×10⁷ t)。(3)库区内风沙输移受风况、气候、植被等多种因素的影响,在未来全球变暖条件下,青藏高原的风沙活动将会持续发展,风沙入库量的长期累计效应将对水库安全构成严重威胁,必须引起足够重视。
中图分类号:
邵梅, 罗万银, 车雪华, 王芳, 逯军峰, 邹松兵. 基于COSI-Corr技术的龙羊峡库区1987—2019年风沙输移特征及潜在入库量估算[J]. 中国沙漠, 2021, 41(6): 249-261.
Mei Shao, Wanyin Luo, Xuehua Che, Fang Wang, Junfeng Lu, Songbing Zou. Aeolian sand transport and its potential amount into Longyangxia Reservoir in 1987-2019 based on COSI-Corr[J]. Journal of Desert Research, 2021, 41(6): 249-261.
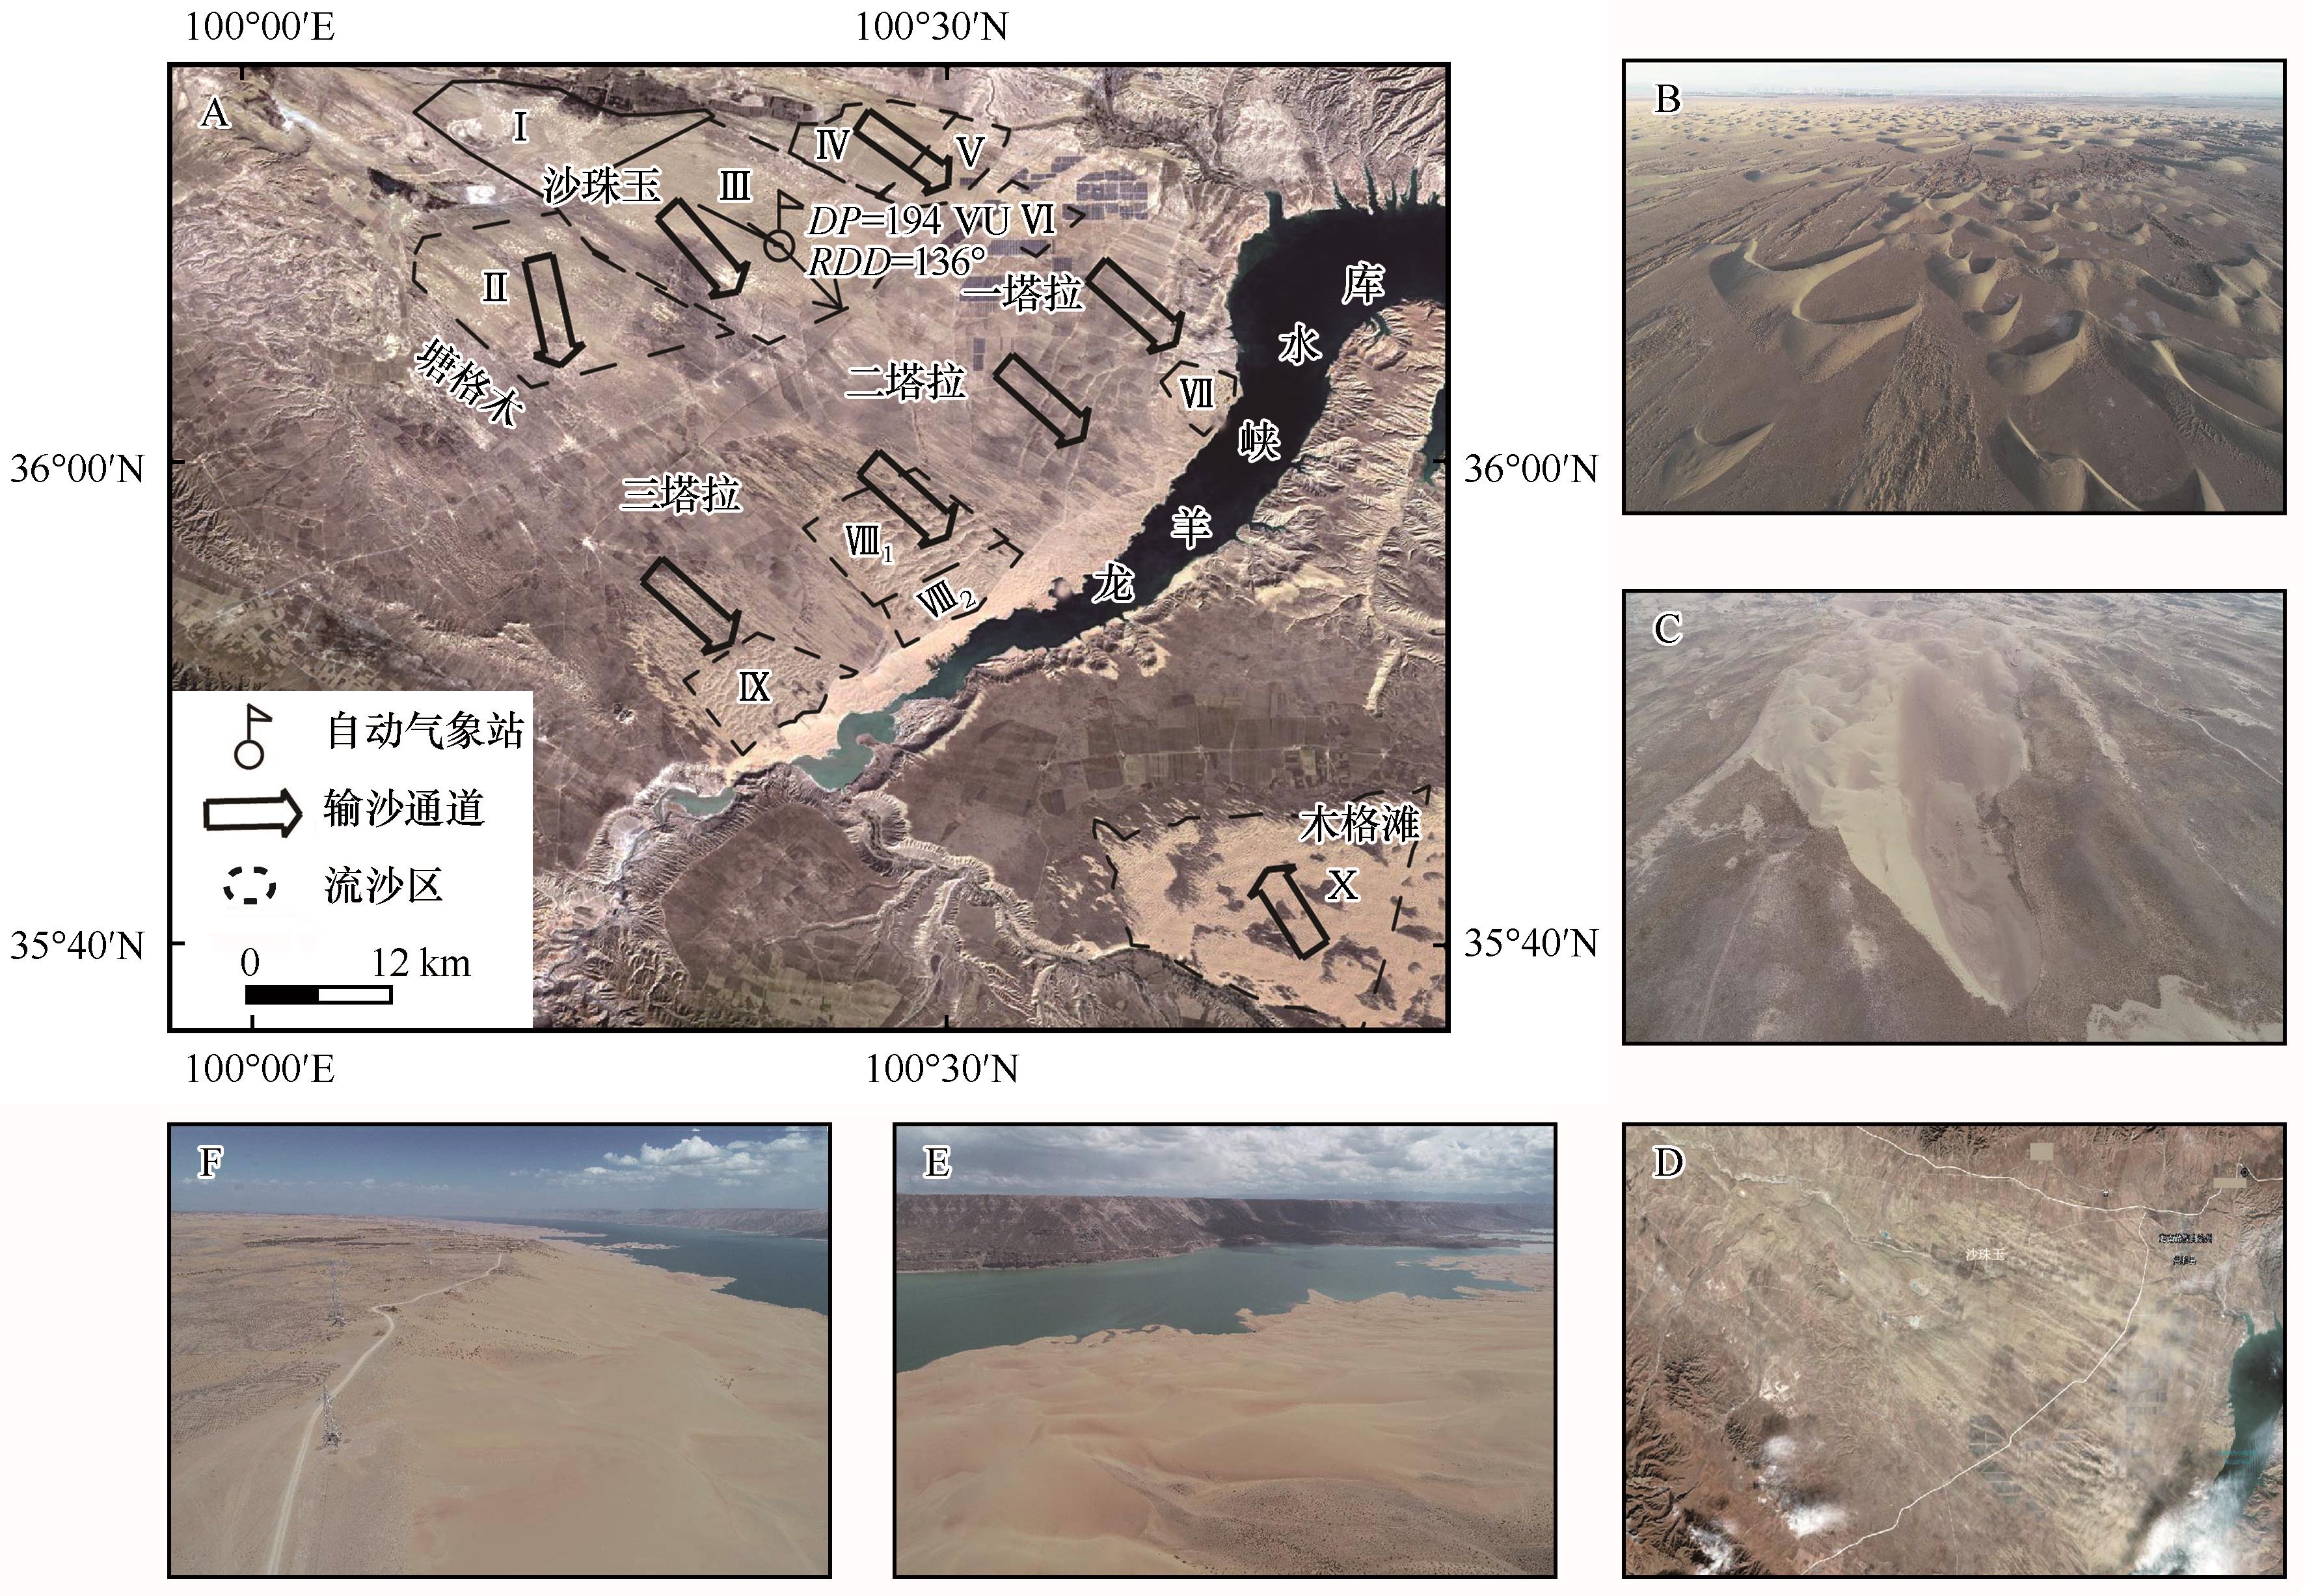
图1 龙羊峡库区周围景观格局及输沙通道分布(A:流沙区输沙通道分布,Ⅰ—Ⅹ代表流沙区;B和C为不同区域的沙源,其中B为二塔拉分布的沙丘,C为三塔拉的巨型风蚀坑;D为卫星监测的沙尘暴(2021年1月10日);E和F为风沙入库现状(2020年8月)。库区东南侧(木格滩)分布有连片的沙丘,沙丘发育更成熟,而库区西北侧(塔拉滩)沙丘呈现不连续分布,发育程度轻,沙丘高度低)
Fig.1 Landscape and sand transport corridors around Longyangxia Reservoir (A: The sand transport corridors of major sand areas, and Ⅰ—Ⅹ represent the different sandy land areas. Figure B and C represent the sand source in different area, figure B shows the dune in ErTala, figure C represents the mega-blowout in SanTala; Figure D represents the sand storm monitored by satellite; Figure E and F are the current situation of sand transported into the reservoir. In the southeast side of the reservoir area (Mugetan sandy-land), continuous dunes are distributed, which are more mature, while in the northwest side of the reservoir area (Talatan sandy-land), dunes are scattered, lightly developed and with low dune height)
| 卫星影像名称 | 时间 | 波段 | 分辨率/m | 太阳高度角/(°) | 太阳方位角/(°) | 云量/% |
|---|---|---|---|---|---|---|
| LT51330351987227BJC00 | 1987-08-15 | 4 | 30 | 55.09 | 120.72 | 4 |
| LT51330351995217CLT00 | 1995-08-05 | 4 | 30 | 52.55 | 110.59 | 7 |
| LT51330352003255BJC00 | 2003-09-12 | 4 | 30 | 50.46 | 137.21 | 13 |
| LC81330352013106LGN01 | 2013-04-16 | 4 | 30 | 58.32 | 139.17 | 0.19 |
| LC08_L1TP_133035_20190722_20190801_01_T1 | 2019-07-22 | 4 | 30 | 64.81 | 122.50 | 18.42 |
表1 龙羊峡库区用于COSI-Corr计算的遥感影像元数据参数
Table 1 The parameters of metadata used for COSI-Corr calculating around Longyangxia Reservoir
| 卫星影像名称 | 时间 | 波段 | 分辨率/m | 太阳高度角/(°) | 太阳方位角/(°) | 云量/% |
|---|---|---|---|---|---|---|
| LT51330351987227BJC00 | 1987-08-15 | 4 | 30 | 55.09 | 120.72 | 4 |
| LT51330351995217CLT00 | 1995-08-05 | 4 | 30 | 52.55 | 110.59 | 7 |
| LT51330352003255BJC00 | 2003-09-12 | 4 | 30 | 50.46 | 137.21 | 13 |
| LC81330352013106LGN01 | 2013-04-16 | 4 | 30 | 58.32 | 139.17 | 0.19 |
| LC08_L1TP_133035_20190722_20190801_01_T1 | 2019-07-22 | 4 | 30 | 64.81 | 122.50 | 18.42 |

图2 UAV-SfM方法提取的沙丘高度与插值法提取的沙丘高度的比较
Fig.2 The comparation of dune height extracted by DSM data generated by UAV-SfM and the interpolation method
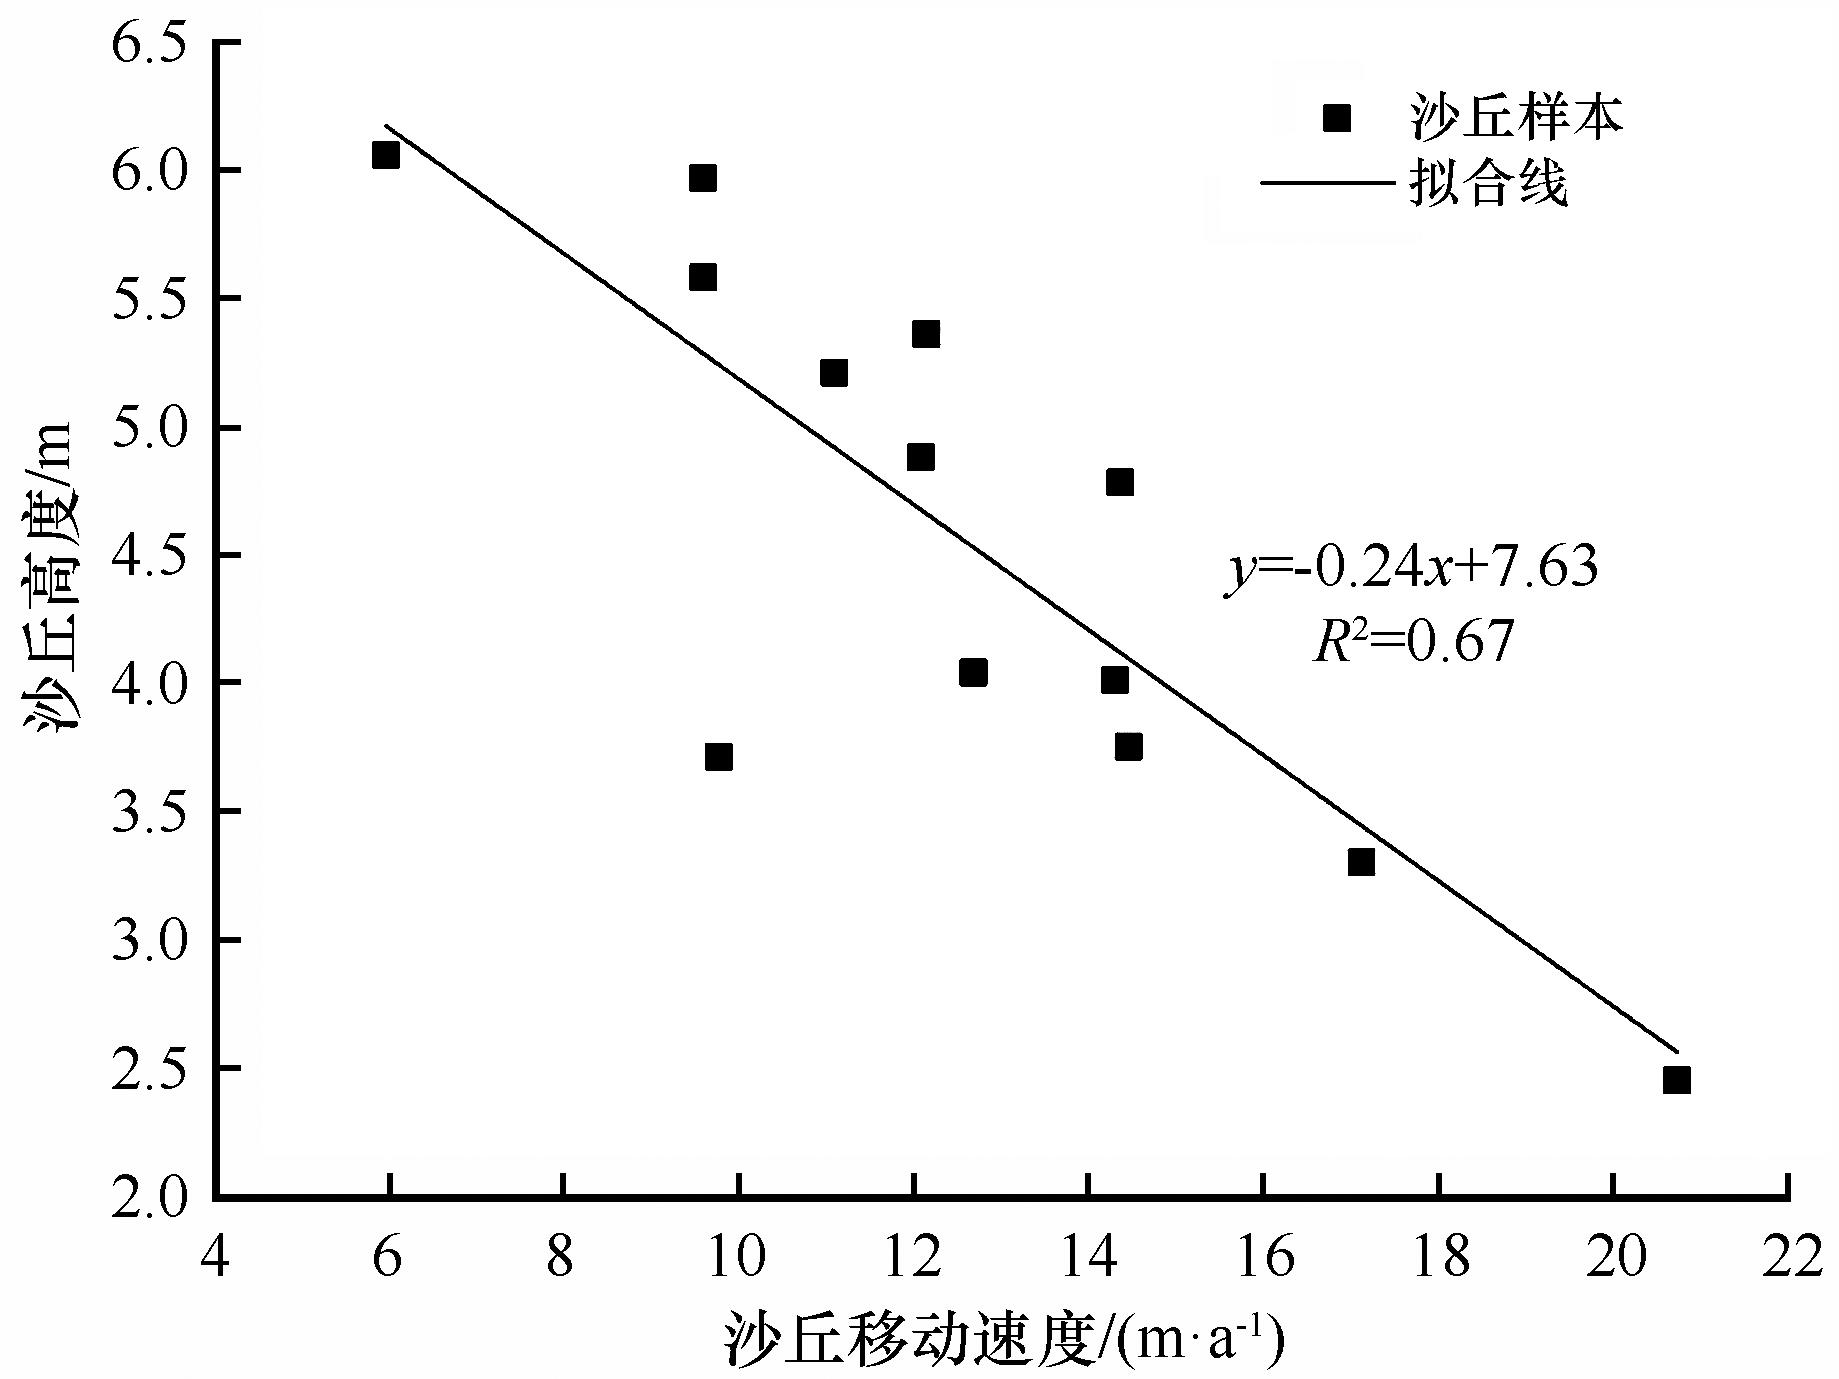
图3 沙丘高度与移动速度的关系
Fig.3 The relationship between the dune height and dune movement speed
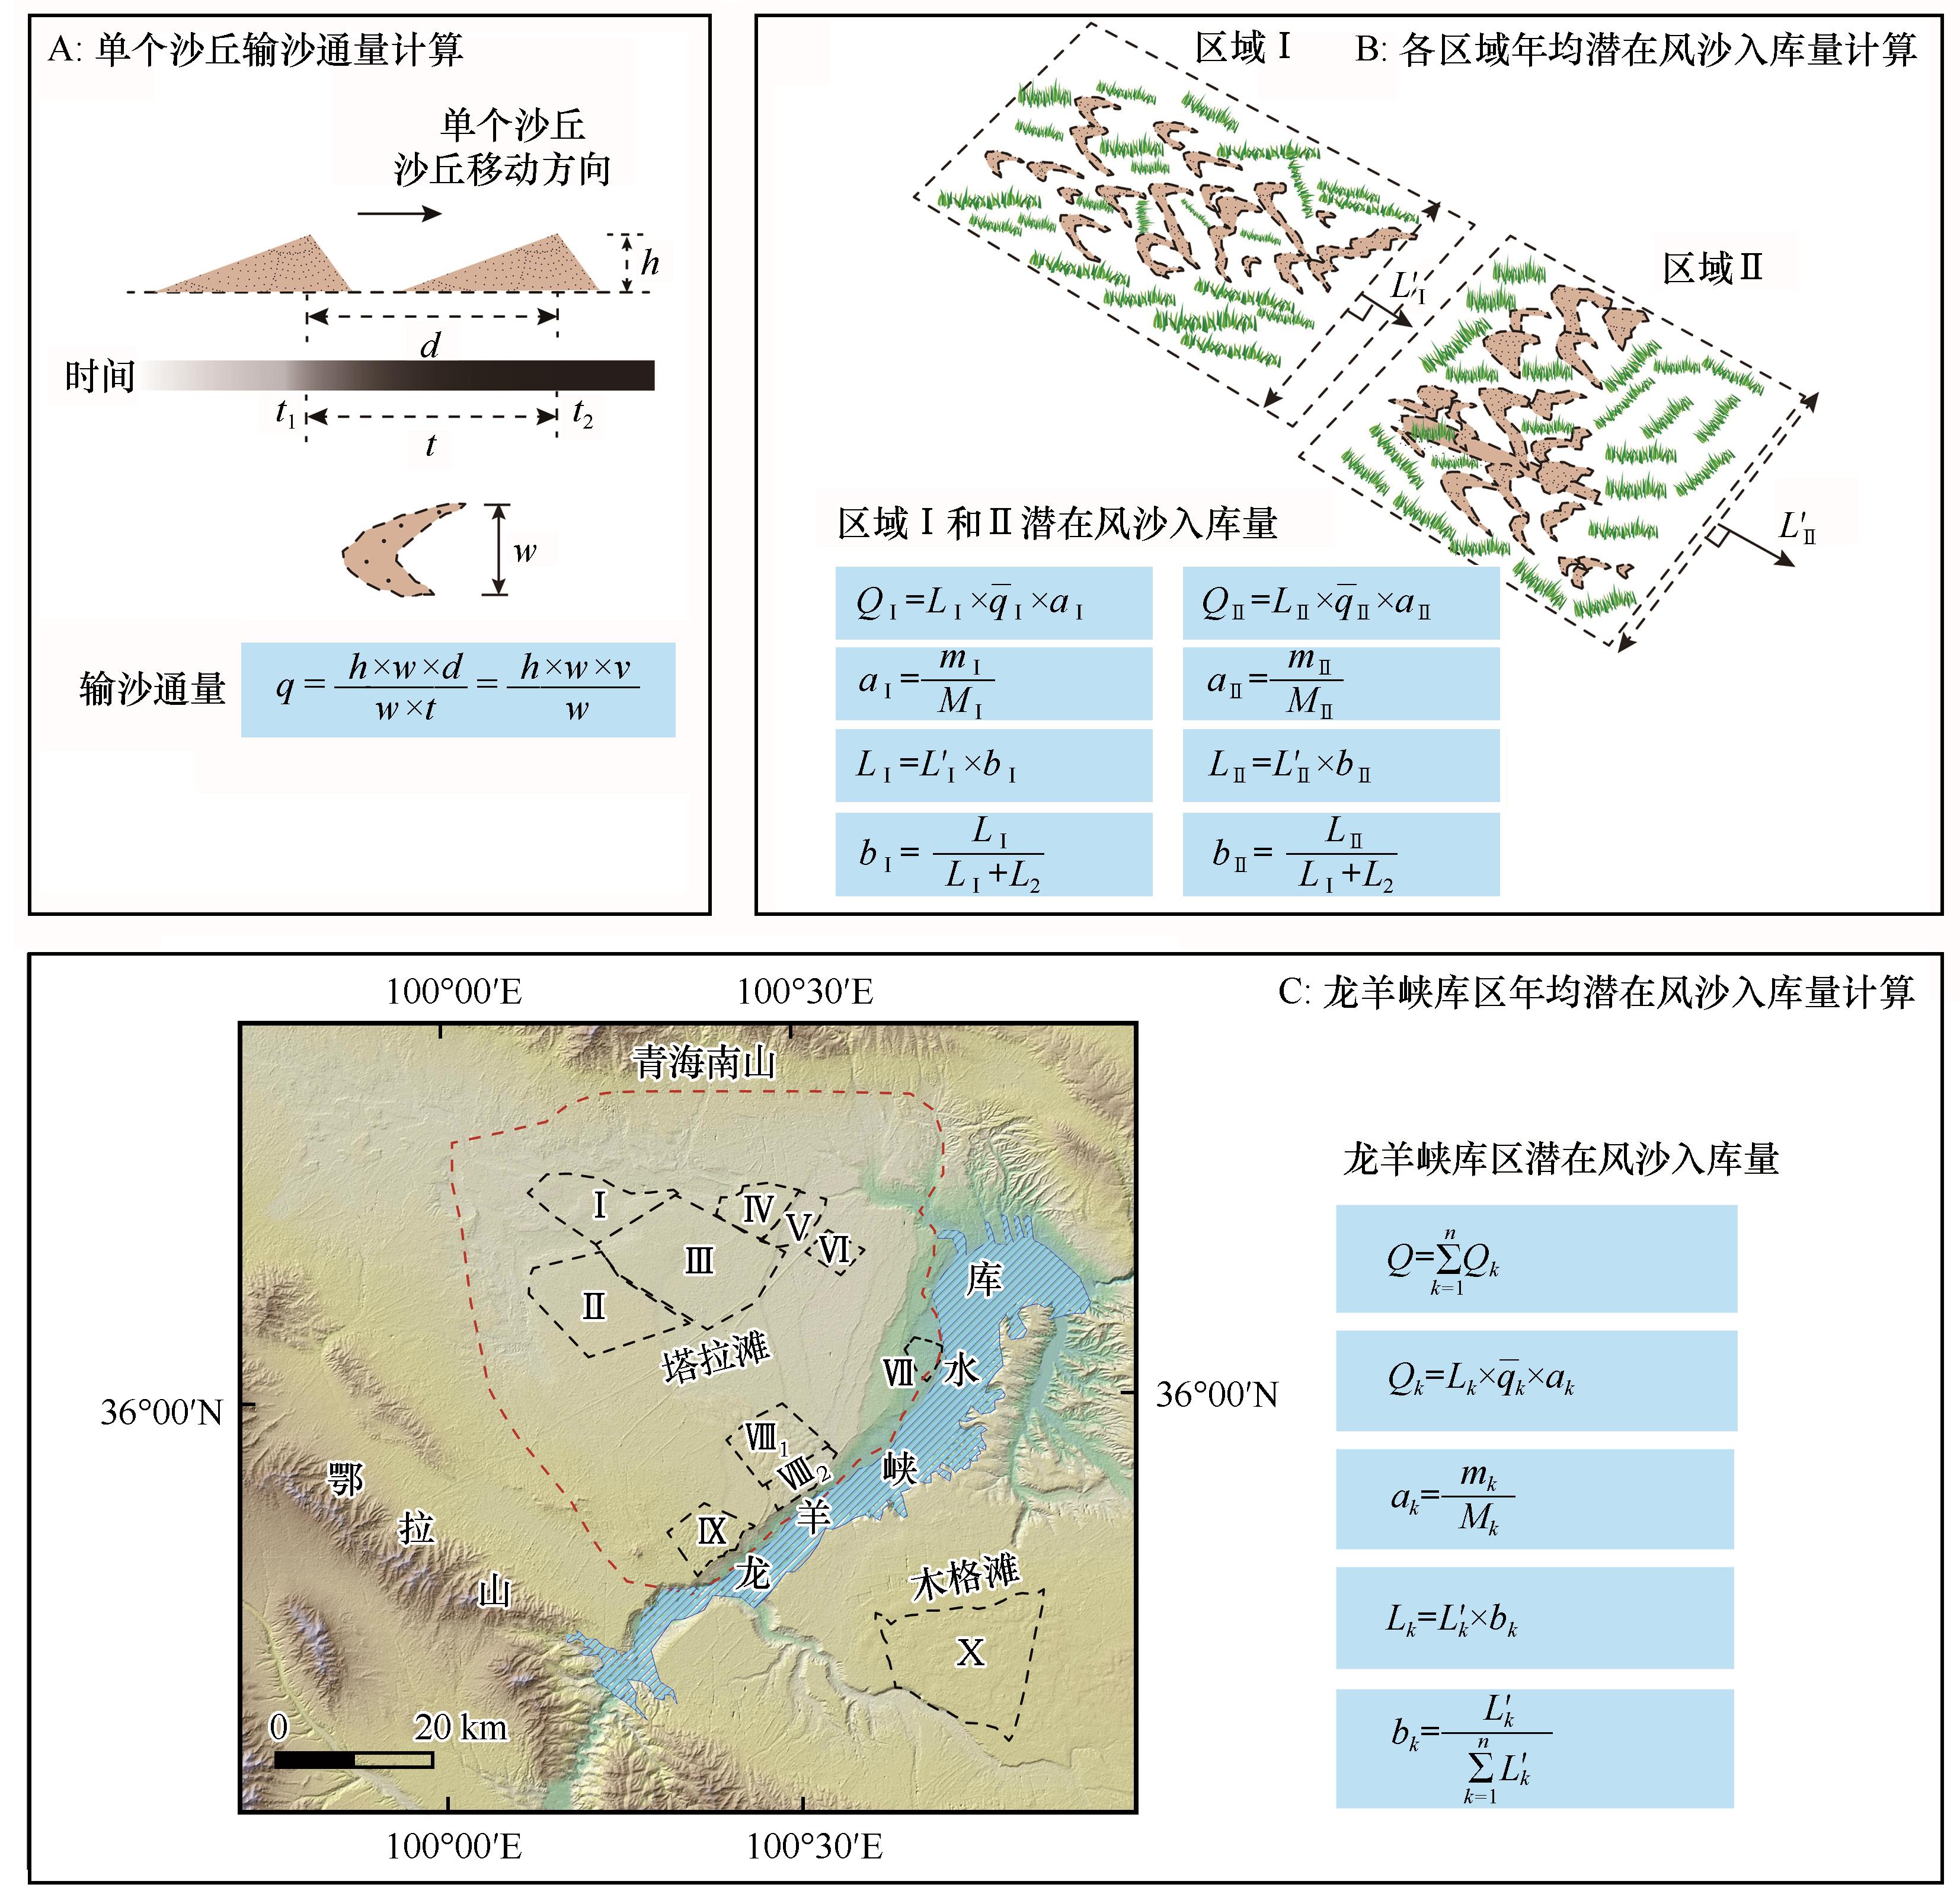
图4 龙羊峡库区潜在风沙入库量计算图示
Fig.4 The principle of the calculation of potential sand amount transported into the Longyangxia Reservoir
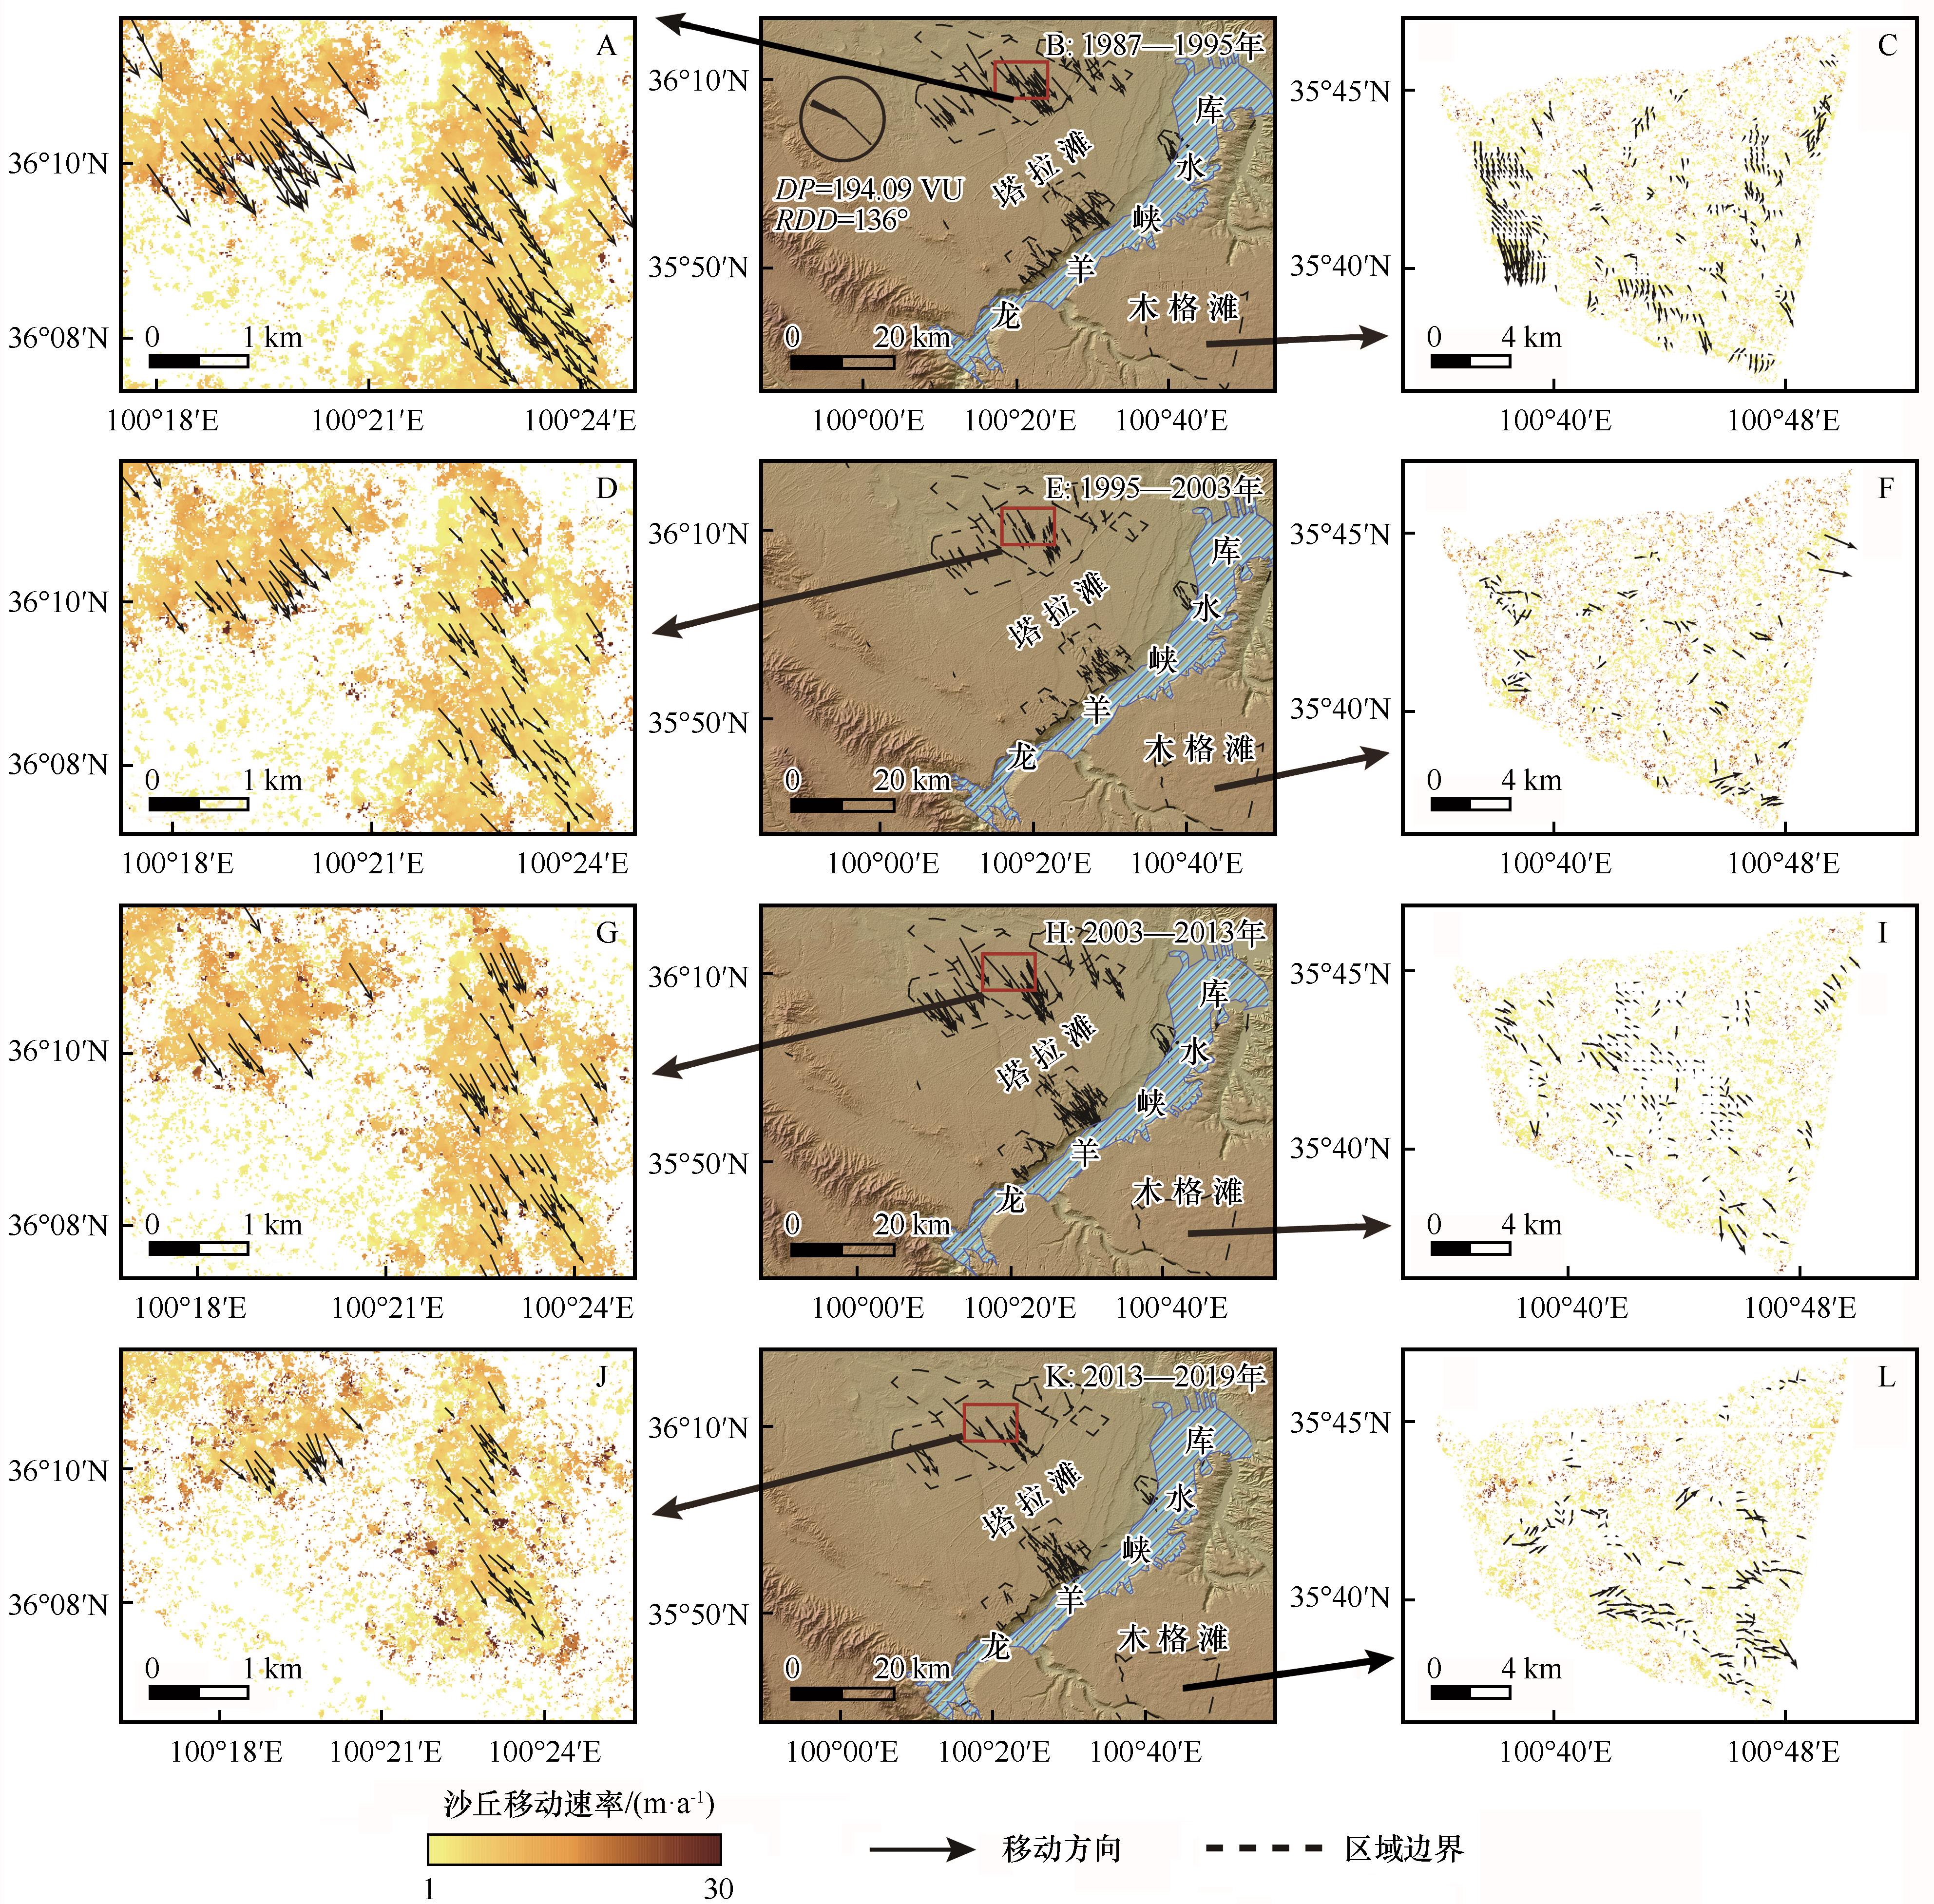
图5 基于COSI-Corr计算的龙羊峡库区1987—2019年沙丘移动的时空分布特征(A,D,G和J为上风向局部区域沙丘移动矢量图; B,E,H和K为1987—1995、1995—2003、2003—2013年和2013—2019年4个监测时段内的沙丘移动矢量图;C,F,I和L为下风向局部区域沙丘移动矢量图)图B,E,H和K的底图为高程,图A,D,G,J,C,F,I和L底图为沙丘移动速率
Fig.5 Spatial and temporal distribution characteristics of dune movement around Longyangxia Reservoir from 1987 to 2019 using COSI-Corr (A, D, G and J are the vector diagrams of the moving rate and direction of dunes in the local area of upwind; B, E, H and K are the vector diagrams of the dune movement of the study area in1987-1995, 1995-2003, 2003-2013 and 2013-2019; C, F, I and L are the vector diagrams of the migration rate and direction of dunes in the local area of downwind)

图6 龙羊峡库区输沙通量时空分布
Fig.6 Spatial and temporal distribution of sand flux around Longyangxia Reservoir
| 区域 | Ⅰ | Ⅱ | Ⅲ | Ⅳ | Ⅴ | Ⅵ | Ⅶ | Ⅷ1 | Ⅷ2 | Ⅸ | Ⅹ |
|---|---|---|---|---|---|---|---|---|---|---|---|
| Lk/m | 12 309 | 13 325 | 13 965 | 7 318 | 8 413 | 4 232 | 3 845 | 9 624 | 9 649 | 7 729 | 18 664 |
| ak 1987—1995 | 0.77 | 0.83 | 0.80 | 0.80 | 0.84 | 0.74 | 0.99 | 0.86 | 0.91 | 0.90 | 0.08 |
| ak 1995—2003 | 0.70 | 0.75 | 0.73 | 0.75 | 0.72 | 0.61 | 0.94 | 0.77 | 0.87 | 0.80 | 0.11 |
| ak 2003—2013 | 0.61 | 0.73 | 0.74 | 0.64 | 0.78 | 0.70 | 0.94 | 0.87 | 0.91 | 0.92 | 0.07 |
| ak 2013—2019 | 0.61 | 0.65 | 0.69 | 0.73 | 0.69 | 0.53 | 0.66 | 0.83 | 0.79 | 0.52 | 0.09 |
| bk | 0.46 | 0.41 | 0.54 | 0.31 | 0.35 | 0.18 | 0.17 | 0.3 | 0.3 | 1 | 1 |
表2 龙羊峡库区潜在风沙入库量计算参数
Table 2 The parameters in the calculation of potential amount of sand transported into the Longyangxia Reservoir
| 区域 | Ⅰ | Ⅱ | Ⅲ | Ⅳ | Ⅴ | Ⅵ | Ⅶ | Ⅷ1 | Ⅷ2 | Ⅸ | Ⅹ |
|---|---|---|---|---|---|---|---|---|---|---|---|
| Lk/m | 12 309 | 13 325 | 13 965 | 7 318 | 8 413 | 4 232 | 3 845 | 9 624 | 9 649 | 7 729 | 18 664 |
| ak 1987—1995 | 0.77 | 0.83 | 0.80 | 0.80 | 0.84 | 0.74 | 0.99 | 0.86 | 0.91 | 0.90 | 0.08 |
| ak 1995—2003 | 0.70 | 0.75 | 0.73 | 0.75 | 0.72 | 0.61 | 0.94 | 0.77 | 0.87 | 0.80 | 0.11 |
| ak 2003—2013 | 0.61 | 0.73 | 0.74 | 0.64 | 0.78 | 0.70 | 0.94 | 0.87 | 0.91 | 0.92 | 0.07 |
| ak 2013—2019 | 0.61 | 0.65 | 0.69 | 0.73 | 0.69 | 0.53 | 0.66 | 0.83 | 0.79 | 0.52 | 0.09 |
| bk | 0.46 | 0.41 | 0.54 | 0.31 | 0.35 | 0.18 | 0.17 | 0.3 | 0.3 | 1 | 1 |
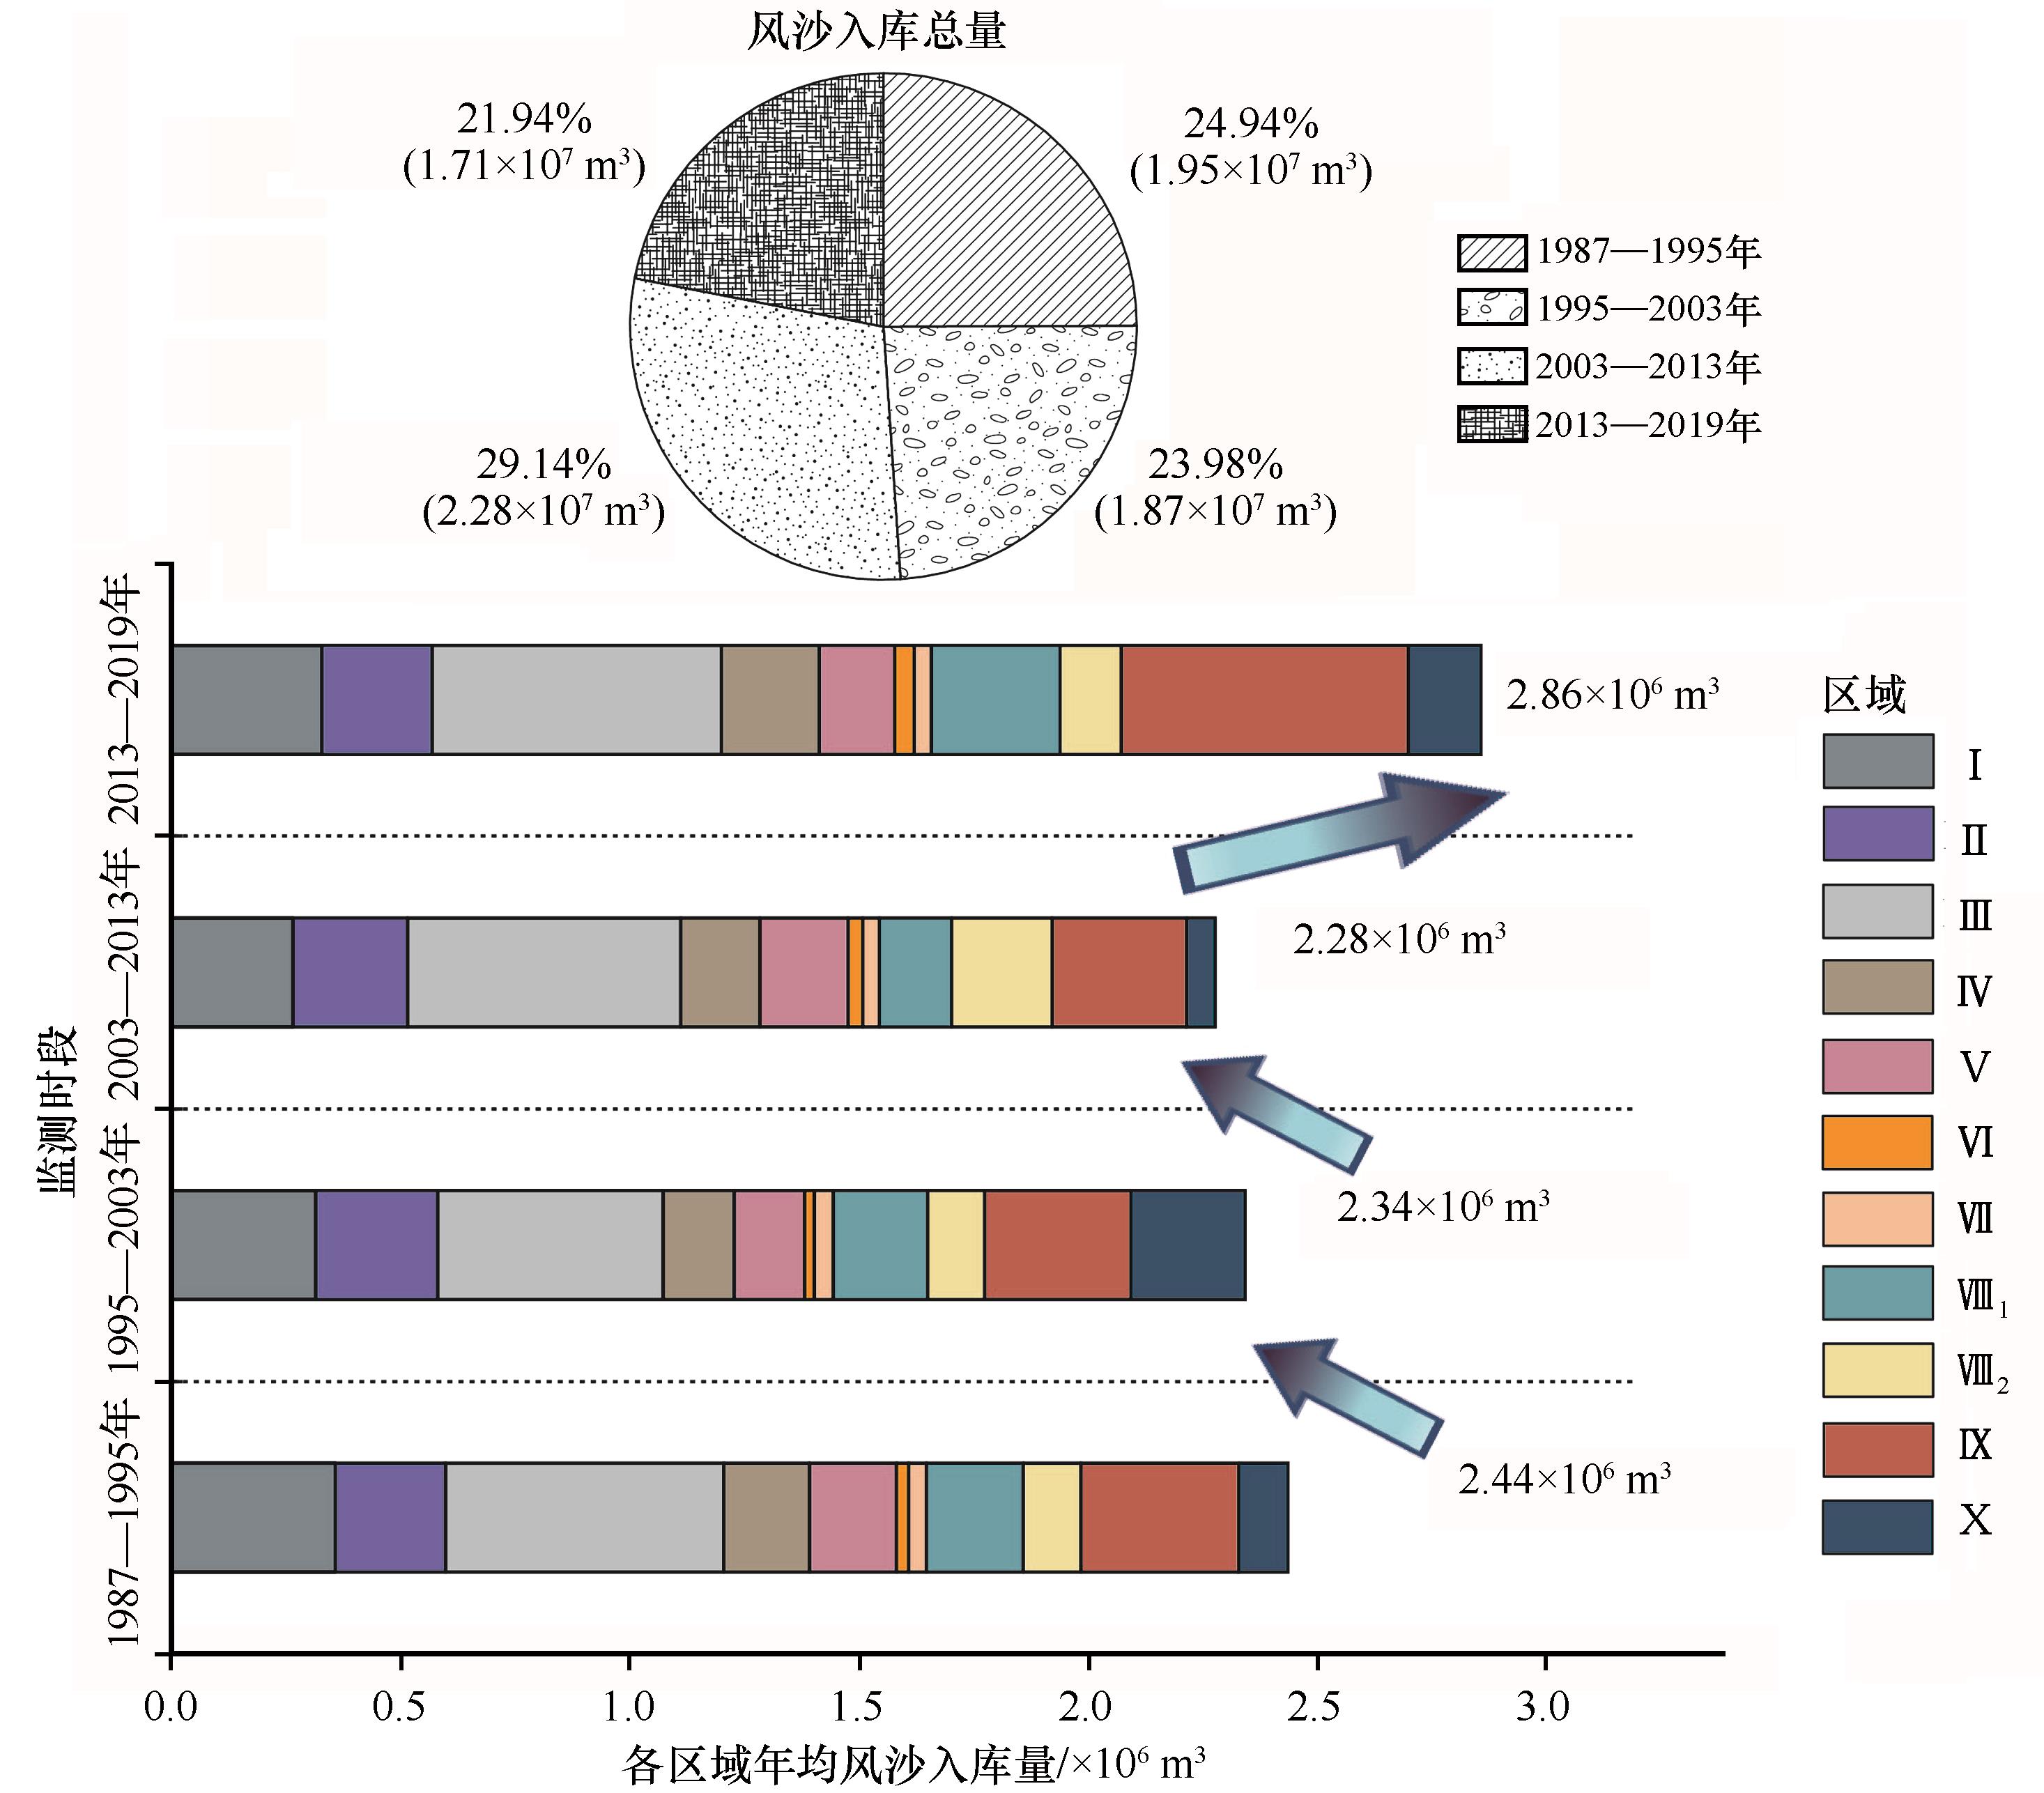
图7 龙羊峡库区潜在风沙入库量时空特征(饼图为各监测时段内潜在风沙入库总量;直方图为各监测时段内年均潜在风沙入库量)
Fig.7 The spatial and temporal characteristics of potential amount of sand transported into the reservoir (The pie chart showed the total potential amount of sand transported into the reservoir in each period; the histogram showed the annual potential amount of sand transported into the reservoir)
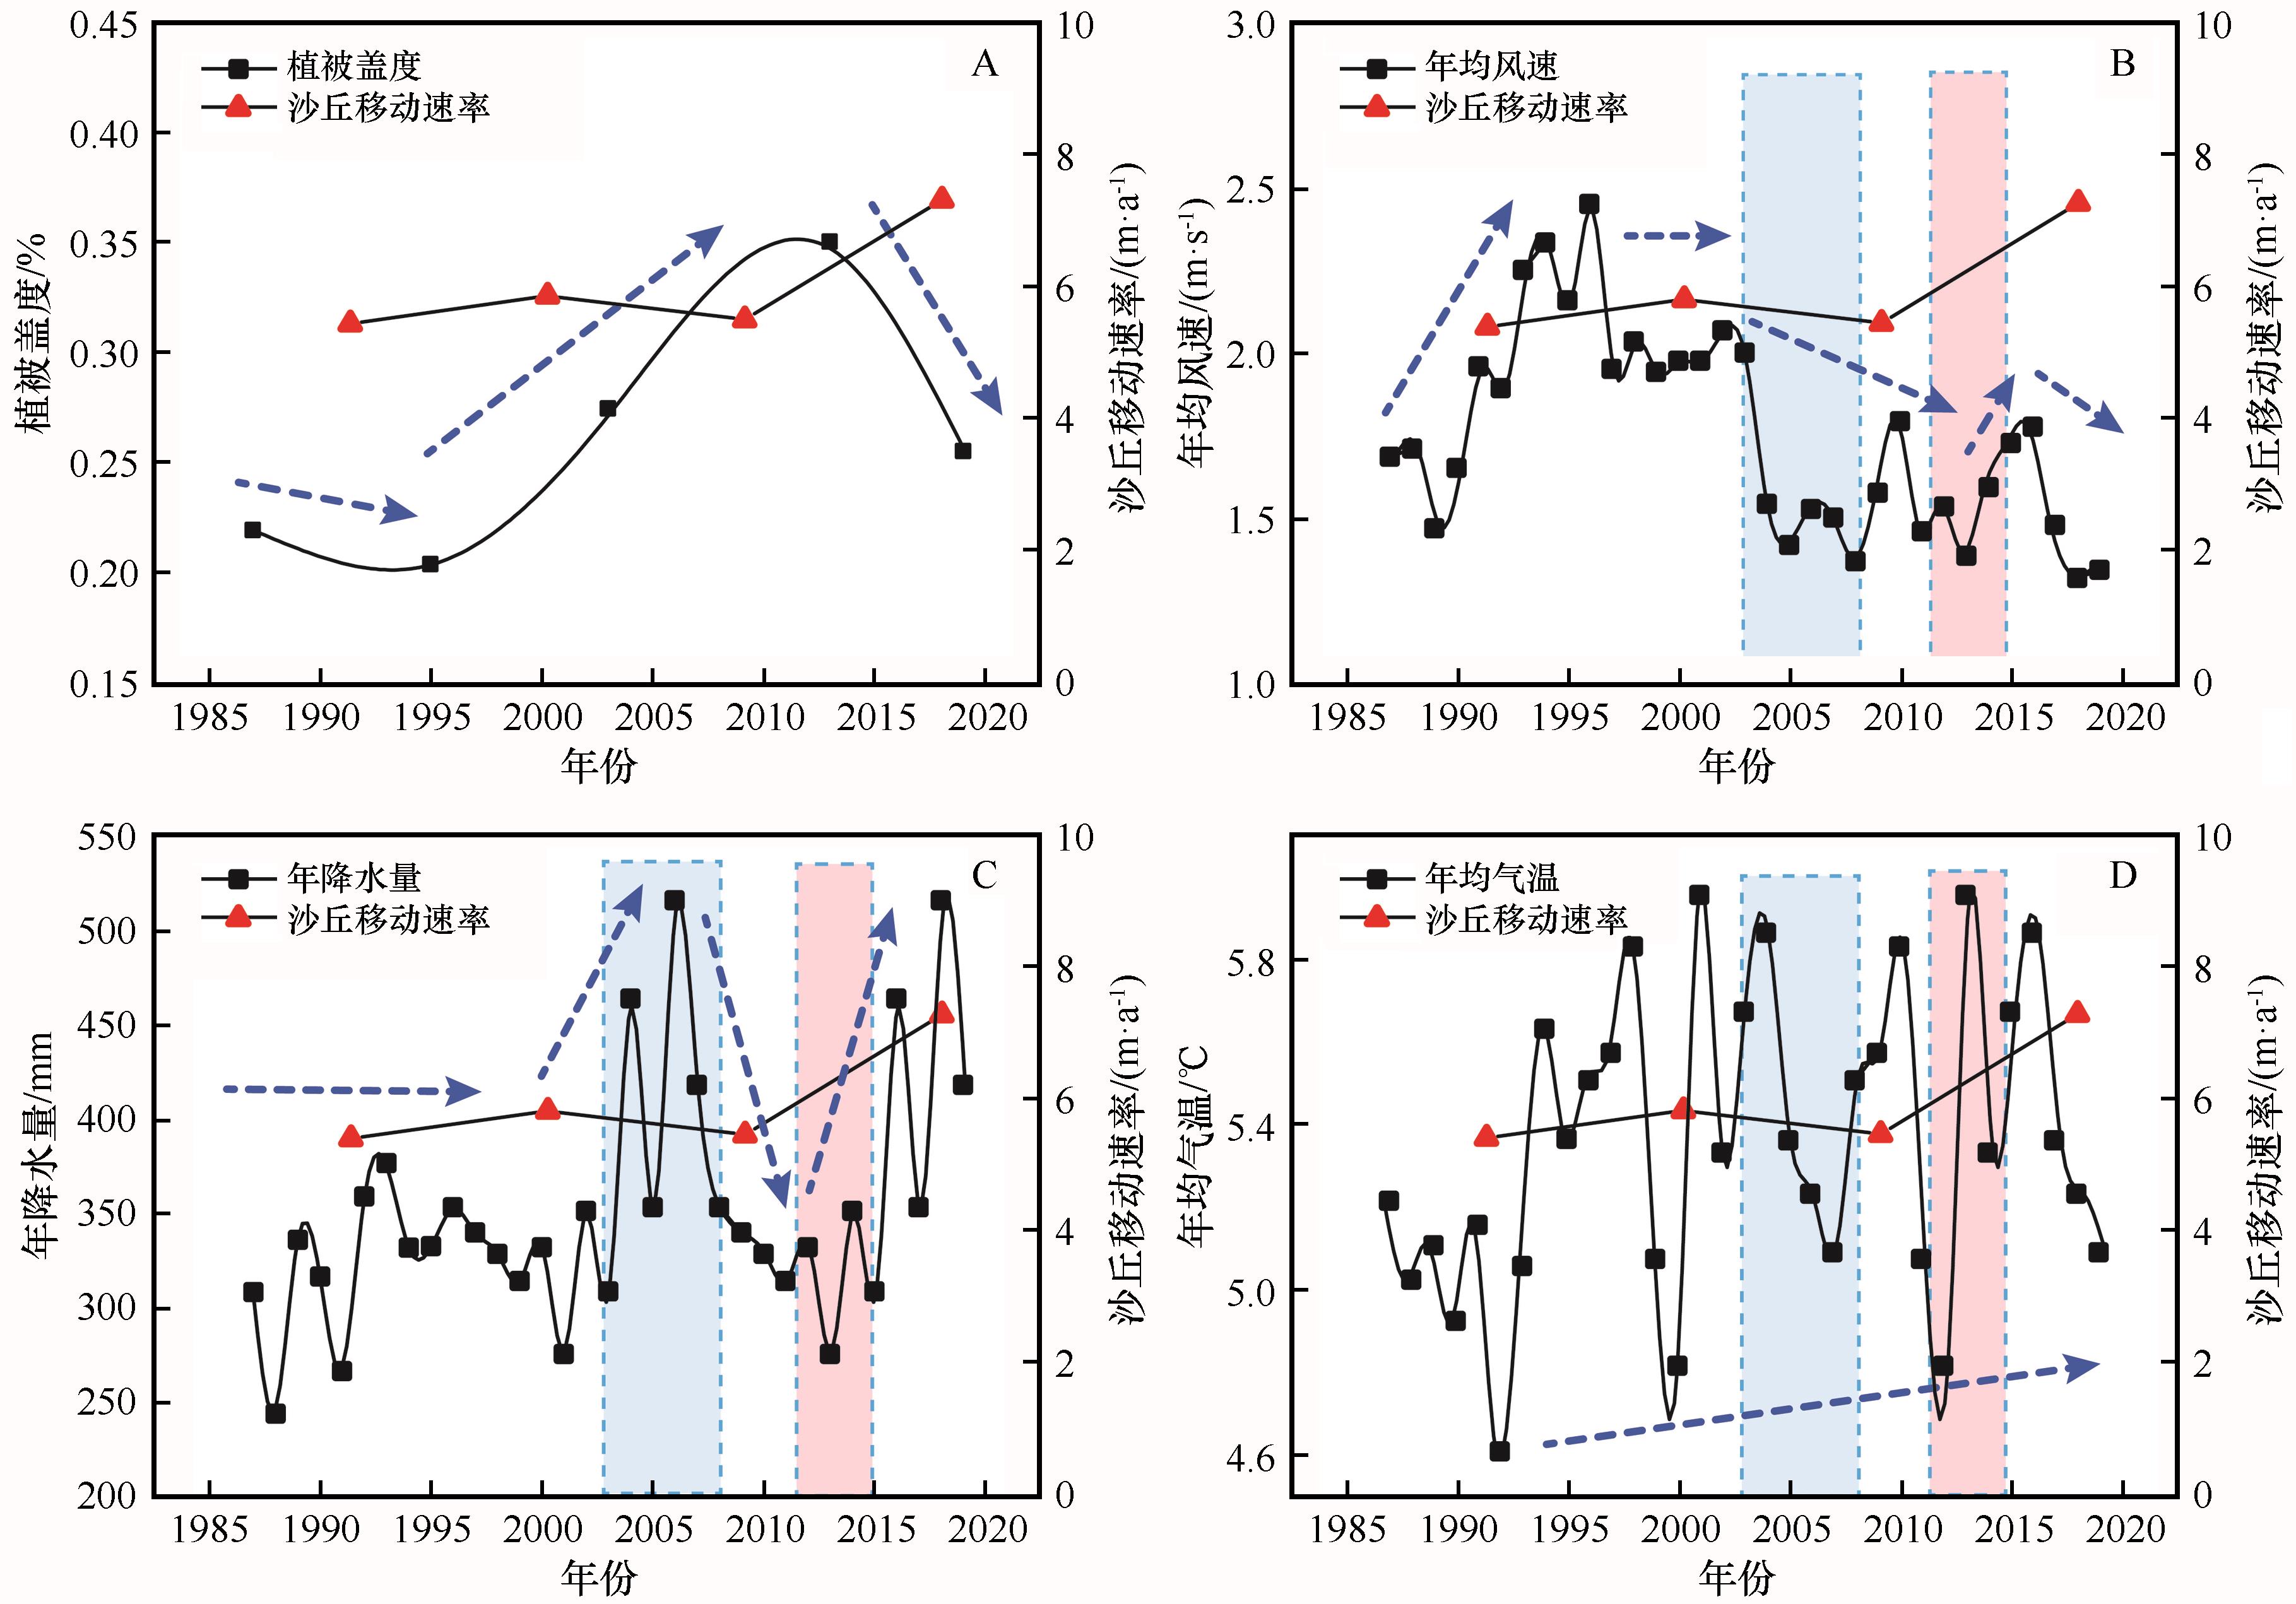
图8 龙羊峡水库风沙输移影响因素(A:植被盖度与沙丘移动速率变化趋势;B:年均风速与沙丘移动速率变化趋势;C:年降水量与沙丘移动速率变化趋势;D:年均气温与沙丘移动速率变化趋势。虚线箭头表征各因素变化趋势)
Fig.8 Factors influencing sand transportation (A: The trend change of vegetation cover and dune migration rate; B: The trend change of annual wind speed and dune migration rate; C: The trend change of annual precipitation and dune migration rate; D: The trend change of annual temperature and dune migration rate. The blue dotted arrow represents the change trend of each factor)
| 1 | 徐勇,王传胜.黄河流域生态保护和高质量发展:框架、路径与对策[J].中国科学院院刊,2020,35(7):875-883. |
| 2 | 马柱国,符淙斌,周天军,等.黄河流域气候与水文变化的现状及思考[J].中国科学院院刊,2020,35(1):52-60. |
| 3 | 郑子彦,吕美霞,马柱国.黄河源区气候水文和植被覆盖变化及面临问题的对策建议[J].中国科学院院刊,2020,35(1):61-72. |
| 4 | Bullard J E,Livingstone I.Interactions between aeolian and fluvial systems in dryland environments[J].Area,2002,34(1):8-16. |
| 5 | 宋阳,严平,杜建会,等.巴图湾水库风沙入库量的估算[J].干旱区资源与环境,2008,22(5):68-73. |
| 6 | Belnap J,Munson S M,Field J P.Aeolian and fluvial processes in dryland regions:the need for integrated studies[J].Ecohydrology,2011,4(5):615-622. |
| 7 | Moustafa W M,Hussien R A,Nassar N.Evaluation of potential hazards associated with qattara depression as a national hydropower project in Egypt[J].Arab Journal of Nuclear Sciences and Applications,2018,51(2):58-67. |
| 8 | 段庆光,石蒙沂,王斌,等.龙羊峡库区风沙现状及其对库区的影响[J].干旱区研究,1990,8:22-29. |
| 9 | 姚檀栋,朱立平.青藏高原环境变化对全球变化的响应及其适应对策[J].地球科学进展,2006,21(5):459-464. |
| 10 | 杨根生,刘阳宜,史培军.黄河沿岸风成沙入黄沙量估算[J].科学通报,1988,13:1017-1021. |
| 11 | 方学敏.黄河干流宁蒙河段风沙入黄量计算[J].人民黄河,1993,4:1-4. |
| 12 | 高宏智,邹桂香.龙羊峡水库周围风沙流观测、计算及对库区的影响[J].干旱区资源与环境,1989,3(1):59-69. |
| 13 | 杨东亮,王雪芹,胡永锋,等.风沙流输沙通量垂向分布研究:以塔克拉玛干沙漠南缘流沙地表风沙流观测为例[J].中国沙漠,2012,32(3):631-639. |
| 14 | 韩致文,缑倩倩,杜鹤强,等.新月形沙丘表面100 cm高度内风沙流输沙量垂直分布函数分段拟合[J].地理科学,2012,32(7):892-897. |
| 15 | 毛东雷,蔡富艳,雷加强,等.新疆策勒河下游塔克拉玛干沙漠南缘风沙活动特征[J].干旱区资源与环境,2016,30(7):169-174. |
| 16 | 刘芳,郝玉光,徐军,等.乌兰布和沙区风沙运移特征分析[J].干旱区地理,2014,37(6):1163-1169. |
| 17 | 张正偲,董治宝.腾格里沙漠东南部野外风沙流观测[J].中国沙漠,2013,33(4):973-980. |
| 18 | Eryrear D W,Saleh A,Bilbro J D,et al.Revised Wind Erosion Equation[R].Lubbork,USA:ARS,1998. |
| 19 | Shao Y P.A model for mineral dust emission[J].Journal of Geophysical Research,2001,106(20):236-254. |
| 20 | 李振全.黄河石嘴山至巴彦高勒河段风沙入黄量研究[D].西安:西安理工大学,2019. |
| 21 | 董治宝,吕萍.深空探测时代的风沙地貌学[J].地球科学进展,2019,34(10):1001-1014. |
| 22 | 董治宝,吕萍.70年来中国风沙地貌学的发展[J].地理学报,2020,75(3):509-528. |
| 23 | 何京丽,张三红,崔巍,等.黄河内蒙古段乌兰布和沙漠入黄风积沙监测研究[J].水土保持,2011,10:46-48. |
| 24 | Ayoub F,Sébastien L,Avouac J P.Co-registration and correlation of aerial photographs for ground deformation measurements[J].Journal of Photogrammetry and Remote Sensing,2009,64(6):551-560. |
| 25 | Leprince S,Ayoub F,Klinger Y,et al.Co-Registration of optically sensed images and Correlation (Cosi-Corr):an operational methodology for ground deformation measurements[J].IEEE,2007:1943-1946. |
| 26 | Turk T.Determination of mass movements in slow-motion landslides by the COSI-Corr method[J].Geomatics,Natural Hazards and Risk,2018,9(1):325-336. |
| 27 | Michele M D,Sébastien L,Jérme T,et al.Direct measurement of ocean waves velocity field from a single SPOT-5 dataset[J].Remote Sensing of Environment,2012,119:266-271. |
| 28 | Al-Mutiry M,Hermas E A,Al-Ghamdi K A,et al.Estimation of dune migration rates north Riyadh City,KSA,using SPOT 4 panchromatic images[J].Journal of African Earth Sciences,2016,124:258-269. |
| 29 | Vermeesch P.A 45-year time series of Saharan dune mobility from remote sensing[J].EGU General Assembly,2012,39:1-5. |
| 30 | Vermeesch P,Drake N.Remotely sensed dune celerity and sand flux measurements of the world's fastest barchans (Bodele,Chad) [J].Geophysical Research Letters,2008,35:1-6. |
| 31 | Scheidt S P,Lancaster N.The application of COSI-Corr to determine dune system dynamics in the southern Namib Desert using ASTER data[J].Earth Surface Process and Landforms,2013,38:1004-1019. |
| 32 | 邵梅,罗万银,车雪华.COSI-Corr技术在风沙地貌研究中的初步应用及精度检验[J].中国沙漠,2020,40(3):151-158. |
| 33 | 李森,颜长珍,宋翔,等.近30 a龙羊峡水库周边地区沙漠化遥感监测[J].中国沙漠,2011,31(4):836-841. |
| 34 | 沙占江,马海州,李玲琴,等.共和盆地龙羊峡库区1987—1999年间土地覆被变化过程[J].中国沙漠,2005,25(1):22-28. |
| 35 | 黄华兵,马海州,沙占江,等.基于RS的龙羊峡库区悬浮泥沙分布研究[J].盐湖研究,2004,4:34-37. |
| 36 | 董治宝.中国风沙物理研究五十年(I)[J].中国沙漠,2005,25(3):293-305. |
| 37 | Necsoiu M,Sébastien L,Hooper D M,et al.Monitoring migration rates of an active subarctic dune field using optical imagery[J].Remote Sensing of Environment,2009,113(11):2441-2447. |
| 38 | Baird T,Bristow C S,Vermeesch P.Measuring sand dune migration rates with COSI-Corr and Landsat:opportunities and challenges[J].Remote Sensing,2019,11(20):2423. |
| 39 | 邵梅.沙源限制条件下沙丘的移动和变形研究:以共和盆地二塔拉地区为例[D].兰州:中国科学院西北生态环境资源研究院,2021. |
| 40 | 王翠,李生宇,雷加强,等.不同下垫面沙通量估算:以策勒绿洲-沙漠过渡带为例[J].干旱区地理,2017,40(3):533-540. |
| 41 | Luo W Y,Wang Z Y,Shao M,et al.Historical evolution and controls on mega-blowouts in northeastern Qinghai-Tibetan Plateau,China[J].Geomorphology,2019,329:17-31. |
| 42 | Michele M D,Leprince S,Thiébota J,et al.Direct measurement of ocean waves velocity field from a single SPOT-5 dataset[J].Remote Sensing of Environment,2012,119:266-271. |
| 43 | Wolfe S A,David P.Parabolic dunes:examples from the great sand hills,southwestern saskatchewan[J].The Canadian geographer,1997,41(2):207-214. |
| 44 | Hesp P.The formation of shadow dunes[J].Journal of Sedimentary Research,1981,51(1):101-112. |
| 45 | 余沛东,陈银萍,李玉强,等.植被盖度对沙丘风沙流结构及风蚀量的影响[J].中国沙漠,2019,39(5):29-36. |
| 46 | 高艳红,刘伟,冉有华,等.黑河流域植被覆盖度计算及其影响的中尺度模拟[J].高原气象,2007(2):270-277. |
| 47 | Vandijk P M,Arens S M,Boxel J H V.Aeolian processes across transverse dunes.II:modelling the sediment transport and profile development[J].Earth Surface Processes and Landforms,1999,24:319-333. |
| 48 | 王中原,罗万银,董治宝,等.共和盆地高寒草原风蚀坑表层沉积物粒度特征及动力学意义[J].中国沙漠,2017,37(1):7-16. |
| 49 | Mckenna W.An evolutionary model of parabolic dune development:from blowout to mature parabolic,padre island national seashore,Texas[D].Manoa,USA:University of Hawai’I at Manoa,2007. |
| 50 | 孙建光,李保国,卢琦.青海共和盆地气温的时空动态及其效应分析[J].地理科学进展,2004,23(3):100-106. |
| 51 | 郭连云,熊联胜,王万满.近50年气候变化对塔拉滩草地荒漠化的影响[J].水土保持研究,2008,15(6):57-63. |
| 52 | Dong Z B,Hu G Y,Qian G Q,et al.High-altitude aeolian research on the Tibetan Plateau[J].Reviews of Geophysics,2017,55(6):1-38. |
| [1] | 王兆云, 牛改红, 柳本立. 风沙活动强度3种估算指标对比及适用性分析[J]. 中国沙漠, 2021, 41(3): 118-129. |
| [2] | 马鹏飞, 张正偲, 论珠群培, 高佳佳, 戴睿, 次旺, 潘凯佳. 雅鲁藏布江曲水-泽当段风沙活动动力条件分析与风沙灾害防治建议[J]. 中国沙漠, 2021, 41(1): 10-18. |
| [3] | 邵梅, 罗万银, 车雪华. COSI-Corr技术在风沙地貌研究中的初步应用及精度检验[J]. 中国沙漠, 2020, 40(3): 151-158. |
| [4] | 汪海娇, 田丽慧, 张登山, 吴汪洋, 张明远, 张宏巍, 王俏雨, 周鑫. 青海湖东岸沙地风沙活动特征[J]. 中国沙漠, 2020, 40(1): 49-56. |
| [5] | 周刚平, 黄小忠, 王宗礼, 张军, 谢海超. 基于粒度数据重建的近2 000 a新疆博斯腾湖区域风沙活动[J]. 中国沙漠, 2019, 39(2): 86-95. |
| [6] | 李腾飞, 李金凤, 鲁瑞洁, 刘小槺, 陈璐. 青海湖东岸沙地风成沉积物粒度敏感组分及其古气候意义[J]. 中国沙漠, 2017, 37(5): 878-884. |
| [7] | 郎丽丽, 王训明, 朱秉启, 王向东, 花婷, 王广涛, 李晖, 张彩霞. 河西走廊西端灌丛沙丘发育过程及其对沙漠化的指示意义[J]. 中国沙漠, 2017, 37(4): 611-620. |
| [8] | 李永山, 彭文昌, 任亮, 李勇. 近50年黄河乌兰布和沙漠段辫状河道演变[J]. 中国沙漠, 2016, 36(6): 1689-1694. |
| [9] | 安志山, 张克存, 谭立海. 沙漠-绿洲过渡带风沙活动特征——以敦煌黑山嘴地区为例[J]. 中国沙漠, 2016, 36(6): 1653-1658. |
| [10] | 李晋昌, 韩柳彦, 赵艳芳, 张红, 武志涛. 晋北沙漠化地区起沙风风况与输沙势[J]. 中国沙漠, 2016, 36(4): 911-917. |
| [11] | 张莉秋, 张红, 李皎, 李晋昌. 晋北沙漠化地区1980-2014年的气候变化[J]. 中国沙漠, 2016, 36(4): 1116-1125. |
| [12] | 张登山, 张佩, 吴汪洋, 田丽慧. 青海湖东克土沙区风沙运动规律及防治对策[J]. 中国沙漠, 2016, 36(2): 274-280. |
| [13] | 王广涛, 王训明, 郎丽丽. 毛乌素沙地南缘半固定沙丘风沙输移物特征[J]. 中国沙漠, 2016, 36(2): 281-286. |
| [14] | 王训明, 郎丽丽, 花 婷, 张彩霞, 王振亭. 戈壁砾石覆盖度与风蚀强度关系实验研究[J]. 中国沙漠, 2013, 33(2): 313-319. |
| [15] | 杨兴华, 李红军, 何 清, 艾力·买买提明, 霍 文, 刘新春. 塔克拉玛干沙漠荒漠过渡带春季风沙活动特征——以肖塘为例[J]. 中国沙漠, 2012, 32(4): 915-920. |
| 阅读次数 | ||||||
|
全文 |
|
|||||
|
摘要 |
|
|||||
©2018中国沙漠 编辑部
地址: 兰州市天水中路8号 (730000)
电话:0931-8267545
Email:caiedit@lzb.ac.cn;desert@lzb.ac.cn

 甘公网安备 62010202000688号