中国沙漠 ›› 2023, Vol. 43 ›› Issue (3): 9-20.DOI: 10.7522/j.issn.1000-694X.2022.00124
卜凡蕊( ), 刘颖, 邹学勇
收稿日期:2022-09-14
修回日期:2022-09-28
出版日期:2023-05-20
发布日期:2023-05-31
作者简介:卜凡蕊(1999—),女,安徽亳州市人,硕士研究生,主要从事土壤风蚀与荒漠化防治研究。E-mail: 1556458552@qq.com
基金资助:
Fanrui Bu(), Ying Liu, Xueyong Zou
Received:2022-09-14
Revised:2022-09-28
Online:2023-05-20
Published:2023-05-31
摘要:
降水对中国东部沙地植被覆盖度产生重要影响,了解植被覆盖度对降水量变化的响应,对制定植被恢复策略具有重要意义。选择毛乌素沙地和科尔沁沙地,使用Landsat系列数据和MODIS数据得到2000—2020年归一化植被指数(NDVI)数据集,用像元二分法分别计算了年内最大和生长季平均的植被覆盖度。结合地面气象站在1999—2020年观测的逐日降水数据,分析了植被覆盖度对降水变化的响应。结果表明:(1)毛乌素沙地和科尔沁沙地的年内最大和生长季平均植被覆盖度均有增长趋势,其中毛乌素沙地的生长季平均植被覆盖度>30%的面积增加最显著,科尔沁沙地>50%的面积增加最显著。(2)这两个沙地的年降水量和四季降水量都呈增加趋势,且有降水变率大和夏季增幅最大的共同特点。(3)毛乌素沙地的年内最大和生长季平均植被覆盖度都对前一年夏季降水量变化的响应最敏感,而在科尔沁沙地则是对当年夏季降水量变化的响应最敏感。(4)不同植被类型对降水量变化发生响应的滞后时间不同。
中图分类号:
卜凡蕊, 刘颖, 邹学勇. 中国东部典型沙地植被覆盖度对降水变化的响应[J]. 中国沙漠, 2023, 43(3): 9-20.
Fanrui Bu, Ying Liu, Xueyong Zou. Response of vegetation coverage to precipitation change in the typical sandy lands of eastern China[J]. Journal of Desert Research, 2023, 43(3): 9-20.
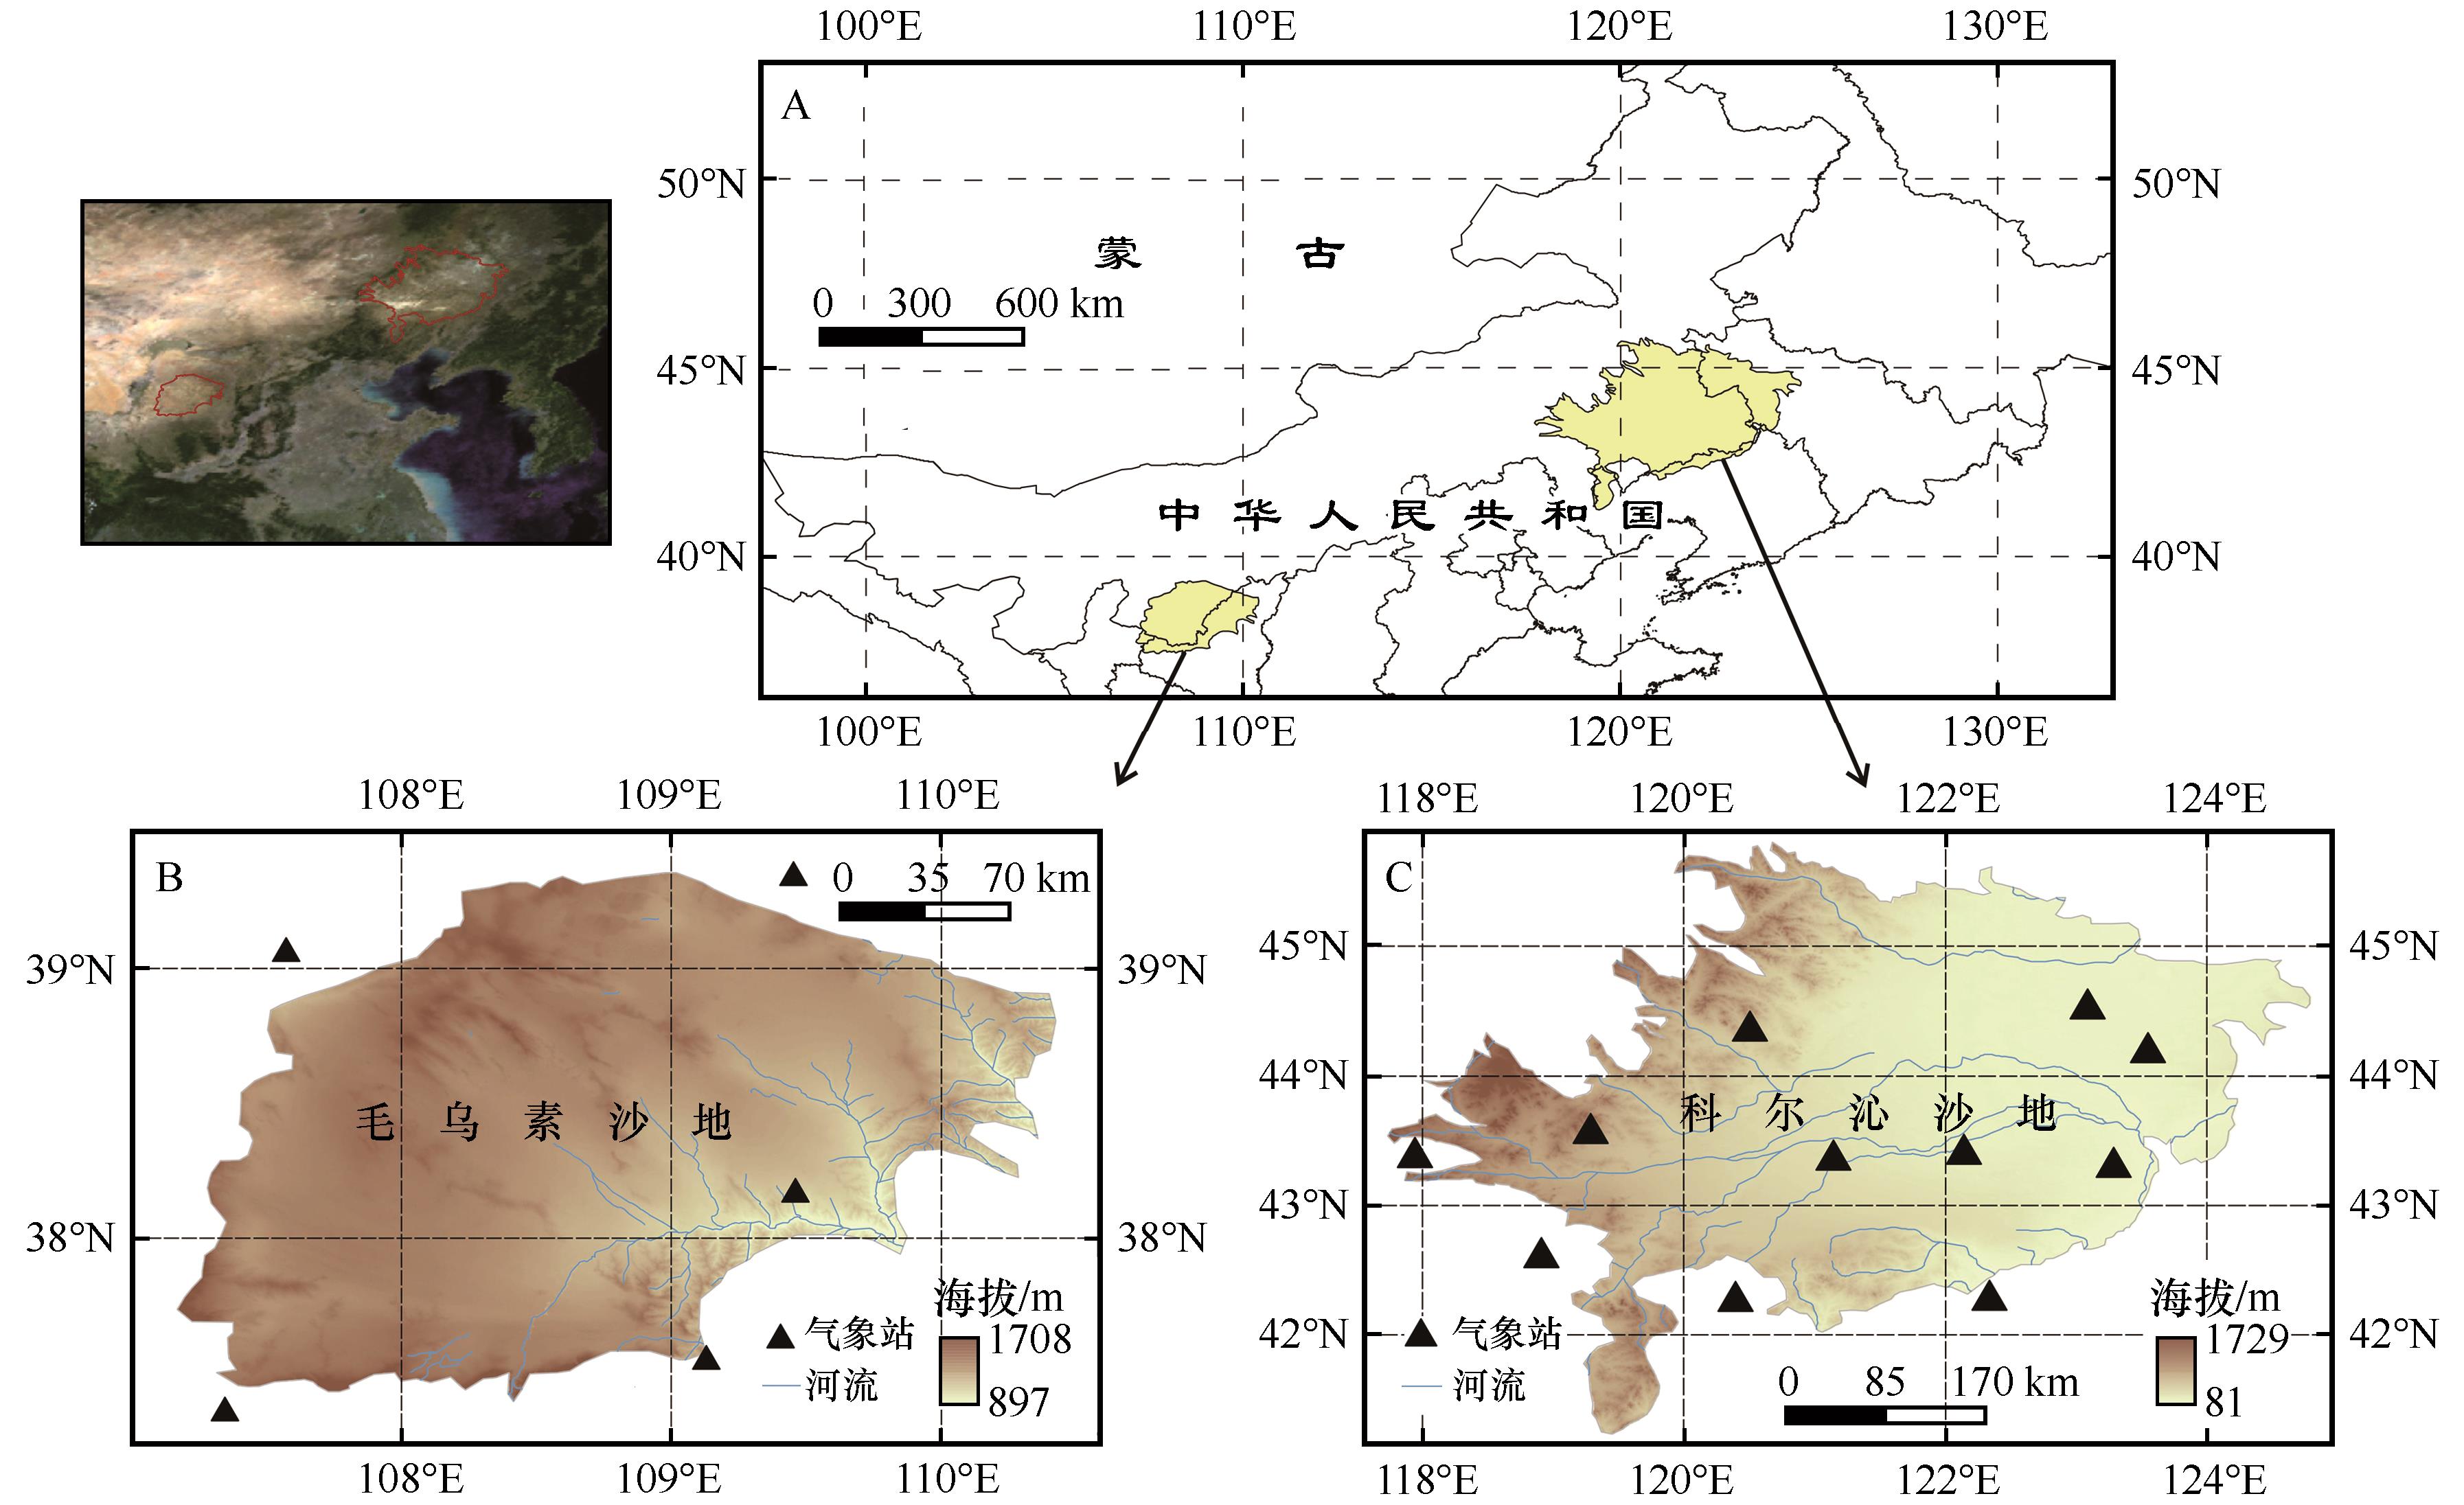
图1 研究区位置(A)及毛乌素沙地(B)和科尔沁沙地(C)的地形
Fig.1 The location of the study areas (A), DEM of Mu Us Sandy Land (B) and Horqin Sandy Land (C)
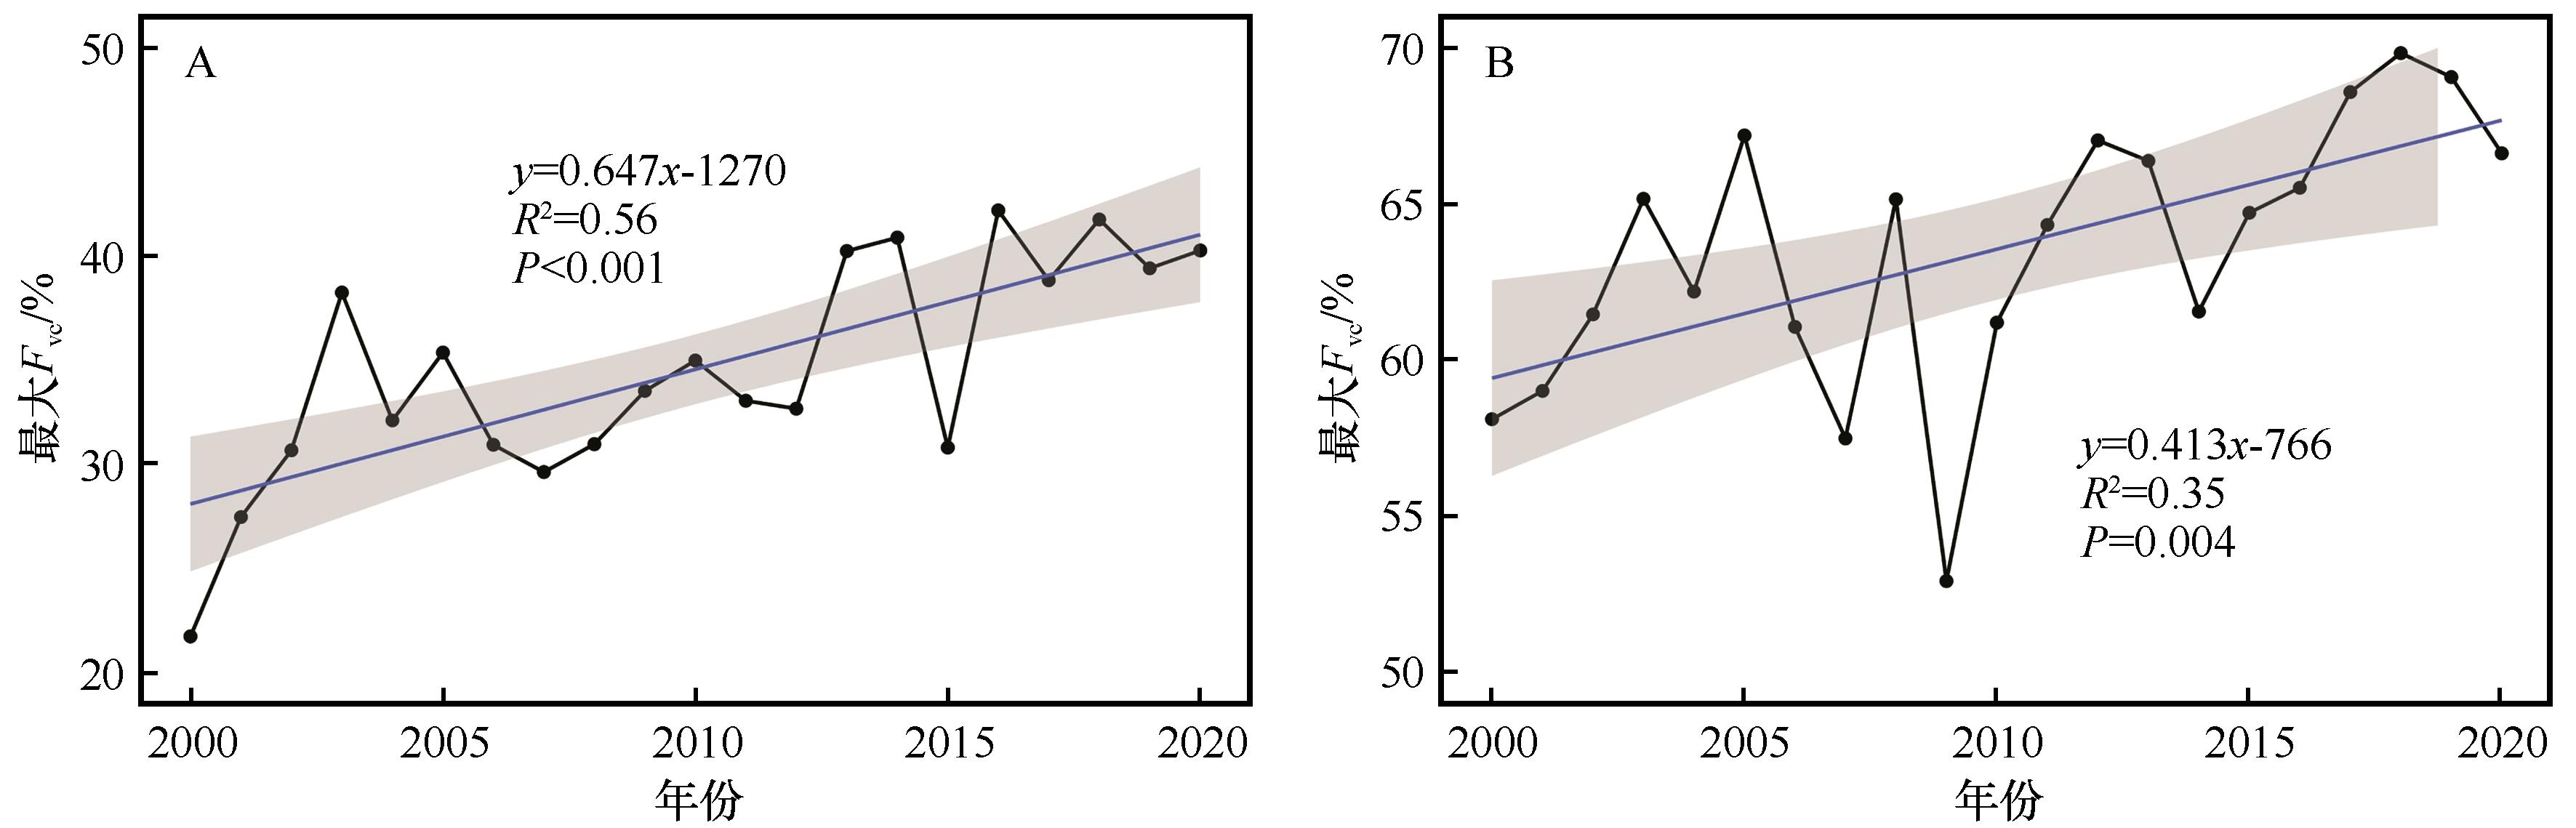
图2 2000—2020年毛乌素沙地(A)与科尔沁沙地(B)年内最大植被覆盖度(Fvc)变化趋势
Fig.2 Variation of the yearly maximum vegetation coverage (Fvc) in Mu Us Sandy Land (A) and Horqin Sandy Land (B) during 2000-2020
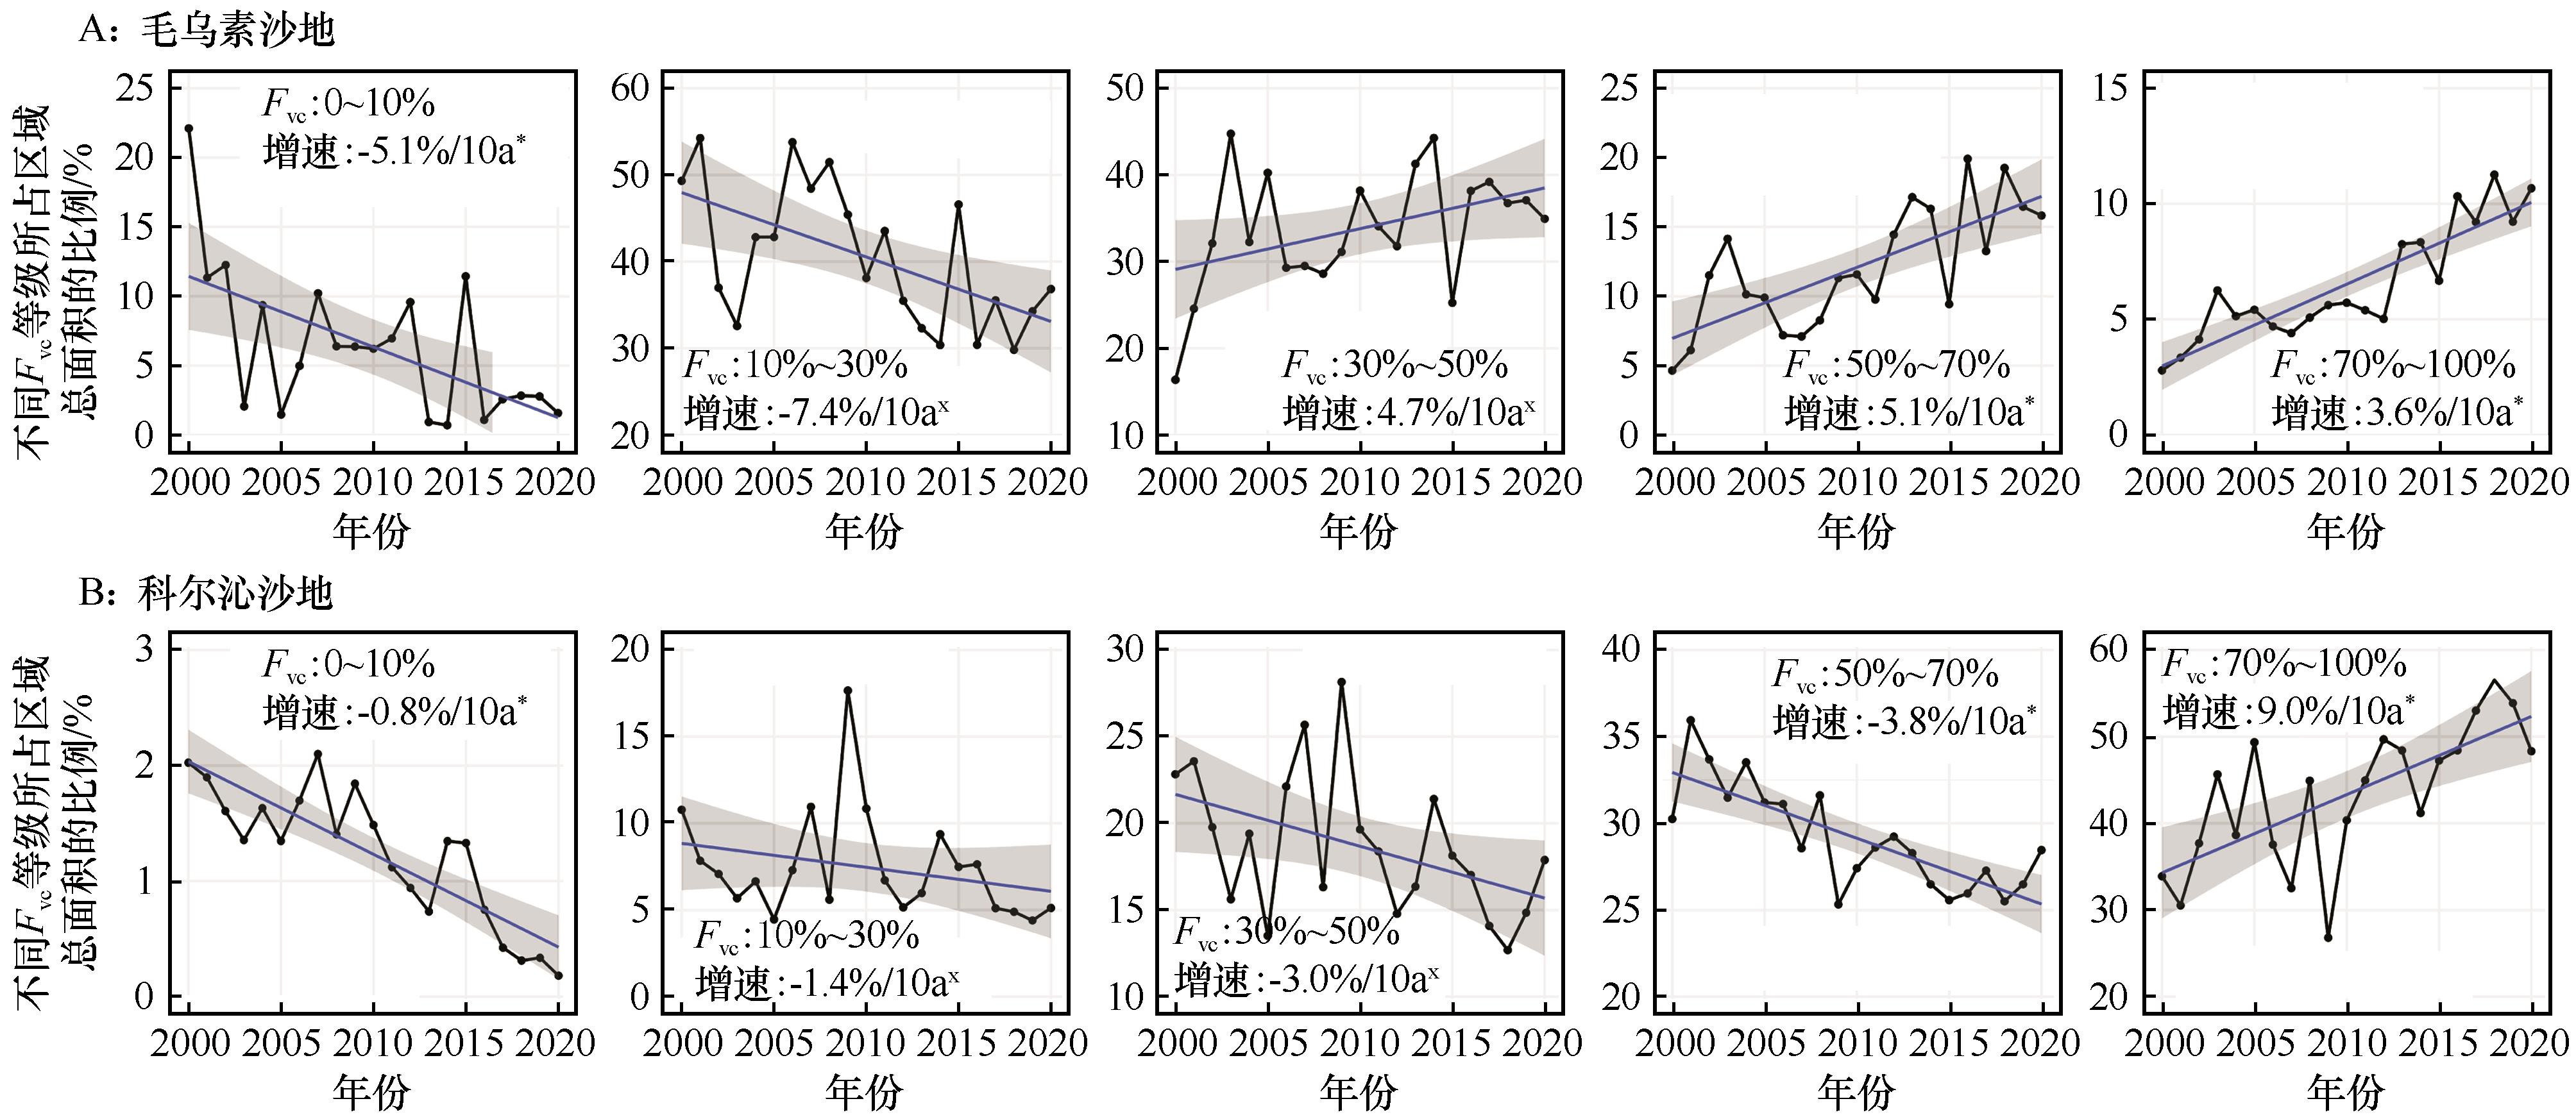
图3 2000—2020年毛乌素沙地(A)和科尔沁沙地(B)不同等级的年内最大植被覆盖度(Fvc)所占区域总面积比例变化(*, P<0.05;×,P>0.05)
Fig.3 Proportion of the yearly maximum vegetation coverage (Fvc) with different levels in the total area of Mu Us Sandy Land (A) and Horqin Sandy Land (B) during 2000-2020 (* represents P<0.05, × represents P>0.05)
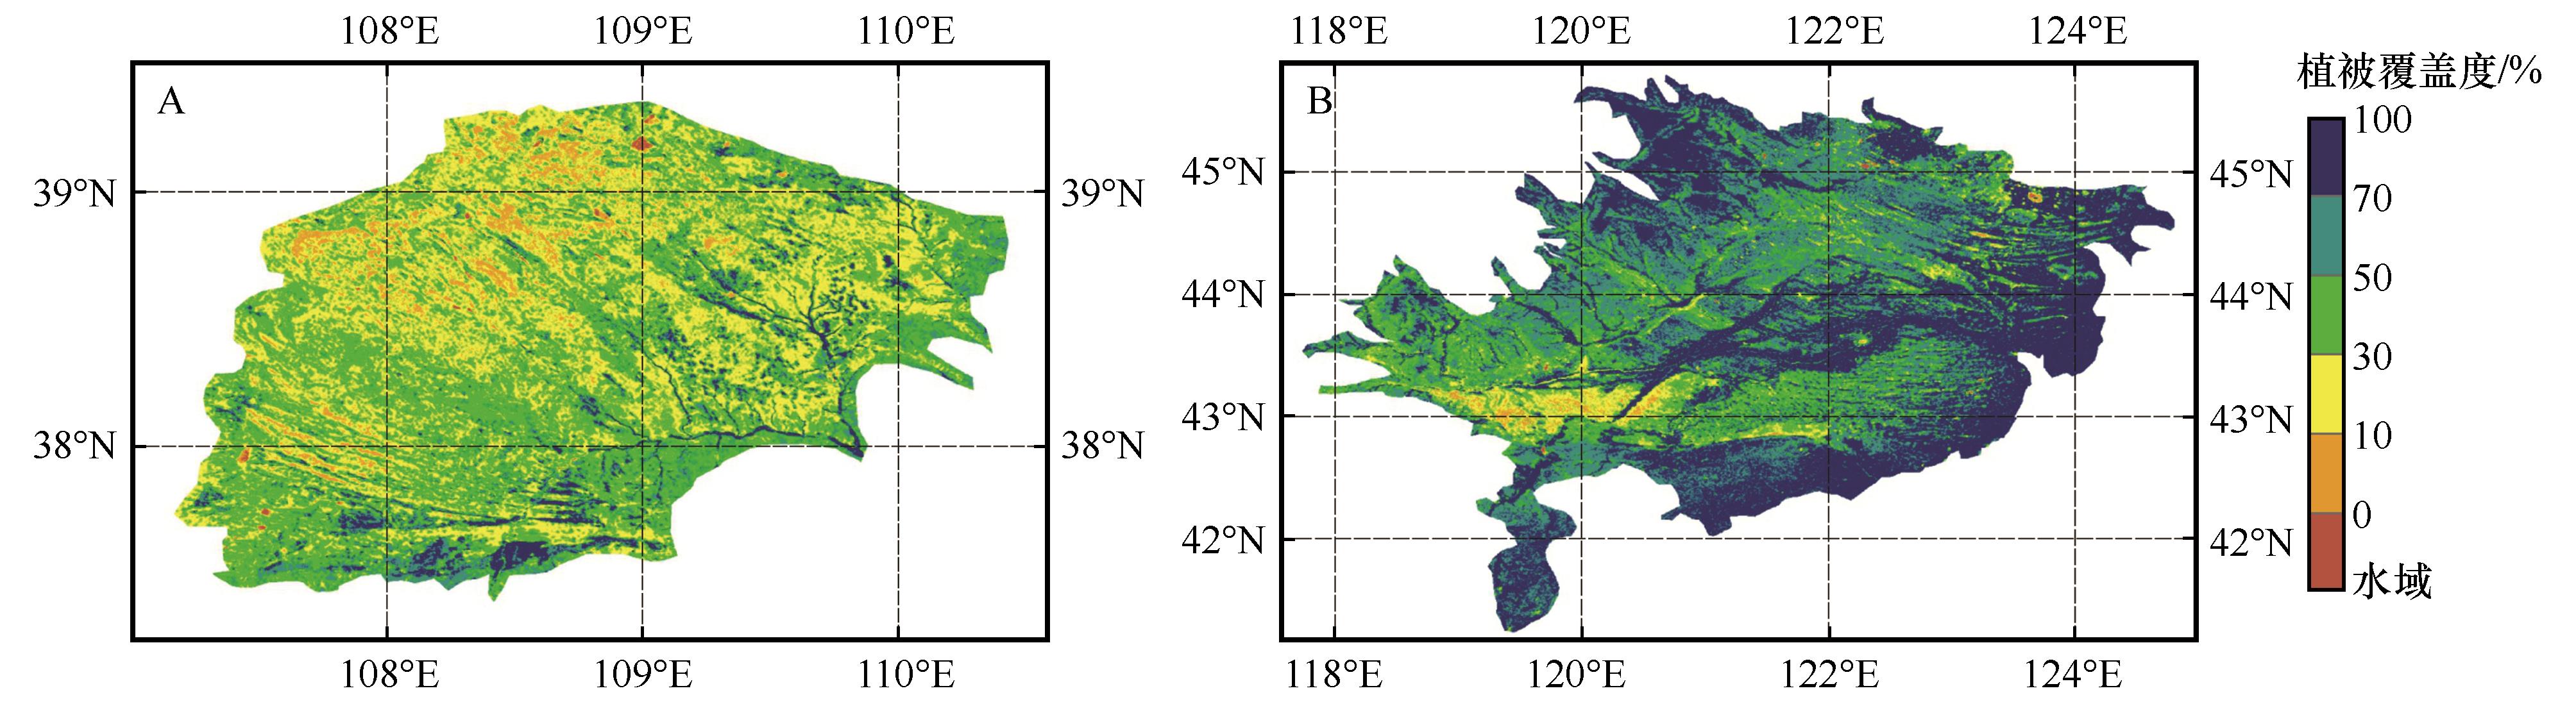
图4 2000—2020年毛乌素沙地(A)和科尔沁沙地(B)年内最大植被覆盖度(Fvc)均值的空间分异
Fig.4 Spatial differentiation of mean values of the yearly maximum vegetation coverage (Fvc) in Mu Us Sandy Land (A) and Horqin Sandy Land (B) during 2000-2020

图5 2000—2020年毛乌素沙地(A)和科尔沁沙地(B)生长季(6—8月)平均植被覆盖度(Fvc)变化趋势
Fig.5 Variation trend of the mean value of vegetation coverage (Fvc) in growing seasons (June to August) in Mu Us Sandy Land (A) and Horqin Sandy Land (B) during 2000-2020
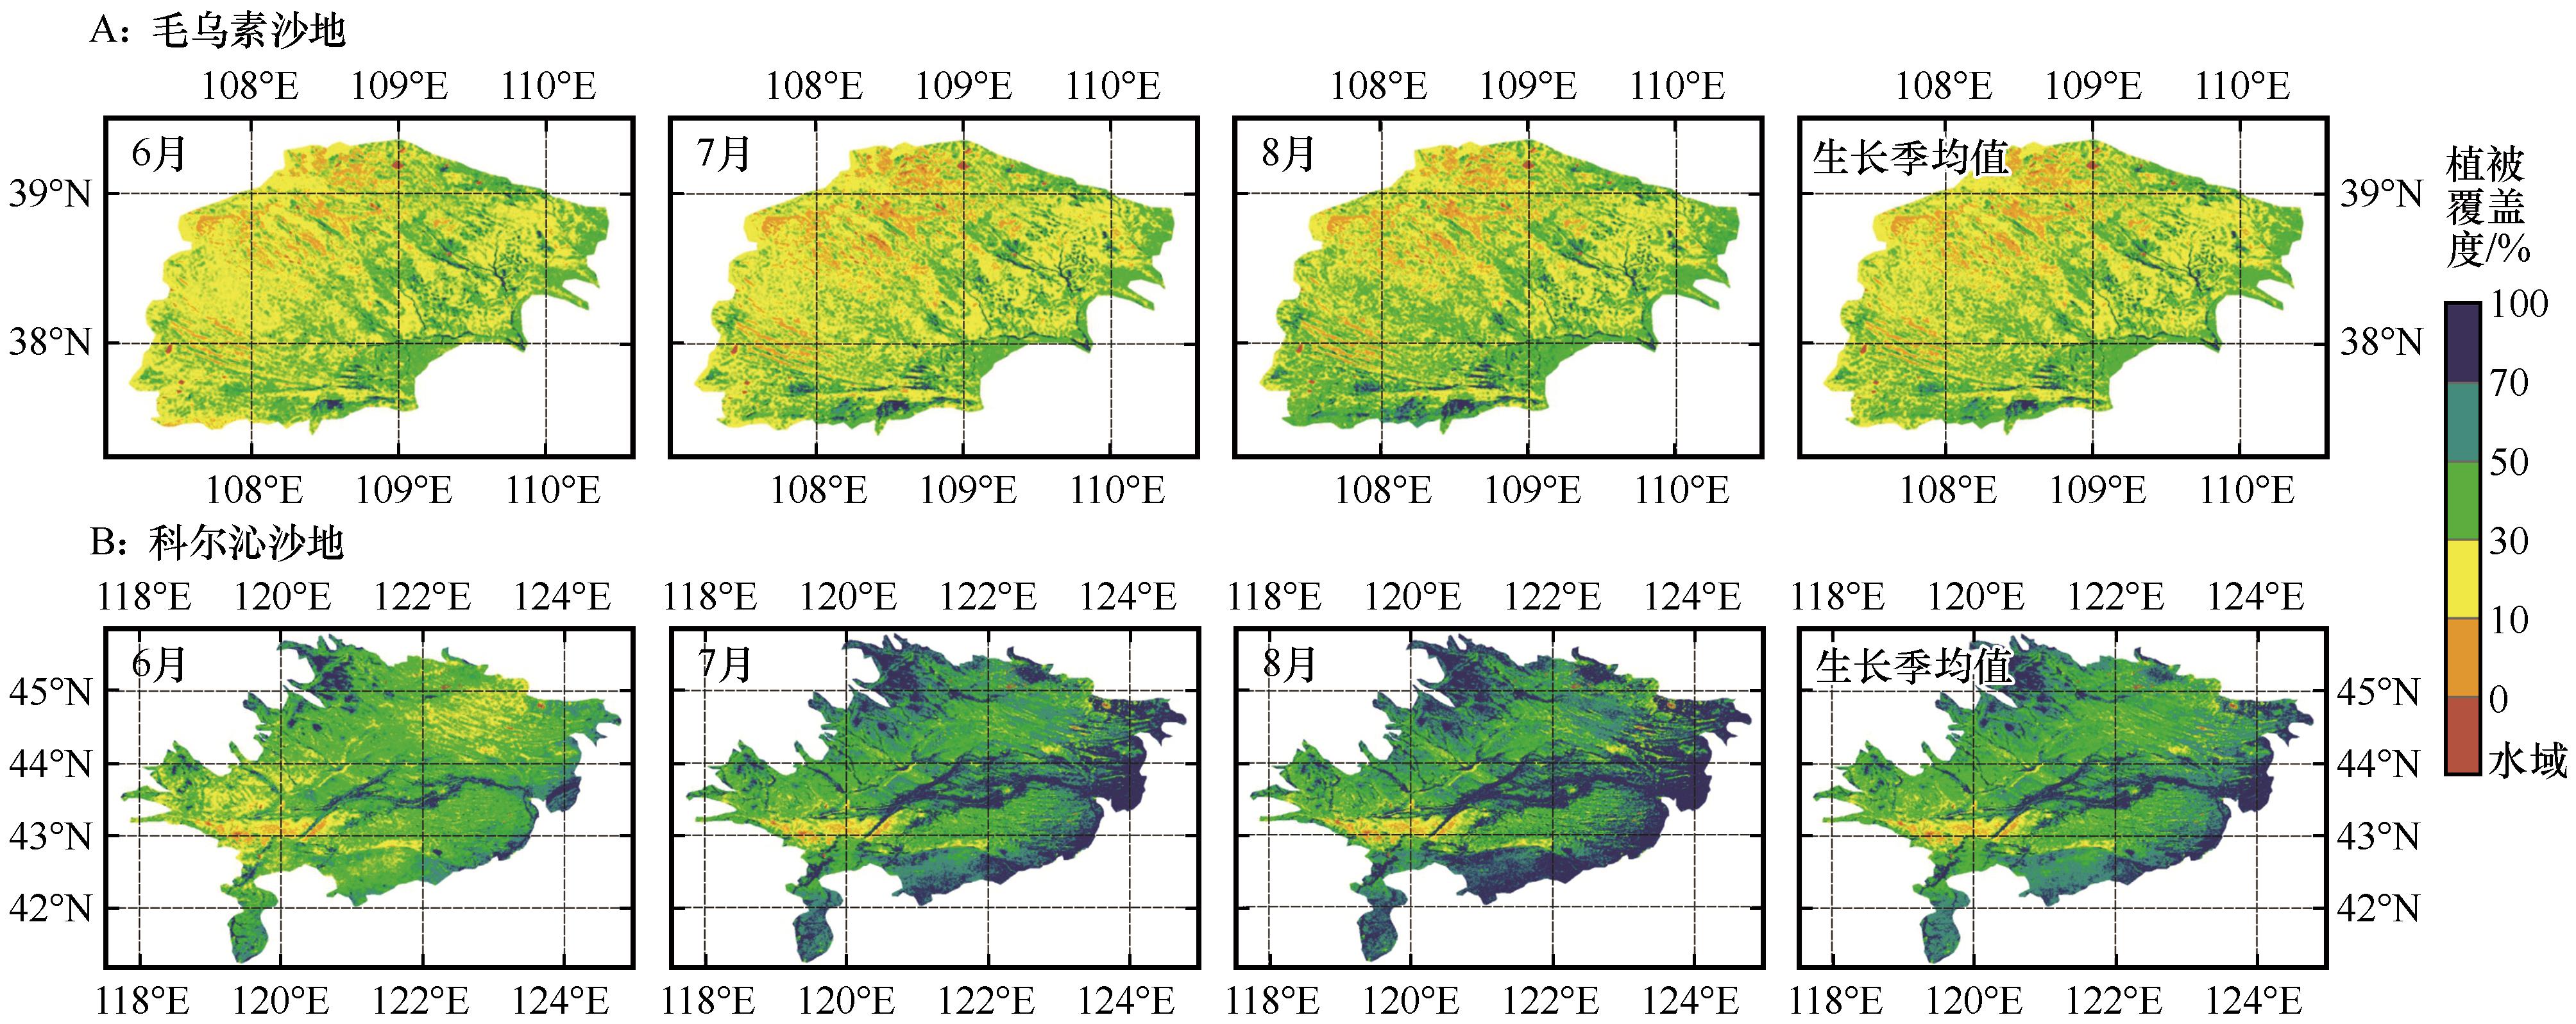
图6 2000—2020年毛乌素沙地(A)和科尔沁沙地(B)生长季各月和生长季平均植被覆盖度的空间分异
Fig.6 Spatial differentiation of monthly vegetation coverage and mean vegetation average in growing seasons in Mu Us Sandy Land (A) and Horqin Sandy Land (B) during 2000-2020
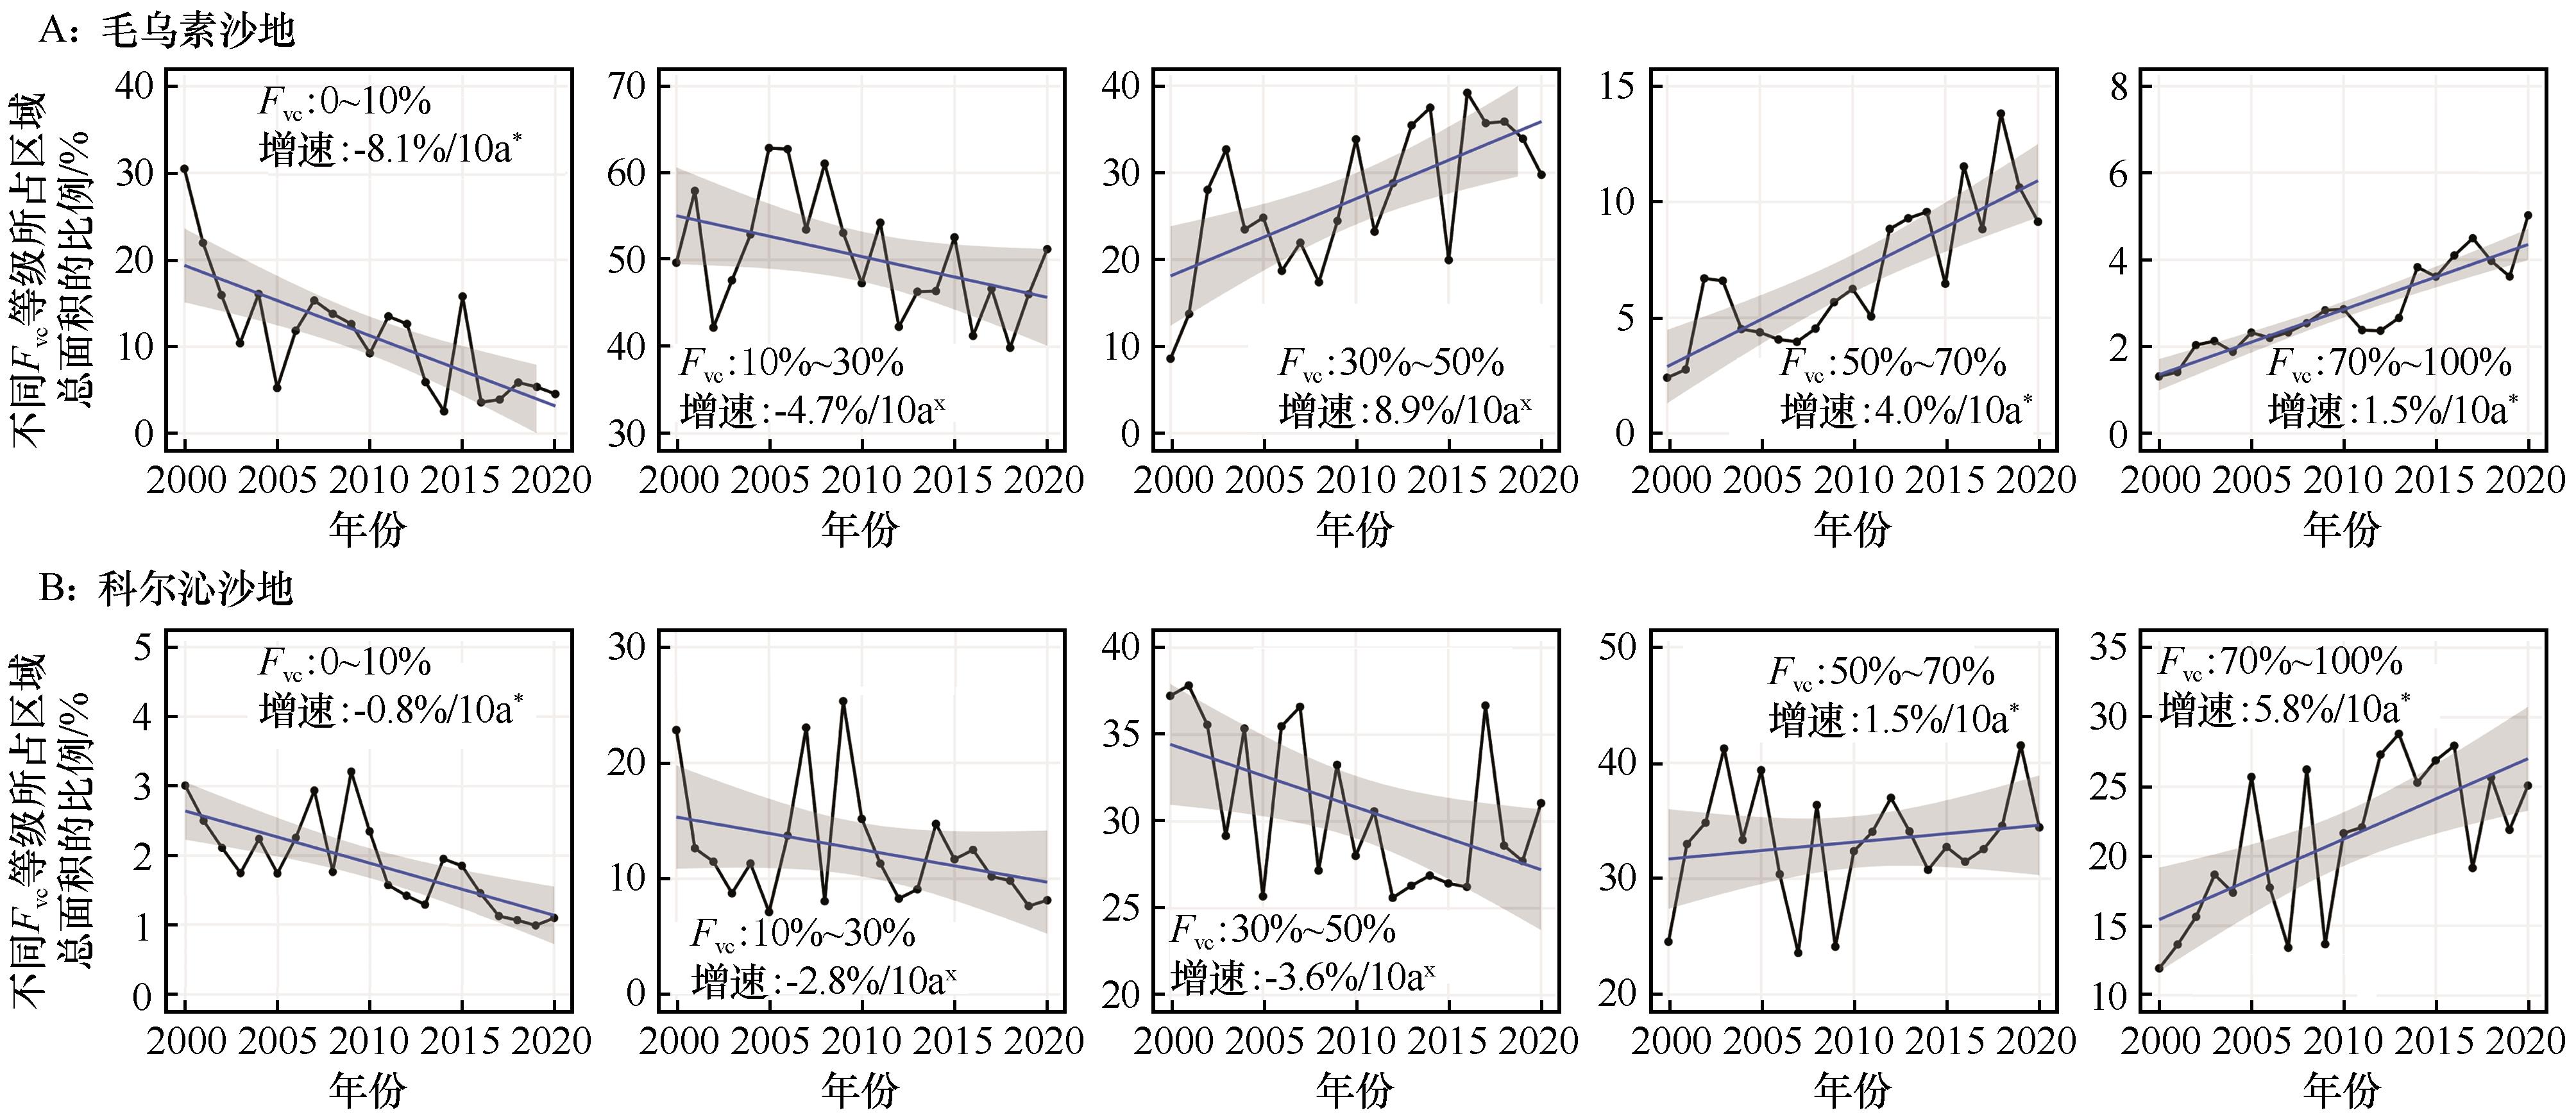
图7 2000—2020年毛乌素沙地(A)和科尔沁沙地(B)不同等级的生长季平均植被覆盖度(Fvc)所占区域总面积比例变化趋势(*,P<0.05;×,P>0.05)
Fig.7 Proportion of vegetation coverage (Fvc) with different levels in growing seasons (June to August) in the total area of Mu Us Sandy Land (A) and Horqin Sandy Land (B) during 2000-2020 (* represents P<0.05, × represents P>0.05)
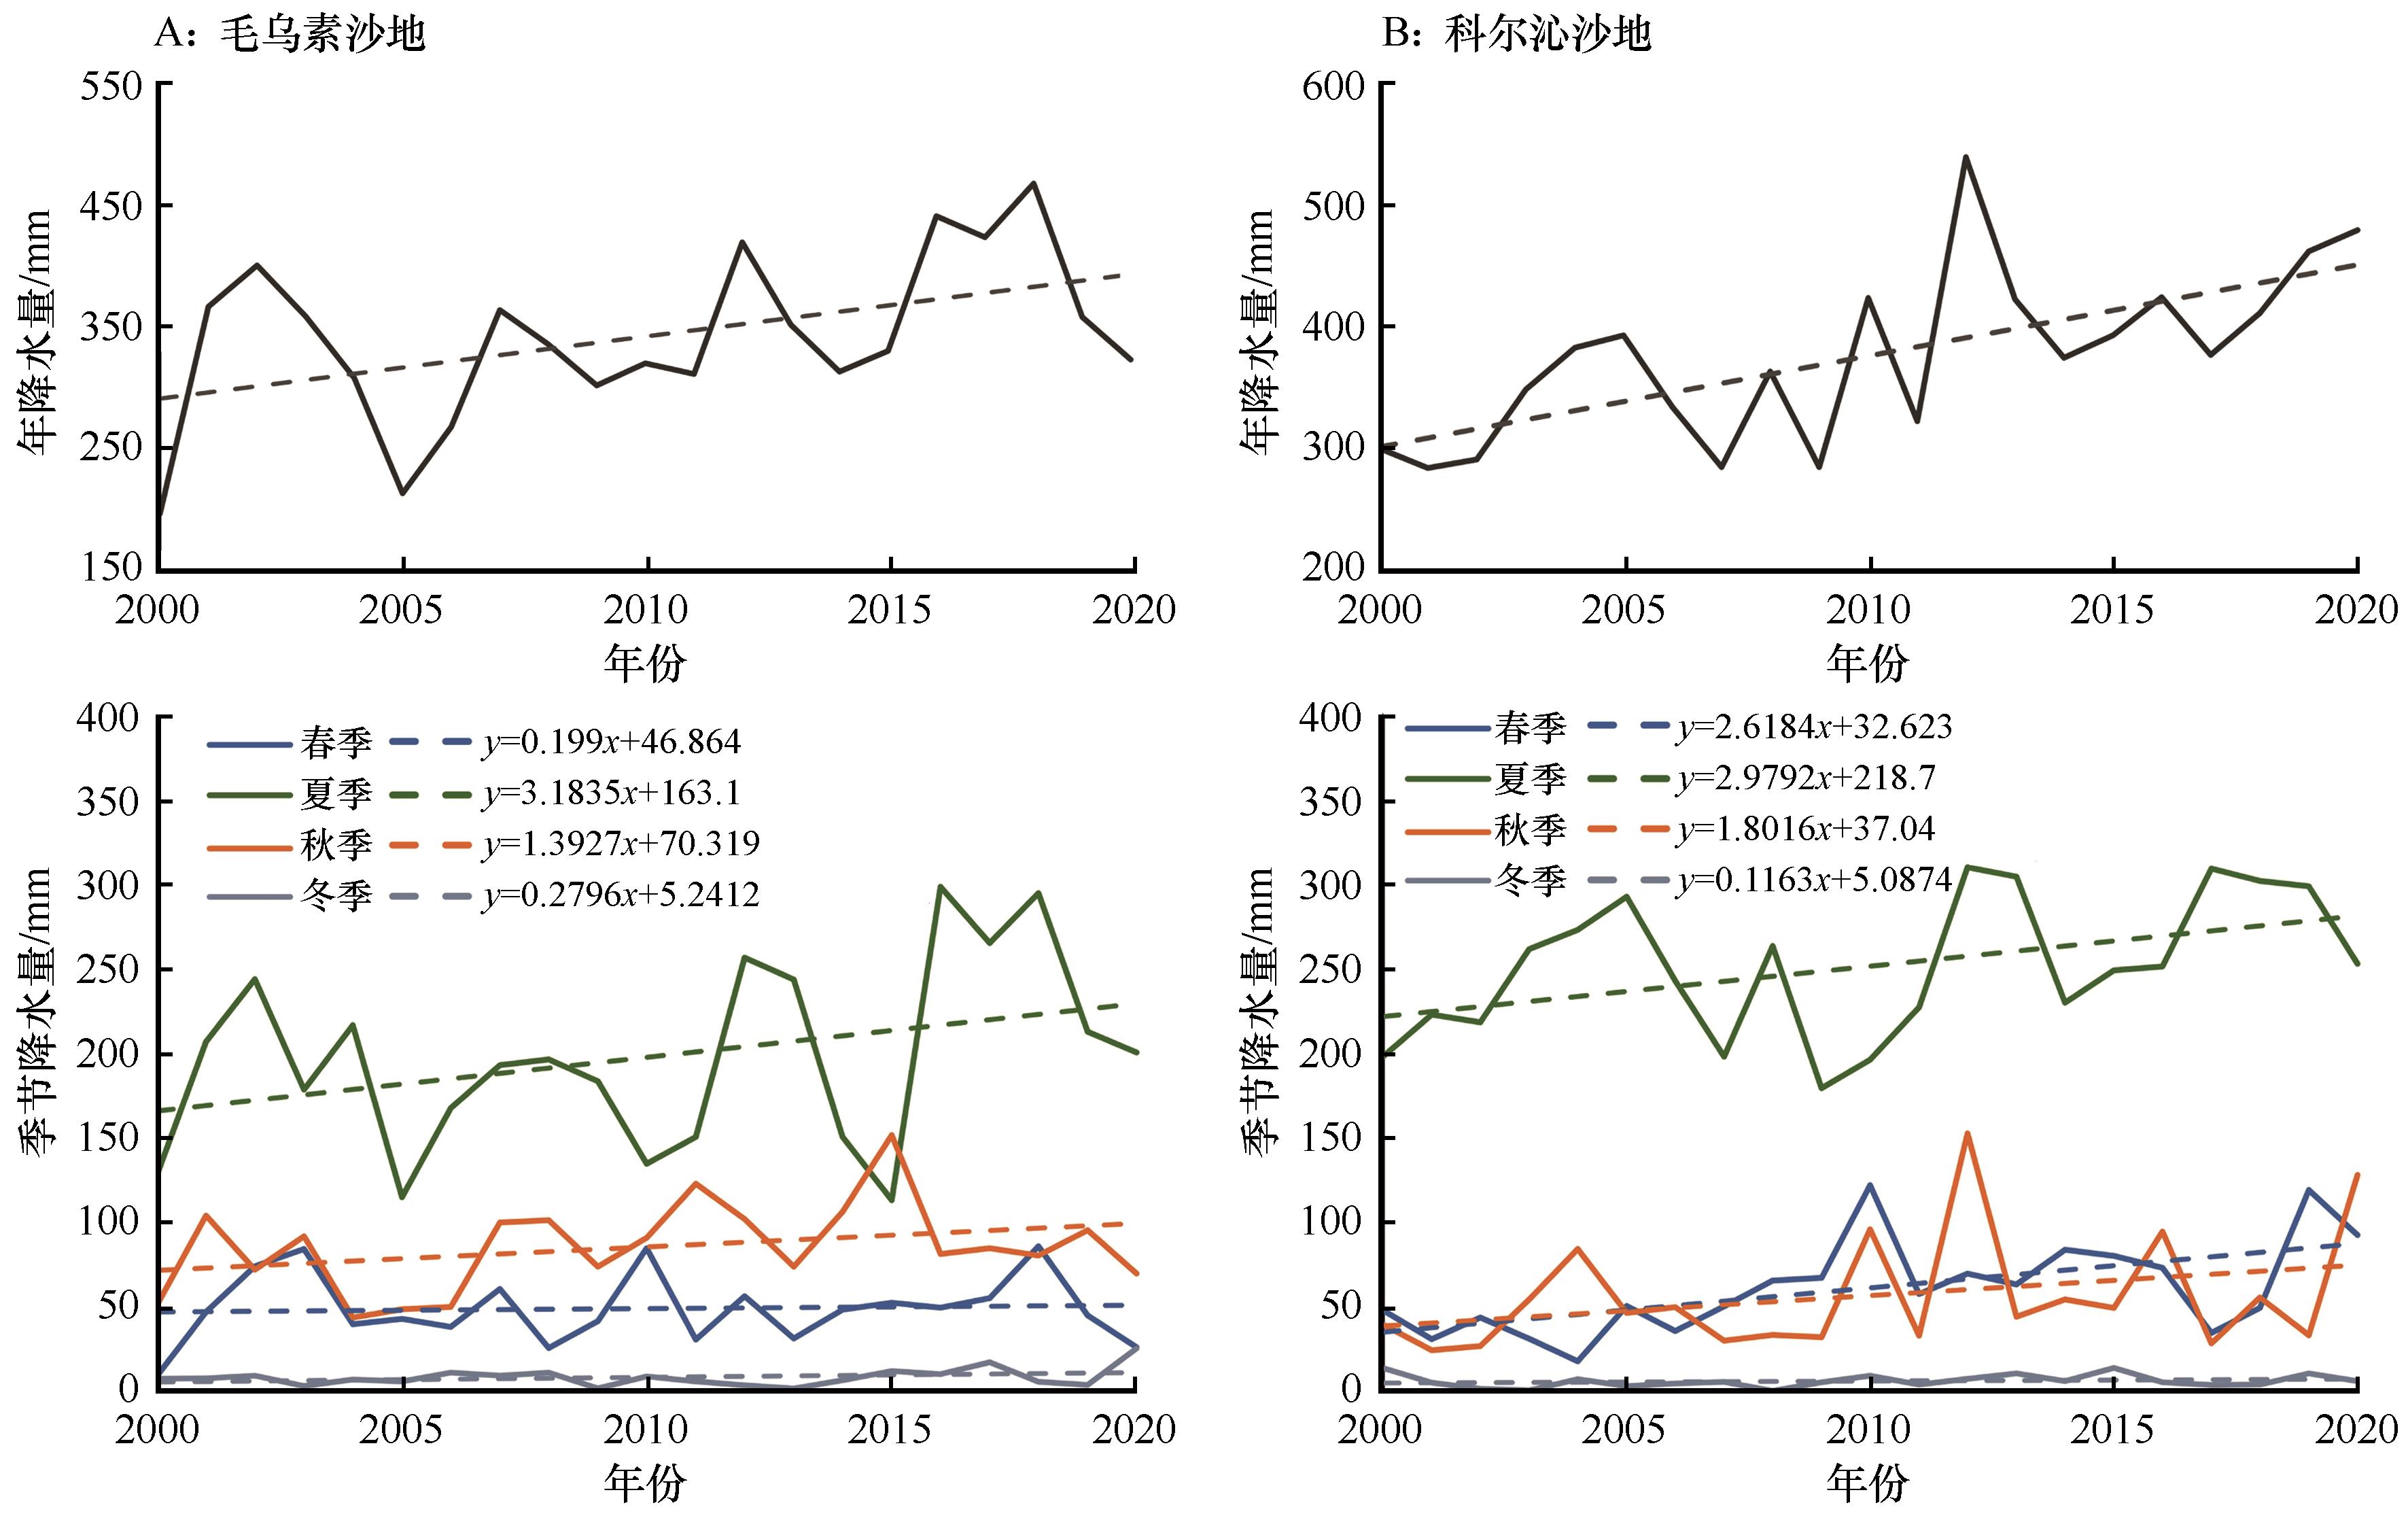
图8 2000—2020年毛乌素沙地(A)和科尔沁沙地(B)降水量变化趋势
Fig.8 Variation of precipitation in Mu Us Sandy Land (A) and Horqin Sandy Land (B) during 2000-2020
| 研究区 | 降水时间 | 年最大植被覆盖度与降水相关性(占比%) | 生长季植被覆盖度与降水相关性(占比%) | |||||||
|---|---|---|---|---|---|---|---|---|---|---|
| 显著 正相关 | 不显著 正相关 | 不显著 负相关 | 显著 负相关 | 显著 正相关 | 不显著 正相关 | 不显著 负相关 | 显著 负相关 | |||
| 毛乌素沙地 | 前一年6—8月 | 46.8 | 45.2 | 7.4 | 0.6 | 52.4 | 41.6 | 5.3 | 0.7 | |
| 前一年9—11月 | 9.1 | 62.1 | 28.1 | 0.7 | 11.2 | 66.8 | 21.5 | 0.5 | ||
| 前一年12月至当年2月 | 5.8 | 70.8 | 22.6 | 0.8 | 9.8 | 65.4 | 23.8 | 1.0 | ||
| 当年3—5月 | 7.0 | 76.2 | 16.7 | 0.1 | 13.9 | 72.5 | 13.5 | 0.1 | ||
| 当年6—8月 | 13.2 | 70.6 | 15.8 | 0.4 | 18.0 | 71.0 | 10.6 | 0.4 | ||
| 科尔沁沙地 | 前一年6—8月 | 7.0 | 61.3 | 30.7 | 1.0 | 7.1 | 64.7 | 27.3 | 0.9 | |
| 前一年9—11月 | 1.6 | 66.6 | 31.1 | 0.7 | 2.3 | 65.9 | 30.6 | 1.2 | ||
| 前一年12月至当年2月 | 2.1 | 60.9 | 36.4 | 0.6 | 3.8 | 68.4 | 27.4 | 0.4 | ||
| 当年3—5月 | 9.8 | 51.7 | 35.0 | 3.5 | 13.8 | 56.4 | 27.7 | 2.1 | ||
| 当年6—8月 | 28.4 | 60.7 | 10.6 | 0.3 | 22.4 | 65.8 | 11.4 | 0.4 | ||
表1 不同季节降水量同植被覆盖度的相关性( P<0.05)
Table 1 Correlation between precipitation in different seasons and vegetation coverage ( P<0.05)
| 研究区 | 降水时间 | 年最大植被覆盖度与降水相关性(占比%) | 生长季植被覆盖度与降水相关性(占比%) | |||||||
|---|---|---|---|---|---|---|---|---|---|---|
| 显著 正相关 | 不显著 正相关 | 不显著 负相关 | 显著 负相关 | 显著 正相关 | 不显著 正相关 | 不显著 负相关 | 显著 负相关 | |||
| 毛乌素沙地 | 前一年6—8月 | 46.8 | 45.2 | 7.4 | 0.6 | 52.4 | 41.6 | 5.3 | 0.7 | |
| 前一年9—11月 | 9.1 | 62.1 | 28.1 | 0.7 | 11.2 | 66.8 | 21.5 | 0.5 | ||
| 前一年12月至当年2月 | 5.8 | 70.8 | 22.6 | 0.8 | 9.8 | 65.4 | 23.8 | 1.0 | ||
| 当年3—5月 | 7.0 | 76.2 | 16.7 | 0.1 | 13.9 | 72.5 | 13.5 | 0.1 | ||
| 当年6—8月 | 13.2 | 70.6 | 15.8 | 0.4 | 18.0 | 71.0 | 10.6 | 0.4 | ||
| 科尔沁沙地 | 前一年6—8月 | 7.0 | 61.3 | 30.7 | 1.0 | 7.1 | 64.7 | 27.3 | 0.9 | |
| 前一年9—11月 | 1.6 | 66.6 | 31.1 | 0.7 | 2.3 | 65.9 | 30.6 | 1.2 | ||
| 前一年12月至当年2月 | 2.1 | 60.9 | 36.4 | 0.6 | 3.8 | 68.4 | 27.4 | 0.4 | ||
| 当年3—5月 | 9.8 | 51.7 | 35.0 | 3.5 | 13.8 | 56.4 | 27.7 | 2.1 | ||
| 当年6—8月 | 28.4 | 60.7 | 10.6 | 0.3 | 22.4 | 65.8 | 11.4 | 0.4 | ||

图9 研究区年内最大植被覆盖度、生长季平均植被覆盖度与不同季节降水量相关性的空间分异(P<0.05)。A和B分别为毛乌素沙地年内最大植被覆盖度和生长季平均植被覆盖度与不同季节降水量相关性的空间分异,C和D分别为科尔沁沙地年内最大植被覆盖度和生长季平均植被覆盖度与不同季节降水量相关性的空间分异
Fig.9 Spatial differentiation of the correlation between the maximum vegetation coverage, the average vegetation coverage in growing seasons and precipitation in different seasons in the study areas (P<0.05). (A) and (B) represents the maximum vegetation coverage, the average vegetation coverage in growing seasons and precipitation in different seasons in Mu Us Sandy Land, respectively. (C) and (D) represents the maximum vegetation coverage, the average vegetation coverage in growing seasons and precipitation in different seasons in Horqin Sandy Land, respectively
| 1 | 杨萍.中国东部沙区全新世砂质古土壤与古气候变化[D].金华:浙江师范大学,2014. |
| 2 | 高尚玉.京津风沙源治理工程效益[M].北京:科学出版社,2012. |
| 3 | 卢琦.荒漠生态学[M].北京:中国林业出版社,2019:14-15. |
| 4 | Ma Z T, Wang W K, Zhang Z Y,et al.Assessing bare-soil evaporation from different water-table depths using lysimeters and a numerical model in the Ordos Basin,China[J].Hydrogeology Journal,2019,27:2707-2718. |
| 5 | Zhang Y, Gentine P, Luo X Z,et al.Increasing sensitivity of dryland vegetation greenness to precipitation due to rising atmospheric CO2 [J].Nature Communications,2022,13(1):4875. |
| 6 | 车力木格,刘新平,何玉惠,等.半干旱沙地草本植物群落特征对短期降水变化的响应[J].草业学报,2020,29(4):19-28. |
| 7 | Yue X F, Zhang T H, Zhao X Y.Effects of rainfall patterns on annual plants in Horqin sandy land,Inner Mongolia of China[J].Journal of Arid Land,2016,8(3):389-398. |
| 8 | Ren S L, Yi S H, Peichl M,et al.Diverse responses of vegetation phenology to climate change in different grasslands in Inner Mongolia during 2000-2016[J].Remote Sensing,2018,10(1):17-18. |
| 9 | Duan H C, Wang T, Xue X,et al.Dynamics of aeolian desertification and its driving forces in the Horqin Sandy Land,Northern China[J].Environmental Monitoring and Assessment,2014,186(10):6083-6096. |
| 10 | Wang X M, Zhang C X, Hasi E,et al.Has the Three Norths Forest Shelterbelt Program solved the desertification and dust storm problems in arid and semiarid China?[J].Journal of Arid Environments,2010,74(1):13-22. |
| 11 | 周海,赵文智,何志斌.两种荒漠生境条件下泡泡刺水分来源及其对降水的响应[J].应用生态学报,2017,28(7):2083-2092. |
| 12 | Zhao W Z, Liu B.The response of sap flow in shrubs to rainfall-pulses in the desert region of China[J].Agricultural and Forest Meteorology,2010,150(9):1297-1306. |
| 13 | Zhang C C, Li X Y, Wang Y,et al.Responses of two desert shrubs to simulated rainfall pulses in an arid environment,northwestern China[J].Plant and Soil,2018,435(1/2):239-255. |
| 14 | 常学礼,赵爱芬,李胜功.科尔沁沙地固定沙丘植被物种多样性对降水变化的响应[J].植物生态学报,2000,24(2):147-151. |
| 15 | 赵哈林,张铜会,崔建垣,等.近40 a我国北方农牧交错区气候变化及其与土地沙漠化的关系:以科尔沁沙地为例[J].中国沙漠,2000,20():2-7. |
| 16 | Loik M E, Breshears D D, Lauenroth W K,et al.A multi-scale perspective of water pulses in dryland ecosystems:climatology and ecohydrology of the western USA[J].Oecologia,2004,141(2):269-281. |
| 17 | Becker F, Choudhury B J.Relative sensitivity of normalized difference vegetation index (NDVI) and microwave polarization difference index (MPDI) for vegetation and desertification monitoring[J].Remote Sensing of Environment,1988,24(2):297-311. |
| 18 | 原媛.毛乌素沙地植被覆盖和物候变化对总初级生产力的影响[D].北京:北京林业大学,2021. |
| 19 | Liang T, He M Z, Li X R.Verification of fractional vegetation coverage and NDVI of desert vegetation via UAVRS technology[J].Remote Sensing,2020,12(11):1742. |
| 20 | Yang F, Chen H, Niu H H,et al.Spatial and temporal variation of vegetation phenology and its response to climate changes in Qaidam Basin from 2000 to 2015[J].Journal of Geographical Sciences,2018,28(4):400-414. |
| 21 | Zhao Y J, Lu X M, Wang Y,et al.How precipitation legacies affect broad-scale patterns of primary productivity:evidence from the Inner Mongolia grassland[J].Agricultural and Forest Meteorology,2022,320:108954. |
| 22 | Sun Z H, Mao Z G, Yang L Y,et al.Impacts of climate change and afforestation on vegetation dynamic in the Mu Us Desert,China[J].Ecological Indicators,2021,129(9):108020. |
| 23 | 武金洲,郑晓,高添,等.三北防护林体系建设工程对科尔沁沙地社会经济影响的定量分析[J].生态学杂志,2020,39(11):3567-3575. |
| 24 | 朱芳莹.中国北方四大沙地近30年来的沙漠化时空变化及气候影响[D].南京:南京大学,2015. |
| 25 | 徐驰,姜琦刚,李远华,等.呼伦贝尔地区土地荒漠化动态变化[J].世界地质,2010,29(1):160-167. |
| 26 | Zhou D J, Zhao X, Hu H,et al.Long-term vegetation changes in the four mega-sandy lands in Inner Mongolia,China[J].Landscape Ecology,2015,30(9):1613-1626. |
| 27 | 廉泓林,韩雪莹,刘雅莉,等.基于标准化降水蒸散指数(SPEI)的毛乌素沙地1981-2020年干旱特征研究[J].中国沙漠,2022,42(4):71-80. |
| 28 | 郑策,高万德,陈云飞,等.毛乌素沙地冻融期气态水迁移机理及影响因素[J].水科学进展,2022,33(2):227-239. |
| 29 | 王姣月,秦树高,张宇清.毛乌素沙地植被水分利用效率的时空格局[J].中国沙漠,2020,40(5):120-129. |
| 30 | 刘广全,王鸿喆.西北农牧交错带常见植物图谱[M].北京:科学出版社,2012. |
| 31 | Wang J P, Fang Y, Zou X Y,et al.Diverse responses of vegetation phenology to changes in temperature and precipitation in Northern China[J/OL].Geocarto International,2022,. |
| 32 | 吕家欣,李秀芬,郑晓,等.近40年科尔沁沙地植被时空变化及其驱动力[J].生态学杂志,2020,39(5):1399-1408. |
| 33 | 王静茹,马龙,刘廷玺.1951-2012年科尔沁沙地气温、降水变化特征[J].干旱区研究,2016,33(1):49-58. |
| 34 | 方依.中国北方土壤风蚀区非生长季植被覆盖度估算[D].北京:北京师范大学,2019. |
| 35 | 穆少杰,李建龙,陈奕兆,等.2001-2010年内蒙古植被覆盖度时空变化特征[J].地理学报,2012,67(9):1255-1268. |
| 36 | 胡新培,田海静,刘旭升,等.2007-2017年呼伦贝尔沙地植被覆盖度变化及驱动因素研究[J].中南林业调查规划,2019,38(1):50-57. |
| 37 | 侯东杰,郭柯.典型草原植物养分对生长季不同放牧强度的动态响应[J].草地学报,2021,29(1):141-148. |
| 38 | Cui L L, Shi J.Evaluation and comparison of growing season metrics in arid and semi-arid areas of northern China under climate change[J].Ecological Indicators,2021,121:107055. |
| 39 | 朱永华,张生,孙标,等.科尔沁沙地典型区地下水、降水变化特征分析[J].干旱区地理,2017,40(4):718-728. |
| 40 | Guo J T, Hu Y M.Spatiotemporal variations in satellite-derived vegetation phenological parameters in Northeast China [J].Remote Sensing,2022,14(3):705. |
| 41 | 胡光印,文青,董治宝,等.沙漠编目技术规范的初步设计[J].中国沙漠,2014,34(1):29-34. |
| 42 | 土壤侵蚀分类分级标准: [S].2008. |
| 43 | 朱永华,罗平平,郭倩,等.毛乌素沙地暖湿化特征分析及其对植被变化的影响[J].水土保持学报,2022,36(5):1-14. |
| 44 | Liu X Y, Lai Q, Yin S,et al.Exploring sandy vegetation sensitivities to water storage in China's arid and semi-arid regions[J].Ecological Indicators,2022,136:108711. |
| 45 | Zhang M M, Wu X Q.The rebound effects of recent vegetation restoration projects in Mu Us sandy land of China[J].Ecological Indicators,2020,113:106228. |
| 46 | Wang S N, Li R P, Wu Y J,et al.Vegetation dynamics and their response to hydrothermal conditions in Inner Mongolia,China[J].Global Ecology and Conservation,2022,34:E02034. |
| 47 | 王静璞.2000年以来中国北方风蚀区植被覆盖度变化研究[D].北京:北京师范大学,2015. |
| 48 | Lin M, Hou L Z, Qi Z M,et al.Impacts of climate change and human activities on vegetation NDVI in China's Mu Us Sandy Land during 2000-2019[J].Ecological Indicators,2022,142:109164. |
| 49 | Wu T S, Bai H M, Feng F,et al.Multi‐month time‐lag effects of regional vegetation responses to precipitation in arid and semi‐arid grassland:a case study of Hulunbuir,Inner Mongolia[J].Natural Resource Modeling,2022,35(3):E12342. |
| 50 | 王旭洋,李玉霖,连杰,等.半干旱典型风沙区植被覆盖度演变与气候变化的关系及其对生态建设的意义[J].中国沙漠,2021,41(1):183-194. |
| 51 | Fan J Q, Wang L, Qin J X,et al.Evaluating cultivated land stability during the growing season based on precipitation in the Horqin sandy land,China[J].Journal of Environmental Management,2020,276:111269. |
| 52 | 赵学勇,左小安,赵哈林,等.科尔沁不同类型沙地土壤水分在降水后的空间变异特征[J].干旱区地理,2006(2):275-281. |
| 53 | Vicente-Serrano S M, Gouveia C, Camarero J J,et al.Response of vegetation to drought time-scales across global land biomes[J].Proceedings of the National Academy of Sciences of the United States of America,2013,110(1):52-57. |
| 54 | Ruiz-Sinoga J D, Martínez-Murillo J F, Gabarrón-Galeote M A,et al.The effects of soil moisture variability on the vegetation pattern in Mediterranean abandoned fields (Southern Spain)[J].Catena,2011,85(1):1-11. |
| 55 | Tong S Q, Zhang J Q, Ha S,et al.Dynamics of fractional vegetation coverage and its relationship with climate and human activities in Inner Mongolia,China[J].Remote Sensing,2016,8(9):776. |
| 56 | 孙一梅,田青,吕朋,等.科尔沁沙地沙质草地与固定沙丘植物群落结构对极端干旱的响应[J].中国沙漠,2021,41(1):129-136. |
| 57 | Lv J J, Wang X S, Zhou Y X,et al.Groundwater-dependent distribution of vegetation in Hailiutu River catchment,a semi-arid region in China[J].Ecohydrology,2013,6(1):142-149. |
| [1] | 刘轩, 赵珮杉, 高广磊, 赵媛媛, 丁国栋, 糜万林. 沙地樟子松( Pinus sylvestris var. mongolica )物候特征及其对气候的响应[J]. 中国沙漠, 2022, 42(2): 25-35. |
| [2] | 李小院, 张圣微, 王帅, 李瑞燊, 赵星宇, 刘敏敏. 放牧对退化草地近地面辐射的影响[J]. 中国沙漠, 2022, 42(1): 223-233. |
| [3] | 岳祥飞, 张铜会, 赵学勇, 李玉霖, 刘新平, 王少昆. 科尔沁沙地降雨特征分析——以奈曼旗为例[J]. 中国沙漠, 2016, 36(1): 118-123. |
| [4] | 左小安, 赵学勇, 张铜会, 王少昆, 罗亚勇, 周 欣. 沙质草地放牧和封育下物种丰富度和生物量关系的季节变化[J]. 中国沙漠, 2013, 33(2): 501-507. |
| [5] | 刘新平;赵哈林;何玉惠;张铜会;赵学勇;李玉霖. 生长季流动沙地水量平衡研究[J]. 中国沙漠, 2009, 29(4): 663-667. |
| [6] | 常学向, 赵文智. 黑河中游沙枣树干液流的动态变化及其与林木个体生长的关系[J]. 中国沙漠, 2004, 24(4): 473-478. |
| [7] | 王邦锡, 黄久常, 王辉. 不同生长季节光照强度和温度对柠条叶片光合作用和呼吸作用的影响[J]. 中国沙漠, 1996, 11(2): 145-148. |
| 阅读次数 | ||||||
|
全文 |
|
|||||
|
摘要 |
|
|||||
©2018中国沙漠 编辑部
地址: 兰州市天水中路8号 (730000)
电话:0931-8267545
Email:caiedit@lzb.ac.cn;desert@lzb.ac.cn

 甘公网安备 62010202000688号