中国沙漠 ›› 2025, Vol. 45 ›› Issue (5): 78-91.DOI: 10.7522/j.issn.1000-694X.2025.00030
徐德华1( ), 刘强2,3, 李端1, 李继彦1()
收稿日期:2025-01-20
修回日期:2025-03-22
出版日期:2025-09-20
发布日期:2025-09-27
通讯作者:
李继彦
作者简介:徐德华(1998—),男,甘肃景泰人,硕士研究生,主要从事风沙地貌、环境遥感研究。E-mail: zgxudehua@163.com
基金资助:
Dehua Xu1(), Qiang Liu2,3, Duan Li1, Jiyan Li1()
Received:2025-01-20
Revised:2025-03-22
Online:2025-09-20
Published:2025-09-27
Contact:
Jiyan Li
摘要:
吕梁山区位于黄河流域山西段的西部,是典型的生态环境脆弱区域。已有研究的时间跨度较短导致对该区域植被覆盖的长期变化趋势及其驱动力分析仍显不足。本研究利用GEE平台提供的Landsat系列卫星影像,计算并研究1986—2023年吕梁山区归一化植被指数(NDVI)时空变化,并利用地理探测器分析驱动因素。结果表明:(1)1986—2000年吕梁山区NDVI年均值呈不显著波动下降趋势,而2001—2023年年均值显著上升。1986—2023年NDVI整体向好,显著增加区域占94.92%。增速最大区域主要位于吕梁山区的忻州、吕梁、临汾市中部和太原市南部,而吕梁山区中东部、南部边缘因人类活动增强NDVI显著减少。(2)各因子对NDVI变化的解释力排序为干燥度>年实际蒸发量>年降水量>年均土壤湿度>高程>坡度>年均风速>年均气温>年均土壤温度>夜间灯光指数。其中,干燥度与年实际蒸发量q值最大,解释力均在35%以上,年降水量、年均土壤湿度、高程的解释力均大于20%。(3)1986—2023年驱动因子呈现气候因子解释力显著或不显著下降、人为因子与坡度解释力显著增强的趋势。1990—2023年土地利用变化表明吕梁山区耕地面积显著减少、林地面积显著增加,说明了人类活动在吕梁山区NDVI变化中的重要影响。
中图分类号:
徐德华, 刘强, 李端, 李继彦. 1986—2023年吕梁山区归一化植被指数(NDVI)动态及驱动力[J]. 中国沙漠, 2025, 45(5): 78-91.
Dehua Xu, Qiang Liu, Duan Li, Jiyan Li. Changes and driving forces of NDVI in the Lvliang Mountain area from 1986 to 2023[J]. Journal of Desert Research, 2025, 45(5): 78-91.
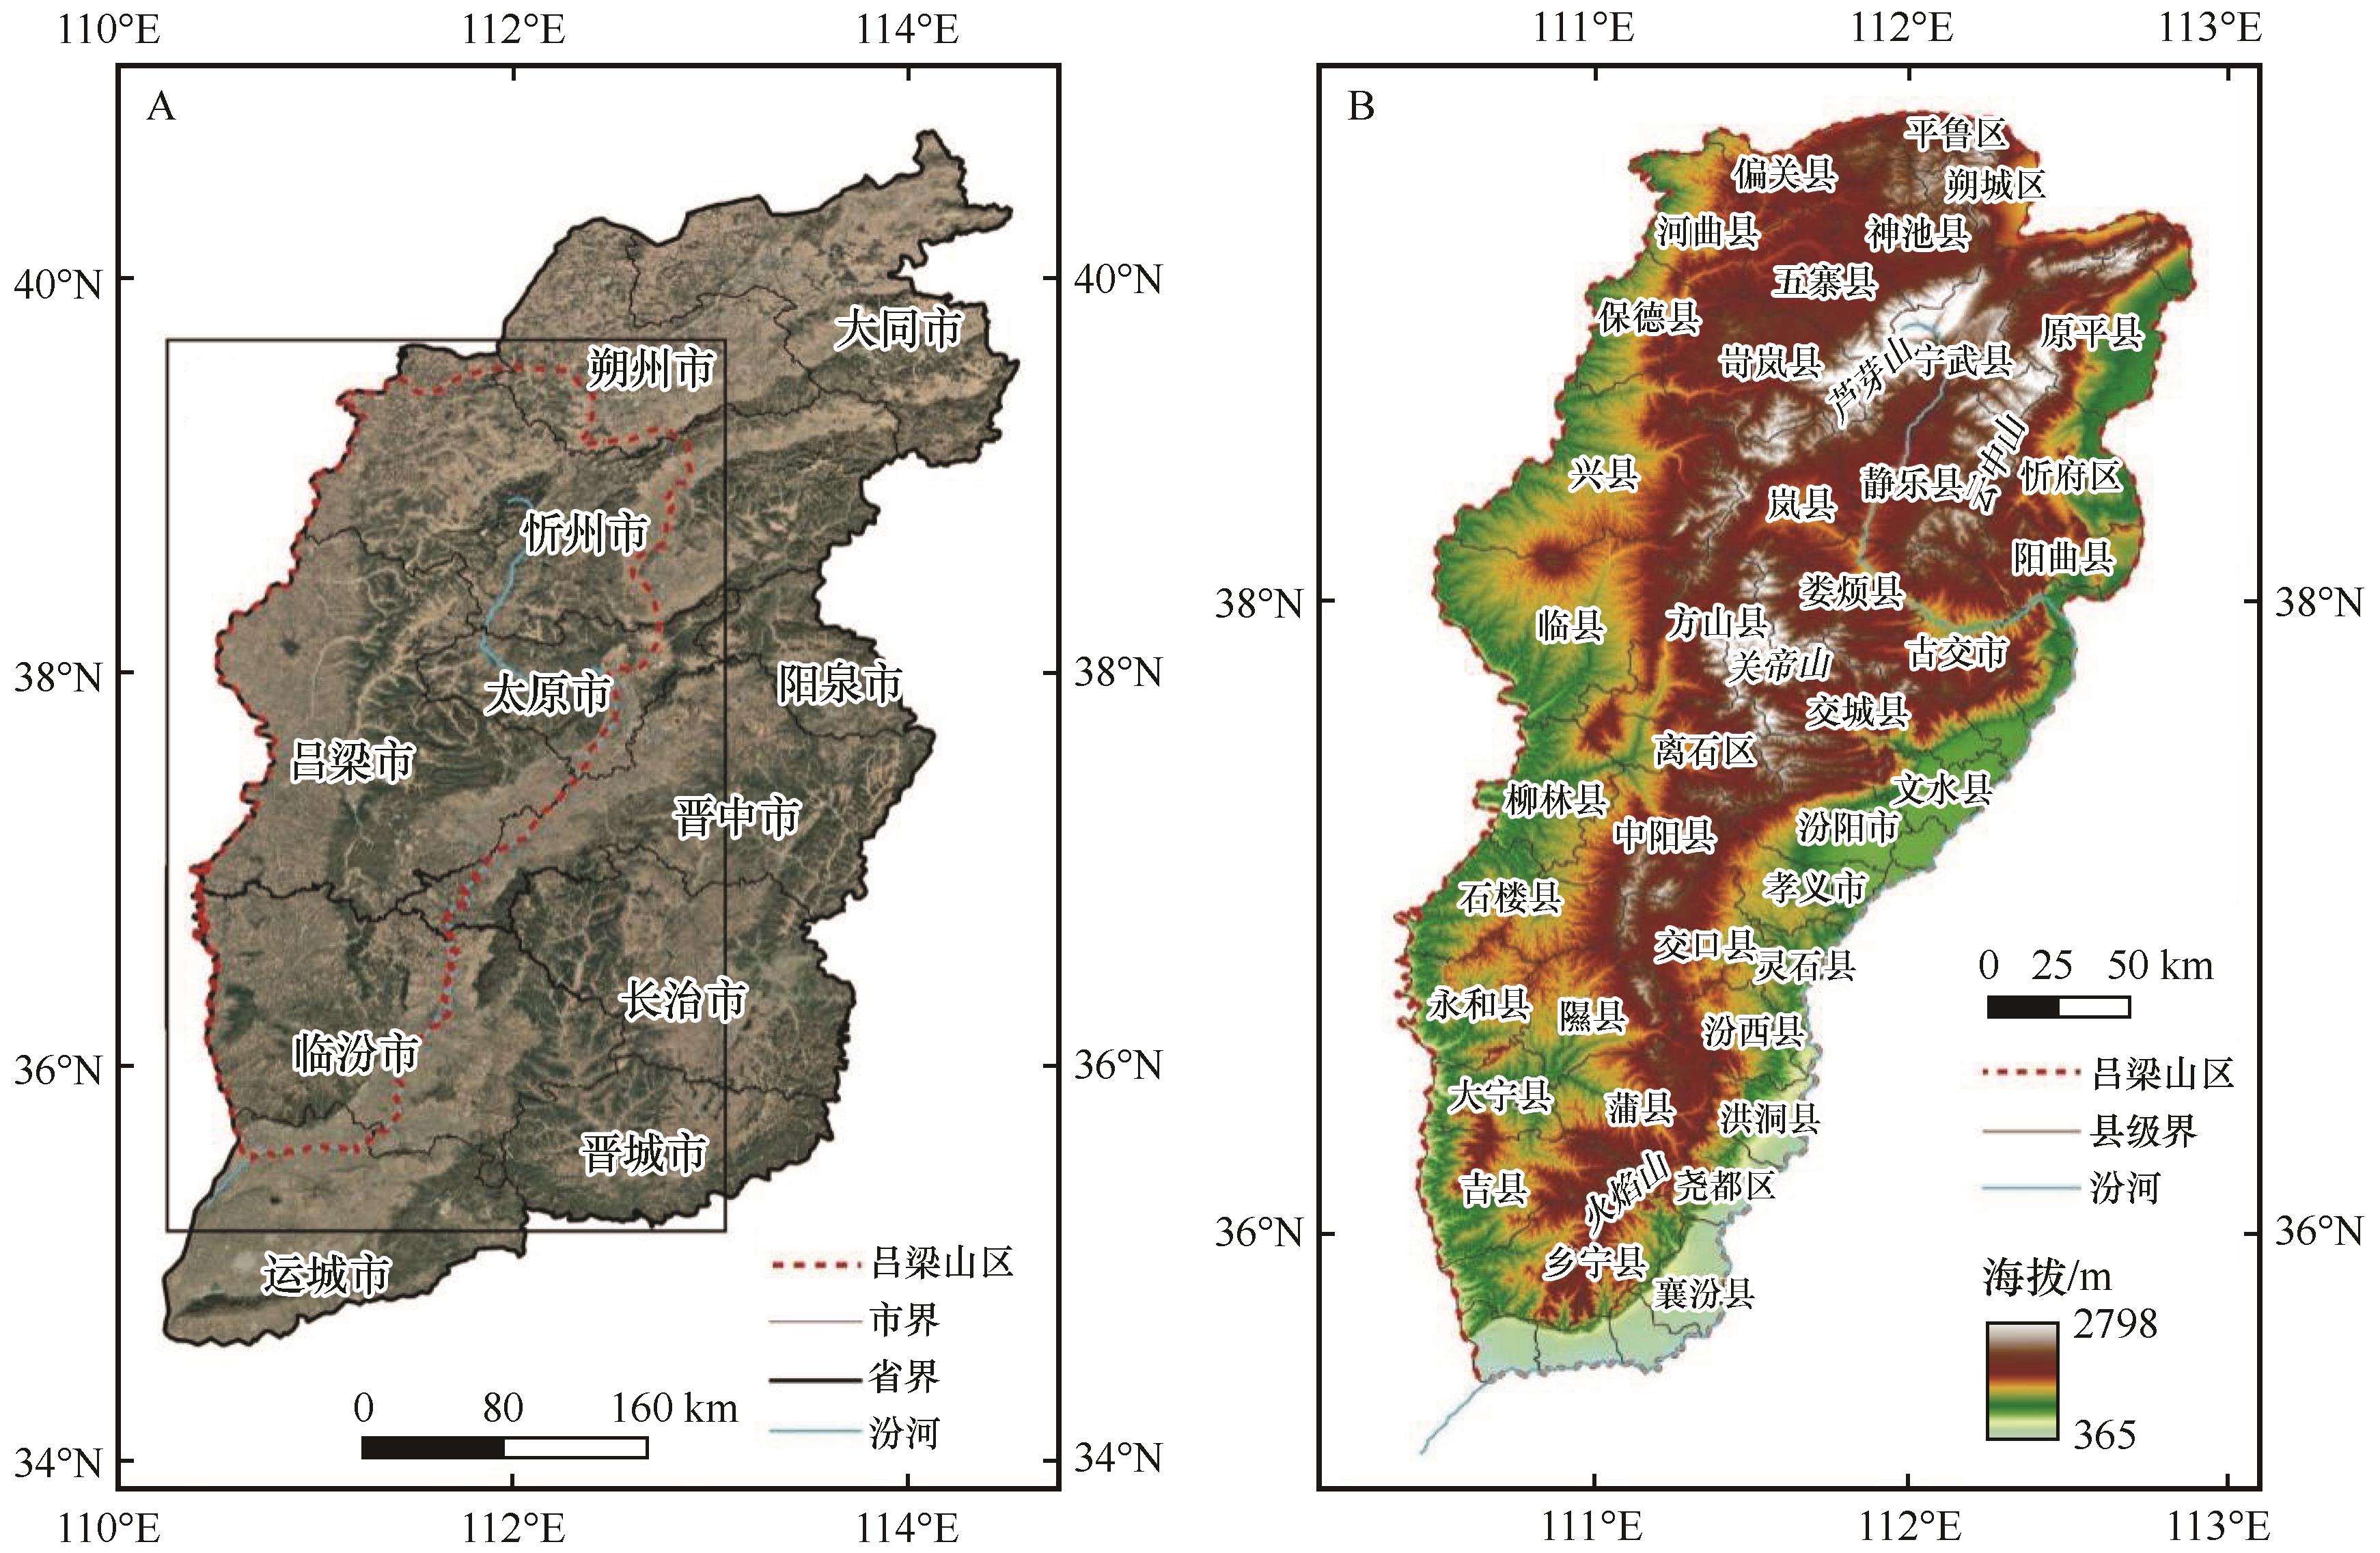
图1 山西省卫星影像(A)及吕梁山区地形特征(B,DEM数据下载于地理空间数据云平台http://www.gscloud.cn,数据类型为SRTMDEMUTM 90 m分辨率数字高程数据产品)注:基于自然资源部标准地图服务网站标准地图(审图号:GS(2024)0650号)制作,底图边界无修改
Fig.1 Satellite image of Shanxi Province (A) and topographic features of the Lvliang Mountain area (B,DEM data is downloaded from the Geospatial Data Cloud (http://www.gscloud.cn), and the DEM data type is SRTMDEMUTM with a resolution of 90 m)
| 驱动因子 | 类型 | 分辨率 | 时间范围 | 数据集名称 | 数据来源 |
|---|---|---|---|---|---|
| 气候因子 | 年均风速 | 0.042° | 1986—2023年 | TerraClimate[ | https://www.climatologylab.org/ |
| 年均土壤温度(0~10 cm) | 0.1° | 1986—2023年 | FLDAS[ | https://disc.gsfc.nasa.gov/ | |
| 年均土壤湿度(0~10 cm) | 0.1° | 1986—2023年 | |||
| 干燥度 | 0.008° | 1986—2023年 | 1901—2023年中国1 km分辨率逐年干燥度数据集[ | https://www.geodata.cn/main/ | |
| 年实际蒸发量 | 0.100° | 1986—2023年 | GLEAM4[ | https://www.gleam.eu/ | |
| 年均气温 | 0.008° | 1986—2023年 | 中国1 km分辨率年平均气温数据(1901—2023年)[ | https://www.geodata.cn/main/ | |
| 年降水量 | 0.008° | 1986—2023年 | 中国1 km分辨率年降水量数据(1901—2023年)[ | https://www.geodata.cn/main/ | |
| 地貌因子 | 高程 | 30 m | — | ASTER GDEM 30 M分辨率数字高程数据[ | https://www.gscloud.cn/ |
| 坡度 | 30 m | — | https://www.gscloud.cn/ | ||
| 人为因子 | 夜间灯光指数 | 0.008° | 1986—2020年 | 中国长时间序列逐年人造夜间灯光数据集(1984—2020)[ | https://data.tpdc.ac.cn/home |
| 1 km | 2021—2023年 | An improved time-series DMSP-OLS-like data (1992-2019) in China by integrating DMSP-OLS and SNPP-VIIRS[ | https://dataverse.harvard.edu/ | ||
| 其他 | 土地利用 | 30 m | 1990—2023年 | The 30 m annual land cover datasets and its dynamics in China from 1985 to 2022[ | https://zenodo.org/ |
表1 驱动因子相关栅格信息
Table 1 Information about the relative grids of driving factors
| 驱动因子 | 类型 | 分辨率 | 时间范围 | 数据集名称 | 数据来源 |
|---|---|---|---|---|---|
| 气候因子 | 年均风速 | 0.042° | 1986—2023年 | TerraClimate[ | https://www.climatologylab.org/ |
| 年均土壤温度(0~10 cm) | 0.1° | 1986—2023年 | FLDAS[ | https://disc.gsfc.nasa.gov/ | |
| 年均土壤湿度(0~10 cm) | 0.1° | 1986—2023年 | |||
| 干燥度 | 0.008° | 1986—2023年 | 1901—2023年中国1 km分辨率逐年干燥度数据集[ | https://www.geodata.cn/main/ | |
| 年实际蒸发量 | 0.100° | 1986—2023年 | GLEAM4[ | https://www.gleam.eu/ | |
| 年均气温 | 0.008° | 1986—2023年 | 中国1 km分辨率年平均气温数据(1901—2023年)[ | https://www.geodata.cn/main/ | |
| 年降水量 | 0.008° | 1986—2023年 | 中国1 km分辨率年降水量数据(1901—2023年)[ | https://www.geodata.cn/main/ | |
| 地貌因子 | 高程 | 30 m | — | ASTER GDEM 30 M分辨率数字高程数据[ | https://www.gscloud.cn/ |
| 坡度 | 30 m | — | https://www.gscloud.cn/ | ||
| 人为因子 | 夜间灯光指数 | 0.008° | 1986—2020年 | 中国长时间序列逐年人造夜间灯光数据集(1984—2020)[ | https://data.tpdc.ac.cn/home |
| 1 km | 2021—2023年 | An improved time-series DMSP-OLS-like data (1992-2019) in China by integrating DMSP-OLS and SNPP-VIIRS[ | https://dataverse.harvard.edu/ | ||
| 其他 | 土地利用 | 30 m | 1990—2023年 | The 30 m annual land cover datasets and its dynamics in China from 1985 to 2022[ | https://zenodo.org/ |
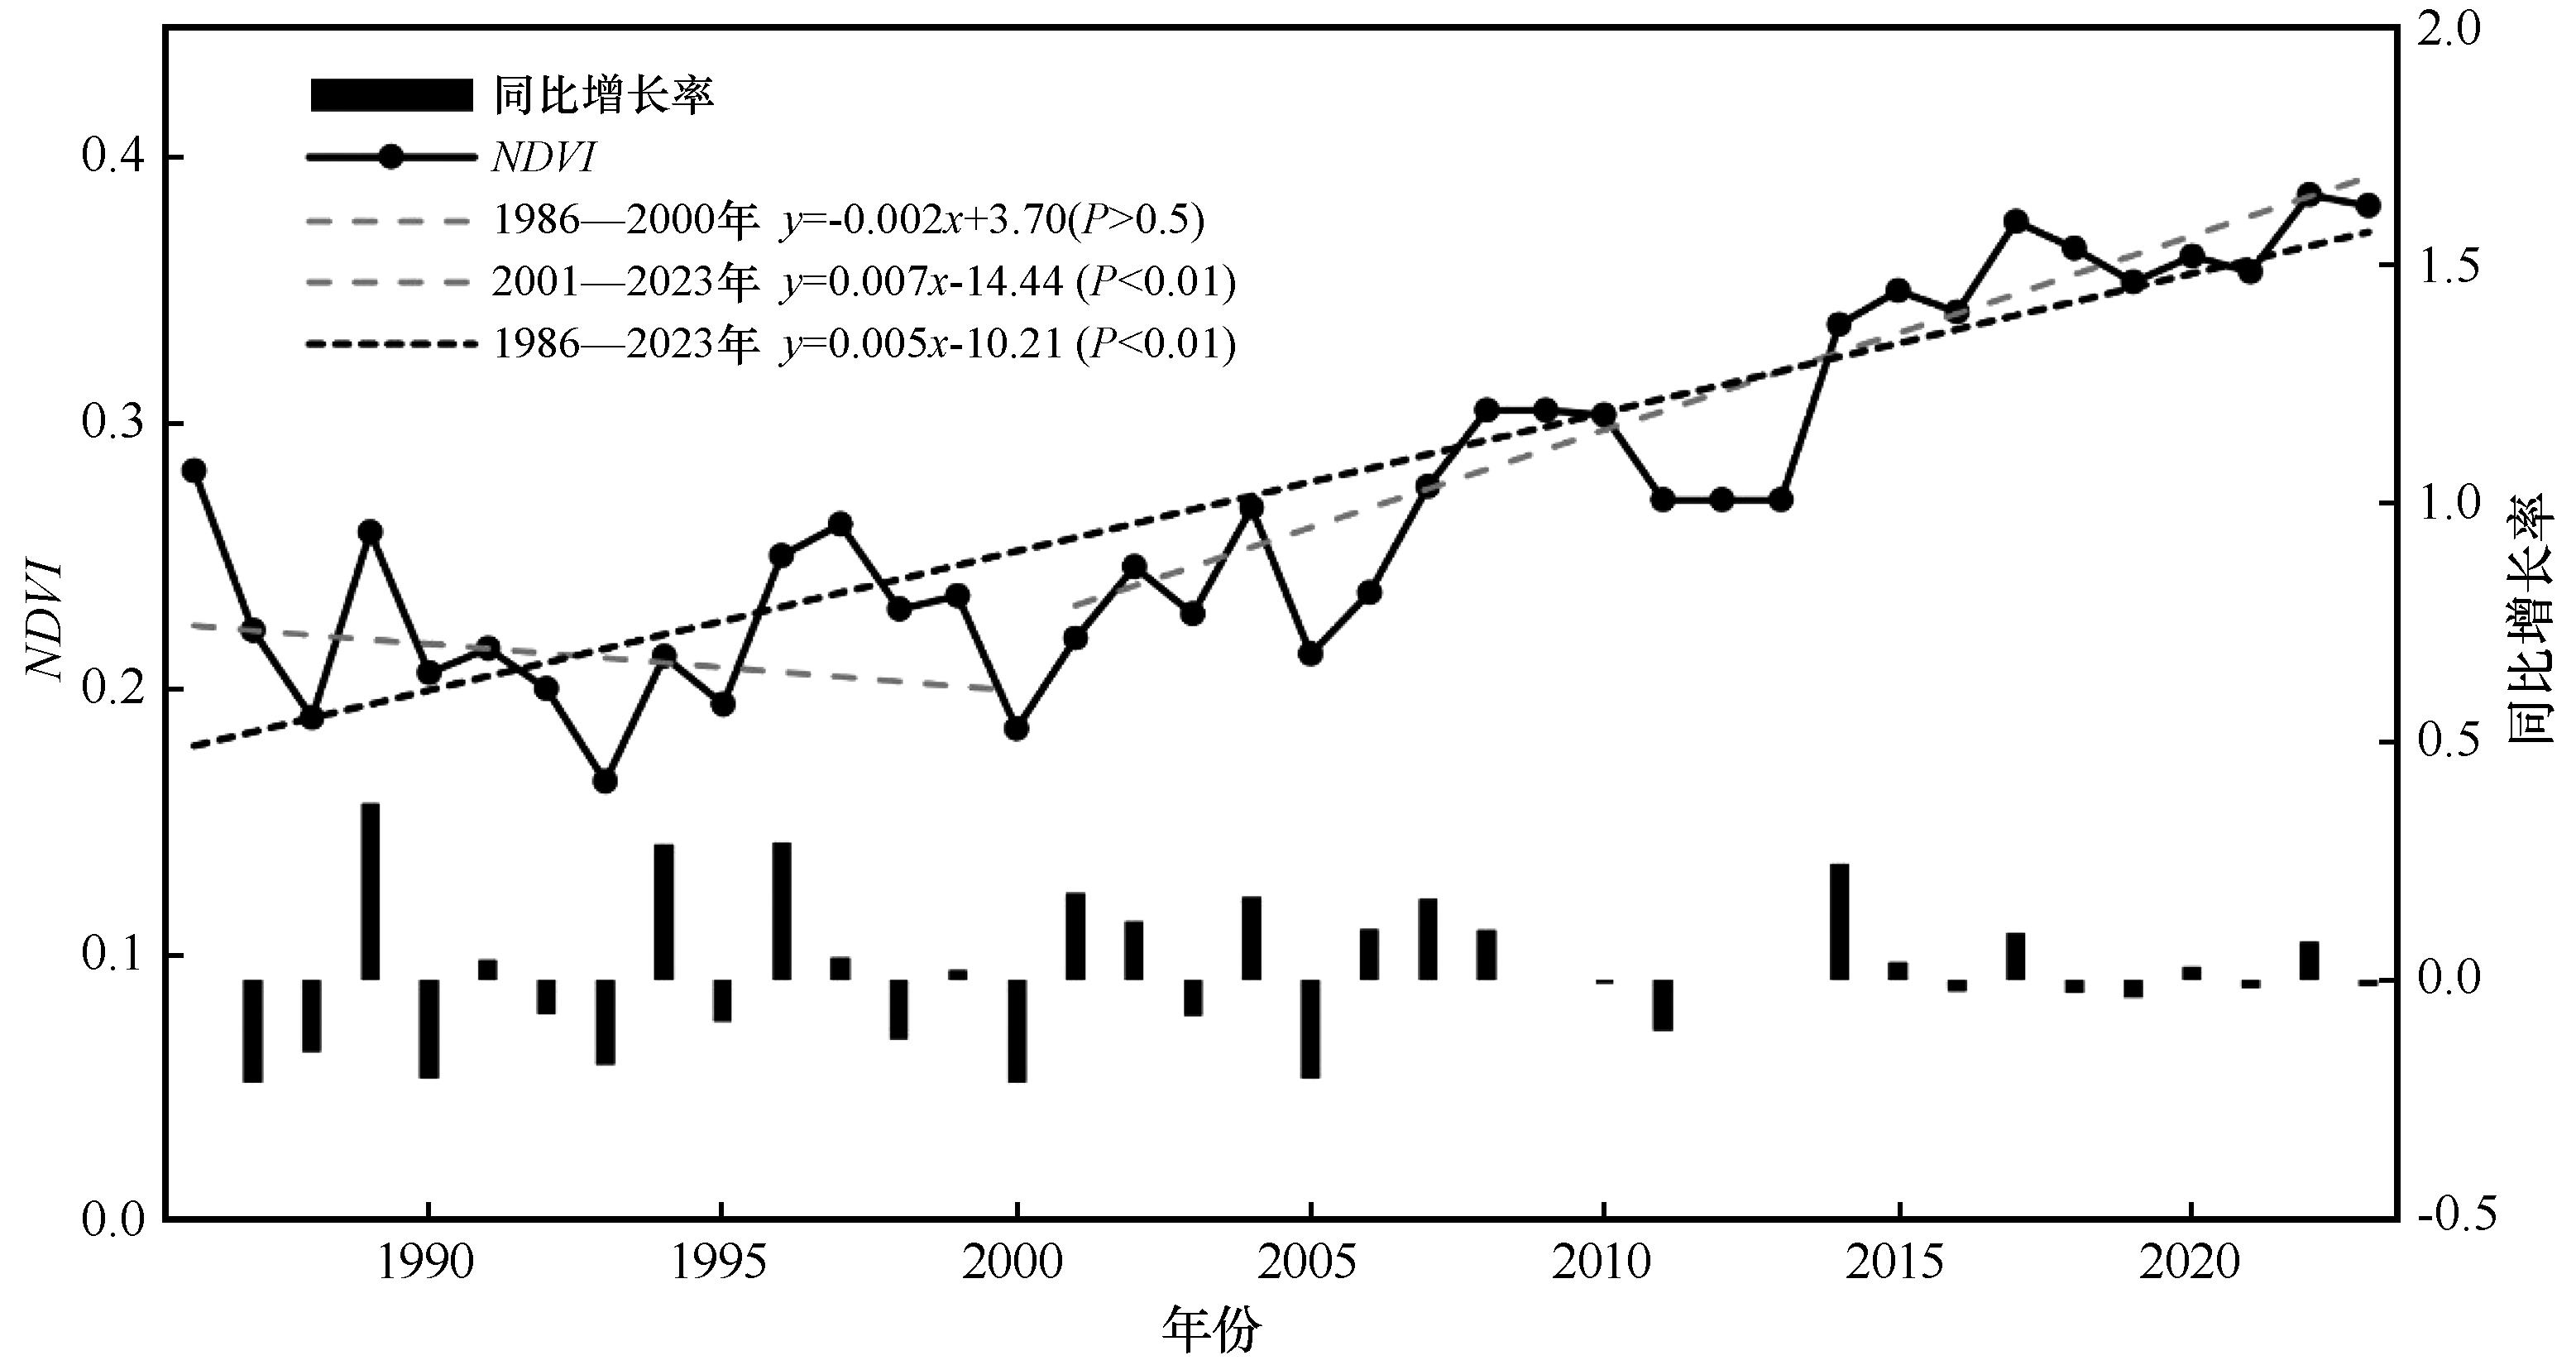
图2 1986—2023年吕梁山区NDVI年均值年际变化
Fig.2 Inter-annual variation of average annual NDVI in the Lvliang Mountain area from 1986 to 2023
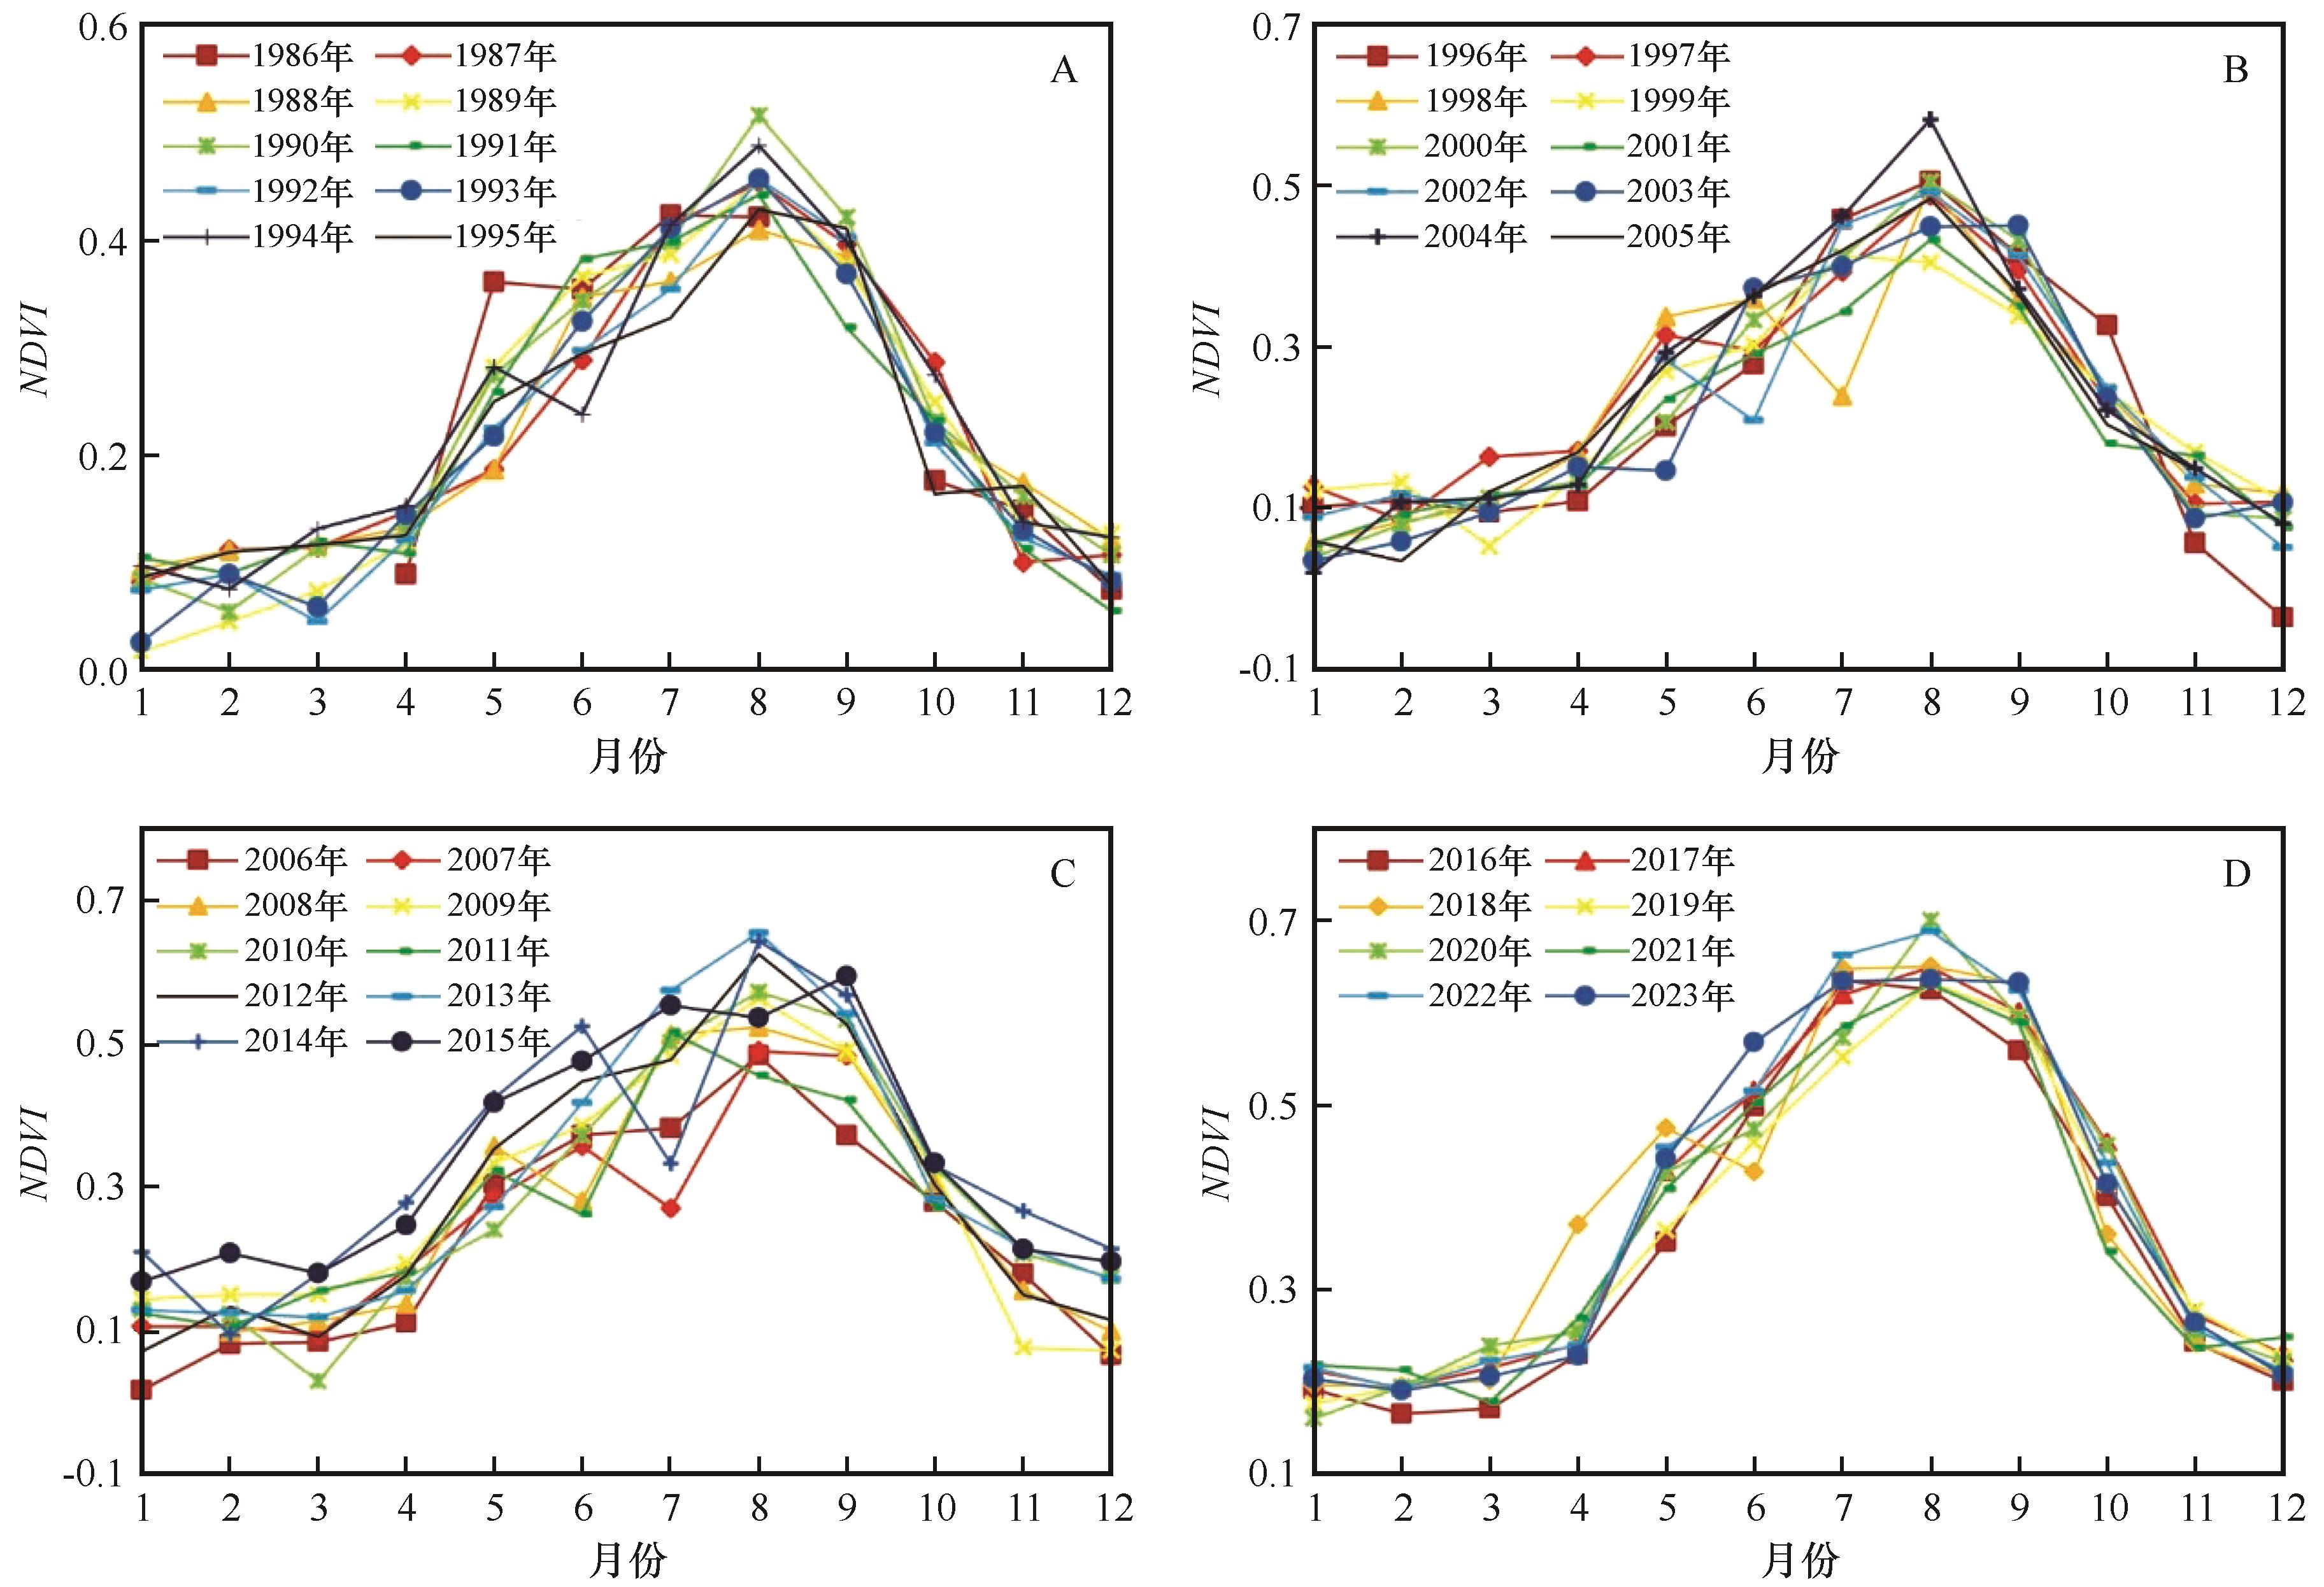
图3 1986—2023年吕梁山区NDVI月际变化
Fig.3 Inter-monthly changes of NDVI in the Lvliang Mountain area from 1986 to 2023
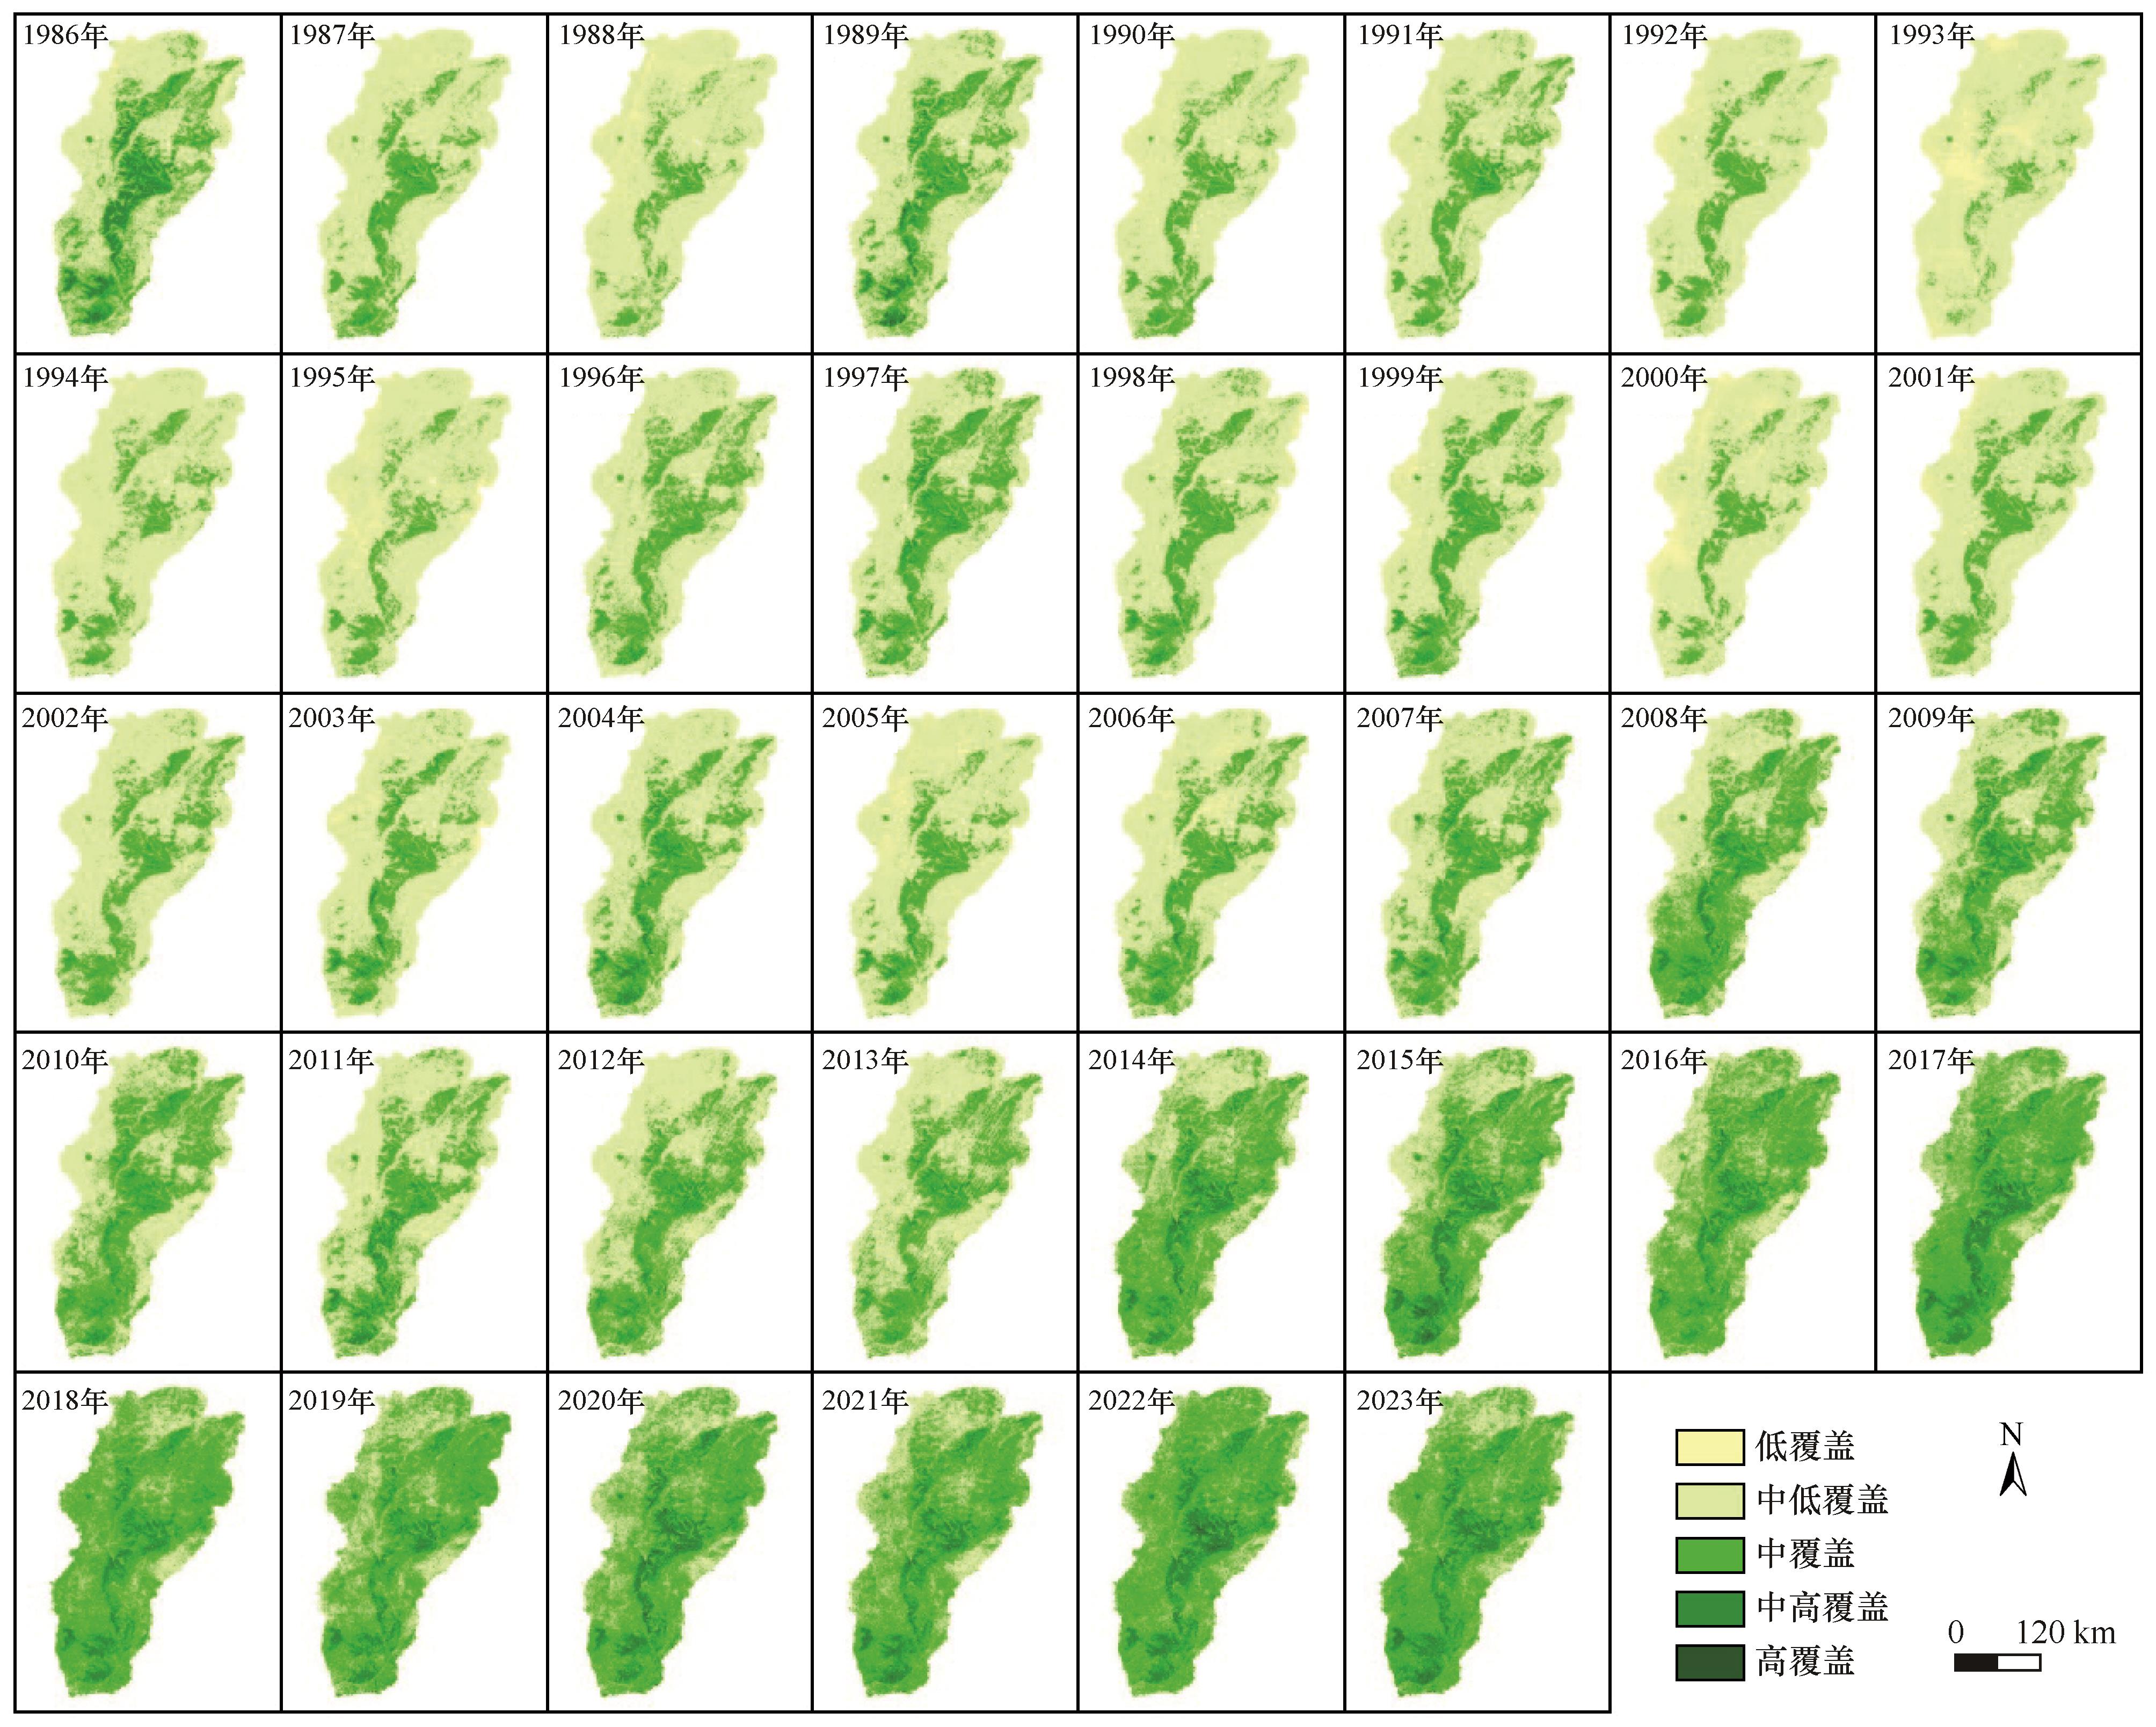
图4 1986—2023年吕梁山区植被覆盖空间分布注:基于自然资源部标准地图服务网站标准地图(审图号:GS(2024)0650号)制作,底图边界无修改
Fig.4 Spatial distribution of vegetation cover in the Lvliang Mountain area from 1986 to 2023
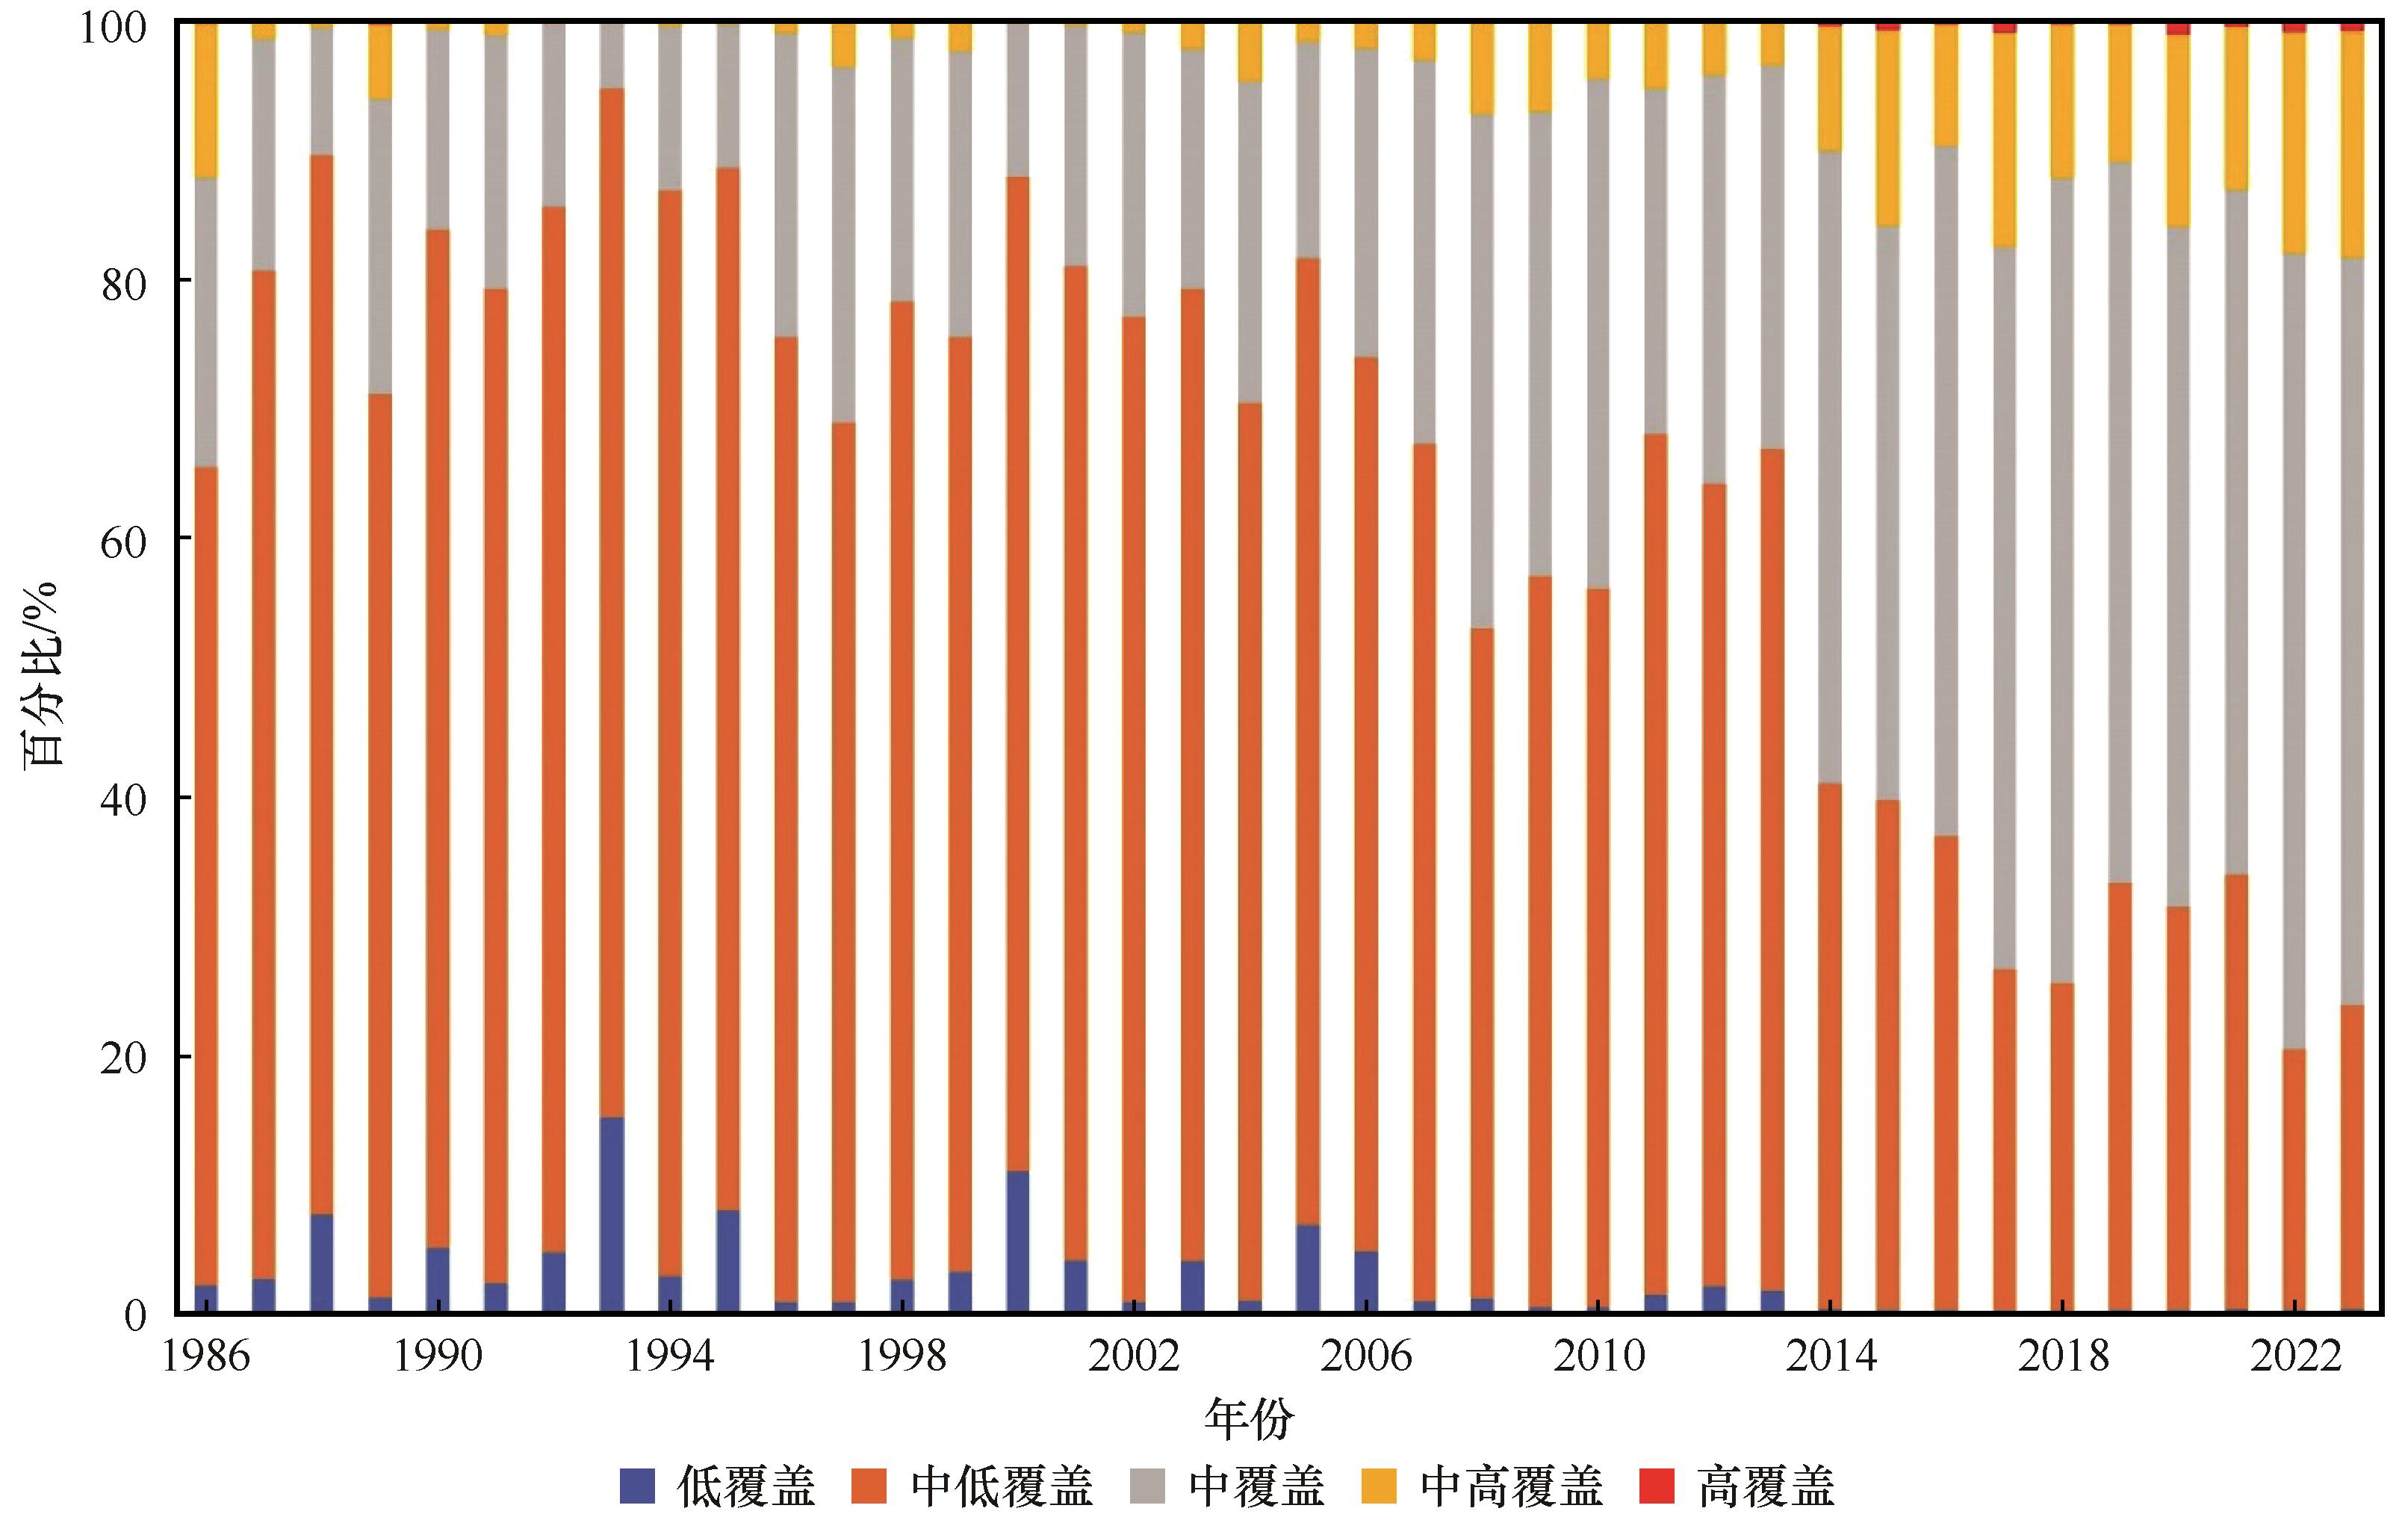
图5 1986—2023年吕梁山区不同等级植被覆盖占比
Fig.5 Proportion of vegetation coverage of different levels in the Lvliang Mountain area from 1986 to 2023
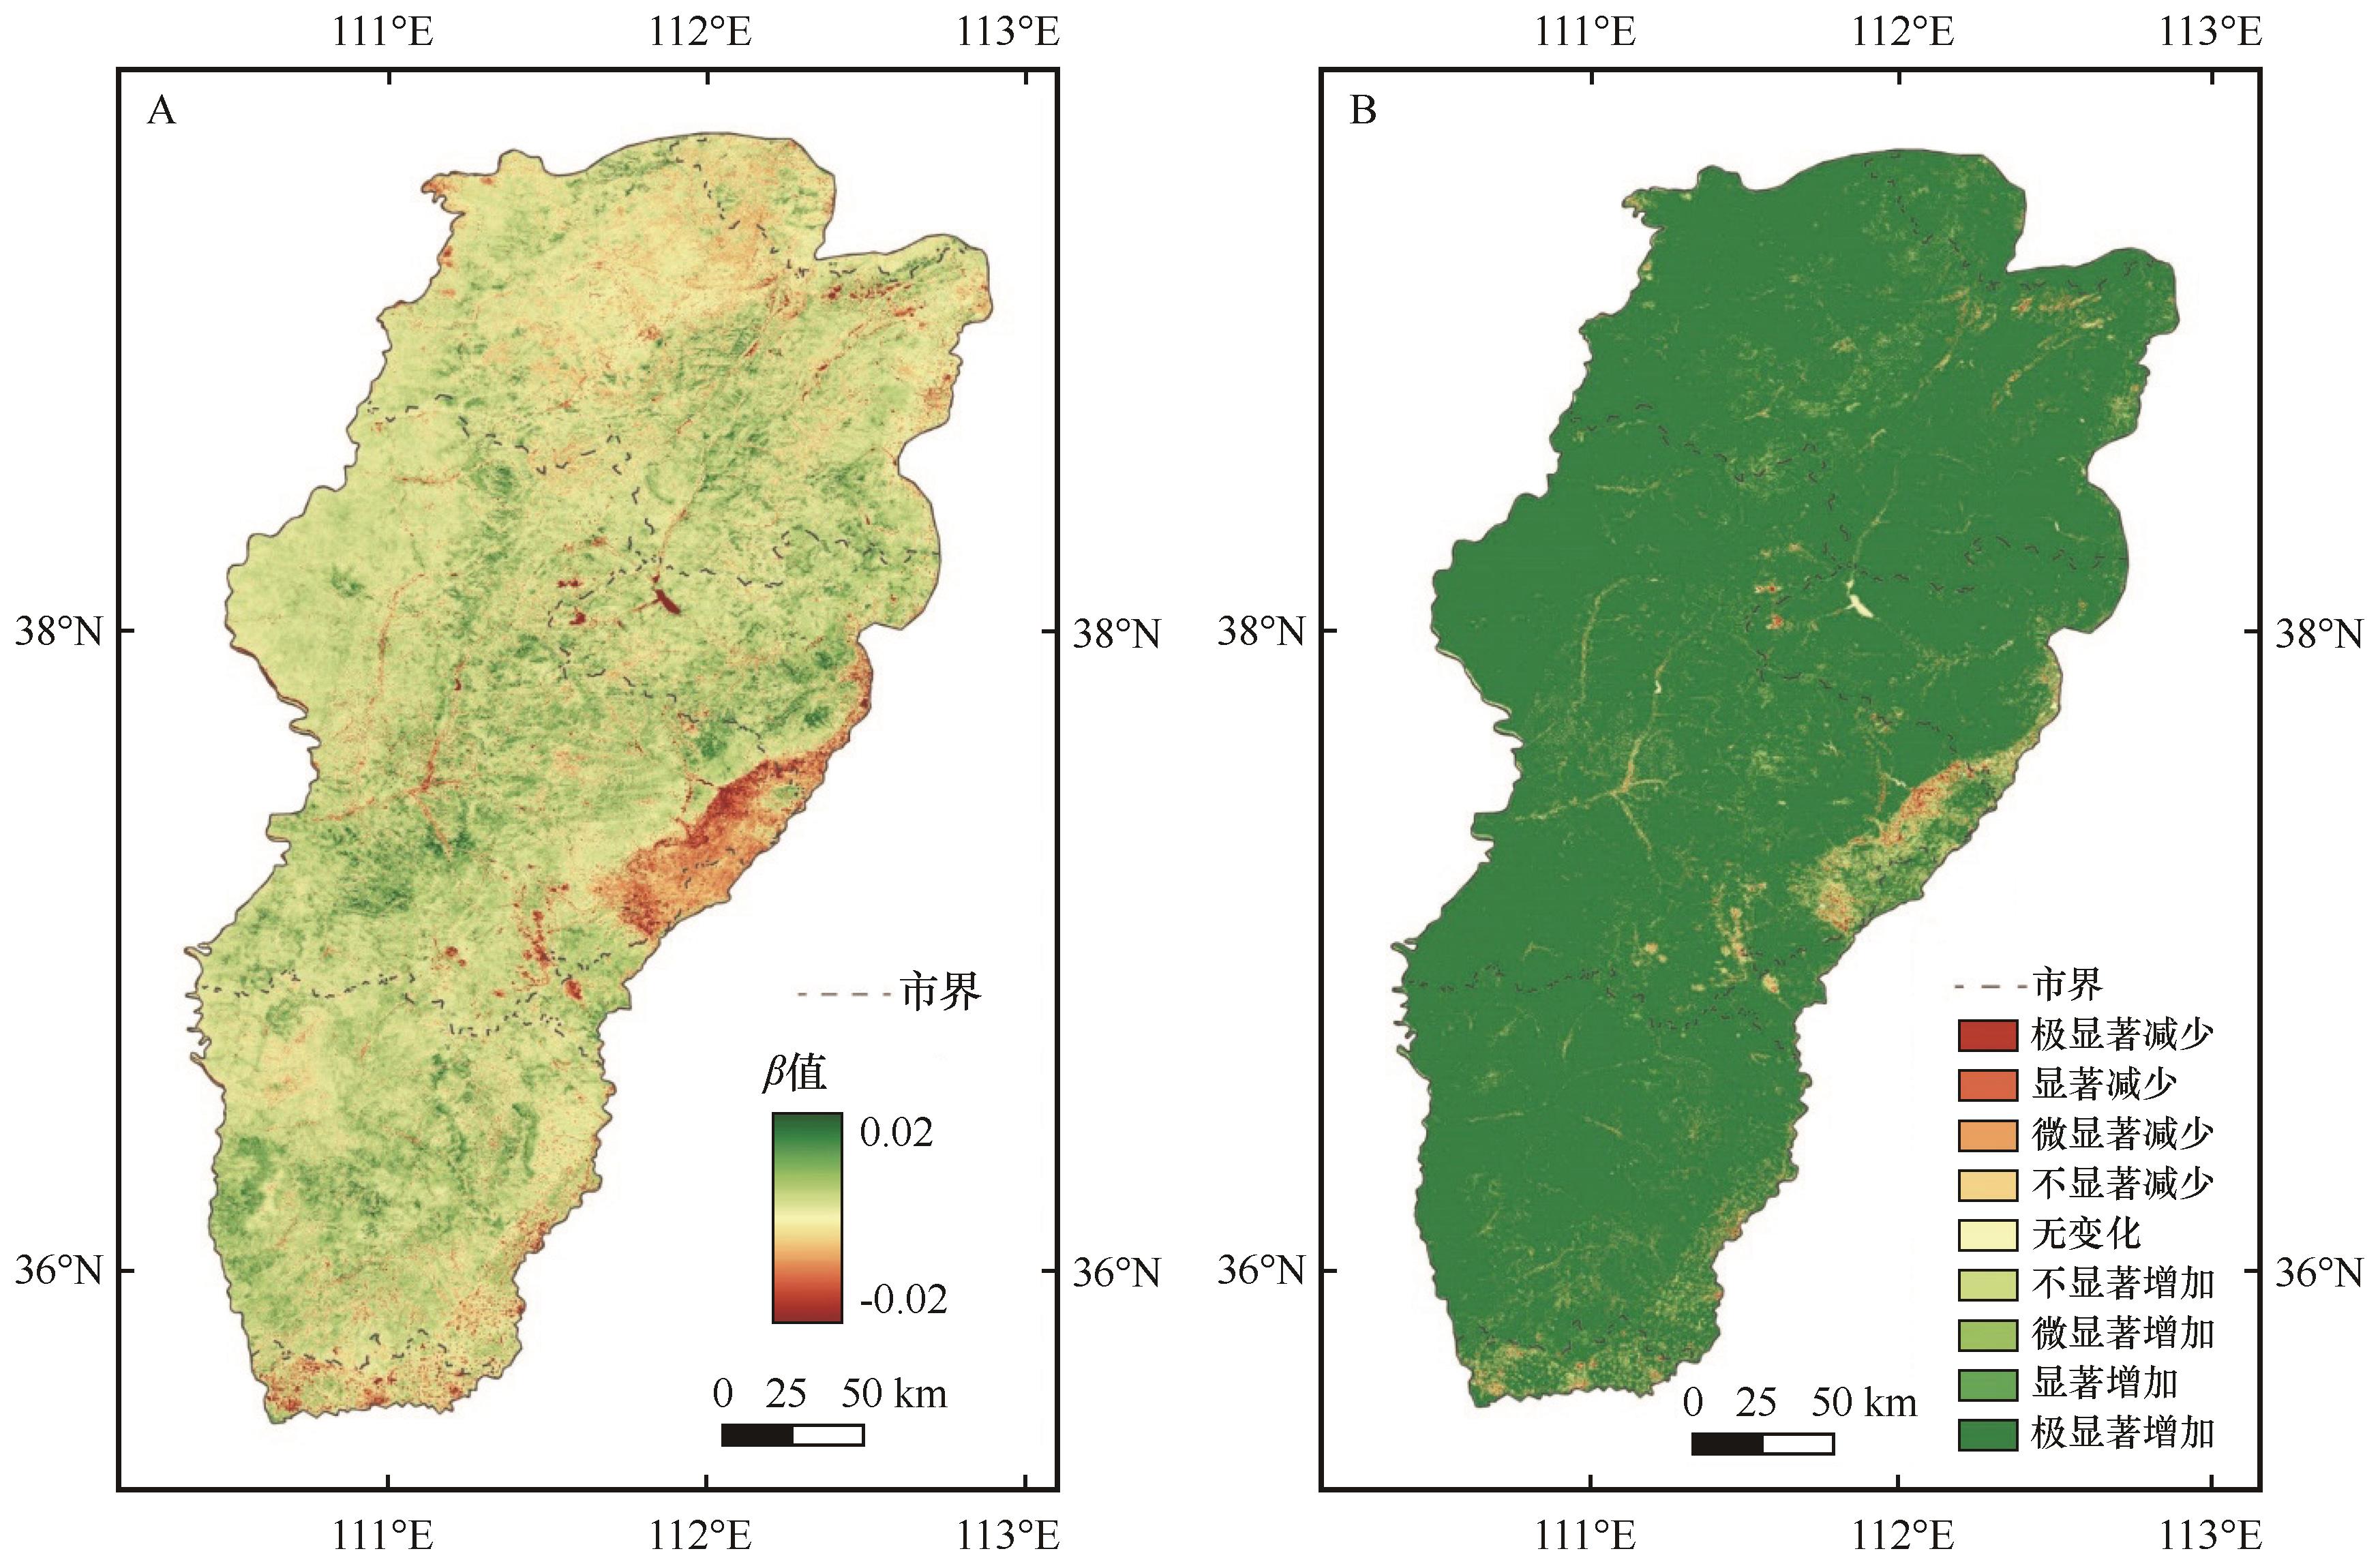
图6 1986—2023年吕梁山区NDVI变化趋势(A)及显著性(B)注:基于自然资源部标准地图服务网站标准地图(审图号:GS(2024)0650号)制作,底图边界无修改
Fig.6 NDVI change trend (A) and significance (B) in the Lvliang Mountain area from 1986 to 2023
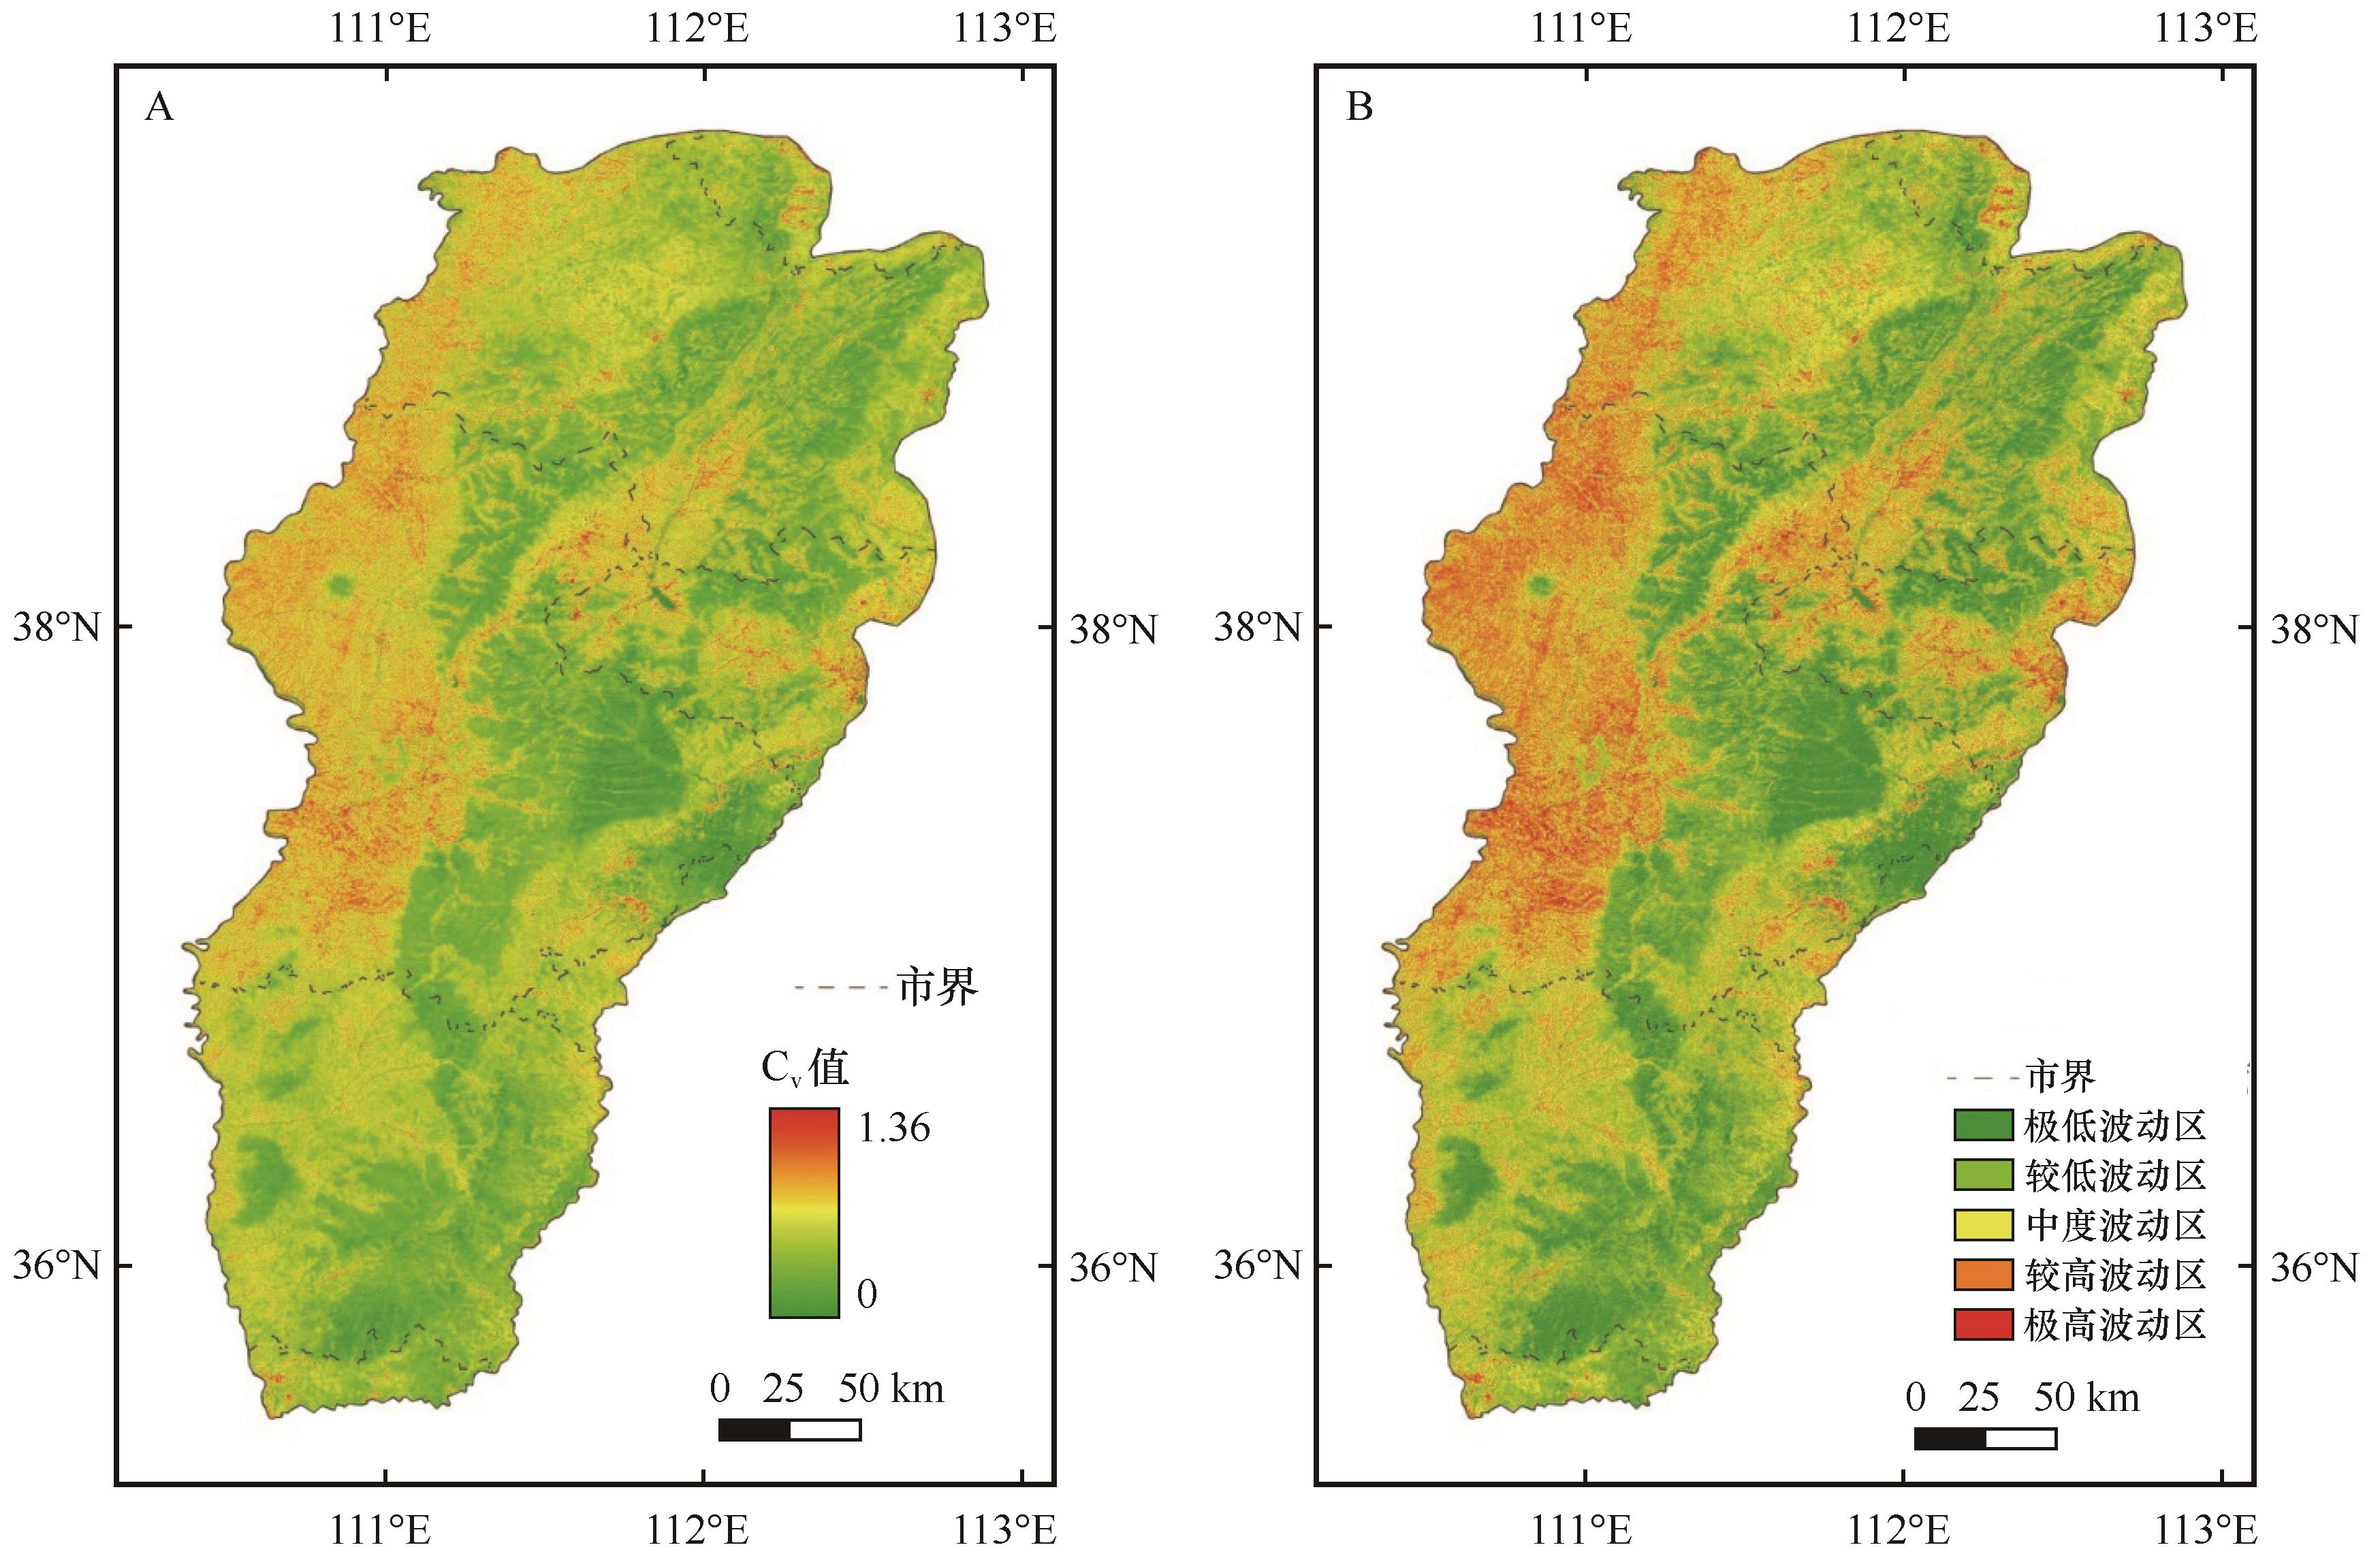
图7 1986—2023年吕梁山区NDVI年际变化Cv值(A)与波动区分布(B)注:基于自然资源部标准地图服务网站标准地图(审图号:GS(2024)0650号)制作,底图边界无修改
Fig.7 Cv values (A) and fluctuation regions (B) of NDVI in the Lvliang Mountain area from 1986 to 2023
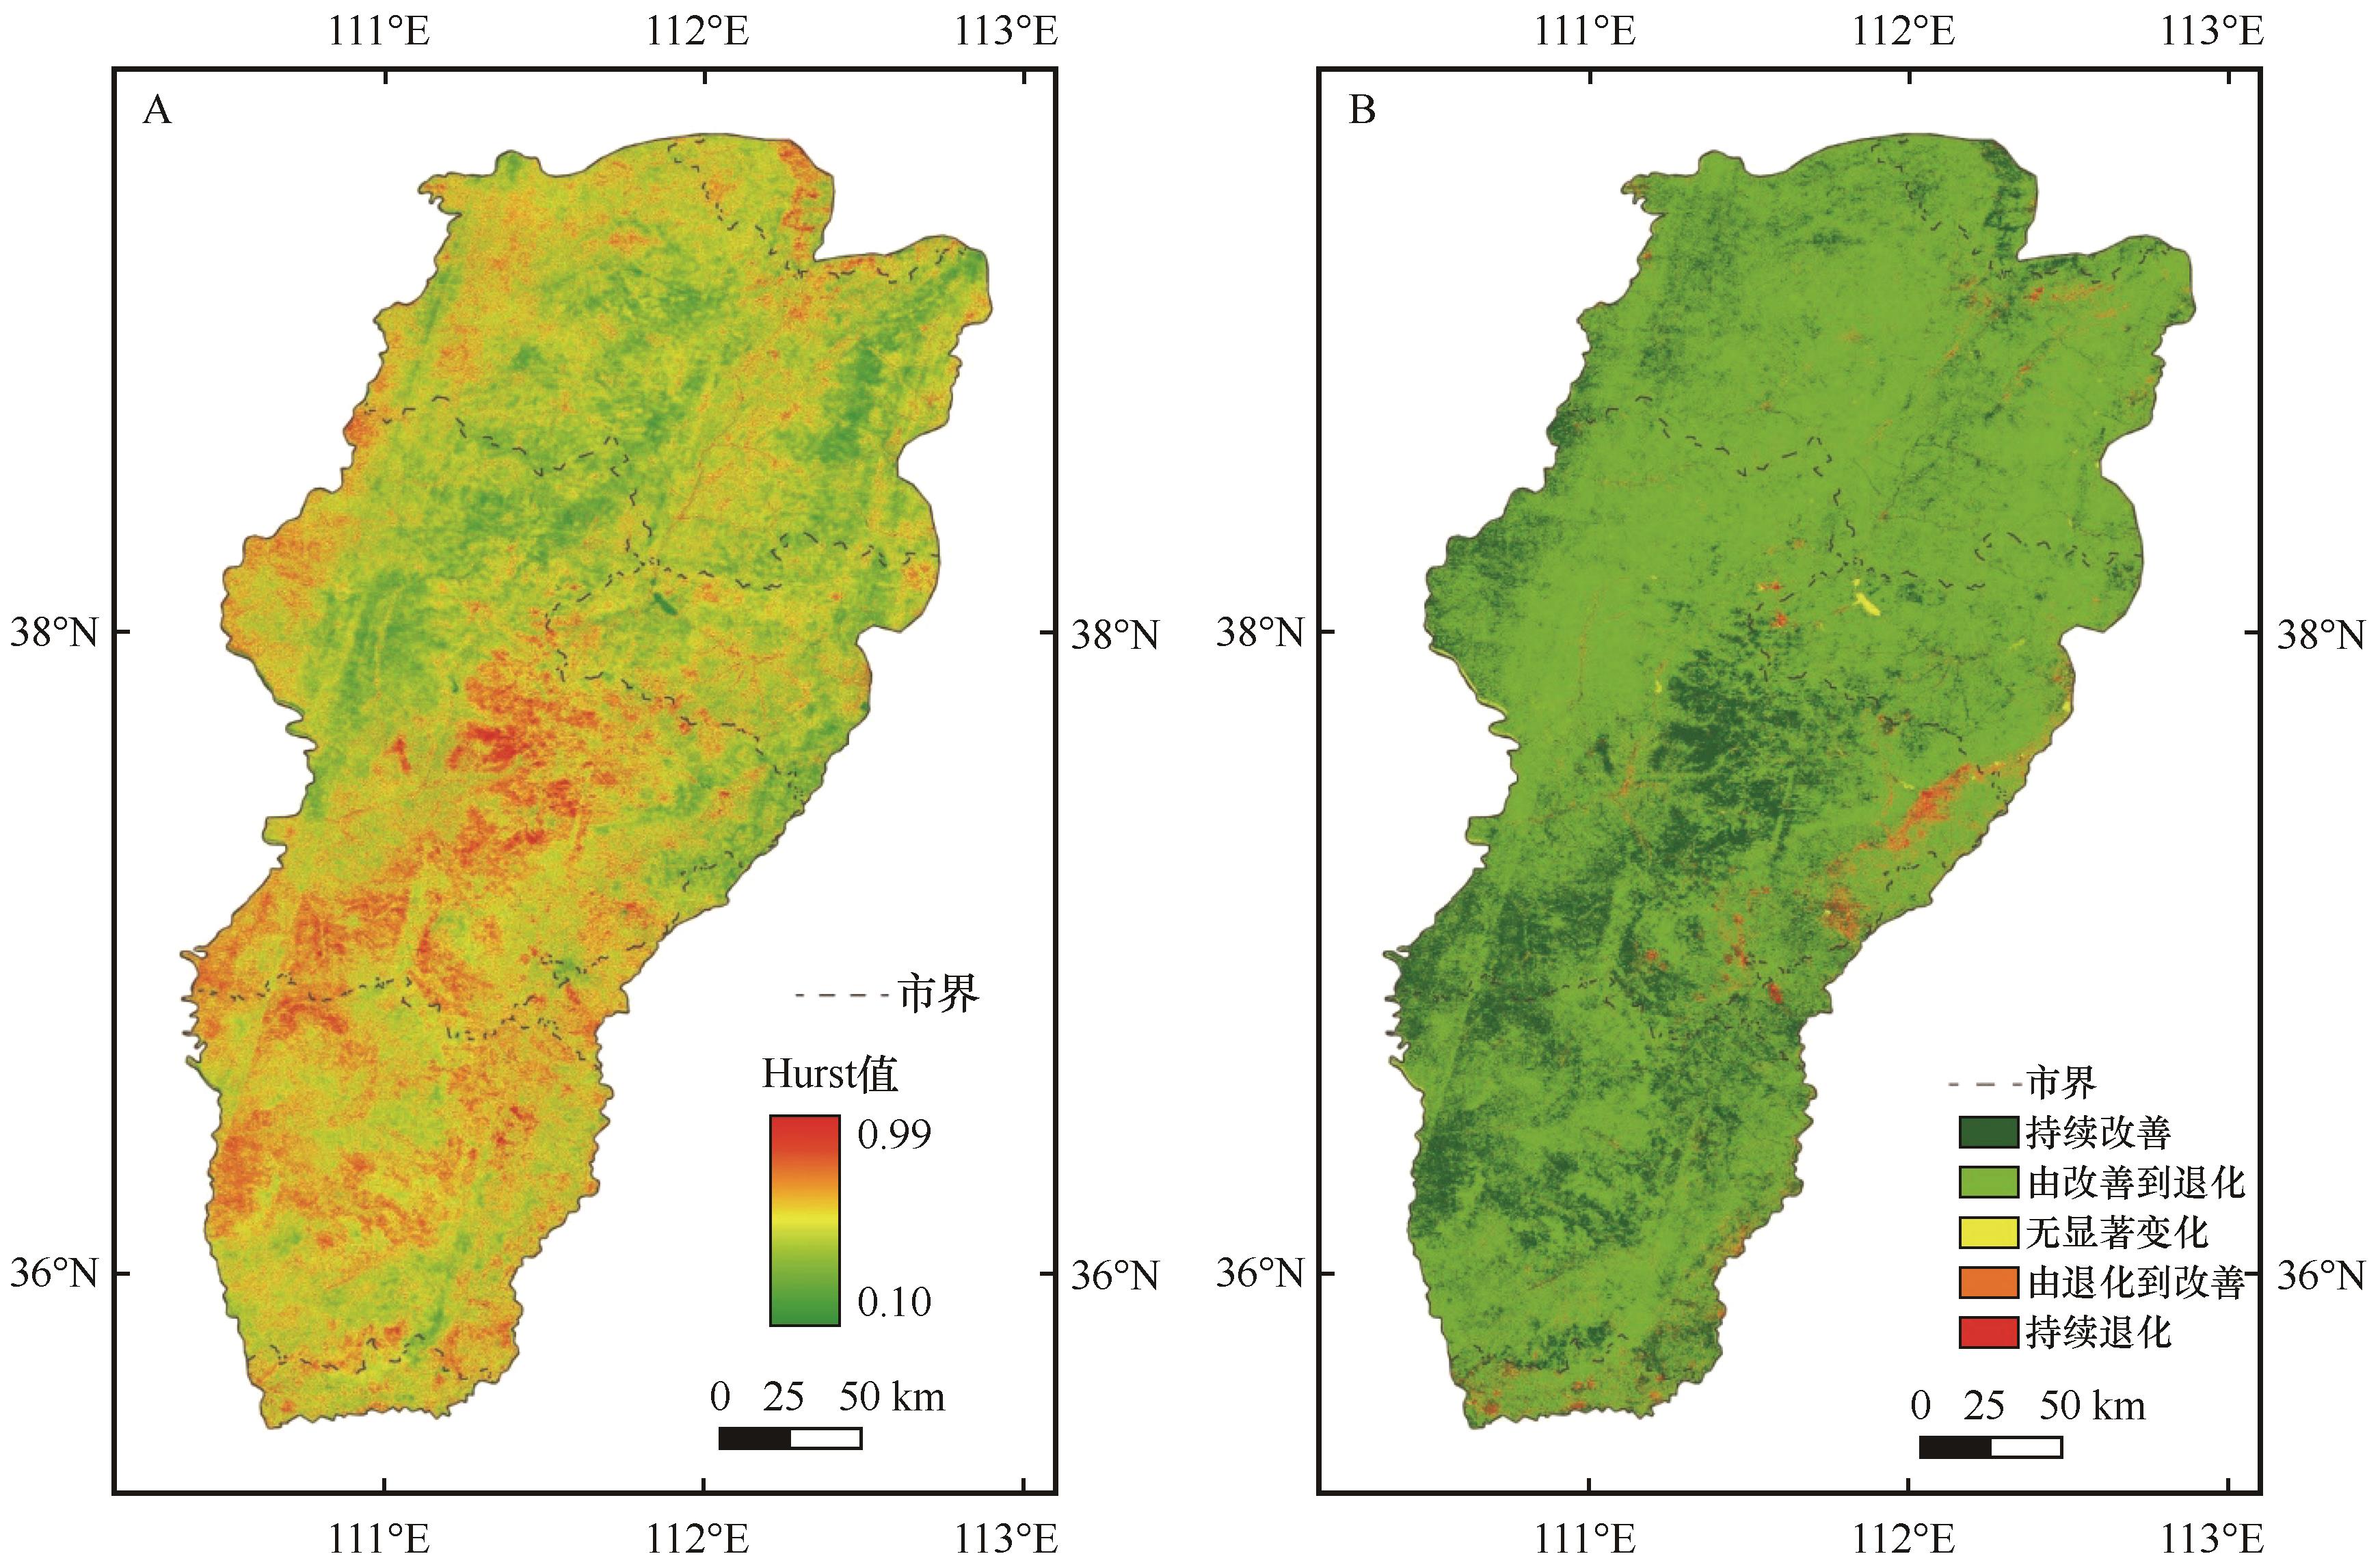
图8 吕梁山区NDVI Hurst值(A)与未来变化趋势预测(B)注:基于自然资源部标准地图服务网站标准地图(审图号:GS(2024)0650号)制作,底图边界无修改
Fig.8 NDVI Hurst value (A) and future trend prediction (B) in the Lvliang Mountain area
| 因子 | 高程 | 坡度 | 年均风速 | 年均土壤温度 | 年均土壤湿度 | 干燥度 | 年实际蒸发量 | 年均气温 | 年降水量 | 夜间灯光指数 |
|---|---|---|---|---|---|---|---|---|---|---|
| q值 | 0.22 | 0.11 | 0.09 | 0.08 | 0.23 | 0.47 | 0.39 | 0.09 | 0.24 | 0.06 |
| P值(×10-10) | 3.67 | 6.60 | 6.80 | 2.85 | 3.71 | 6.76 | 7.11 | 6.56 | 6.03 | 2.94 |
表2 驱动因子探测结果
Table 2 The results of factor detectors
| 因子 | 高程 | 坡度 | 年均风速 | 年均土壤温度 | 年均土壤湿度 | 干燥度 | 年实际蒸发量 | 年均气温 | 年降水量 | 夜间灯光指数 |
|---|---|---|---|---|---|---|---|---|---|---|
| q值 | 0.22 | 0.11 | 0.09 | 0.08 | 0.23 | 0.47 | 0.39 | 0.09 | 0.24 | 0.06 |
| P值(×10-10) | 3.67 | 6.60 | 6.80 | 2.85 | 3.71 | 6.76 | 7.11 | 6.56 | 6.03 | 2.94 |
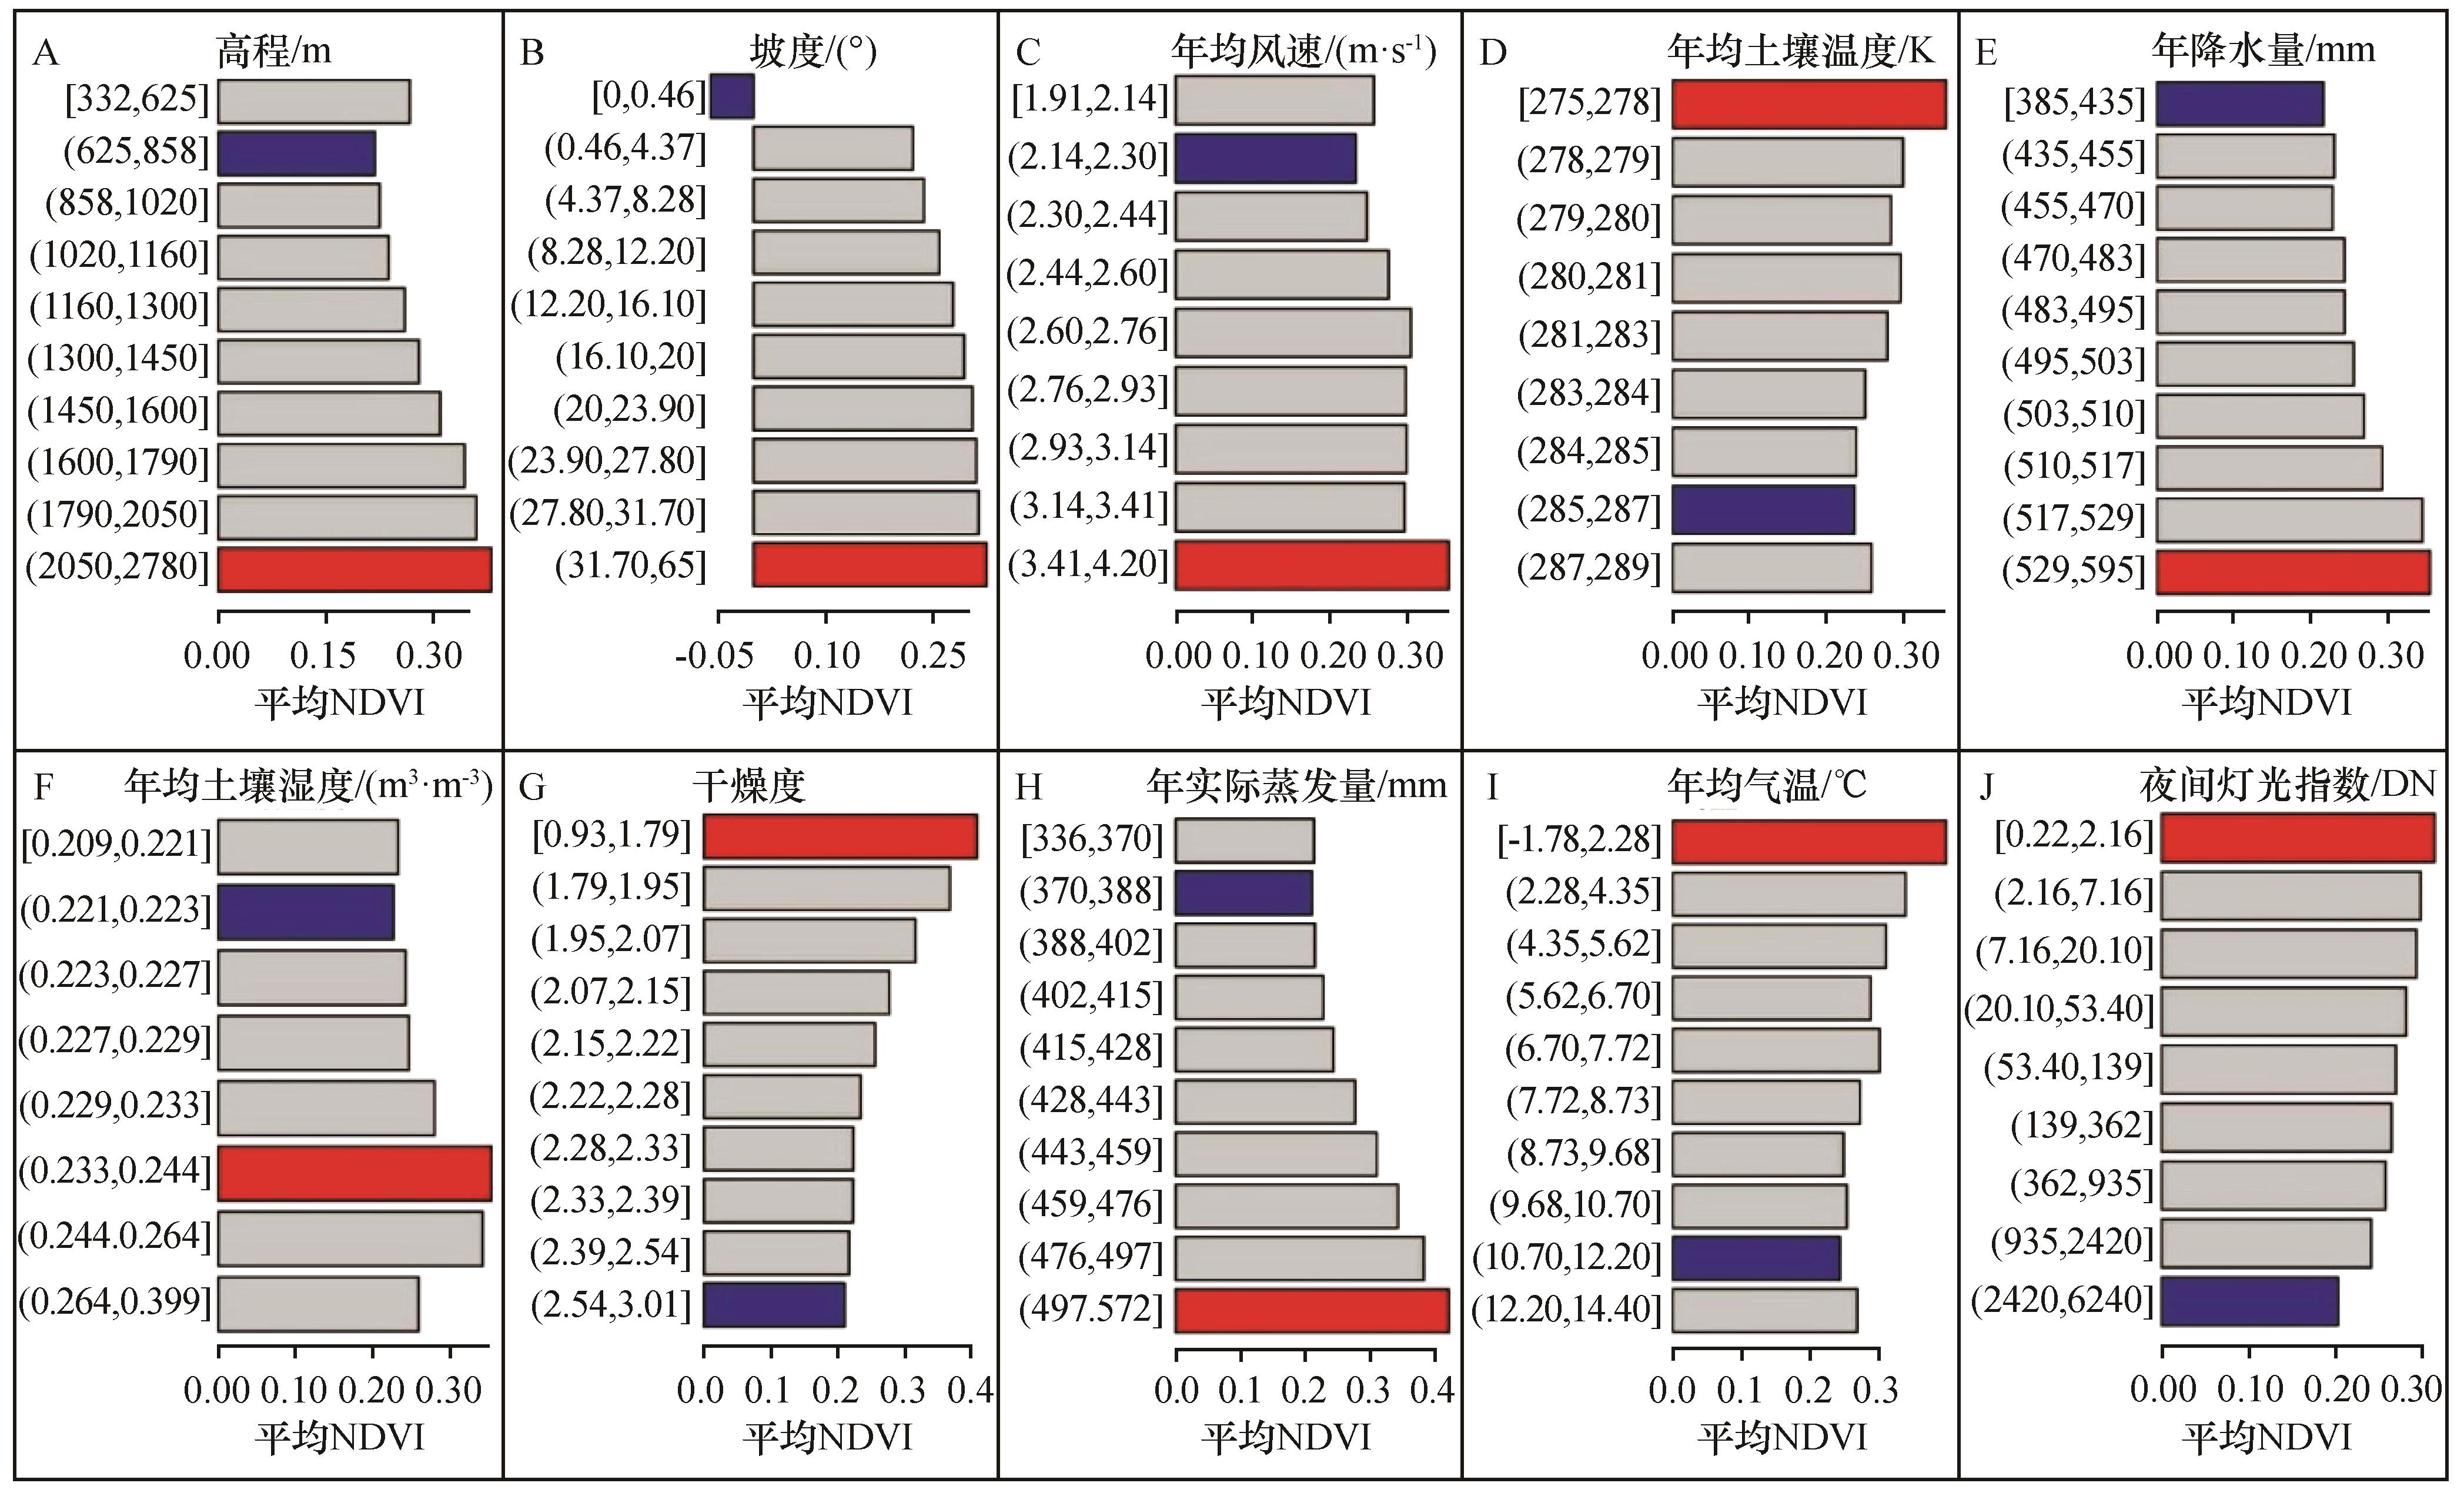
图9 各因子不同等级分区NDVI平均值
Fig.9 Average NDVI values of different levels of each factor
| 因子 | 植被NDVI适宜范围 | NDVI均值 |
|---|---|---|
| 高程 | 2 050~2 780 | 0.38 |
| 坡度 | 31.70~65 | 0.33 |
| 年均风速 | 3.41~4.20 | 0.35 |
| 年均土壤温度 | 275~278 | 0.36 |
| 年均土壤湿度 | 0.23~0.24 | 0.35 |
| 干燥度 | 0.93~1.79 | 0.41 |
| 年实际蒸发量 | 497~572 | 0.42 |
| 年均气温 | -1.78~2.28 | 0.40 |
| 年降水量 | 529~595 | 0.36 |
| 夜间灯光指数 | 0.22~2.16 | 0.32 |
表3 驱动因子的适宜限制
Table 3 The suitable limits of the driver factors
| 因子 | 植被NDVI适宜范围 | NDVI均值 |
|---|---|---|
| 高程 | 2 050~2 780 | 0.38 |
| 坡度 | 31.70~65 | 0.33 |
| 年均风速 | 3.41~4.20 | 0.35 |
| 年均土壤温度 | 275~278 | 0.36 |
| 年均土壤湿度 | 0.23~0.24 | 0.35 |
| 干燥度 | 0.93~1.79 | 0.41 |
| 年实际蒸发量 | 497~572 | 0.42 |
| 年均气温 | -1.78~2.28 | 0.40 |
| 年降水量 | 529~595 | 0.36 |
| 夜间灯光指数 | 0.22~2.16 | 0.32 |
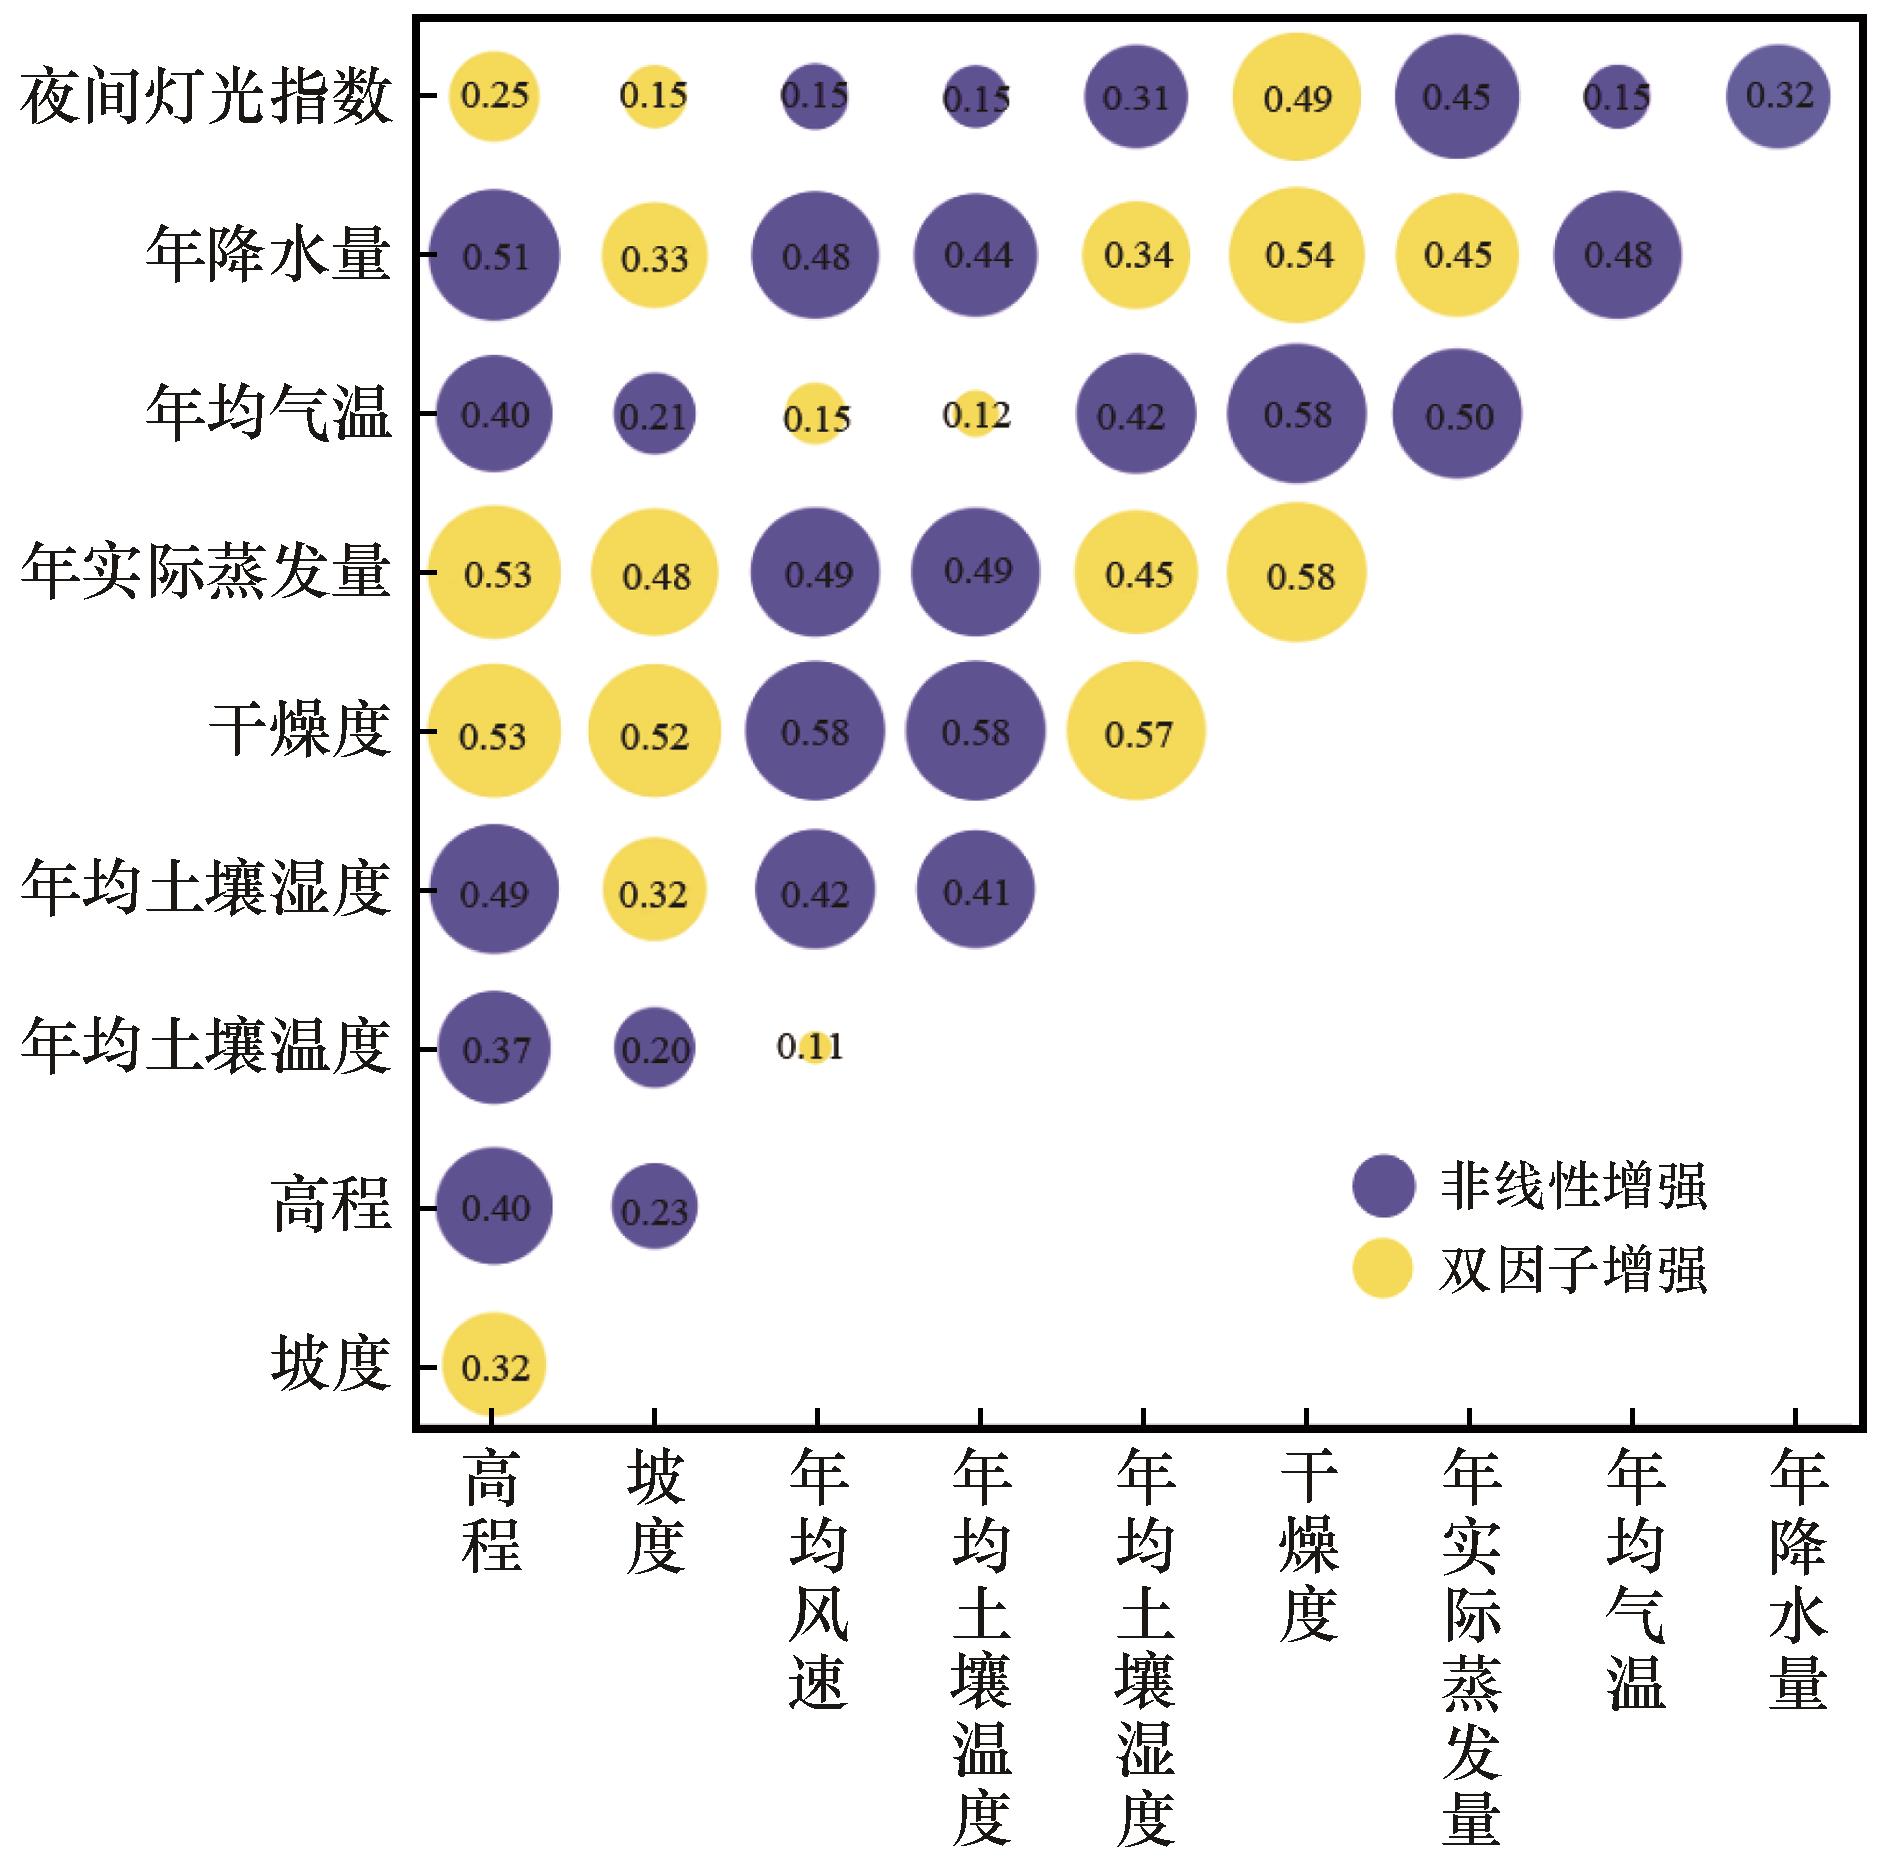
图10 各因子交互作用探测
Fig.10 Interaction detectors of these factors
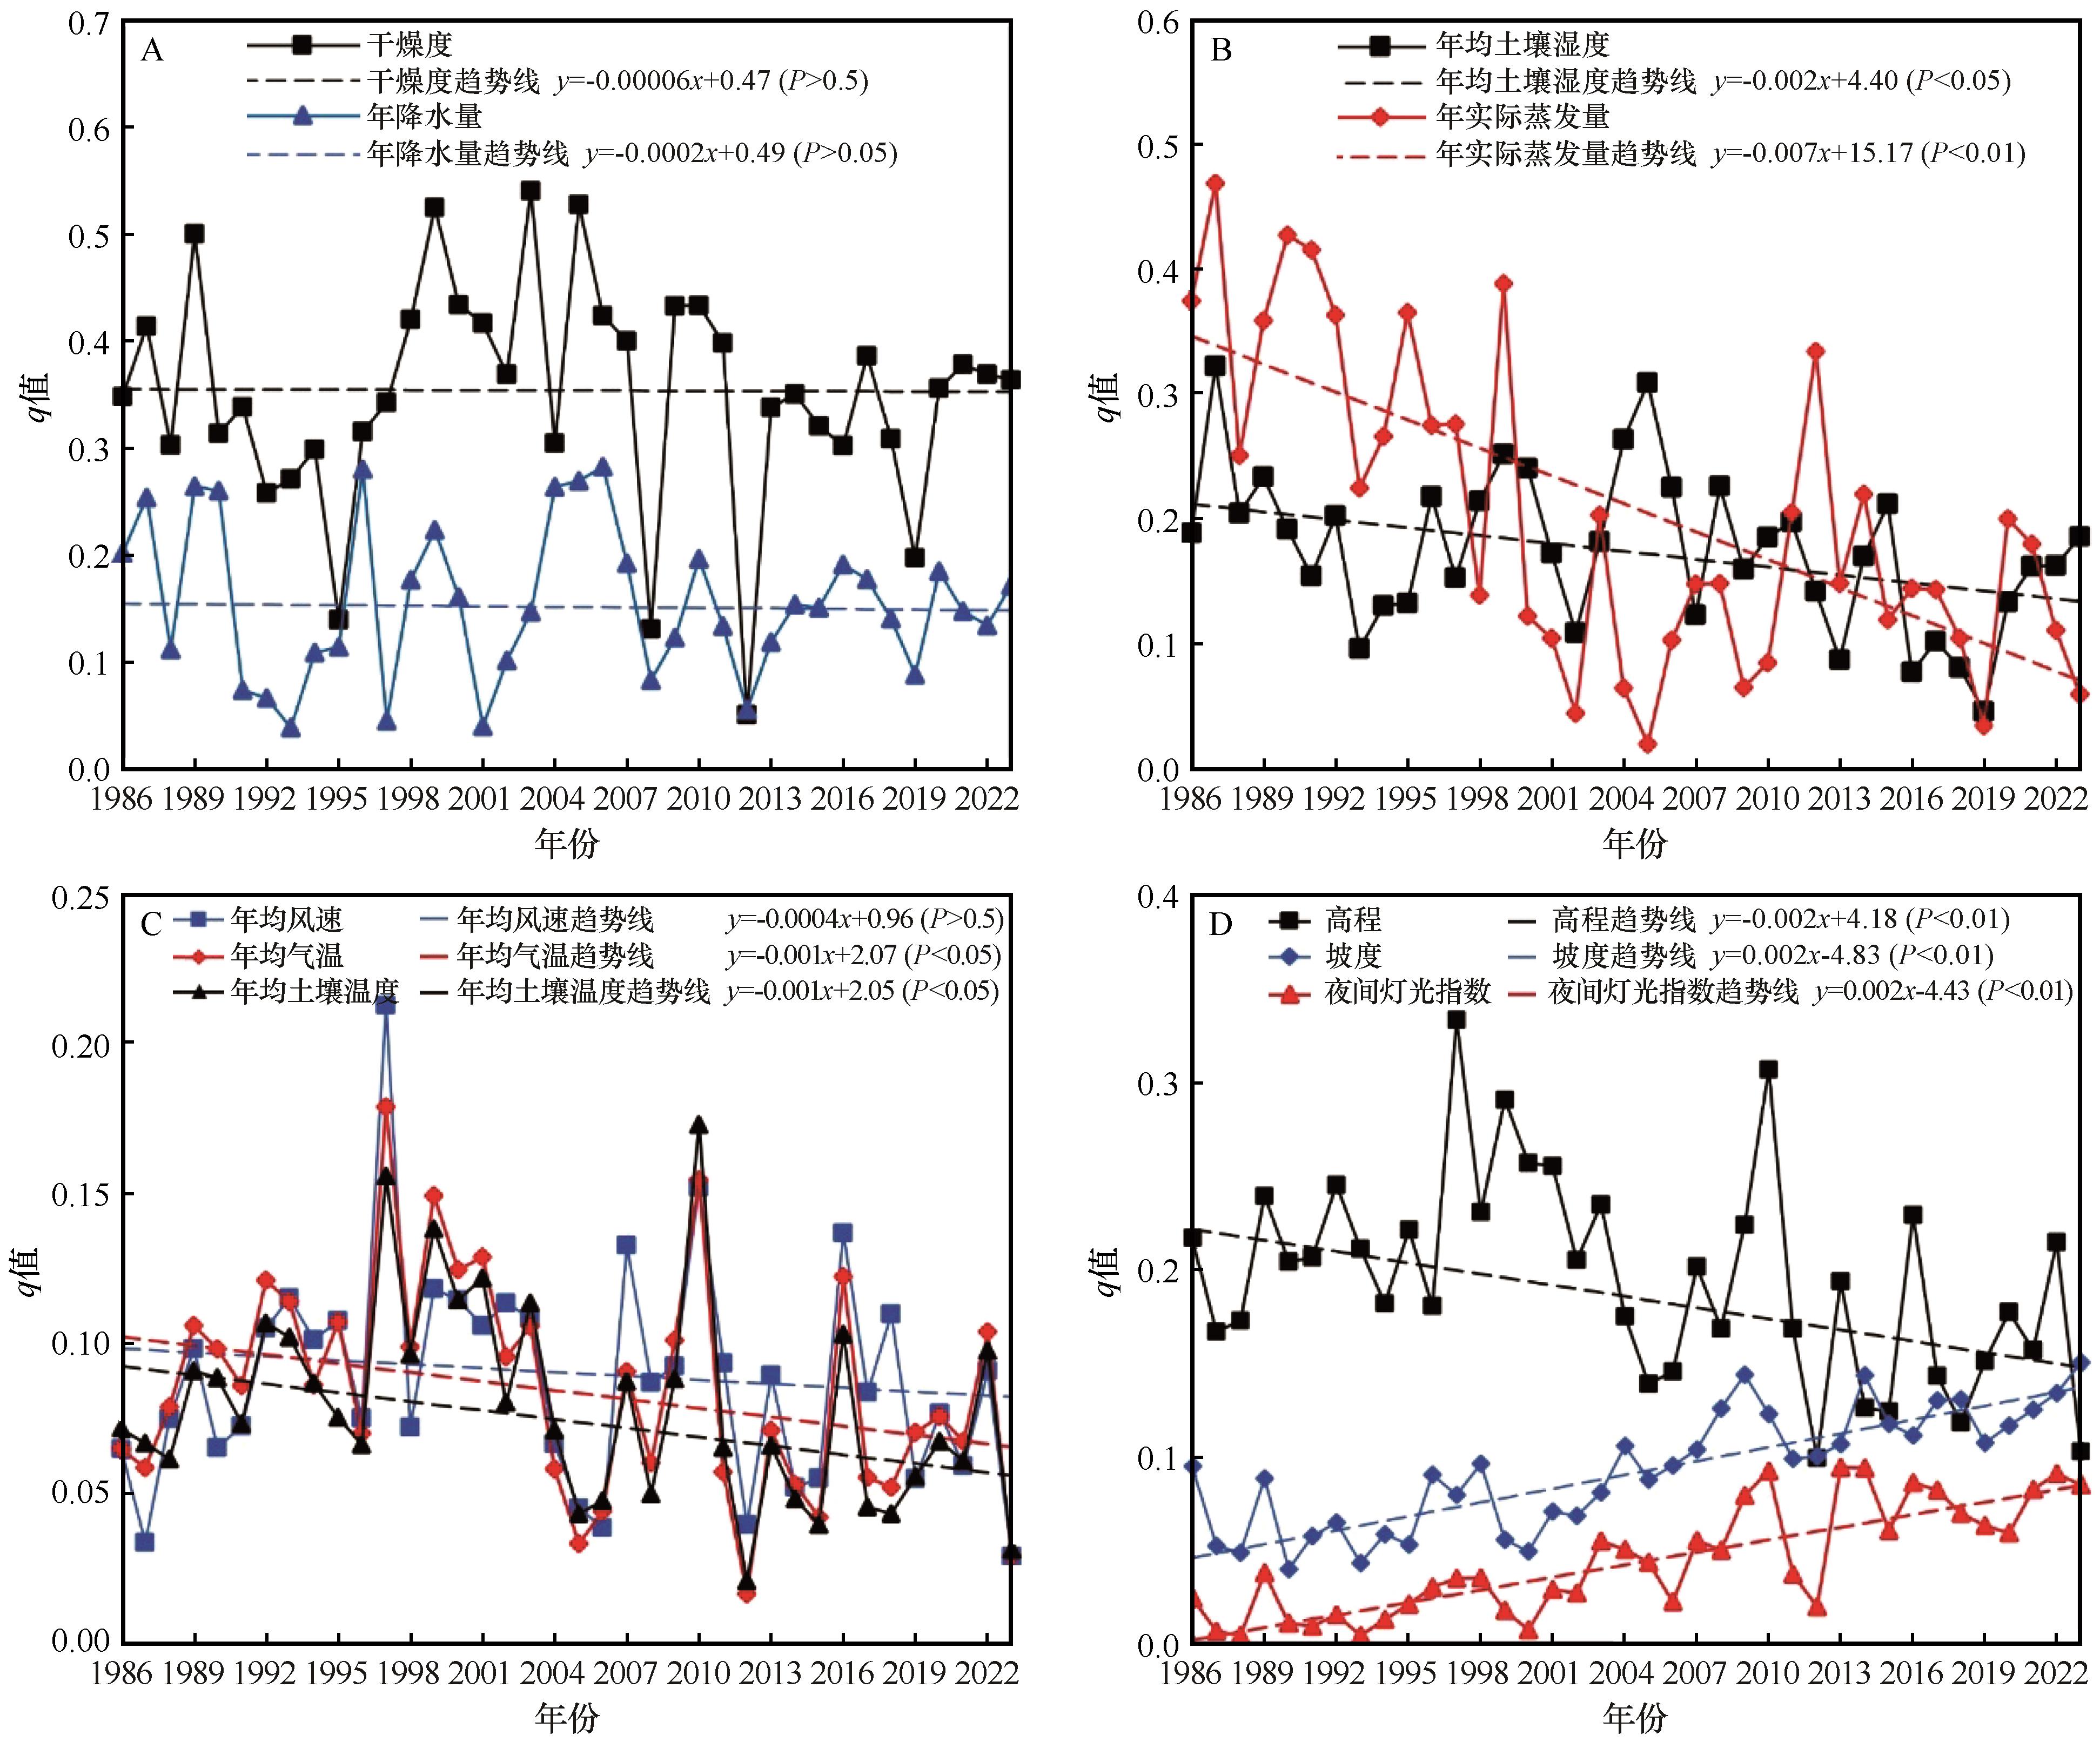
图11 1986—2023年驱动因子q值变化
Fig.11 Changes of q values of various driving factors from 1986 to 2023
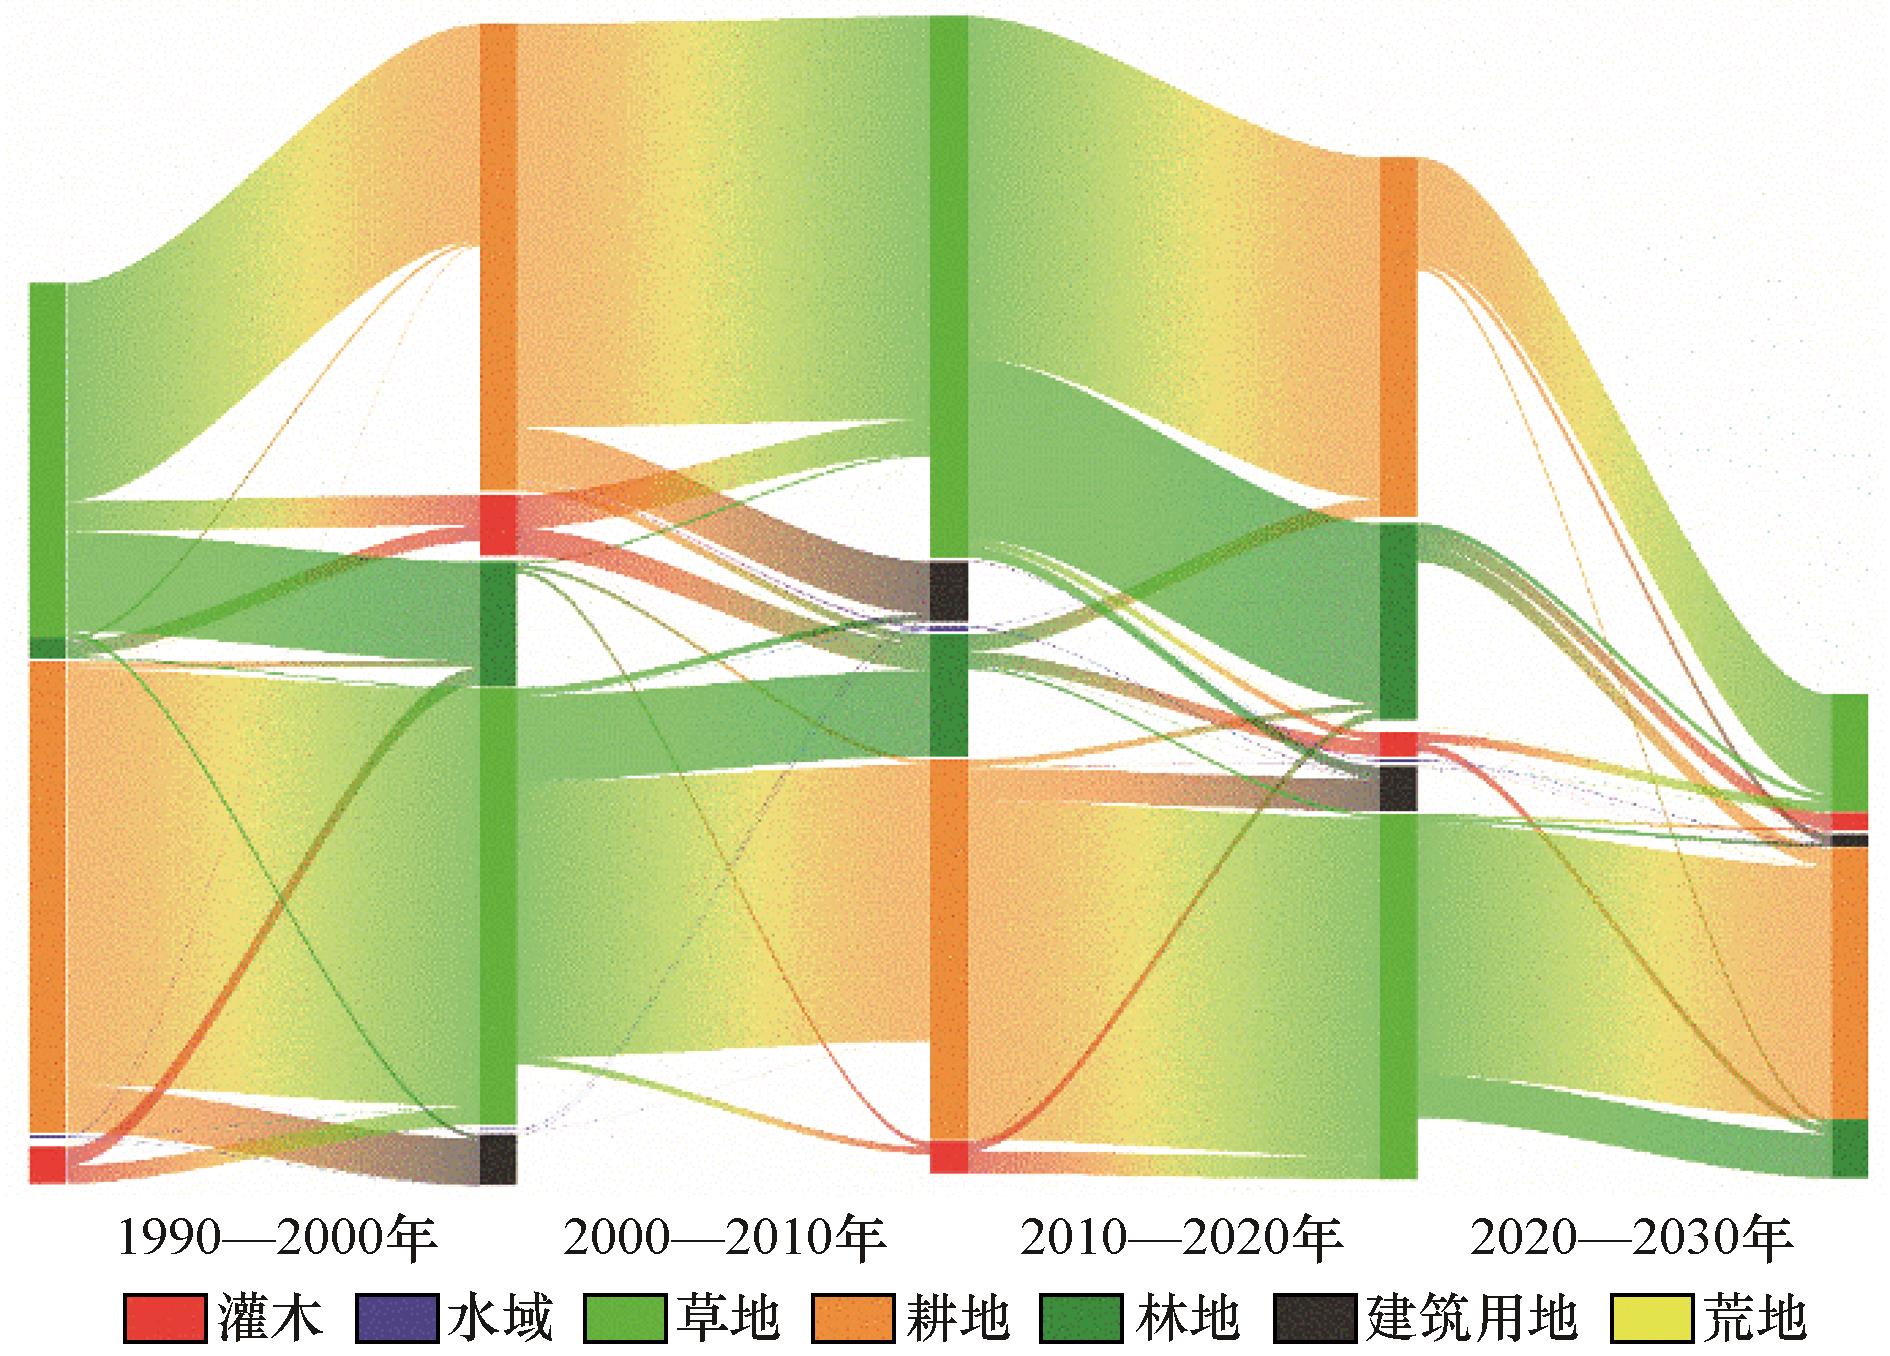
图12 1990—2023年吕梁山区土地利用分类变化
Fig.12 Land use classification changes in the Lvliang Mountain area from 1986 to 2023
| [1] | Higgins S I, Conradi T, Muhoko E.Shifts in vegetation activity of terrestrial ecosystems attributable to climate trends[J].Nature Geoscience,2023,16(2):147-153. |
| [2] | Pausas J G, Bond W J.On the three major recycling pathways in terrestrial ecosystems[J].Trends in Ecology & Evolution,2020,35(9):767-775. |
| [3] | 杜佳瑜,刘宪锋,孙高鹏,等.2003-2018年黄土高原植被光学厚度时空变化及其影响因素[J].中国沙漠,2024,44(3):222-230. |
| [4] | Rouse Jr J W, Haas R H, Deering D,et al.Monitoring the vernal advancement and retrogradation (green wave effect) of natural vegetation[R].College Station,Texas,USA:Texas A & m University,1974. |
| [5] | 申子傲,吴静,李纯斌.2000-2020年河西内陆河流域植被覆盖时空变化特征及其驱动力[J].中国沙漠,2024,44(3):119-127. |
| [6] | 王鹏新,龚健雅,李小文,等.基于植被指数和土地表面温度的干旱监测模型[J].地球科学进展,2003,18(4):527-533. |
| [7] | 杨邦杰,裴志远.农作物长势的定义与遥感监测[J].农业工程学报,1999,15(3):214-218. |
| [8] | 韩子言,蒙吉军,邹易,等.1982-2017年黑河流域植被指数动态及其对气候变化与生态建设工程的响应[J].中国沙漠,2023,43(3):96-106. |
| [9] | 郑元润,周广胜.基于NDVI的中国天然森林植被净第一性生产力模型[J].植物生态学报,2000,24(1):9-12. |
| [10] | 田剑,汤国安,周毅,等.黄土高原沟谷密度空间分异特征研究[J].地理科学,2013,33(5):622-628. |
| [11] | 武永利,李智才,王云峰,等.山西典型生态区植被指数(NDVI)对气候变化的响应[J].生态学杂志,2009,28(5):925-932. |
| [12] | 李孟蔚,栾青,张宁,等.2000-2019年吕梁市植被NDVI时空动态及其影响因素分析[J].水土保持研究,2022,29(4):248-254. |
| [13] | 王贝贝,周淑琴,荆耀栋,等.吕梁山地区植被物候变化及对气候的响应[J].中国农学通报,2021,37(16):102-107. |
| [14] | 孙高鹏,刘宪锋,王小红,等.2001-2020年黄河流域植被覆盖变化及其影响因素[J].中国沙漠,2021,41(4):205-212. |
| [15] | 田智慧,张丹丹,赫晓慧,等.2000-2015年黄河流域植被净初级生产力时空变化特征及其驱动因子[J].水土保持研究,2019,26(2):255-262. |
| [16] | 王娟,何慧娟,董金芳,等.黄河流域植被净初级生产力时空特征及自然驱动因子[J].中国沙漠,2021,41(6):213-222. |
| [17] | 张华,安慧敏.基于GEE的1987-2019年民勤绿洲NDVI变化特征及趋势分析[J].中国沙漠,2021,41(1):28-36. |
| [18] | 杨华庆,朱睿,尹振良,等.2001-2020年黄河流域水源涵养区植被覆盖变化及其对气候变化和人类活动的响应[J].中国沙漠,2024,44(4):57-70. |
| [19] | 王小娜,田金炎,李小娟,等.Google Earth Engine云平台对遥感发展的改变[J].遥感学报,2022,26(2):299-309. |
| [20] | 芦瑞杰,刘树林,康文平,等.结合GEE平台与机器学习算法的荒漠信息提取[J].中国沙漠,2023,43(6):60-70. |
| [21] | Yancho J M M, Jones T G, Gandhi S R,et al.The google earth engine mangrove mapping methodology (Geemmm)[J].Remote Sensing,2020,12(22):3758. |
| [22] | 胡云锋,商令杰,张千力,等.基于GEE平台的1990年以来北京市土地变化格局及驱动机制分析[J].遥感技术与应用,2018,33(4):573-583. |
| [23] | Sidhu N, Pebesma E, Câmara G.Using Google Earth Engine to detect land cover change:Singapore as a use case[J].European Journal of Remote Sensing,2018,51(1):486-500. |
| [24] | Jin Z N, Azzari G, You C,et al.Smallholder maize area and yield mapping at national scales with Google Earth Engine[J].Remote Sensing of Environment,2019,228:115-128. |
| [25] | Amani M, Mahdavi S, Afshar M,et al.Canadian wetland inventory using Google Earth Engine:the first map and preliminary results[J].Remote Sensing,2019,11(7):842. |
| [26] | Patel N N, Angiuli E, Gamba P,et al.Multitemporal settlement and population mapping from Landsat using Google Earth Engine[J].International Journal of Applied Earth Observation and Geoinformation,2015,35(Part B):199-208. |
| [27] | Meng X Y, Gao X, Li S,et al.Monitoring desertification in Mongolia based on Landsat images and Google Earth Engine from 1990 to 2020[J].Ecological Indicators,2021,129:107908. |
| [28] | 张姚姚,刘政鑫,张思悦,等.1957-2020年吕梁山区气候变化特征及影响因素分析[J].太原师范学院学报(自然科学版),2022,21(3):84-91. |
| [29] | 王琰.吕梁山森林生态系统碳密度及空间分布格局[D].太原:山西大学,2019. |
| [30] | 孙从建,李晓明,张文强,等.基于遥感信息的吕梁山贫困区生态安全评价[J].中国环境科学,2019,39(12):5352-5360. |
| [31] | 李慧,王百田,曹远博,等.吕梁山区3种人工林植被、凋落物生物量差异特征及其与土壤养分的关系[J].植物研究,2016,36(4):573-580. |
| [32] | Abatzoglou J T, Dobrowski S Z, Parks S A,et al.TerraClimate,a high-resolution global dataset of monthly climate and climatic water balance from 1958-2015[J].Scientific Data,2018,5(1):1-12. |
| [33] | McNally A, Arsenault K, Kumar S,et al.A land data assimilation system for sub-Saharan Africa food and water security applications[J].Scientific Data,2017,4(1):1-19. |
| [34] | Peng S Z, Ding Y X, Wen Z M,et al.Spatiotemporal change and trend analysis of potential evapotranspiration over the Loess Plateau of China during 2011-2100[J].Agricultural and Forest Meteorology,2017,233:183-194. |
| [35] | Miralles D G, Holmes T, De Jeu R,et al.Global land-surface evaporation estimated from satellite-based observations[J].Hydrology and Earth System Sciences,2011,15(2):453-469. |
| [36] | Peng S Z, Ding Y X, Liu W Z,et al.1 km monthly temperature and precipitation dataset for China from 1901 to 2017[J].Earth System Science Data,2019,11(4):1931-1946. |
| [37] | Abrams M, Crippen R, Fujisada H.ASTER global digital elevation model (GDEM) and ASTER global water body dataset (ASTWBD)[J].Remote Sensing,2020,12(7):1156. |
| [38] | Zhang L X, Ren Z H, Chen B,et al.A prolonged artificial nighttime-light dataset of China (1984-2020)[J].Scientific Data,2024,11(1):414. |
| [39] | Wu Y Z, Shi K F, Chen Z Q,et al.Developing improved time-series DMSP-OLS-like data (1992-2019) in China by integrating DMSP-OLS and SNPP-VIIRS[J].IEEE Transactions on Geoscience and Remote Sensing,2021,60:1-14. |
| [40] | Yang J, Huang X.30 m annual land cover and its dynamics in China from 1990 to 2019[J].Earth System Science Data Discussions,2021,2021:1-29. |
| [41] | 窦永静,王让虎,付含培,等.山西省植被NDVI时空变化及驱动力研究[J].山西大学学报(自然科学版),2023,46(1):244-255. |
| [42] | Sen P K.Estimates of the regression coefficient based on Kendall's tau[J].Journal of the American Statistical Association,1968,63(324):1379-1389. |
| [43] | Theil H.A rank-invariant method of linear and polynomial regression analysis:I,II and III[J].Proceedings of Koninklijke Nederlandse Akademie Vanwetenschappen,1950,53:386-392. |
| [44] | Mann H B.Nonparametric tests against trend[J].Econometrica:Journal of the Econometric Society,1945:245-259. |
| [45] | Kendall M.Rank Correlation Methods[J].Biometrika,1957,44(1/2):298. |
| [46] | 袁丽华,蒋卫国,申文明,等.2000-2010年黄河流域植被覆盖的时空变化[J].生态学报,2013,33(24):7798-7806. |
| [47] | Cai B F, Yu R.Advance and evaluation in the long time series vegetation trends research based on remote sensing[J].Journal of Remote Sensing,2009,13(6):1170-1186. |
| [48] | Hurst H E.Long-term storage capacity of reservoirs[J].Transactions of the American Society of Civil Engineers,1951,116(1):770-799. |
| [49] | Alvarez-Ramirez J, Echeverria J C, Rodriguez E.Is the North Atlantic Oscillation modulated by solar and lunar cycles? some evidences from Hurst autocorrelation analysis[J].Advances in Space Research,2011,47(4):748-756. |
| [50] | 岳辉,刘英.近15 a陕西省植被时空变化与影响因素分析[J].干旱区地理,2019,42(2):314-323. |
| [51] | 王劲峰,徐成东.地理探测器:原理与展望[J].地理学报,2017,72(1):116-134. |
| [52] | Wang J F, Li X H, Christakos G,et al.Geographical detectors‐based health risk assessment and its application in the neural tube defects study of the Heshun Region,China[J].International Journal of Geographical Information Science,2010,24(1):107-127. |
| [53] | Yao B, Gong X W, Li Y L,et al.Spatiotemporal variation and GeoDetector analysis of NDVI at the northern foothills of the Yinshan Mountains in Inner Mongolia over the past 40 years[J].Heliyon,2024,10(20):e39309. |
| [54] | Yang D W, Shao W W, Yeh P J,et al.Impact of vegetation coverage on regional water balance in the nonhumid regions of China[J].Water Resources Research,2009,45(7):W00A14. |
| [55] | Yang H, Luo P, Wang J,et al.Ecosystem evapotranspiration as a response to climate and vegetation coverage changes in Northwest Yunnan,China[J].Plos One,2015,10(8):e0134795. |
| [56] | Gao C, Ren X L, Fan L L,et al.Assessing the vegetation dynamics and its influencing factors in Central Asia from 2001 to 2020[J].Remote Sensing,2023,15(19):4670. |
| [57] | Guo Y J, Cheng L R, Ding A Z,et al.Geodetector model-based quantitative analysis of vegetation change characteristics and driving forces:a case study in the Yongding River basin in China[J].International Journal of Applied Earth Observation and Geoinformation,2024,132:104027. |
| [58] | 彭文甫,张冬梅,罗艳玫,等.自然因子对四川植被NDVI变化的地理探测[J].地理学报,2019,74(9):1758-1776. |
| [59] | Zhang Y, Zhang K C, An Z S,et al.Quantification of driving factors on NDVI in oasis-desert ecotone using geographical detector method[J].Journal of Mountain Science,2019,16(11):2615-2624. |
| [60] | 胡丰,张艳,郭宇,等.基于PLUS和InVEST模型的渭河流域土地利用与生境质量时空变化及预测[J].干旱区地理,2022,45(4):1125-1136. |
| [61] | 解铭威,周慧荻,陈耸,等.2000-2020年山西省吕梁市土地利用时空变化及其驱动因素[J].水土保持通报,2024,44(3):296-306. |
| [62] | 贾一越,齐璇璇,黄蕊,等.山西省植被覆盖度的时空变化及驱动因子[J].应用生态学报,2024,35(4):1073-1082. |
| [63] | 陈丽,梁建娥,郭青霞.基于GIS的忻州市土地利用分区研究[J].山西农业大学学报(自然科学版),2011,31(2):161-165. |
| [64] | 陈霁巍,穆兴民.黄河断流的态势、成因与科学对策[J].自然资源学报,2000,15(1):31-35. |
| [65] | 胡会峰,刘国华.中国天然林保护工程的固碳能力估算[J].生态学报,2006,26(1):291-296. |
| [66] | 问宝旺.退耕还林工程实践与探索[J].山西水土保持科技,2004(4):10-11. |
| [67] | 董彦华.基于森林资源变化的忻州市天然林保护工程实施效果评价[D].山西晋中:山西农业大学,2013. |
| [1] | 姜志伟, 杨智博, 杨清, 胡洁, 刘茜雅, 于玲玲, 张红红, 淡照晶, 田磊. 2000—2022年库布齐沙漠植被覆盖度时空变化及其驱动因子[J]. 中国沙漠, 2025, 45(5): 124-133. |
| [2] | 李思琪, 王海兵, 袁晓飞, 敖胡日查, 杨皓钦. 毛乌素沙地景观生态风险时空演变及驱动力[J]. 中国沙漠, 2025, 45(5): 230-240. |
| [3] | 钟凌飞, 刘鹄, 张丽华. 河西走廊荒漠植被归一化指数(NDVI)与降水量的关系[J]. 中国沙漠, 2025, 45(5): 318-327. |
| [4] | 王卫国, 谢欢, 冯国庆, 家淑珍. 京津风沙源治理工程区生态环境质量及驱动力[J]. 中国沙漠, 2025, 45(4): 139-152. |
| [5] | 周得龙, 王永芳, 郭恩亮, 红英, 马浩文, 慕全飞, 王妍力. 科尔沁沙地生境质量演变与预测[J]. 中国沙漠, 2025, 45(4): 211-226. |
| [6] | 刘永杰, 杜鹤强, 范亚伟, 杨胜飞. 基于Google Earth Engine(GEE)的毛乌素沙地风蚀荒漠化过程监测[J]. 中国沙漠, 2025, 45(2): 262-274. |
| [7] | 贾虹, 刘连友, 刘吉夫. 共和盆地土地荒漠化敏感性评估[J]. 中国沙漠, 2025, 45(1): 1-9. |
| [8] | 陈兵兵, 盖迎春, 宋忠航, 吴向楠, 艾宇, 杨映, 王生棠, 刘宇烁. 祁连山地区生态质量时空变化及驱动力[J]. 中国沙漠, 2024, 44(6): 258-267. |
| [9] | 段翰晨, 黄背英. 基于AHP与改进型MEDALUS模型耦合的科尔沁沙地土地沙漠化敏感性综合评价[J]. 中国沙漠, 2024, 44(4): 137-148. |
| [10] | 刘二燕, 赵媛媛, 周蝶, 武海岩, 高广磊, 丁国栋. 科尔沁-浑善达克沙地2000—2020年土地沙化时空变化格局[J]. 中国沙漠, 2024, 44(4): 46-56. |
| [11] | 杨华庆, 朱睿, 尹振良, 山建安, 张薇, 方春爽. 2001—2020年黄河流域水源涵养区植被覆盖变化及其对气候变化和人类活动的响应[J]. 中国沙漠, 2024, 44(4): 57-70. |
| [12] | 申子傲, 吴静, 李纯斌. 2000—2020年河西内陆河流域植被覆盖时空变化特征及其驱动力[J]. 中国沙漠, 2024, 44(3): 119-127. |
| [13] | 蔡明玉, 贾飚, 常学礼. 景观格局因子交互作用对科尔沁沙地沙漠化的影响[J]. 中国沙漠, 2024, 44(2): 99-108. |
| [14] | 徐晨曦, 万红莲, 何若楠, 殷鹏, 倪敬峰, 黄敏, 王晓利. 关中平原城市群脆弱性时空演变与驱动因子[J]. 中国沙漠, 2023, 43(6): 111-120. |
| [15] | 芦瑞杰, 刘树林, 康文平, 冯坤, 郭紫晨, 支莹. 结合GEE平台与机器学习算法的荒漠信息提取[J]. 中国沙漠, 2023, 43(6): 60-70. |
| 阅读次数 | ||||||
|
全文 |
|
|||||
|
摘要 |
|
|||||
©2018中国沙漠 编辑部
地址: 兰州市天水中路8号 (730000)
电话:0931-8267545
Email:caiedit@lzb.ac.cn;desert@lzb.ac.cn

 甘公网安备 62010202000688号