img

官方微信

高级检索

中国沙漠 ›› 2025, Vol. 45 ›› Issue (5): 318-327.DOI: 10.7522/j.issn.1000-694X.2025.00024

• • 上一篇    

河西走廊荒漠植被归一化指数(NDVI)与降水量的关系

钟凌飞1(), 刘鹄2, 张丽华1()   

  1. 1.西北师范大学 地理与环境科学学院,甘肃 兰州 730030
    2.中国科学院西北生态环境资源研究院,甘肃 兰州 730000
  • 收稿日期:2024-11-23 修回日期:2025-02-19 出版日期:2025-09-20 发布日期:2025-09-27
  • 通讯作者: 张丽华
  • 作者简介:钟凌飞(1996—),男,甘肃兰州人,硕士研究生,主要从事干旱区生态水文研究。E-mail: zhonglf96@163.com
  • 基金资助:
    国家自然科学基金项目(42171117);甘肃省水利厅委托项目(E339040201)

Relationship between NDVI and precipitation in the Hexi Corridor desert area

Lingfei Zhong1(), Hu Liu2, Lihua Zhang1()   

  1. 1.College of Geography and Environment Science,Northwest Normal University,Lanzhou 730030,China
    2.Northwest Institute of Eco-Environment and Resources,Chinese Academy of Sciences,Lanzhou 730000,China
  • Received:2024-11-23 Revised:2025-02-19 Online:2025-09-20 Published:2025-09-27
  • Contact: Lihua Zhang

摘要:

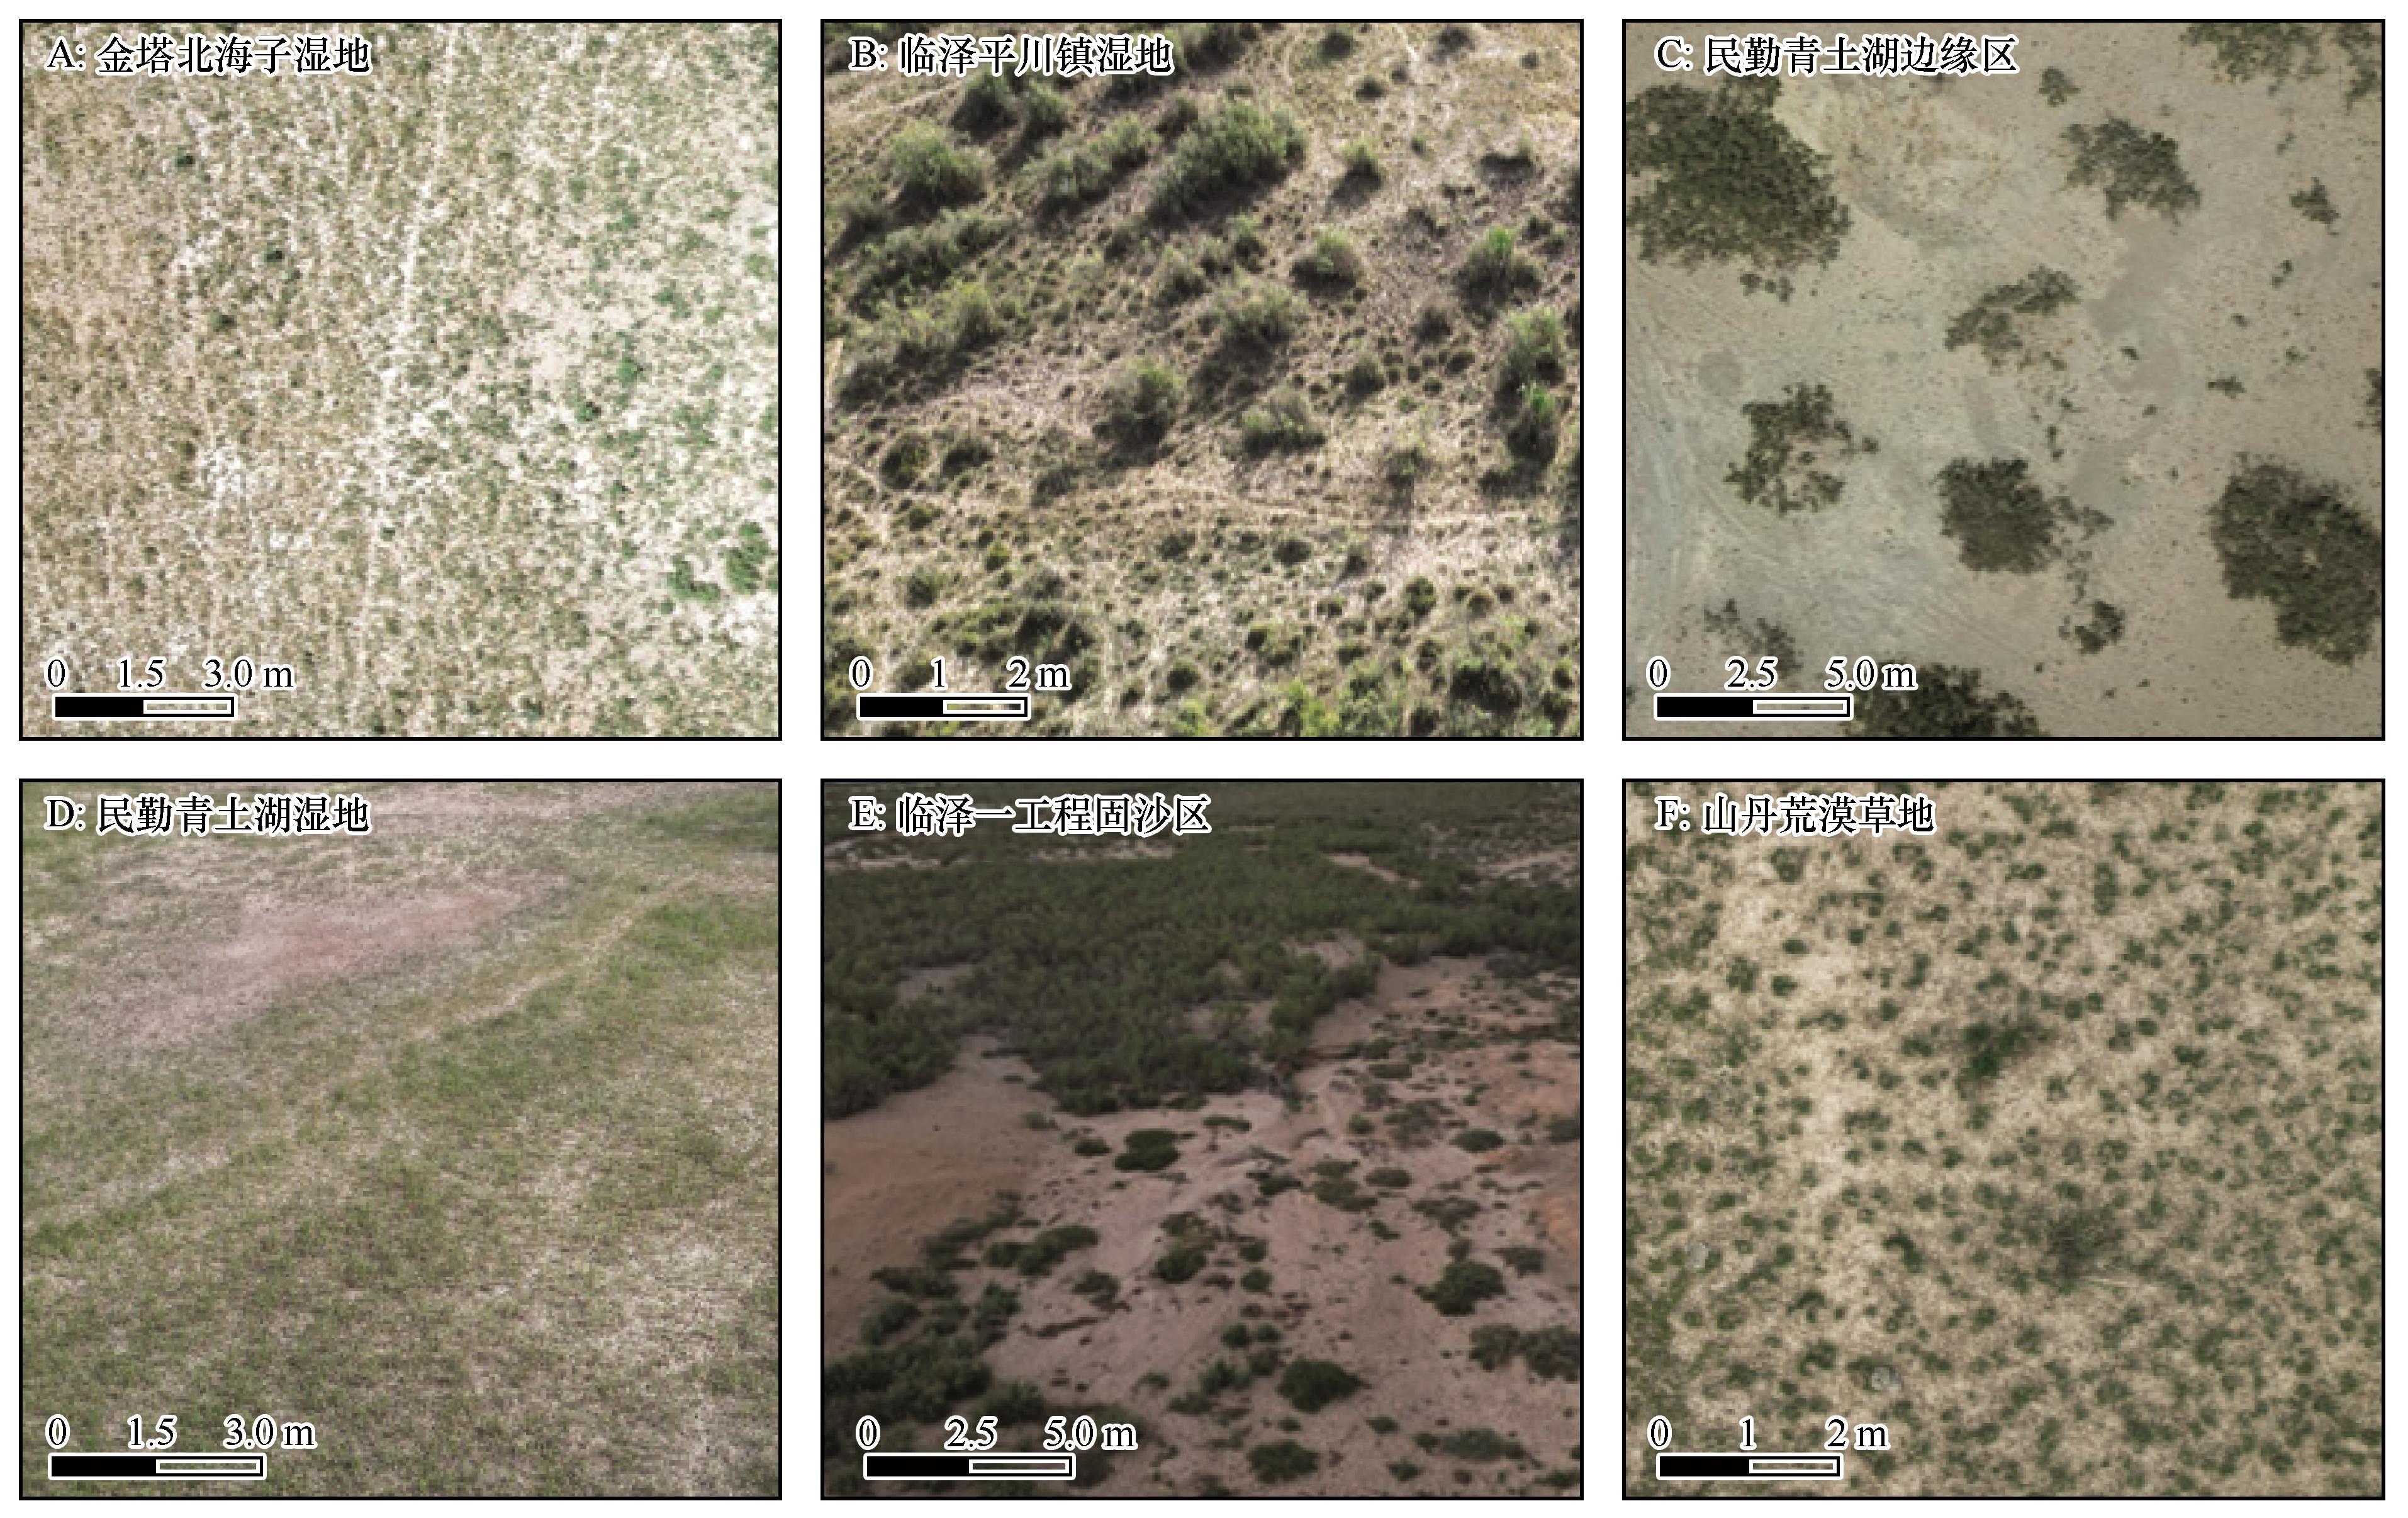
干旱荒漠区的部分天然植被主要依赖地下水生存,即地下水依赖植被。保护地下水依赖植被是干旱区生态保护的重要内容,应用遥感产品快速识别地下水依赖植被对干旱区生态保护具有重要的实践意义。在河西走廊选取6个依赖不同来源水分的样区,分析各样区2001—2020年植被NDVI变化与降水量的相关性,探讨应用NDVI产品识别地下水依赖植被的可行性。结果表明:2001—2020年6个样区NDVI平均值为0.11~0.29,变异系数0.07~0.59,最大值0.20~0.32,最小值0.07~0.26。Pearson相关分析表明,6个样区平均NDVI与生长季降水量的相关系数0.16~0.55,NDVI最大值与生长季降水量的相关系数0.24~0.65,NDVI最小值与生长季降水量的相关系数0.10~0.30;NDVI变异性与生长季降水量的相关系数0.21~0.70。总体上,荒漠植被NDVI变化与生长季降水量的相关性大于与年降水量的相关性,地下水依赖植被NDVI与降水量相关性小于降水依赖植被的相关性;NDVI生长季变异性与生长季降水量相关性高于与生长季NDVI平均值与生长季降水量的相关性,因此用生长季NDVI变异性能够通过植被对降水的依赖程度更好地反推出植被对地下水的依赖程度。

关键词: 河西走廊, 降水, 地下水埋深, NDVI, 植被地下水依赖性

Abstract:

In arid desert areas, some natural vegetation mainly depends on groundwater for survival, which is known as groundwater-dependent vegetation. Protecting groundwater-dependent vegetation is an important task in ecological construction in arid areas, and using remote sensing products to rapidly identify groundwater-dependent vegetation has important practical significance for ecological protection in arid areas. We selected six sample areas dependent on different sources of moisture in the Hexi Corridor, analysed the correlation between vegetation NDVI changes and precipitation from 2001 to 2020 in each sample area, and explored the feasibility of applying NDVI products to identify groundwater-dependent vegetation. The result shows that the average NDVI value of the six sample areas from 2001 to 2020 was between 0.11-0.29, and the coefficient of variation was between 0.07-0.59; the maximum value was between 0.20-0.32, and the minimum value was between 0.07-0.26. Pearson's correlation results showed that the correlation coefficients between the average NDVI and growing season precipitation in the six sampling areas ranged from 0.16 to 0.55, the correlation coefficients between the maximum NDVI and growing season precipitation ranged from 0.24 to 0.65, and the correlation coefficients between the minimum NDVI and growing season precipitation ranged from 0.10 to 0.30; the correlation coefficients between the variability of NDVI and the growing season precipitation ranged from 0.21 to 0.70. The correlation coefficients between NDVI variability and growing season precipitation ranged from 0.21 to 0.70. In general, the correlation of desert vegetation NDVI variability with growing season precipitation was greater than that with annual precipitation, and the correlation between groundwater-dependent vegetation NDVI and precipitation was smaller than that of precipitation-dependent vegetation; the correlation of NDVI growing season variability with growing season precipitation was higher than that with the correlation of the mean growing season NDVI with growing season precipitation. Therefore, the growing season NDVI variability can better infer the dependence of vegetation on groundwater through the dependence of vegetation on precipitation.

Key words: Hexi Corridor, precipitation, groundwater burial depth, NDVI, dependence of vegetation on groundwater

中图分类号: