
- CN 62-1070/P
- ISSN 1000-694X
- Bimonthly 1981
Journal of Desert Research ›› 2021, Vol. 41 ›› Issue (6): 41-53.DOI: 10.7522/j.issn.1000-694X.2021.00069
Previous Articles Next Articles
Dagang Wang1,2( ), Yang Yu1,2(), Lingxiao Sun1,2, Jing He1,2, Malik Ireneusz1,3, Wistuba Malgorzata1,3, Fengqing Jiang1,2, Ruide Yu1,2
Received:2021-03-17
Revised:2021-05-18
Online:2021-11-20
Published:2021-12-17
Contact:
Yang Yu
CLC Number:
Dagang Wang, Yang Yu, Lingxiao Sun, Jing He, Malik Ireneusz, Wistuba Malgorzata, Fengqing Jiang, Ruide Yu. Adaptability evaluation and modification of ET0 models in a typical oases on southern margin of the Taklimakan Desert[J]. Journal of Desert Research, 2021, 41(6): 41-53.
Add to citation manager EndNote|Ris|BibTeX
URL: http://www.desert.ac.cn/EN/10.7522/j.issn.1000-694X.2021.00069
| 模型 | 最小值/mm | 最大值/mm | 均值/mm | 标准差 | 方差 | 变异系数 |
|---|---|---|---|---|---|---|
| 蒸渗仪 | 2.738 | 9.989 | 5.829 | 1.239 | 1.535 | 0.213 |
| Hargreaves-Samani | 5.439 | 18.140 | 13.289 | 3.156 | 9.958 | 0.237 |
| Jensen-Haise | 1.172 | 7.197 | 4.424 | 1.406 | 1.977 | 0.318 |
| Makkink | 1.717 | 5.152 | 3.453 | 0.729 | 0.531 | 0.211 |
| FAO-56PM | 1.853 | 6.915 | 4.963 | 1.190 | 1.416 | 0.240 |
| Priestley-Taylor | 1.294 | 6.212 | 4.008 | 1.142 | 1.304 | 0.285 |
| Turc | 0.812 | 2.804 | 1.943 | 0.458 | 0.209 | 0.236 |
Table 1 Statistic characteristics for daily ET0 between different models and lysimeter
| 模型 | 最小值/mm | 最大值/mm | 均值/mm | 标准差 | 方差 | 变异系数 |
|---|---|---|---|---|---|---|
| 蒸渗仪 | 2.738 | 9.989 | 5.829 | 1.239 | 1.535 | 0.213 |
| Hargreaves-Samani | 5.439 | 18.140 | 13.289 | 3.156 | 9.958 | 0.237 |
| Jensen-Haise | 1.172 | 7.197 | 4.424 | 1.406 | 1.977 | 0.318 |
| Makkink | 1.717 | 5.152 | 3.453 | 0.729 | 0.531 | 0.211 |
| FAO-56PM | 1.853 | 6.915 | 4.963 | 1.190 | 1.416 | 0.240 |
| Priestley-Taylor | 1.294 | 6.212 | 4.008 | 1.142 | 1.304 | 0.285 |
| Turc | 0.812 | 2.804 | 1.943 | 0.458 | 0.209 | 0.236 |
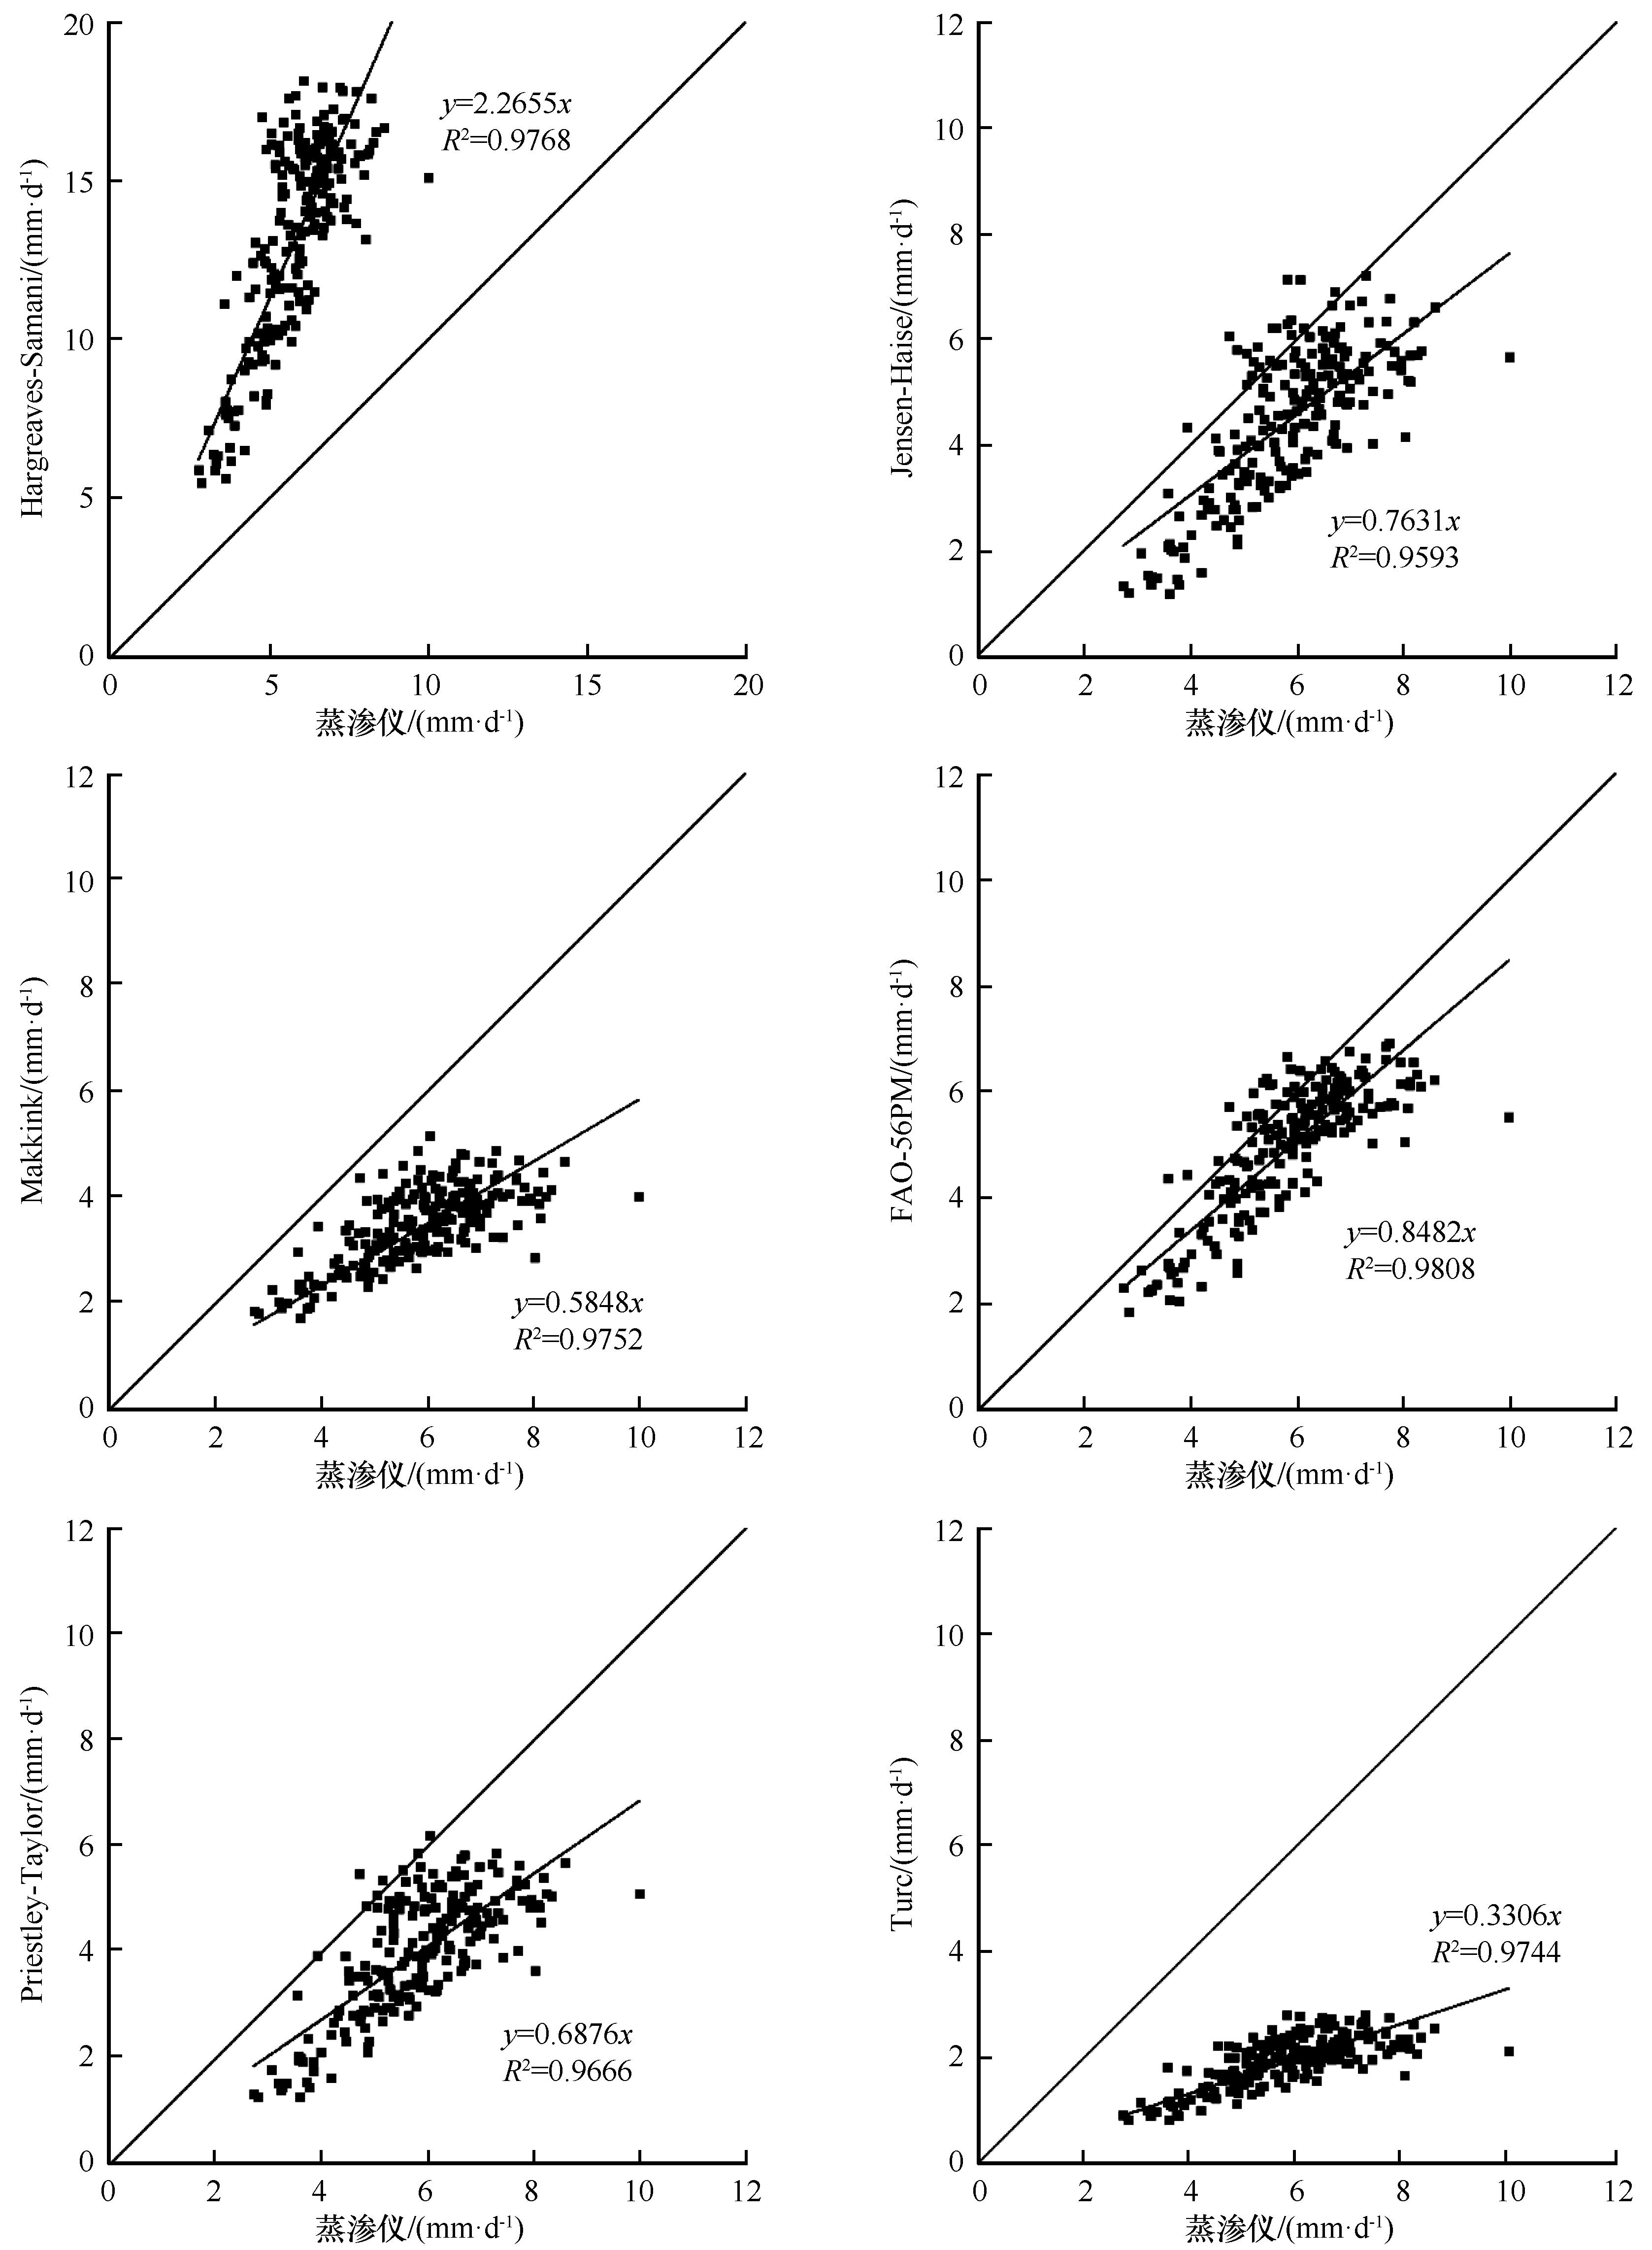
Fig.1 Linear regression analysis of daily ET0 between calculated and measured values
| 模型 | 线性回归 | 最大绝对误差 MAE | 均方根误差 RMSE | 模型效率 EF | 一致性指数 d | |
|---|---|---|---|---|---|---|
| K | R2 | |||||
| Hargreaves-Samani | 2.2655 | 0.9768 | 7.46 | 7.82 | -38.85 | 0.24 |
| Jensen-Haise | 0.7631 | 0.9593 | 1.50 | 1.69 | -0.87 | 0.69 |
| Makkink | 0.5848 | 0.9752 | 2.38 | 2.54 | -3.19 | 0.49 |
| FAO-56PM | 0.8482 | 0.9808 | 0.97 | 1.15 | 0.14 | 0.80 |
| Priestley-Taylor | 0.6876 | 0.9666 | 1.83 | 2.01 | -1.63 | 0.61 |
| Turc | 0.3306 | 0.9744 | 3.89 | 4.00 | -9.43 | 0.35 |
Table 2 The evaluation of monthly ET0 simulated effects by different models
| 模型 | 线性回归 | 最大绝对误差 MAE | 均方根误差 RMSE | 模型效率 EF | 一致性指数 d | |
|---|---|---|---|---|---|---|
| K | R2 | |||||
| Hargreaves-Samani | 2.2655 | 0.9768 | 7.46 | 7.82 | -38.85 | 0.24 |
| Jensen-Haise | 0.7631 | 0.9593 | 1.50 | 1.69 | -0.87 | 0.69 |
| Makkink | 0.5848 | 0.9752 | 2.38 | 2.54 | -3.19 | 0.49 |
| FAO-56PM | 0.8482 | 0.9808 | 0.97 | 1.15 | 0.14 | 0.80 |
| Priestley-Taylor | 0.6876 | 0.9666 | 1.83 | 2.01 | -1.63 | 0.61 |
| Turc | 0.3306 | 0.9744 | 3.89 | 4.00 | -9.43 | 0.35 |
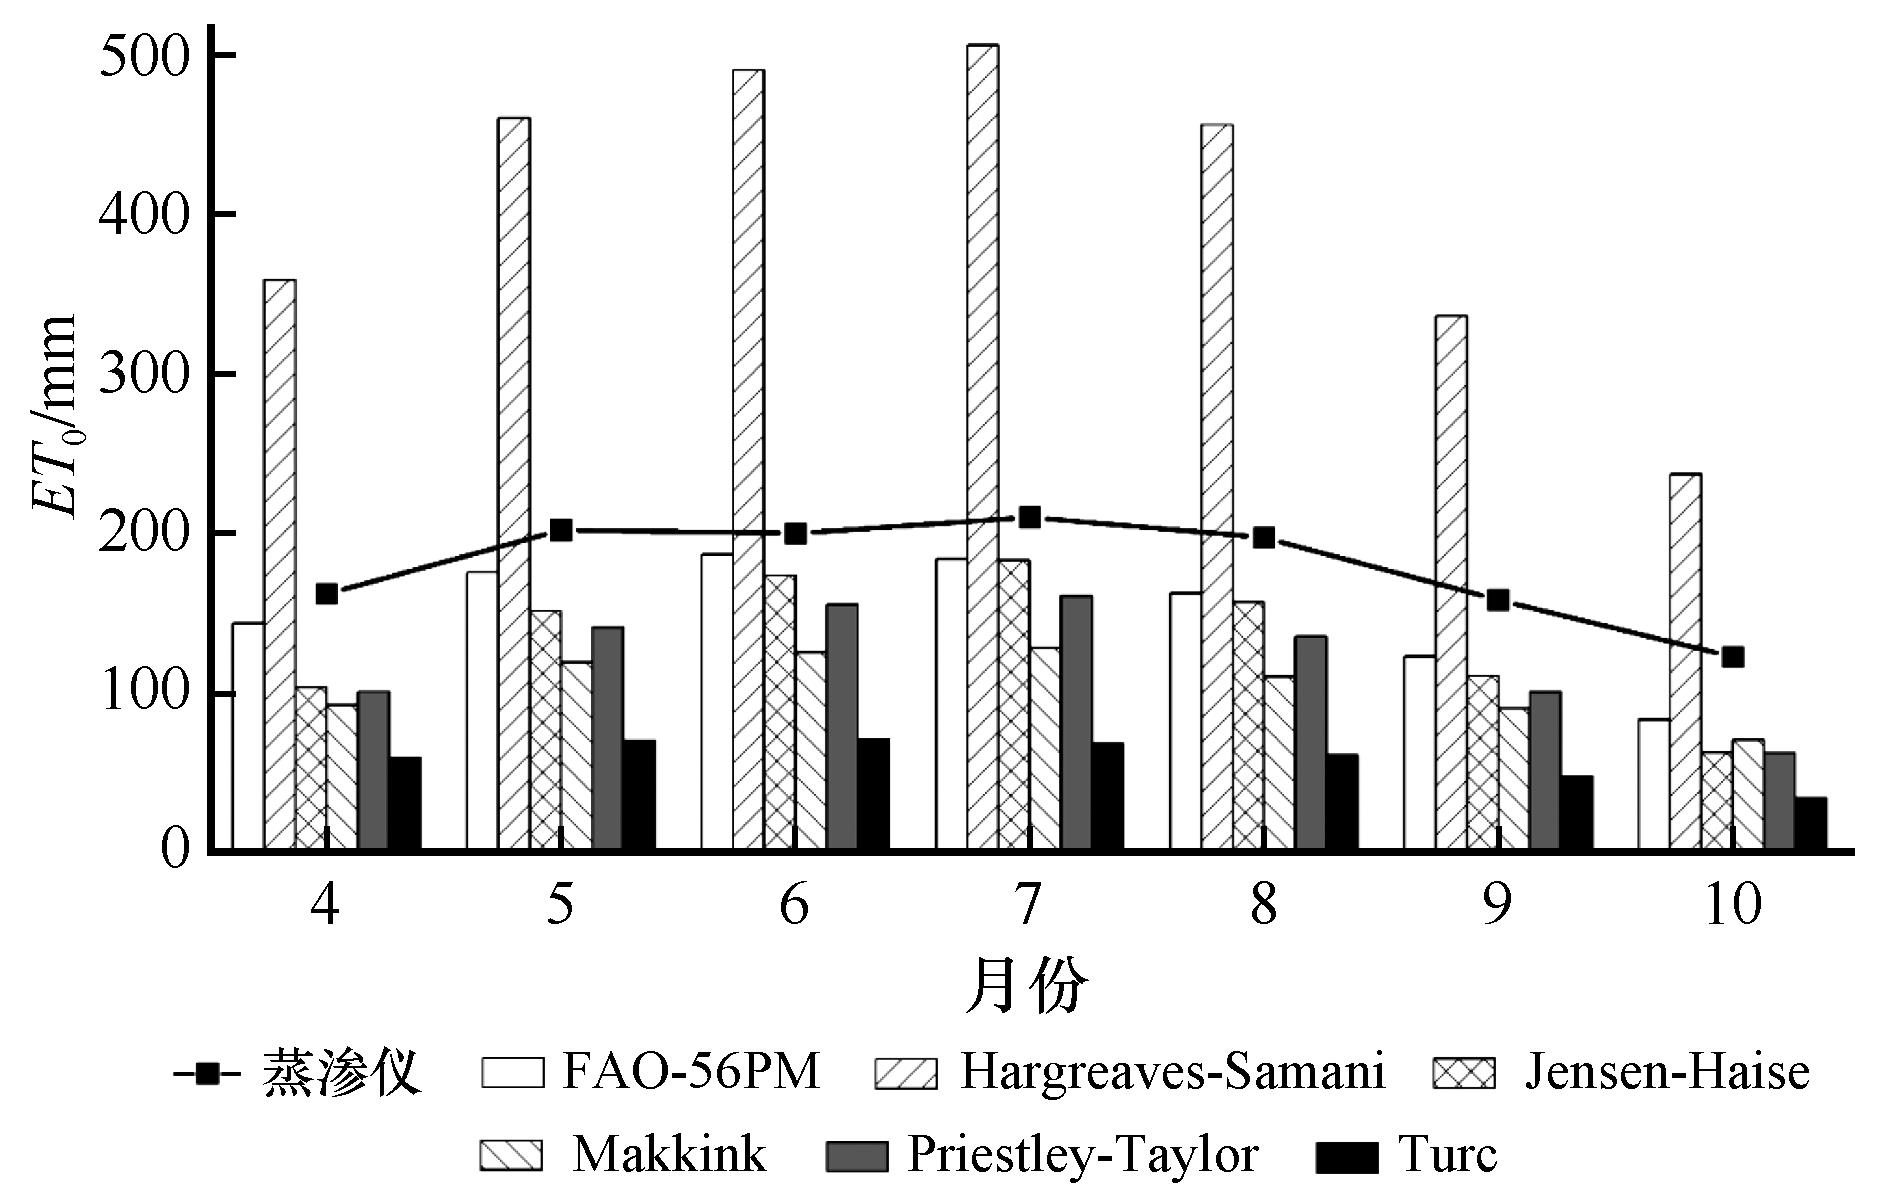
Fig.2 Monthly evapotranspiration calculated with different models
| 月份 | Hargreaves-Samani | Jensen-Haise | Makkink | FAO-56PM | Priestley-Taylor | Turc |
|---|---|---|---|---|---|---|
| 4 | 0.575** | 0.627** | 0.481** | 0.825** | 0.557** | 0.606** |
| 5 | 0.179 | 0.076 | -0.088 | 0.375** | -0.082 | 0.082 |
| 6 | 0.220 | 0.279 | 0.212 | 0.480** | 0.149 | 0.377** |
| 7 | -0.235 | 0.004 | 0.049 | 0.226 | 0.040 | 0.113 |
| 8 | 0.066 | 0.095 | 0.019 | 0.556** | 0.043 | 0.137 |
| 9 | 0.168 | 0.218 | 0.075 | 0.333 | 0.072 | 0.270 |
| 10 | 0.760** | 0.761** | 0.748** | 0.737** | 0.790** | 0.731** |
| 生长季 | 0.764** | 0.751** | 0.711** | 0.808** | 0.747** | 0.736** |
Table 3 Correlation coefficient between monthly measured value of lysimeter and monthly value calculated by different ET0 models (data points=214)
| 月份 | Hargreaves-Samani | Jensen-Haise | Makkink | FAO-56PM | Priestley-Taylor | Turc |
|---|---|---|---|---|---|---|
| 4 | 0.575** | 0.627** | 0.481** | 0.825** | 0.557** | 0.606** |
| 5 | 0.179 | 0.076 | -0.088 | 0.375** | -0.082 | 0.082 |
| 6 | 0.220 | 0.279 | 0.212 | 0.480** | 0.149 | 0.377** |
| 7 | -0.235 | 0.004 | 0.049 | 0.226 | 0.040 | 0.113 |
| 8 | 0.066 | 0.095 | 0.019 | 0.556** | 0.043 | 0.137 |
| 9 | 0.168 | 0.218 | 0.075 | 0.333 | 0.072 | 0.270 |
| 10 | 0.760** | 0.761** | 0.748** | 0.737** | 0.790** | 0.731** |
| 生长季 | 0.764** | 0.751** | 0.711** | 0.808** | 0.747** | 0.736** |
| 月份 | 模型 | 回归修正 | 比例修正 | |
|---|---|---|---|---|
| a | b | KR | ||
| 4 | Hargreaves-Samani | 0.268 | 2.201 | 0.449 |
| Jensen-Haise | 0.762 | 2.779 | 1.545 | |
| Makkink | 1.029 | 2.233 | 1.744 | |
| FAO-56PM | 1.113 | 0.081 | 1.129 | |
| Priestley-Taylor | 1.070 | 1.805 | 1.600 | |
| Turc | 1.794 | 1.835 | 2.701 | |
| 5 | Hargreaves-Samani | 0.131 | 4.585 | 0.438 |
| Jensen-Haise | 0.101 | 6.030 | 1.309 | |
| Makkink | -0.160 | 7.145 | 1.669 | |
| FAO-56PM | 0.742 | 2.282 | 1.139 | |
| Priestley-Taylor | -0.135 | 7.141 | 1.420 | |
| Turc | 0.273 | 5.893 | 2.793 | |
| 6 | Hargreaves-Samani | 0.179 | 3.752 | 0.407 |
| Jensen-Haise | 0.327 | 4.779 | 1.136 | |
| Makkink | 0.409 | 4.957 | 1.575 | |
| FAO-56PM | 1.053 | 0.114 | 1.071 | |
| Priestley-Taylor | 0.284 | 5.205 | 1.281 | |
| Turc | 1.219 | 3.784 | 2.790 | |
| 7 | Hargreaves-Samani | -0.458 | 14.042 | 0.406 |
| Jensen-Haise | 0.011 | 6.546 | 1.122 | |
| Makkink | 0.179 | 5.874 | 1.602 | |
| FAO-56PM | 0.880 | 1.450 | 1.126 | |
| Priestley-Taylor | 0.141 | 5.881 | 1.273 | |
| Turc | 0.775 | 4.902 | 2.988 | |
| 8 | Hargreaves-Samani | 0.044 | 5.731 | 0.431 |
| Jensen-Haise | 0.148 | 5.619 | 1.237 | |
| Makkink | 0.043 | 6.219 | 1.760 | |
| FAO-56PM | 1.347 | -0.717 | 1.212 | |
| Priestley-Taylor | 0.088 | 5.991 | 1.441 | |
| Turc | 0.606 | 5.179 | 3.209 | |
| 9 | Hargreaves-Samani | 0.103 | 4.102 | 0.465 |
| Jensen-Haise | 0.287 | 4.192 | 1.403 | |
| Makkink | 0.161 | 4.768 | 1.728 | |
| FAO-56PM | 0.491 | 3.235 | 1.271 | |
| Priestley-Taylor | 0.124 | 4.836 | 1.547 | |
| Turc | 1.007 | 3.646 | 3.270 | |
| 10 | Hargreaves-Samani | 0.382 | 1.022 | 0.511 |
| Jensen-Haise | 0.831 | 2.201 | 1.796 | |
| Makkink | 1.565 | 0.354 | 1.717 | |
| FAO-56PM | 1.009 | 1.158 | 1.415 | |
| Priestley-Taylor | 1.126 | 1.669 | 1.908 | |
| Turc | 2.459 | 1.132 | 3.419 | |
Table 4 Slope of linear regression equation and monthly empirical coefficient of models after modified
| 月份 | 模型 | 回归修正 | 比例修正 | |
|---|---|---|---|---|
| a | b | KR | ||
| 4 | Hargreaves-Samani | 0.268 | 2.201 | 0.449 |
| Jensen-Haise | 0.762 | 2.779 | 1.545 | |
| Makkink | 1.029 | 2.233 | 1.744 | |
| FAO-56PM | 1.113 | 0.081 | 1.129 | |
| Priestley-Taylor | 1.070 | 1.805 | 1.600 | |
| Turc | 1.794 | 1.835 | 2.701 | |
| 5 | Hargreaves-Samani | 0.131 | 4.585 | 0.438 |
| Jensen-Haise | 0.101 | 6.030 | 1.309 | |
| Makkink | -0.160 | 7.145 | 1.669 | |
| FAO-56PM | 0.742 | 2.282 | 1.139 | |
| Priestley-Taylor | -0.135 | 7.141 | 1.420 | |
| Turc | 0.273 | 5.893 | 2.793 | |
| 6 | Hargreaves-Samani | 0.179 | 3.752 | 0.407 |
| Jensen-Haise | 0.327 | 4.779 | 1.136 | |
| Makkink | 0.409 | 4.957 | 1.575 | |
| FAO-56PM | 1.053 | 0.114 | 1.071 | |
| Priestley-Taylor | 0.284 | 5.205 | 1.281 | |
| Turc | 1.219 | 3.784 | 2.790 | |
| 7 | Hargreaves-Samani | -0.458 | 14.042 | 0.406 |
| Jensen-Haise | 0.011 | 6.546 | 1.122 | |
| Makkink | 0.179 | 5.874 | 1.602 | |
| FAO-56PM | 0.880 | 1.450 | 1.126 | |
| Priestley-Taylor | 0.141 | 5.881 | 1.273 | |
| Turc | 0.775 | 4.902 | 2.988 | |
| 8 | Hargreaves-Samani | 0.044 | 5.731 | 0.431 |
| Jensen-Haise | 0.148 | 5.619 | 1.237 | |
| Makkink | 0.043 | 6.219 | 1.760 | |
| FAO-56PM | 1.347 | -0.717 | 1.212 | |
| Priestley-Taylor | 0.088 | 5.991 | 1.441 | |
| Turc | 0.606 | 5.179 | 3.209 | |
| 9 | Hargreaves-Samani | 0.103 | 4.102 | 0.465 |
| Jensen-Haise | 0.287 | 4.192 | 1.403 | |
| Makkink | 0.161 | 4.768 | 1.728 | |
| FAO-56PM | 0.491 | 3.235 | 1.271 | |
| Priestley-Taylor | 0.124 | 4.836 | 1.547 | |
| Turc | 1.007 | 3.646 | 3.270 | |
| 10 | Hargreaves-Samani | 0.382 | 1.022 | 0.511 |
| Jensen-Haise | 0.831 | 2.201 | 1.796 | |
| Makkink | 1.565 | 0.354 | 1.717 | |
| FAO-56PM | 1.009 | 1.158 | 1.415 | |
| Priestley-Taylor | 1.126 | 1.669 | 1.908 | |
| Turc | 2.459 | 1.132 | 3.419 | |

Fig.3 Linear regression analysis of daily ET0 between calculated (modified) and measured values
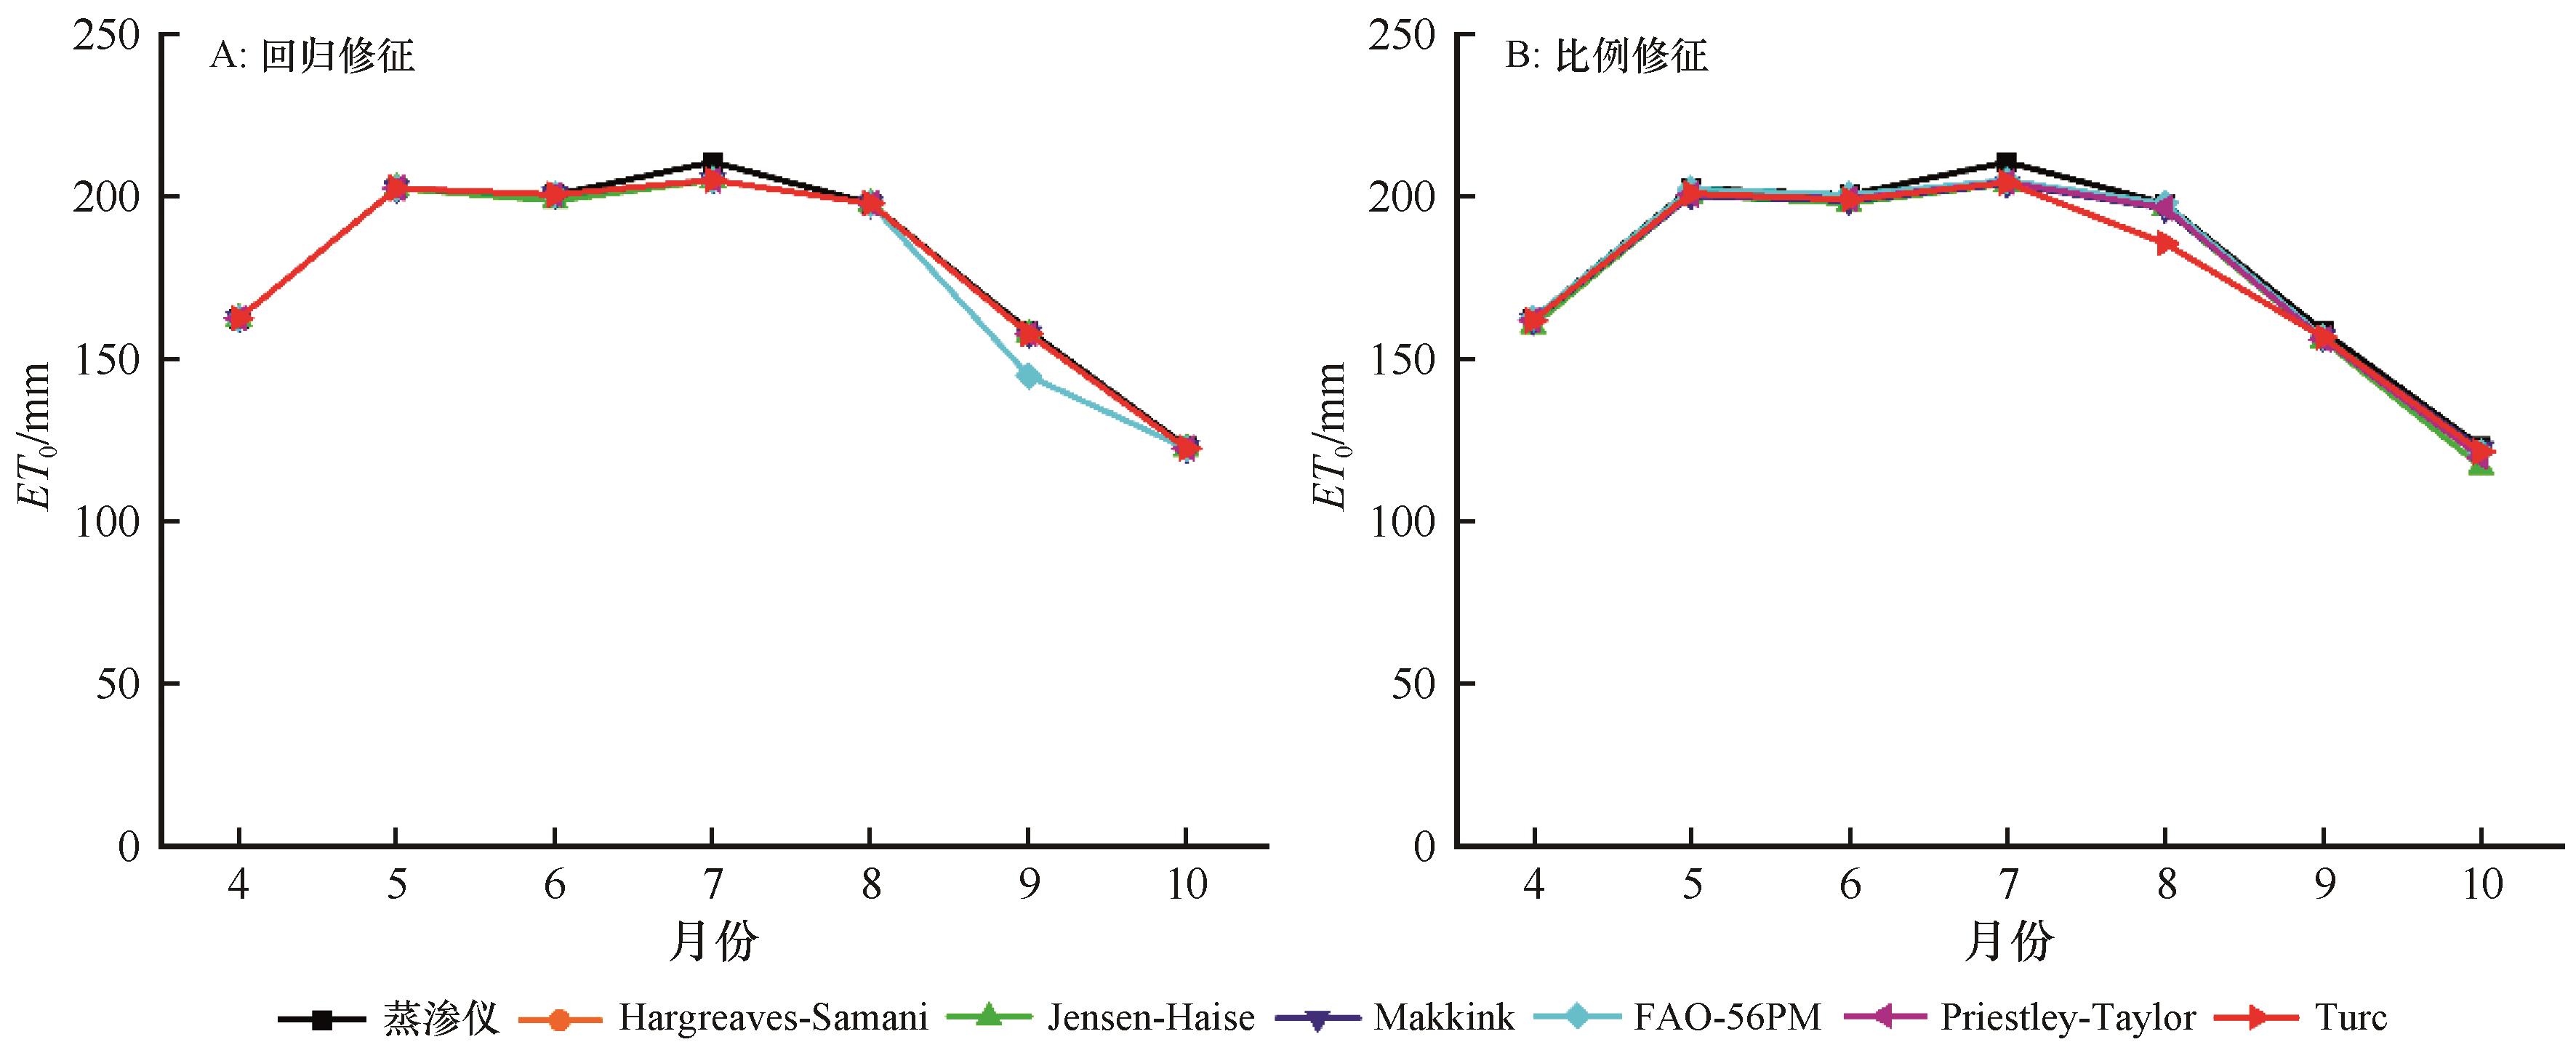
Fig.4 Comparison of estimated monthly ET0 by different modified models
| 月 份 | 模型 | 绝对差值/mm | 相对偏差/% | ||
|---|---|---|---|---|---|
| 回归 修正 | 比例 修正 | 回归 修正 | 比例 修正 | ||
| 4 | Hargreaves-Samani | 0.01 | 1.05 | 0.01% | 0.65% |
| Jensen-Haise | 0.00 | 2.32 | 0.00% | 1.43% | |
| Makkink | 0.00 | 0.77 | 0.00% | 0.47% | |
| FAO-56PM | 0.00 | 0.03 | 0.00% | 0.02% | |
| Priestley-Taylor | 0.00 | 0.64 | 0.00% | 0.40% | |
| Turc | 0.00 | 0.79 | 0.00% | 0.48% | |
| 5 | Hargreaves-Samani | 0.01 | 0.62 | 0.01% | 0.31% |
| Jensen-Haise | 0.00 | 2.18 | 0.00% | 1.08% | |
| Makkink | -0.01 | 2.22 | 0.00% | 1.10% | |
| FAO-56PM | -0.01 | 0.27 | 0.00% | 0.13% | |
| Priestley-Taylor | -0.01 | 1.99 | 0.00% | 0.99% | |
| Turc | 0.00 | 1.54 | 0.00% | 0.76% | |
| 6 | Hargreaves-Samani | 0.01 | 0.50 | 0.01% | 0.25% |
| Jensen-Haise | 1.87 | 2.45 | 0.94% | 1.22% | |
| Makkink | 0.00 | 1.80 | 0.00% | 0.90% | |
| FAO-56PM | -0.01 | 0.02 | 0.00% | 0.01% | |
| Priestley-Taylor | 0.00 | 1.27 | 0.00% | 0.63% | |
| Turc | 0.00 | 1.53 | 0.00% | 0.77% | |
| 7 | Hargreaves-Samani | 5.52 | 6.10 | 2.63% | 2.90% |
| Jensen-Haise | 5.51 | 6.62 | 2.62% | 3.15% | |
| Makkink | 5.52 | 6.60 | 2.62% | 3.14% | |
| FAO-56PM | 5.52 | 5.64 | 2.62% | 2.68% | |
| Priestley-Taylor | 5.51 | 6.26 | 2.62% | 2.97% | |
| Turc | 5.52 | 6.40 | 2.63% | 3.04% | |
| 8 | Hargreaves-Samani | -0.01 | 1.03 | -0.01% | 0.52% |
| Jensen-Haise | -0.01 | 1.51 | 0.00% | 0.77% | |
| Makkink | 0.00 | 1.49 | 0.00% | 0.75% | |
| FAO-56PM | 0.01 | -0.07 | 0.00% | -0.04% | |
| Priestley-Taylor | 0.01 | 1.28 | 0.00% | 0.65% | |
| Turc | 0.00 | 12.16 | 0.00% | 6.15% | |
| 9 | Hargreaves-Samani | 0.99 | 2.15 | 0.62% | 1.35% |
| Jensen-Haise | 1.00 | 2.89 | 0.63% | 1.82% | |
| Makkink | 0.99 | 2.23 | 0.63% | 1.41% | |
| FAO-56PM | 14.02 | 1.94 | 8.85% | 1.22% | |
| Priestley-Taylor | 1.00 | 2.55 | 0.63% | 1.61% | |
| Turc | 0.99 | 2.10 | 0.63% | 1.32% | |
| 10 | Hargreaves-Samani | 0.47 | 1.43 | 0.38% | 1.16% |
| Jensen-Haise | 0.48 | 5.98 | 0.39% | 4.87% | |
| Makkink | 0.48 | 0.69 | 0.39% | 0.56% | |
| FAO-56PM | 0.48 | 1.60 | 0.39% | 1.30% | |
| Priestley-Taylor | 0.48 | 3.20 | 0.39% | 2.61% | |
| Turc | 0.48 | 1.54 | 0.39% | 1.25% | |
| 生 长 季 平 均 | Hargreaves-Samani | 1.00 | 1.84 | 0.52% | 1.02% |
| Jensen-Haise | 1.27 | 3.42 | 0.65% | 2.05% | |
| Makkink | 1.00 | 2.26 | 0.52% | 1.19% | |
| FAO-56PM | 2.86 | 1.35 | 1.69% | 0.76% | |
| Priestley-Taylor | 1.00 | 2.46 | 0.52% | 1.41% | |
| Turc | 1.00 | 3.72 | 0.52% | 1.97% | |
| 生 长 季 合 计 | Hargreaves-Samani | 7.00 | 12.88 | 3.64% | 7.14% |
| Jensen-Haise | 8.86 | 23.95 | 4.57% | 14.33% | |
| Makkink | 6.99 | 15.81 | 3.64% | 8.33% | |
| FAO-56PM | 20.02 | 9.42 | 11.86% | 5.33% | |
| Priestley-Taylor | 6.99 | 17.19 | 3.64% | 9.85% | |
| Turc | 7.00 | 26.06 | 3.65% | 13.78% | |
Table 5 The evaluation of monthly ET0 simulated effects by different modified models
| 月 份 | 模型 | 绝对差值/mm | 相对偏差/% | ||
|---|---|---|---|---|---|
| 回归 修正 | 比例 修正 | 回归 修正 | 比例 修正 | ||
| 4 | Hargreaves-Samani | 0.01 | 1.05 | 0.01% | 0.65% |
| Jensen-Haise | 0.00 | 2.32 | 0.00% | 1.43% | |
| Makkink | 0.00 | 0.77 | 0.00% | 0.47% | |
| FAO-56PM | 0.00 | 0.03 | 0.00% | 0.02% | |
| Priestley-Taylor | 0.00 | 0.64 | 0.00% | 0.40% | |
| Turc | 0.00 | 0.79 | 0.00% | 0.48% | |
| 5 | Hargreaves-Samani | 0.01 | 0.62 | 0.01% | 0.31% |
| Jensen-Haise | 0.00 | 2.18 | 0.00% | 1.08% | |
| Makkink | -0.01 | 2.22 | 0.00% | 1.10% | |
| FAO-56PM | -0.01 | 0.27 | 0.00% | 0.13% | |
| Priestley-Taylor | -0.01 | 1.99 | 0.00% | 0.99% | |
| Turc | 0.00 | 1.54 | 0.00% | 0.76% | |
| 6 | Hargreaves-Samani | 0.01 | 0.50 | 0.01% | 0.25% |
| Jensen-Haise | 1.87 | 2.45 | 0.94% | 1.22% | |
| Makkink | 0.00 | 1.80 | 0.00% | 0.90% | |
| FAO-56PM | -0.01 | 0.02 | 0.00% | 0.01% | |
| Priestley-Taylor | 0.00 | 1.27 | 0.00% | 0.63% | |
| Turc | 0.00 | 1.53 | 0.00% | 0.77% | |
| 7 | Hargreaves-Samani | 5.52 | 6.10 | 2.63% | 2.90% |
| Jensen-Haise | 5.51 | 6.62 | 2.62% | 3.15% | |
| Makkink | 5.52 | 6.60 | 2.62% | 3.14% | |
| FAO-56PM | 5.52 | 5.64 | 2.62% | 2.68% | |
| Priestley-Taylor | 5.51 | 6.26 | 2.62% | 2.97% | |
| Turc | 5.52 | 6.40 | 2.63% | 3.04% | |
| 8 | Hargreaves-Samani | -0.01 | 1.03 | -0.01% | 0.52% |
| Jensen-Haise | -0.01 | 1.51 | 0.00% | 0.77% | |
| Makkink | 0.00 | 1.49 | 0.00% | 0.75% | |
| FAO-56PM | 0.01 | -0.07 | 0.00% | -0.04% | |
| Priestley-Taylor | 0.01 | 1.28 | 0.00% | 0.65% | |
| Turc | 0.00 | 12.16 | 0.00% | 6.15% | |
| 9 | Hargreaves-Samani | 0.99 | 2.15 | 0.62% | 1.35% |
| Jensen-Haise | 1.00 | 2.89 | 0.63% | 1.82% | |
| Makkink | 0.99 | 2.23 | 0.63% | 1.41% | |
| FAO-56PM | 14.02 | 1.94 | 8.85% | 1.22% | |
| Priestley-Taylor | 1.00 | 2.55 | 0.63% | 1.61% | |
| Turc | 0.99 | 2.10 | 0.63% | 1.32% | |
| 10 | Hargreaves-Samani | 0.47 | 1.43 | 0.38% | 1.16% |
| Jensen-Haise | 0.48 | 5.98 | 0.39% | 4.87% | |
| Makkink | 0.48 | 0.69 | 0.39% | 0.56% | |
| FAO-56PM | 0.48 | 1.60 | 0.39% | 1.30% | |
| Priestley-Taylor | 0.48 | 3.20 | 0.39% | 2.61% | |
| Turc | 0.48 | 1.54 | 0.39% | 1.25% | |
| 生 长 季 平 均 | Hargreaves-Samani | 1.00 | 1.84 | 0.52% | 1.02% |
| Jensen-Haise | 1.27 | 3.42 | 0.65% | 2.05% | |
| Makkink | 1.00 | 2.26 | 0.52% | 1.19% | |
| FAO-56PM | 2.86 | 1.35 | 1.69% | 0.76% | |
| Priestley-Taylor | 1.00 | 2.46 | 0.52% | 1.41% | |
| Turc | 1.00 | 3.72 | 0.52% | 1.97% | |
| 生 长 季 合 计 | Hargreaves-Samani | 7.00 | 12.88 | 3.64% | 7.14% |
| Jensen-Haise | 8.86 | 23.95 | 4.57% | 14.33% | |
| Makkink | 6.99 | 15.81 | 3.64% | 8.33% | |
| FAO-56PM | 20.02 | 9.42 | 11.86% | 5.33% | |
| Priestley-Taylor | 6.99 | 17.19 | 3.64% | 9.85% | |
| Turc | 7.00 | 26.06 | 3.65% | 13.78% | |
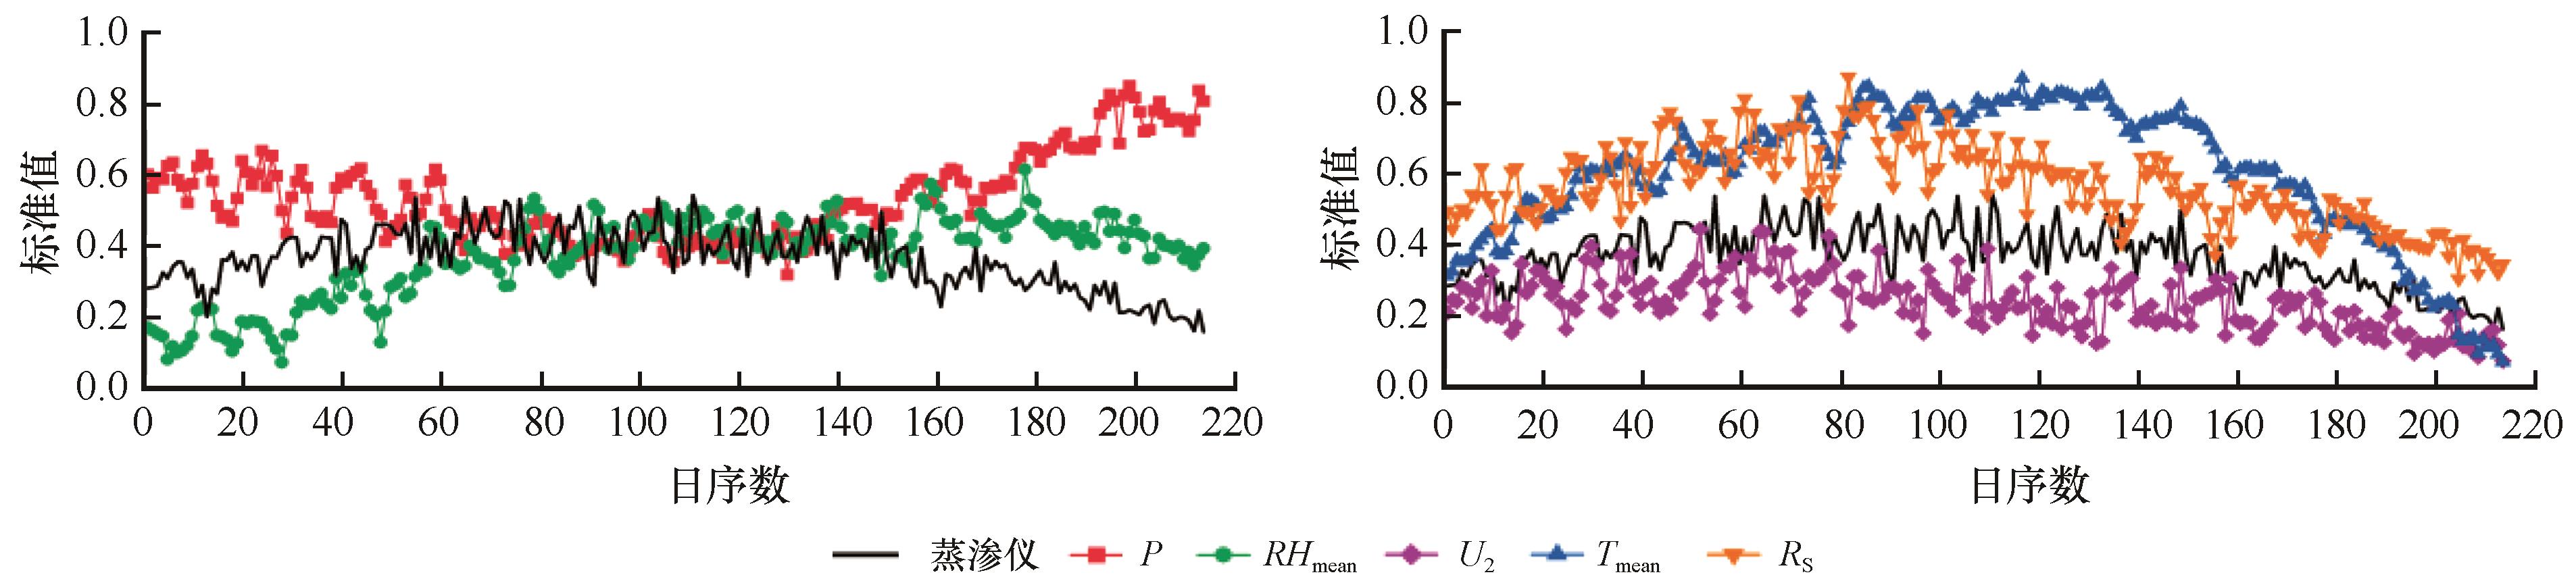
Fig.5 Changes of evaporation in each meteorological factor and evaporating dish with underlying surface in the growing season
| 蒸渗仪 | P | ||||||||
|---|---|---|---|---|---|---|---|---|---|
| 蒸渗仪 | Pearson 相关 | 1 | 0.610** | 0.778** | 0.735** | 0.762** | -0.747** | -0.081 | 0.643** |
| Sig.双尾 | 0.000 | 0.000 | 0.000 | 0.000 | 0.000 | 0.236 | 0.000 | ||
Table 6 Correlation coefficient of lysimeter measured ET0 with meteorologic variables (data points=214)
| 蒸渗仪 | P | ||||||||
|---|---|---|---|---|---|---|---|---|---|
| 蒸渗仪 | Pearson 相关 | 1 | 0.610** | 0.778** | 0.735** | 0.762** | -0.747** | -0.081 | 0.643** |
| Sig.双尾 | 0.000 | 0.000 | 0.000 | 0.000 | 0.000 | 0.236 | 0.000 | ||
| 1 | 李新荣,赵洋,回嵘,等. 中国干旱区恢复生态学研究进展及趋势评述[J].地理科学进展,2014,33(11):1435-1443. |
| 2 | 张飞,塔西甫拉提·特依拜,丁建丽,等.干旱区绿洲土地利用/覆被及景观格局变化特征:以新疆精河县为例[J].生态学报,2009,29(3):1251-1263. |
| 3 | Cheng W,Zhou C,Liu H,et al.The oasis expansion and eco-environment change over the last 50 years in Manas River Valley,Xinjiang[J].Science in China,2006,49(2):163-175. |
| 4 | 瓦哈甫·哈力克,塔西甫拉提·特依拜,海米提·依米提.干旱区绿洲农业结构与水资源合理利用研究:以新疆策勒绿洲为例 [J].云南农业大学学报,2004(6):737-742. |
| 5 | Xue X,Liao J,Hsing Y,et al.Policies,land use,and water resource management in an arid oasis ecosystem[J].Environmental Management,2015,55(5):1036. |
| 6 | Yu Y,Disse M,Yu R,et al.Large-scale hydrological modeling and decision-making for agricultural water consumption and allocation in the main stem Tarim River,China[J].Water,2015,7(6):2821-2839. |
| 7 | 李宝富,陈亚宁,李卫红,等.基于遥感和SEBAL模型的塔里木河干流区蒸散发估算[J].地理学报,2011,66(9):1230-1238. |
| 8 | Liu Y,Shen M,Zhao J,et al.A new optimization method for the layout of pumping wells in oases:application in the Qira Oasis,Northwest China[J].Water,2019,11(5):970. |
| 9 | 赵文智,吉喜斌,刘鹄.蒸散发观测研究进展及绿洲蒸散研究展望[J].干旱区研究,2011,28(3):463-470. |
| 10 | Mu Q,Zhao M,Running S W.Improvements to a MODIS global terrestrial evapotranspiration algorithm [J].Remote Sensing of Environment,2011,115(8):1781-1800. |
| 11 | 严坤,王玉宽,徐佩,等.岷江源区Hargreaves法适用性与未来参考作物蒸散量预测[J].农业机械学报,2018,49(4):273-281. |
| 12 | Allen R G,Pereira L S,Raes D,et al.Crop evapotranspiration-Guidelines for computing crop water requirements-FAO Irrigation and drainage paper 56[J].Fao,Rome,1998,300(9):D05109. |
| 13 | Xiang K,Li Y,Horton R,et al.Similarity and difference of potential evapotranspiration and reference crop evapotranspiration-a review[J].Agricultural Water Management,2020,232:106043. |
| 14 | Yagob D,Deepak J,Ahmad F,et al.Trends in reference crop evapotranspiration over Iran[J].Journal of Hydrology,2011,399(3/4):422-433. |
| 15 | 段春锋,缪启龙,曹雯,等.西北地区小型蒸发皿资料估算参考作物蒸散[J].农业工程学报,2012,28(4):94-99. |
| 16 | 左德鹏,徐宗学,刘兆飞.基于气温的潜在蒸散发量估算方法在我国西北干旱地区的应用比较[J].干旱区资源与环境,2009,23(10):123-131. |
| 17 | 刘昌明,张丹.中国地表潜在蒸散发敏感性的时空变化特征分析[J].地理学报,2011,66(5):579-588. |
| 18 | Tabari H.Evaluation of reference crop evapotranspiration equations in various climates[J].Water Resources Management,2010,24(10):2311-2337. |
| 19 | Yoder R E,Odhiambo L O,Wright W C.Evaluation of methods for estimating daily reference crop evapotranspiration at a site in the humid southeast United States[J].Applied Engineering in Agriculture,2005,21(2):197-202. |
| 20 | Pandey P K,Dabral P P,Pandey V.Evaluation of reference evapotranspiration methods for the northeastern region of India[J].International Soil and Water Conservation Research,2016,4(1):52-63. |
| 21 | Trajkovic S,Kolakovic S.Evaluation of reference evapotranspiration equations under humid conditions[J].Water Resources Management,2009,23(14):3057-3067. |
| 22 | 刘松林,康银红.多种ET0计算方法在四川省湿润气候区适用性的评价研究[J].灌溉排水学报,2018,37():111-117,127. |
| 23 | 徐俊增,彭世彰,丁加丽,等.基于蒸渗仪实测数据的日参考作物蒸发腾发量计算方法评价[J].水利学报,2010,41(12):1497-1505. |
| 24 | 丁加丽,彭世彰,徐俊增,等.基于温度资料的参考作物蒸发蒸腾量计算方法[J].河海大学学报:自然科学版,2007(6):633-637. |
| 25 | 王永东,邱永志,许波,等.参考作物蒸散量计算方法在极端干旱区的适用性[J].干旱区研究,2014,31(3):390-396. |
| 26 | 马亮,魏光辉.新疆塔里木盆地西缘参考作物蒸散发模型的适用性评价[J].干旱区资源与环境,2015,29(8):132-137. |
| 27 | 樊湘鹏,许燕,周建平.参照作物蒸散量计算模型在新疆干旱地区适用性研究[J].江苏农业科学,2019,47(20):273-280. |
| 28 | 袁小环,杨学军,陈超,等.基于蒸渗仪实测的参考作物蒸散发模型北京地区适用性评价[J].农业工程学报,2014,30(13):104-110. |
| 29 | Xu J,Peng S,Ding J,et al.Evaluation and calibration of simple methods for daily reference evapotranspiration estimation in humid East China[J].Archives of Agronomy & Soil Science,2013,59(6):845-858. |
| 30 | Hargreaves G H.Defining and using reference evapotranspiration[J].Journal of Irrigation & Drainage Engineering,1994,120(6):1132-1139. |
| 31 | 庞营军,雷加强,曾凡江,等.新疆维吾尔自治区策勒县绿洲-沙漠过渡带小气候特征[J].水土保持通报,2011,31(5):240-245. |
| 32 | 刘毅.塔里木盆地南缘绿洲灌区地表水与地下水联合利用研究[D].乌鲁木齐:新疆大学,2019. |
| 33 | 毛东雷,蔡富艳,方登先,等.新疆策勒绿洲-沙漠过渡带风沙运动沙尘物质粒径分形特征[J].土壤学报,2018,55(1):88-99. |
| 34 | 杜加强,熊珊珊,刘成程,等.黄河上游地区几种参考作物蒸散量计算方法的适用性比较[J].干旱区地理,2013,36(5):831-840. |
| 35 | Sheikh V,Mohammadi M.Evaluation of reference evapotranspiration equations in semi-arid regions of northeast of Iran[J].International Journal of Agriculture and Crop Sciences,2013,5(5):450. |
| 36 | 胡顺军,潘渝,康绍忠,等.Penman-Monteith与Penman修正式计算塔里木盆地参考作物潜在腾发量比较[J].农业工程学报,2005,21(6):30-35. |
| 37 | 刘战东,刘祖贵,秦安振,等.黄淮海地区基于温度的ET0计算方法比较及修正[J].节水灌溉,2014(4):1-6,10. |
| 38 | 范留飞,皮原月,于洋,等.基于辐射和温度的ET0模型在吐鲁番地区的比较与修正[J].干旱地区农业研究,2020,38(2):267-75. |
| 39 | 高云飞.黑河上游天老池流域亚高山草地蒸散发研究[D].兰州:兰州大学,2016. |
| 40 | 张昊,郝春雷,董喆,等.燕山北部丘陵温热区ET0估算方法比较及修正[J].节水灌溉,2018(8):81-84,89. |
| [1] | Li Xia, Liu Tingxi, Duan Limin, Wang Guanli, Tong Xin, Zhou Yajun, Yang Xiaojun. Simulation of reference crop evapotranspiration and analysis of the factor effect in Horqin wet meadow [J]. Journal of Desert Research, 2020, 40(2): 134-143. |
| [2] | Qi Xiaofan, Li Wenpeng, Li Haitao. Prediction and Trend of Future Potential Evapotranspiration in the Heihe River Basin Based on CMIP5 Models [J]. Journal of Desert Research, 2018, 38(4): 849-857. |
| [3] | HE Lei1, BIE Qiang1, WANG Yao2, ZHAO Chuan-yan2. Simulating Evapotranspiration Based on SEBS Model and Sensitivity Analysis of the Parameters in the Middle Reaches of Heihe River Basin [J]. JOURNAL OF DESERT RESEARCH, 2013, 33(6): 1866-1873. |
| [4] | WANG Yong-dong1, LI Sheng-yu1, XU Xin-wen, LEI Jia-qiang1, JIN Xiao-jun1, 2, 3, WANG Qiang3, DI Kun3, ZHANG Zhong-liang3. Applicability of the Hargraeves Method in Estimating Reference Evapotranspiration in the Taklamakan Desert Hinterland [J]. JOURNAL OF DESERT RESEARCH, 2013, 33(2): 367-373. |
| [5] | WANG Zhi-qiang;Chaolunbagen;CHAI Jian-hua. Simulation and Prediction of Reference Crop Evapotranspiration with Grey Multi-variable Model [J]. JOURNAL OF DESERT RESEARCH, 2007, 27(4): 584-588. |
| Viewed | ||||||
|
Full text |
|
|||||
|
Abstract |
|
|||||
©2018Journal of Desert Research
Tel:0931-8267545
Email:caiedit@lzb.ac.cn;desert@lzb.ac.cn
Support:Magtech