
- CN 62-1070/P
- ISSN 1000-694X
- Bimonthly 1981
Journal of Desert Research ›› 2024, Vol. 44 ›› Issue (4): 57-70.DOI: 10.7522/j.issn.1000-694X.2024.00025
Previous Articles Next Articles
Huaqing Yang1( ), Rui Zhu1, Zhenliang Yin2,3(), Jian'an Shan1, Wei Zhang1, Chunshuang Fang1
Received:2023-10-31
Revised:2024-03-01
Online:2024-07-20
Published:2024-08-29
Contact:
Zhenliang Yin
CLC Number:
Huaqing Yang, Rui Zhu, Zhenliang Yin, Jian'an Shan, Wei Zhang, Chunshuang Fang. Dynamic changes of vegetation in water conservation area of the Yellow River Basin and its response to climate change and human activities during 2001-2020[J]. Journal of Desert Research, 2024, 44(4): 57-70.
Add to citation manager EndNote|Ris|BibTeX
URL: http://www.desert.ac.cn/EN/10.7522/j.issn.1000-694X.2024.00025
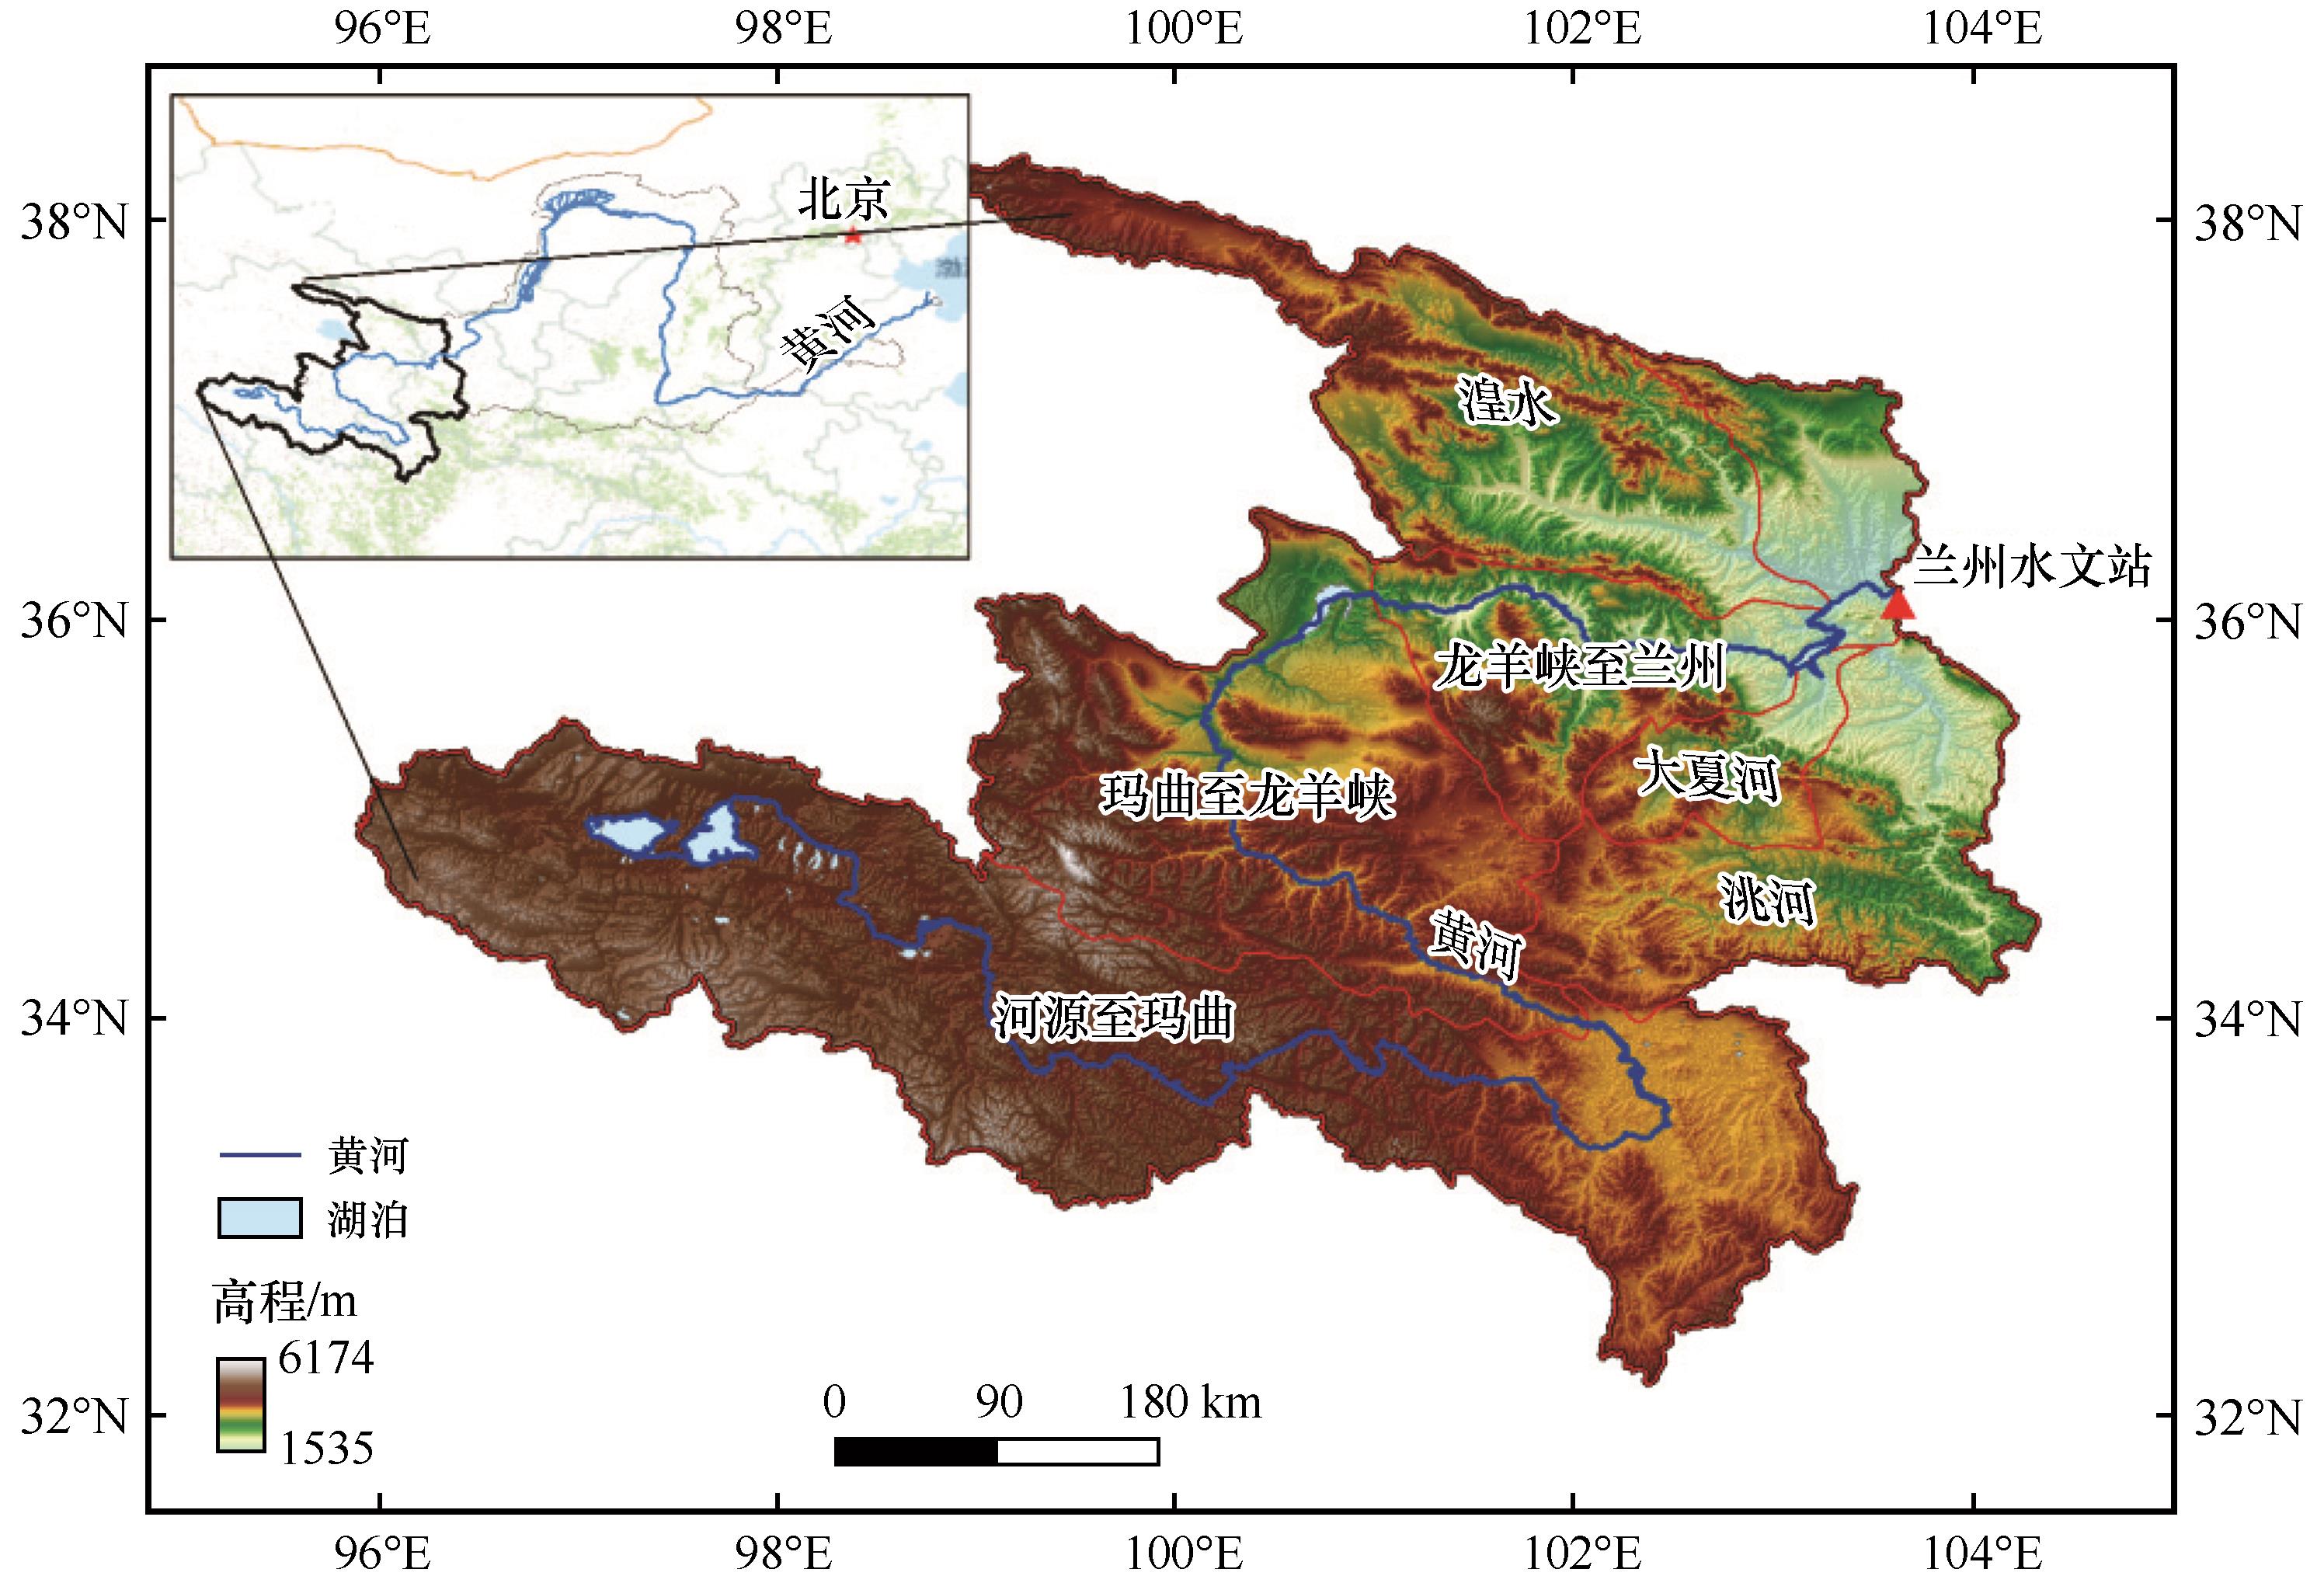
Fig.1 Overview of the study area
| 数据 | 单位 | 数据来源 |
|---|---|---|
| NDVI | / | NASA(https://ladweb.modaps.eosdis.nasa.gov) |
| 降水量 | mm | 国家气象信息中心(https://data.cma.cn/) |
| 气温 | ℃ | |
| 日照时数 | h | |
| 相对湿度 | % | |
| 高程 | m | 中国科学院地理空间数据云(http://www.gscloud.cn/) |
| 坡度 | ° | |
| 坡向 | ° | |
| 土地利用类型 | / | 中国科学院资源环境科学数据中心(http://www.resdc.cn/) |
| 放牧强度 | 头·km-2 | 统计年鉴 |
Table 1 Data information and sources
| 数据 | 单位 | 数据来源 |
|---|---|---|
| NDVI | / | NASA(https://ladweb.modaps.eosdis.nasa.gov) |
| 降水量 | mm | 国家气象信息中心(https://data.cma.cn/) |
| 气温 | ℃ | |
| 日照时数 | h | |
| 相对湿度 | % | |
| 高程 | m | 中国科学院地理空间数据云(http://www.gscloud.cn/) |
| 坡度 | ° | |
| 坡向 | ° | |
| 土地利用类型 | / | 中国科学院资源环境科学数据中心(http://www.resdc.cn/) |
| 放牧强度 | 头·km-2 | 统计年鉴 |
| Slope 趋势 | 变化趋势 类型 | Hurst 指数 | 变化趋势的 持续性 |
|---|---|---|---|
| <-0.006 | 明显退化 | >0.5 | 持续性明显退化 |
| -0.006~-0.0006 | 轻微退化 | >0.5 | 持续性轻微退化 |
| -0.0006~0.0006 | 基本不变 | >0.5 | 持续性不变 |
| 0.0006~0.006 | 轻微改善 | >0.5 | 持续性轻微改善 |
| >0.006 | 明显改善 | >0.5 | 持续性明显改善 |
| <0.5 | 未来变化趋势不确定 |
Table 2 The type of changing trend and the definition of the persistence of changing trend
| Slope 趋势 | 变化趋势 类型 | Hurst 指数 | 变化趋势的 持续性 |
|---|---|---|---|
| <-0.006 | 明显退化 | >0.5 | 持续性明显退化 |
| -0.006~-0.0006 | 轻微退化 | >0.5 | 持续性轻微退化 |
| -0.0006~0.0006 | 基本不变 | >0.5 | 持续性不变 |
| 0.0006~0.006 | 轻微改善 | >0.5 | 持续性轻微改善 |
| >0.006 | 明显改善 | >0.5 | 持续性明显改善 |
| <0.5 | 未来变化趋势不确定 |
| 判断依据 | 作用关系 |
|---|---|
| 非线性减弱 | |
| 单因子非线性减弱 | |
| 双因子增强 | |
| 独立 | |
| 非线性增强 |
Table 3 The relationship of factor interaction
| 判断依据 | 作用关系 |
|---|---|
| 非线性减弱 | |
| 单因子非线性减弱 | |
| 双因子增强 | |
| 独立 | |
| 非线性增强 |
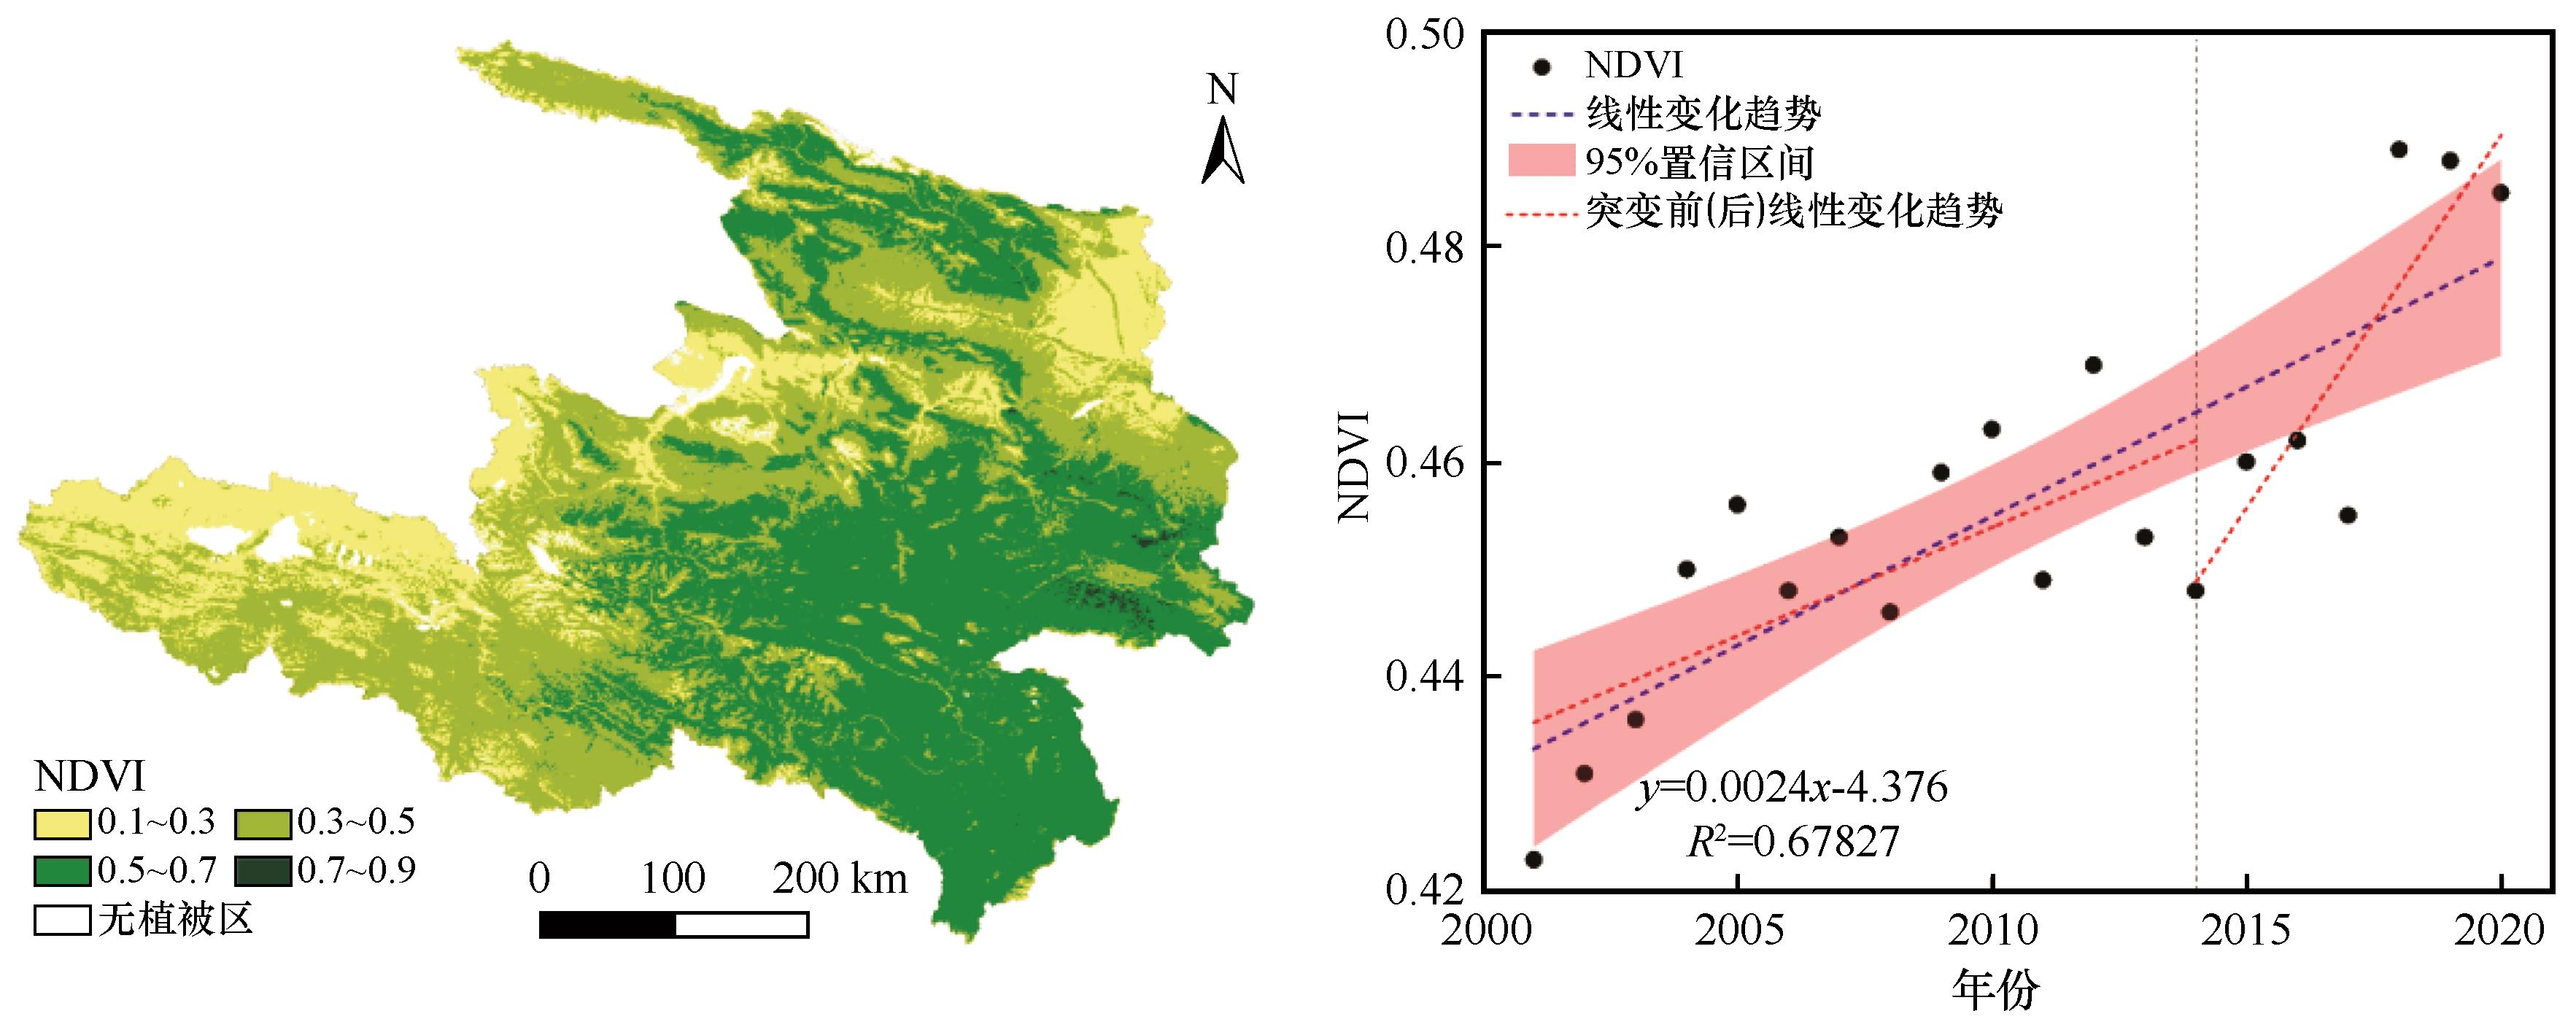
Fig.2 Spatial distribution of average NDVI and its interannual change trend from 2001 to 2020
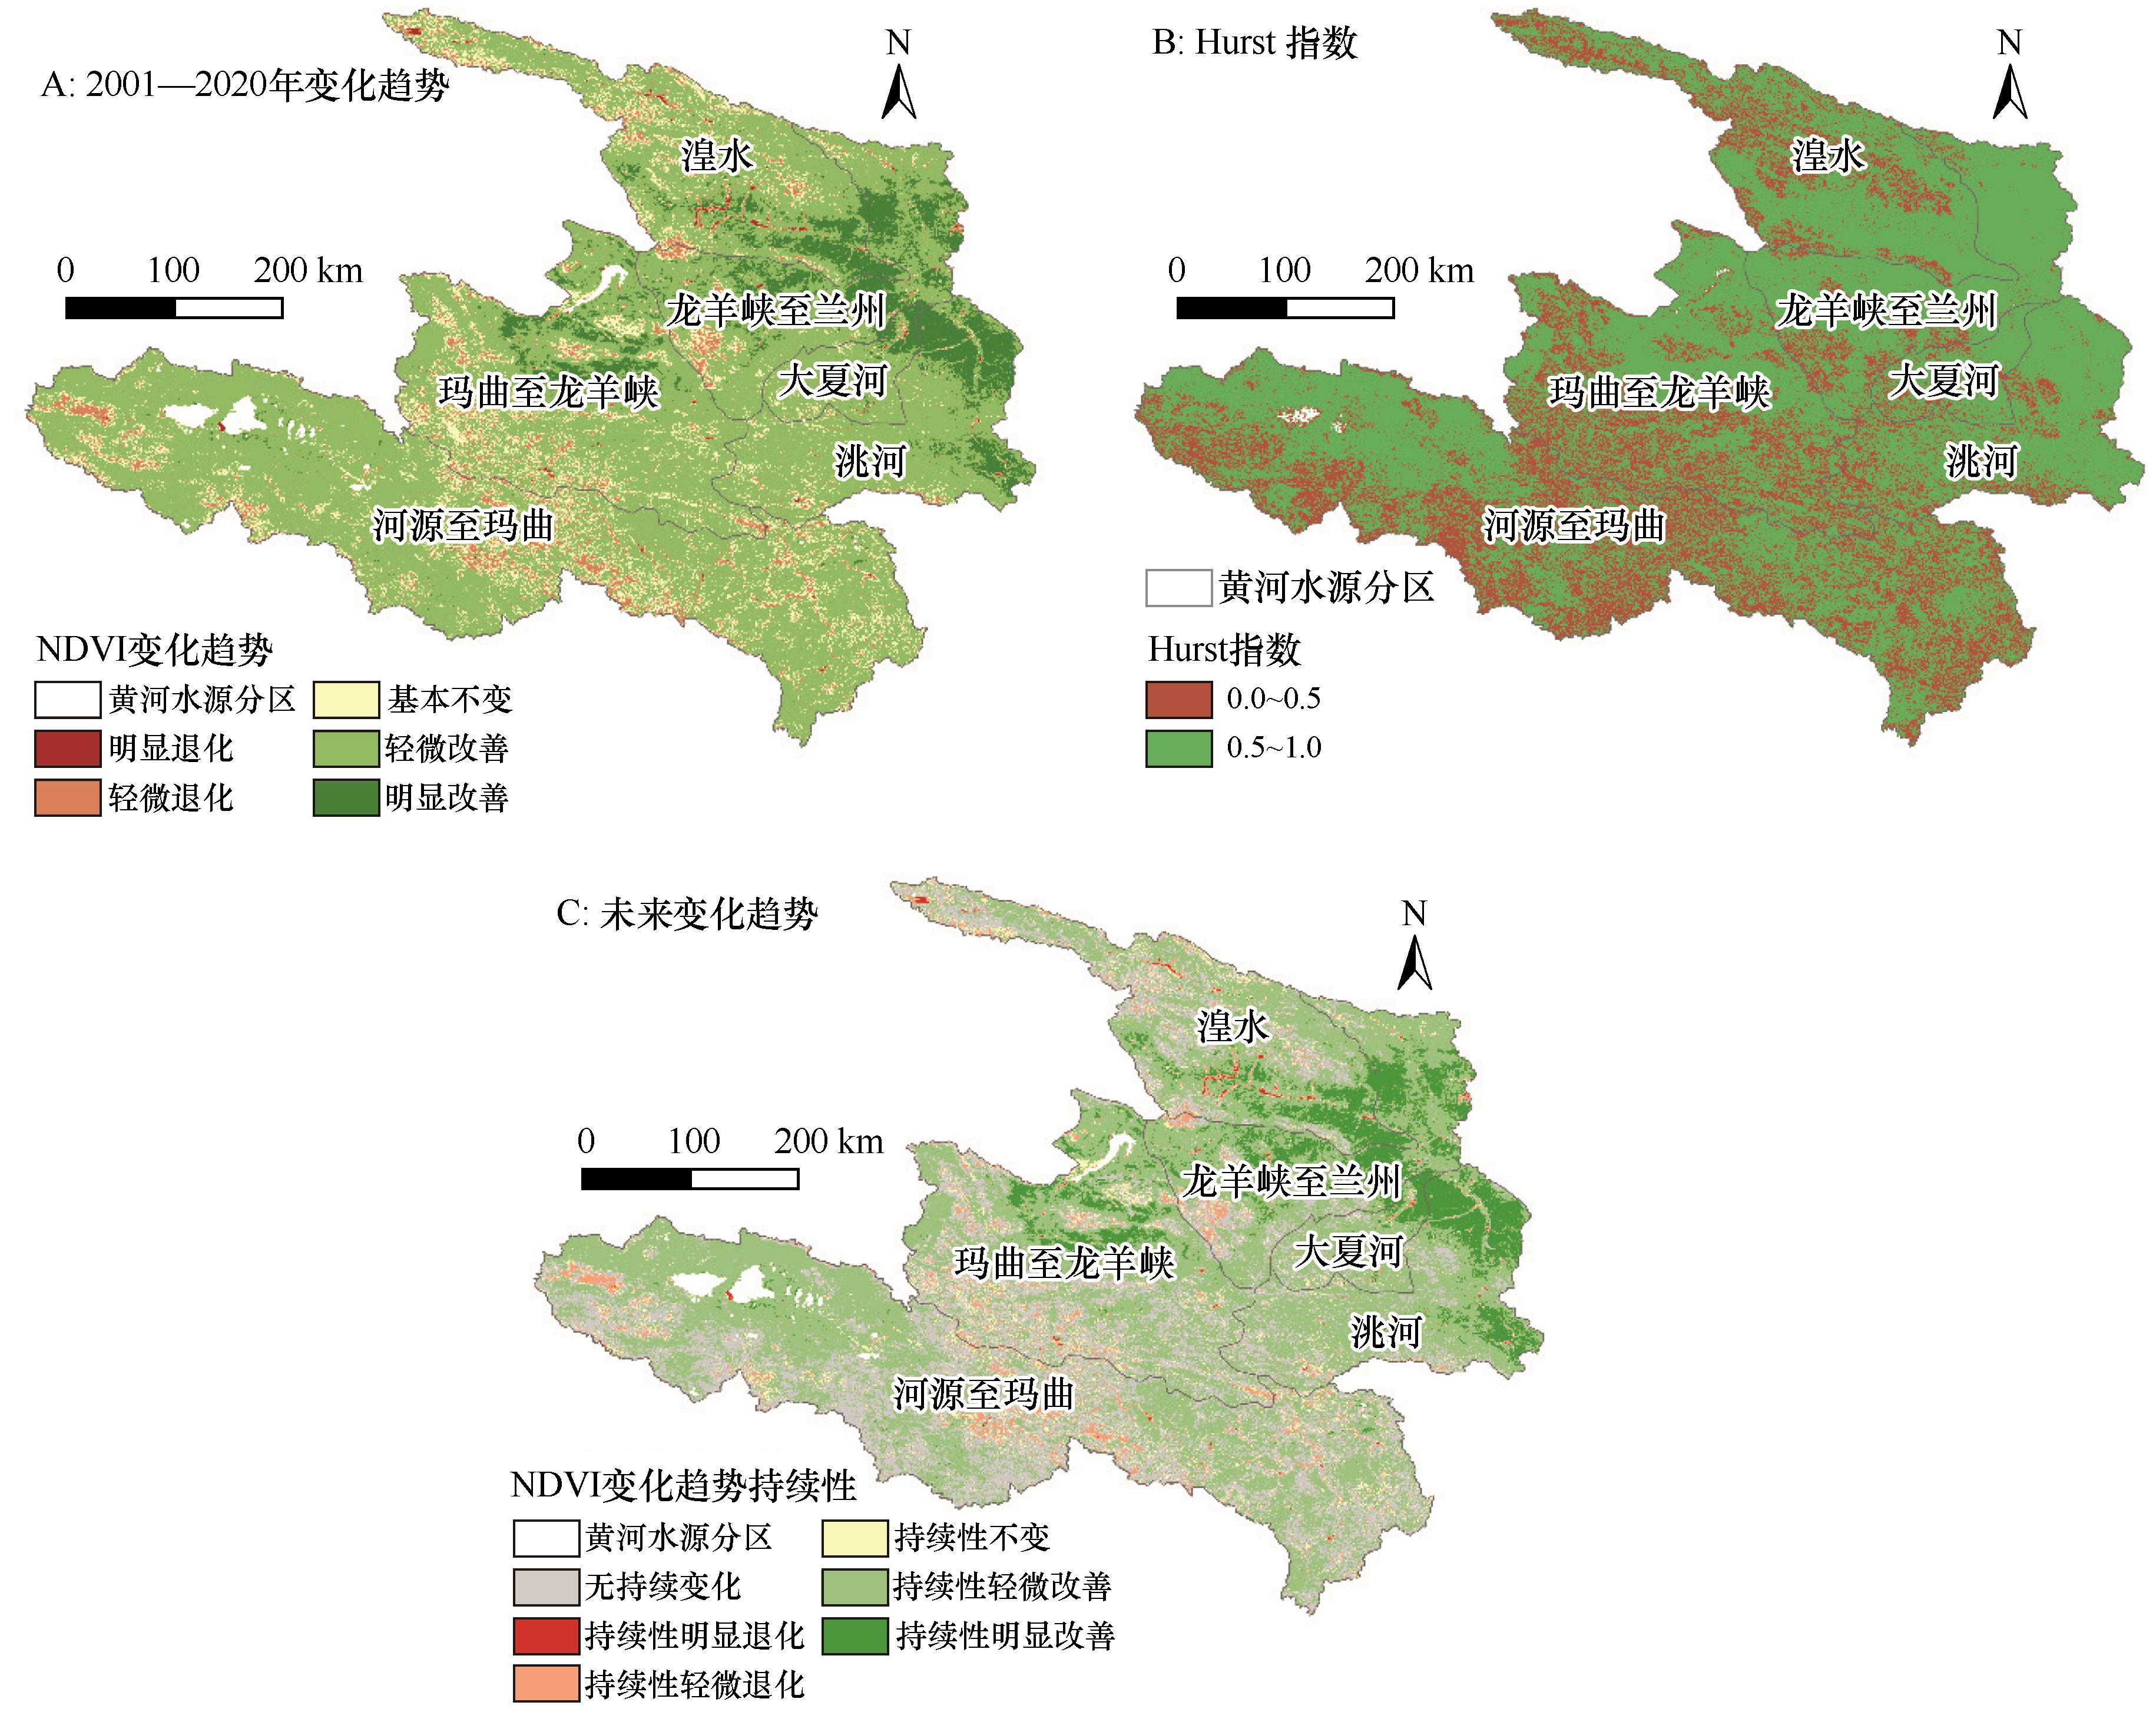
Fig.3 Spatial variation trend of NDVI and Hurst index distribution
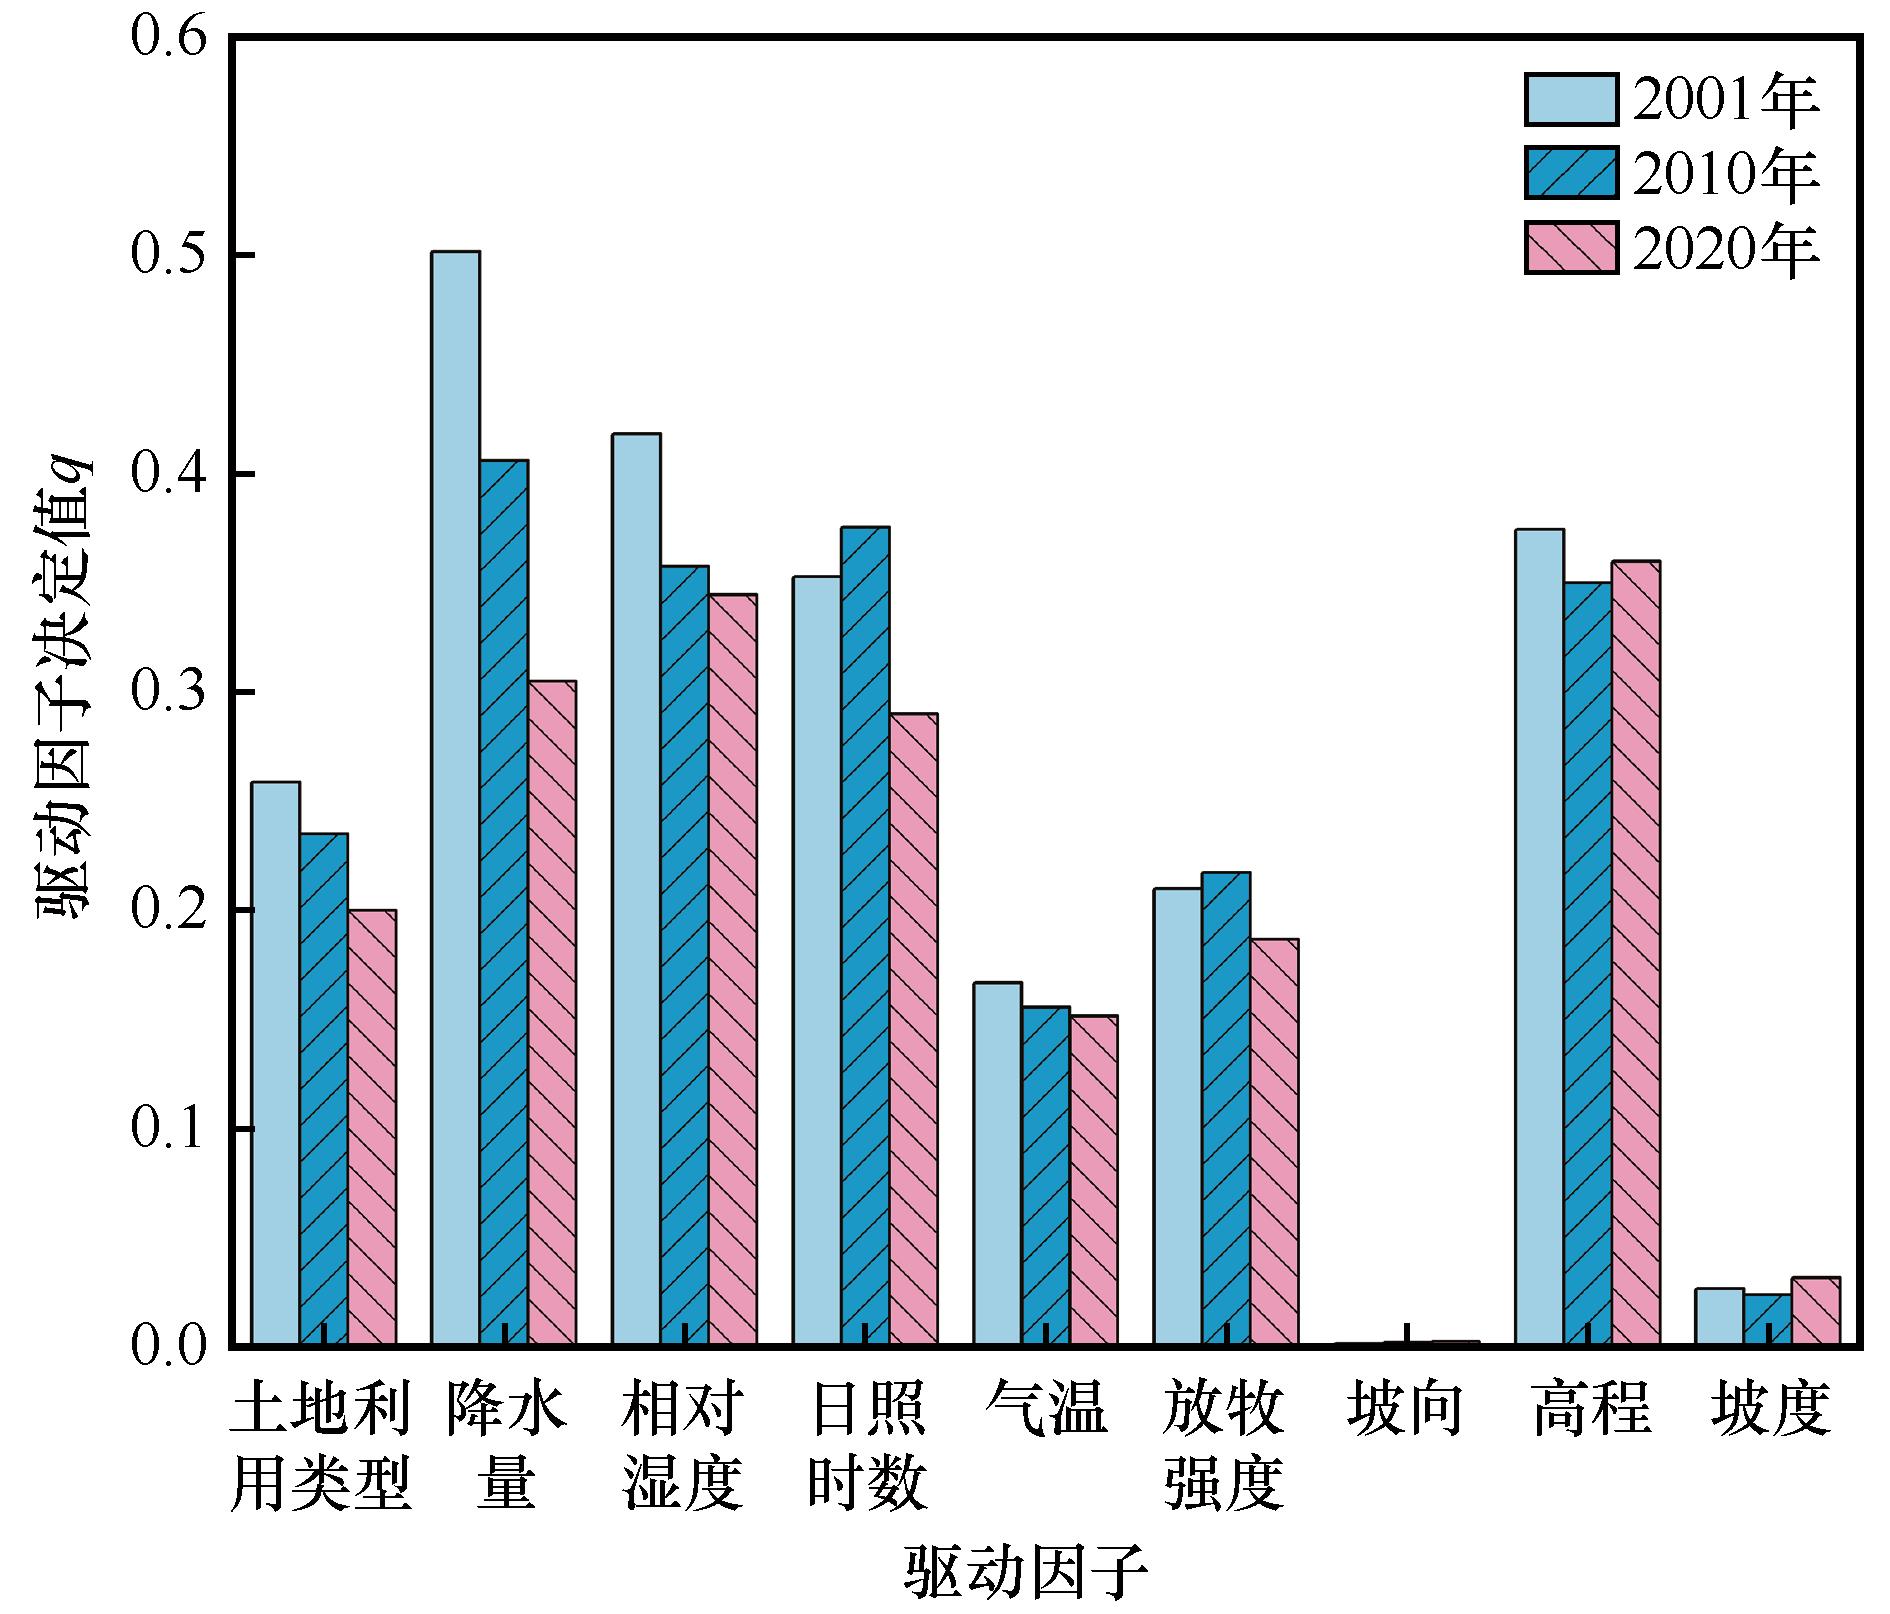
Fig.4 Results of factor detection in 2001, 2010 and 2020
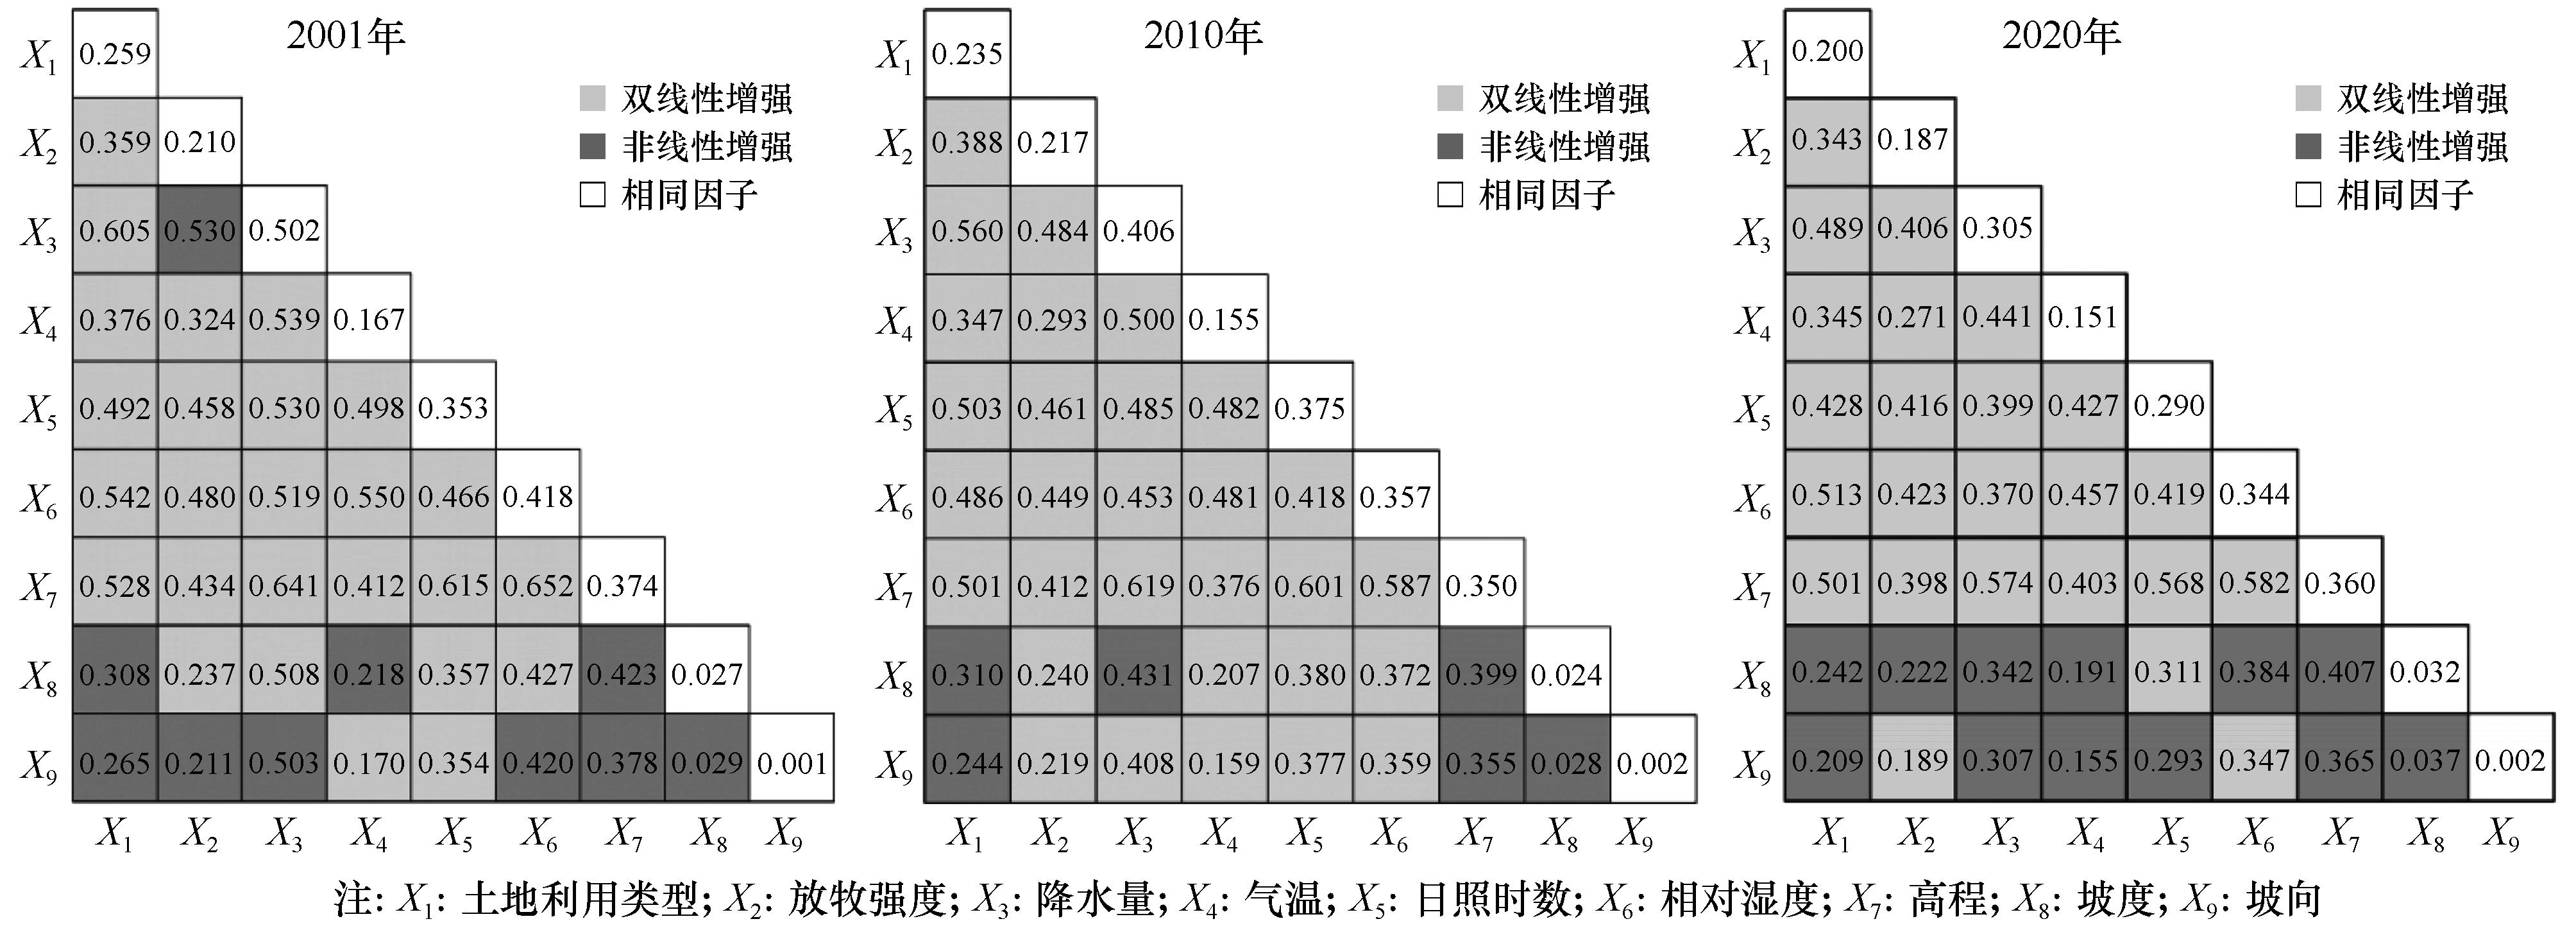
Fig.5 Explanatory power and interaction types of influence factors in interactive detection
| 因子 | NDVI适宜类型或范围 | NDVI均值 |
|---|---|---|
| 土地利用类型 | 林地 | 0.570 |
| 放牧强度/(头·km-2) | 189.7~286.9 | 0.559 |
| 坡向/(°) | 319.6~359.5 | 0.472 |
| 高程/m | 3 278~4 024 | 0.569 |
| 坡度/(°) | 17.1~26.4 | 0.497 |
| 降水量/mm | 745.6~823.4 | 0.642 |
| 相对湿度/% | 70.8~75.6 | 0.630 |
| 日照时数/h | 5.6~6.2 | 0.626 |
| 气温/℃ | 7.5~10.6 | 0.536 |
Table 4 Adaptive limits for each factor (confidence level 95%)
| 因子 | NDVI适宜类型或范围 | NDVI均值 |
|---|---|---|
| 土地利用类型 | 林地 | 0.570 |
| 放牧强度/(头·km-2) | 189.7~286.9 | 0.559 |
| 坡向/(°) | 319.6~359.5 | 0.472 |
| 高程/m | 3 278~4 024 | 0.569 |
| 坡度/(°) | 17.1~26.4 | 0.497 |
| 降水量/mm | 745.6~823.4 | 0.642 |
| 相对湿度/% | 70.8~75.6 | 0.630 |
| 日照时数/h | 5.6~6.2 | 0.626 |
| 气温/℃ | 7.5~10.6 | 0.536 |
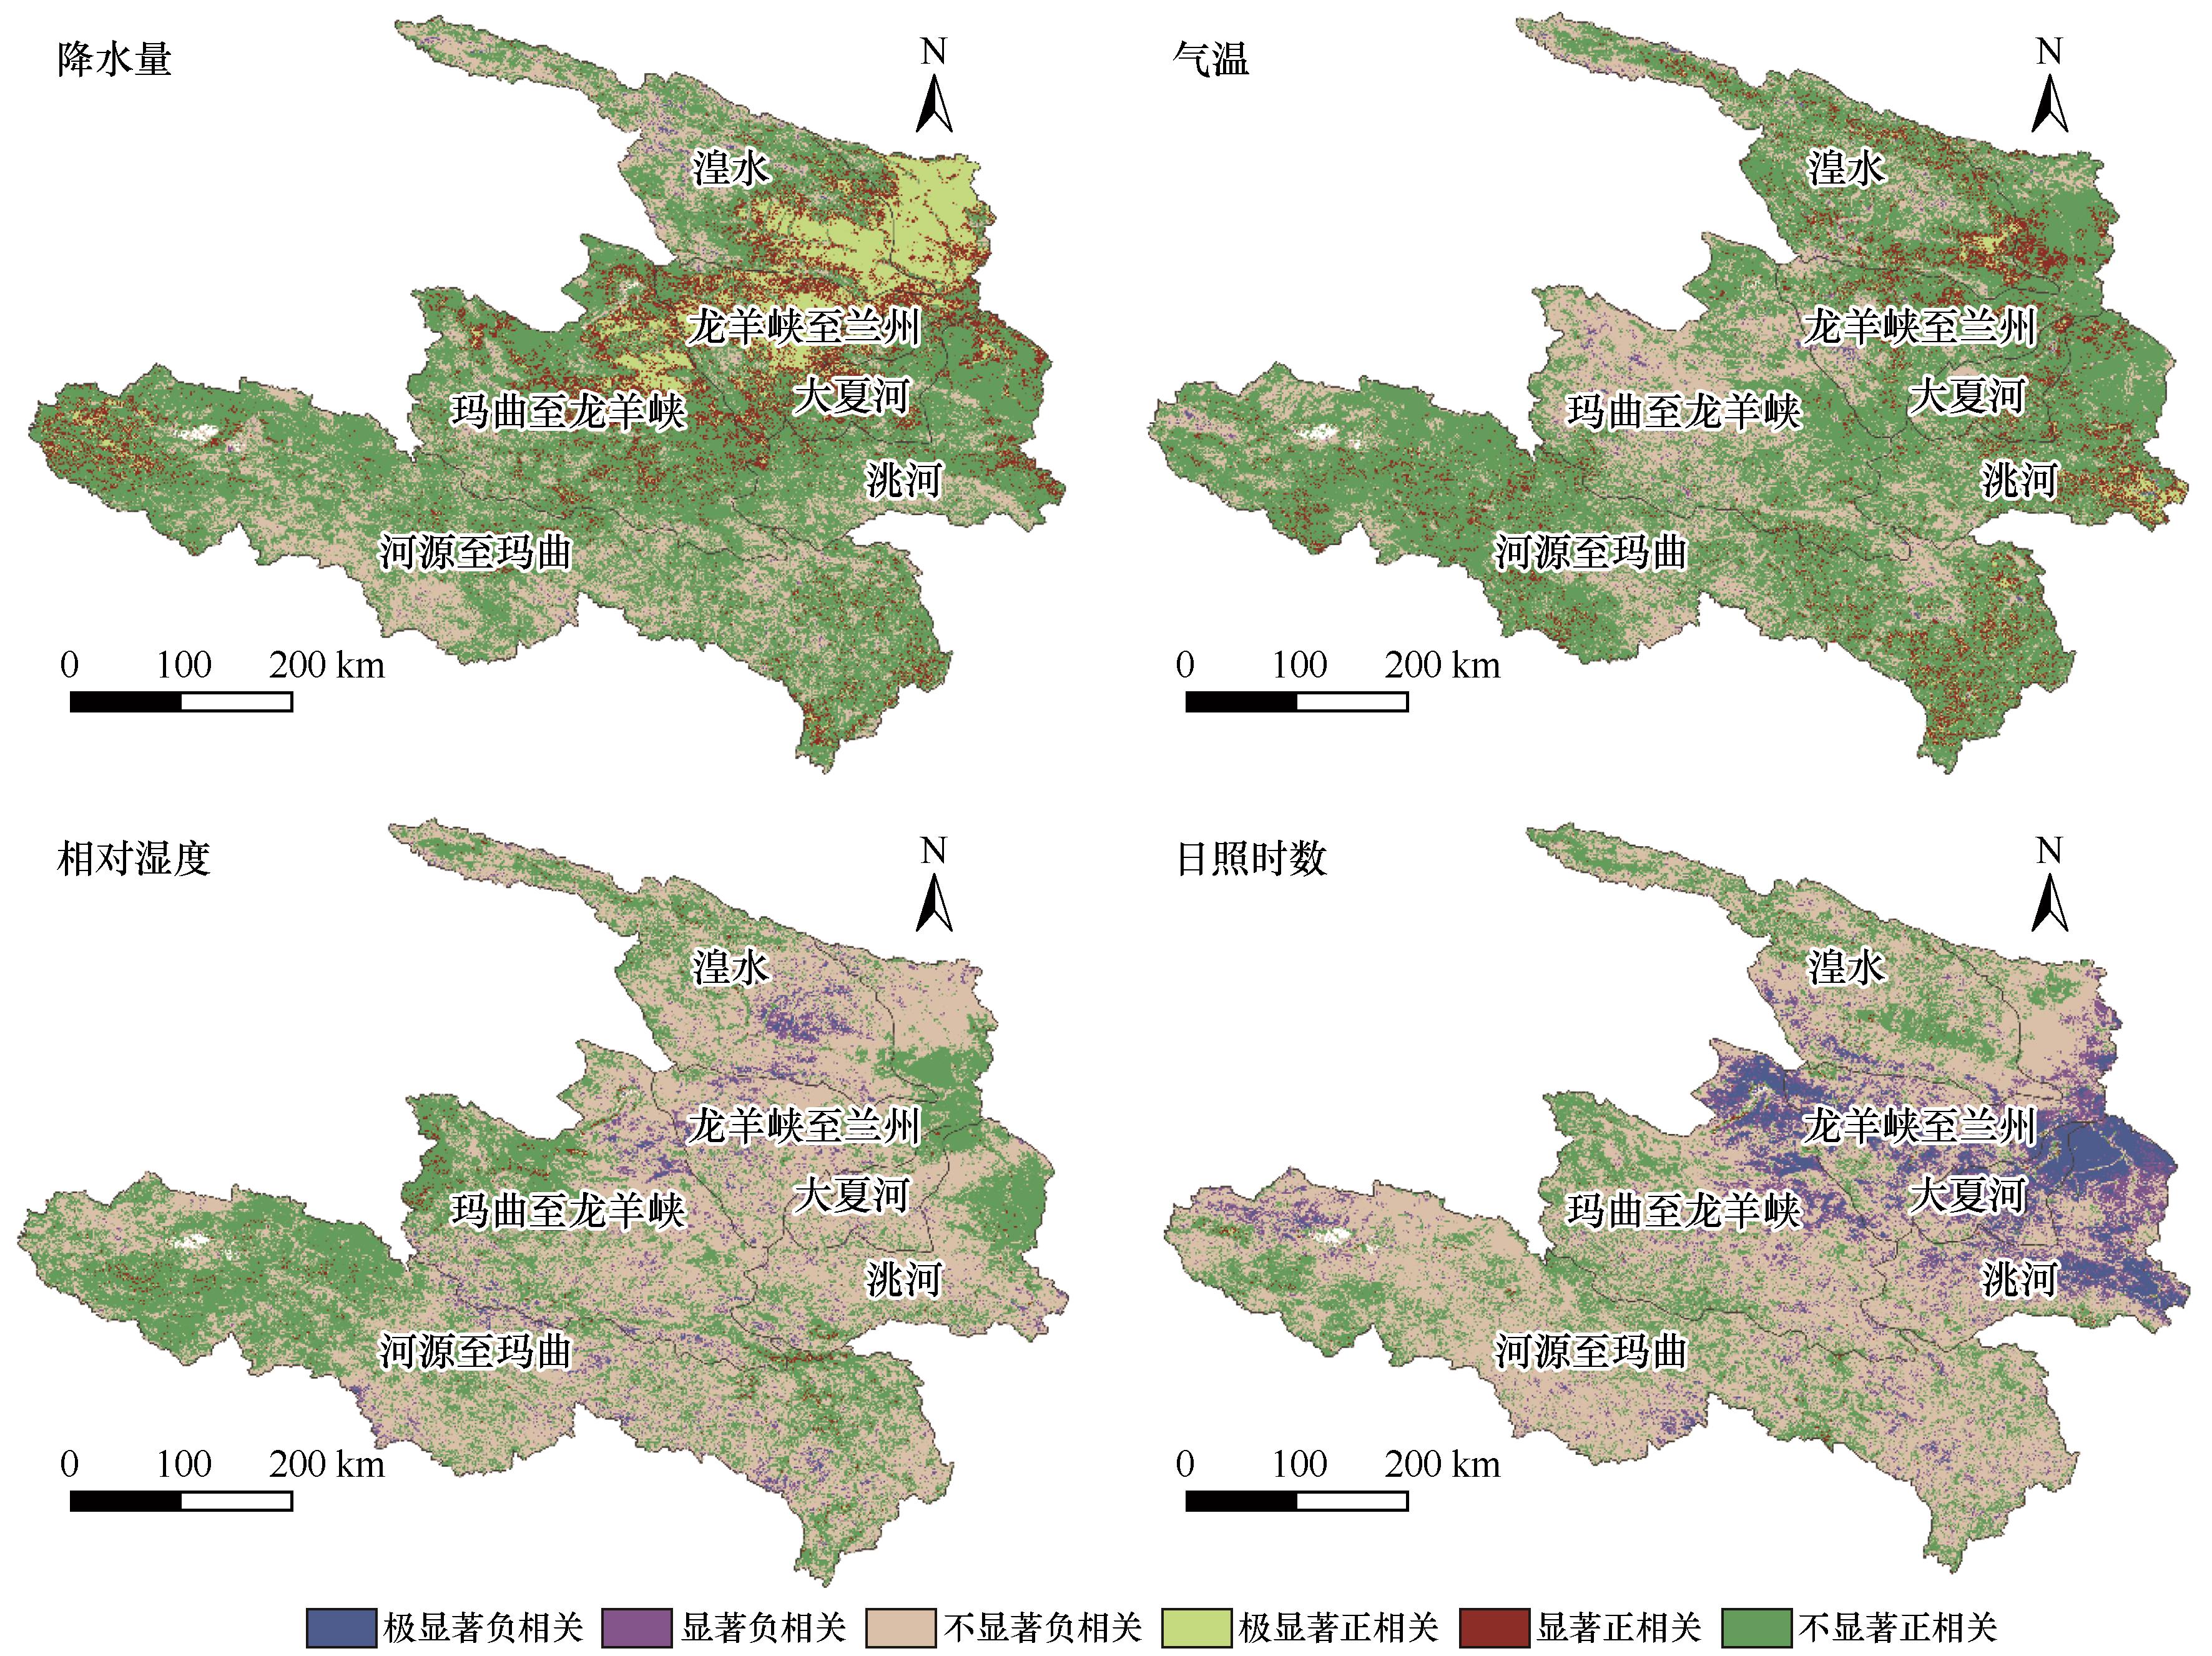
Fig.6 The significance of partial correlation of climate factors
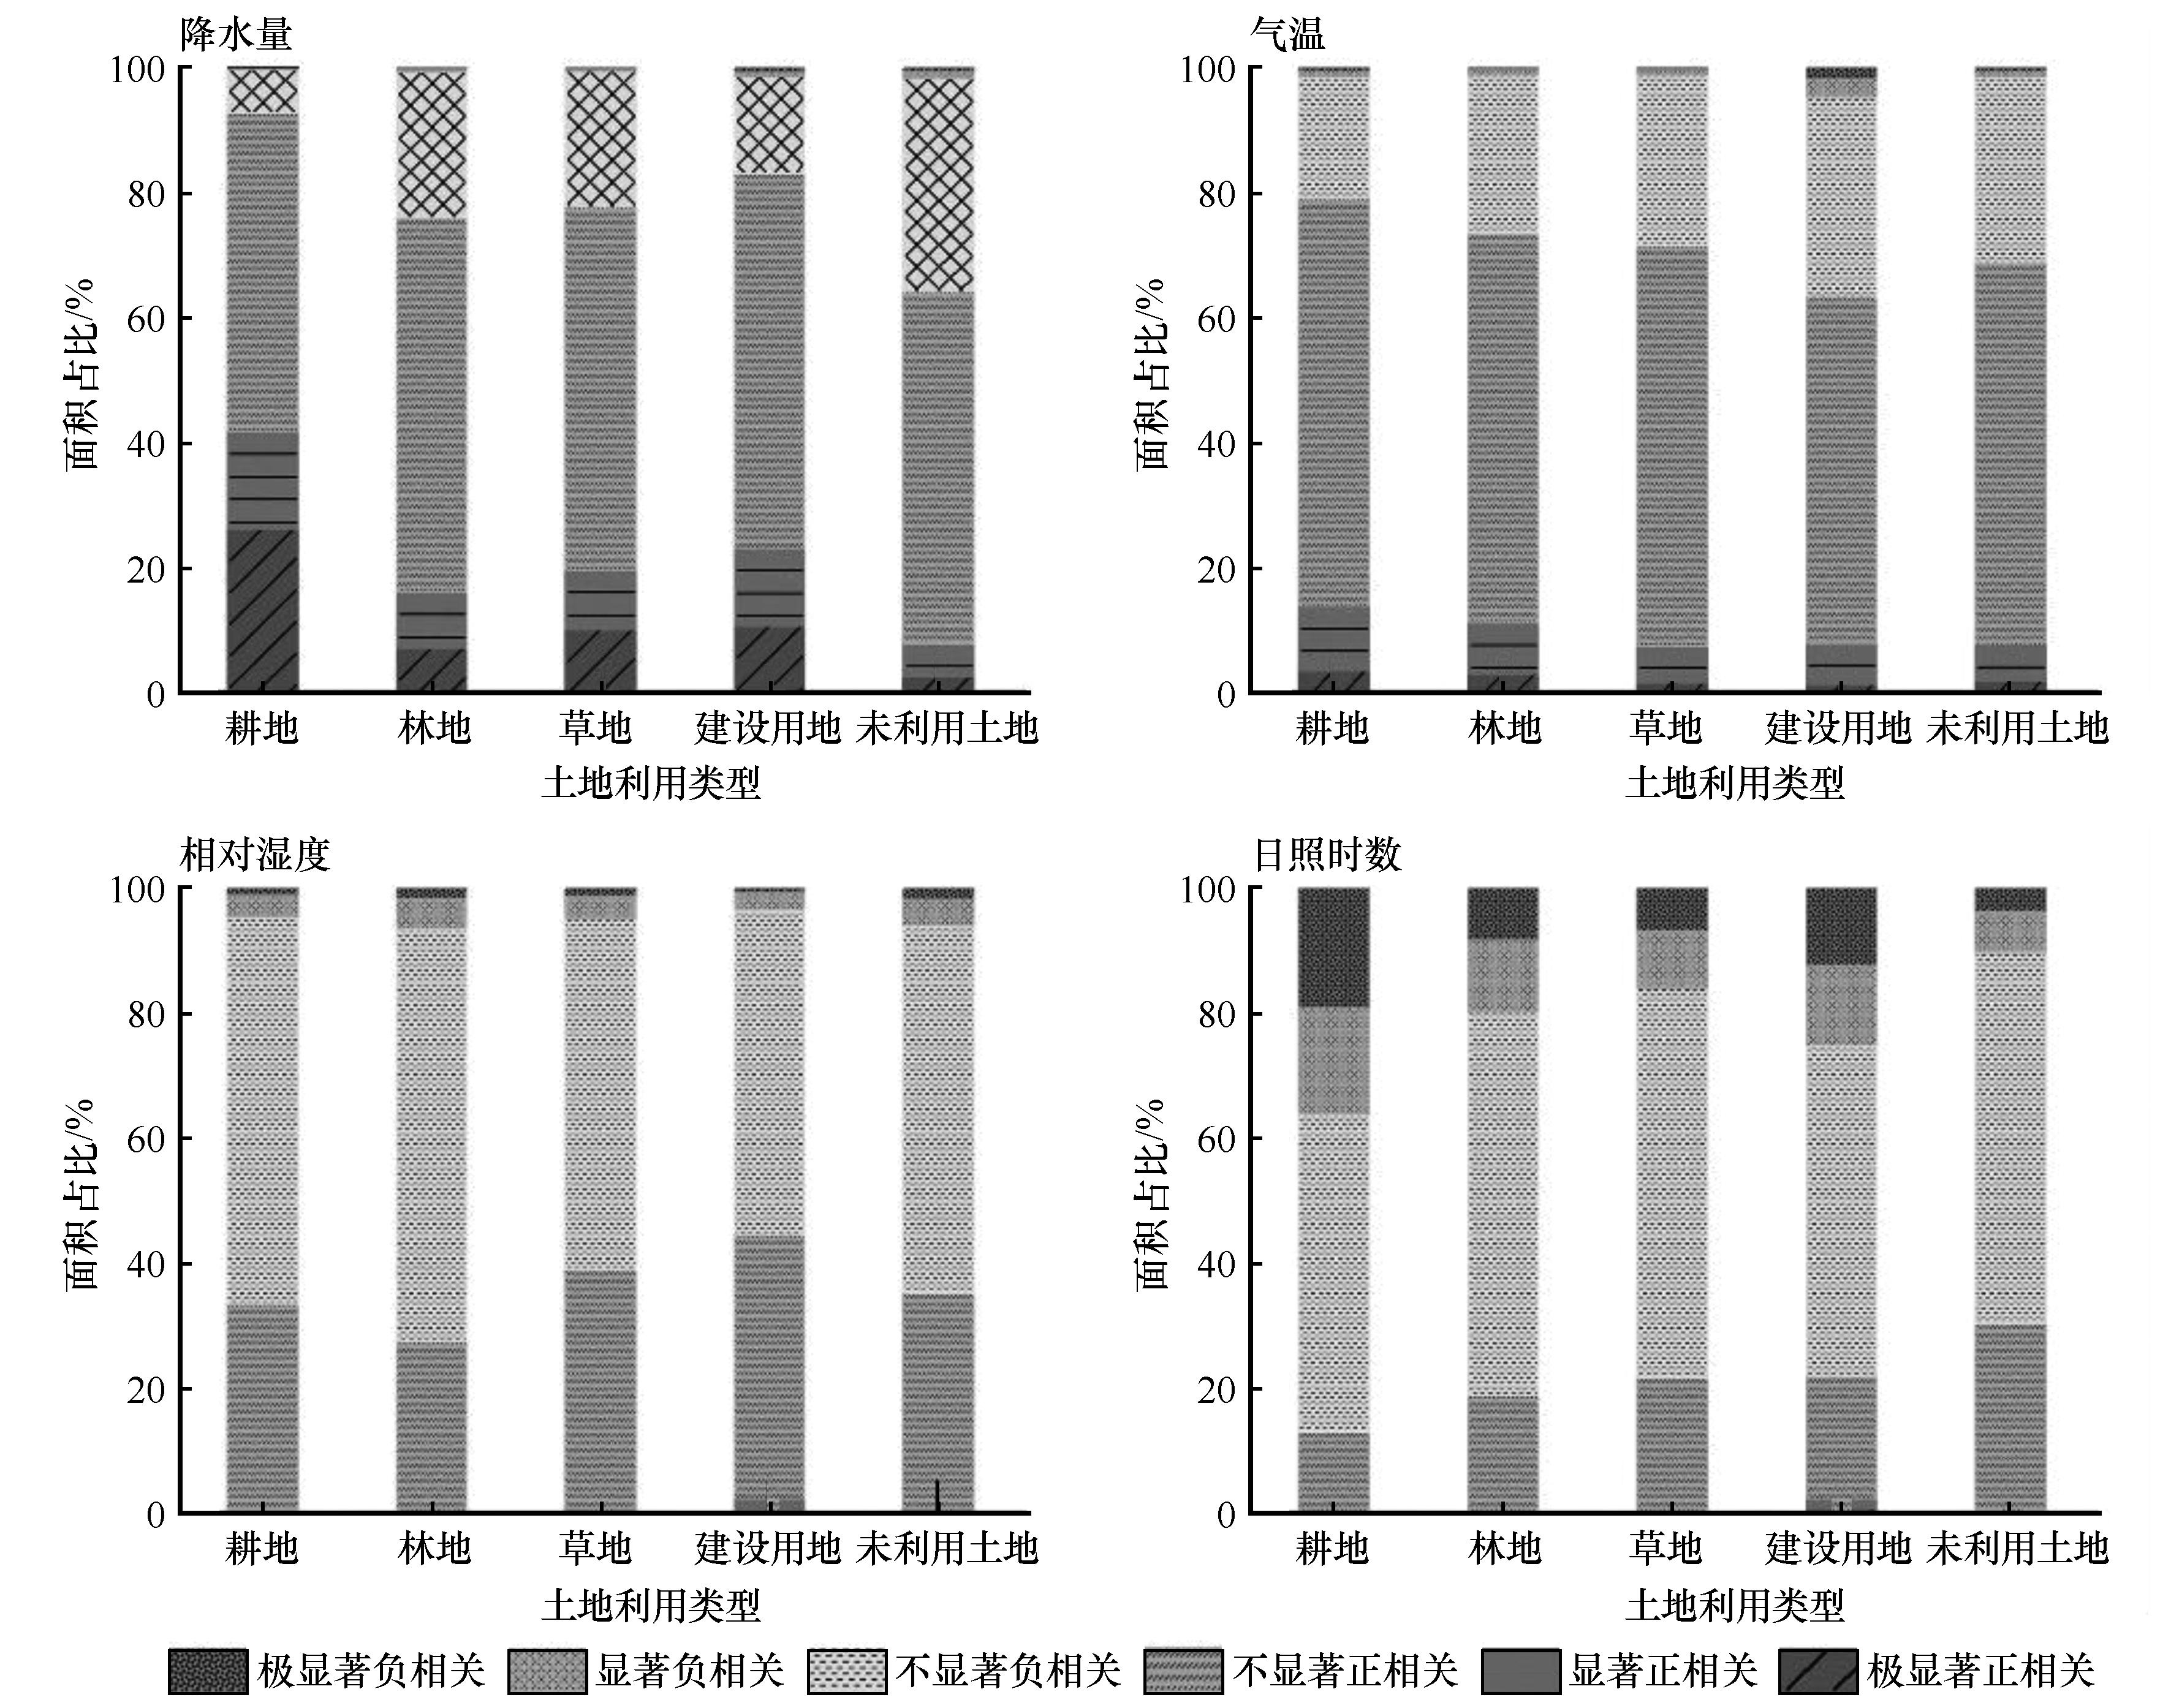
Fig.7 Proportion of area related to NDVI by different land use types
| 2001年 | 2020年 | ||||||
|---|---|---|---|---|---|---|---|
| 耕地 | 林地 | 草地 | 水域 | 建设用地 | 未利用土地 | 总计 | |
| 耕地 | 12 587.70 | 178.33 | 1 154.78 | 86.10 | 469.78 | 25.93 | 14 502.62 |
| 林地 | 84.90 | 24 846.70 | 1 884.22 | 51.55 | 23.62 | 49.57 | 26 940.56 |
| 草地 | 1 194.13 | 2 254.83 | 143 290.00 | 353.06 | 328.55 | 3 536.30 | 150 956.87 |
| 水域 | 44.63 | 25.34 | 138.77 | 3 649.32 | 14.07 | 42.77 | 3 914.90 |
| 建设用地 | 128.76 | 7.72 | 39.00 | 5.66 | 973.81 | 0.51 | 1 155.45 |
| 未利用土地 | 14.37 | 78.78 | 10 100.80 | 271.83 | 24.56 | 15 464.00 | 25 954.35 |
| 总计 | 14 054.49 | 27 391.71 | 156 607.57 | 4 417.52 | 1 834.38 | 19 119.08 | 223 424.75 |
Table 5 Land use transfer matrix of water conservation area in the Yellow River Basin from 2001 to 2020
| 2001年 | 2020年 | ||||||
|---|---|---|---|---|---|---|---|
| 耕地 | 林地 | 草地 | 水域 | 建设用地 | 未利用土地 | 总计 | |
| 耕地 | 12 587.70 | 178.33 | 1 154.78 | 86.10 | 469.78 | 25.93 | 14 502.62 |
| 林地 | 84.90 | 24 846.70 | 1 884.22 | 51.55 | 23.62 | 49.57 | 26 940.56 |
| 草地 | 1 194.13 | 2 254.83 | 143 290.00 | 353.06 | 328.55 | 3 536.30 | 150 956.87 |
| 水域 | 44.63 | 25.34 | 138.77 | 3 649.32 | 14.07 | 42.77 | 3 914.90 |
| 建设用地 | 128.76 | 7.72 | 39.00 | 5.66 | 973.81 | 0.51 | 1 155.45 |
| 未利用土地 | 14.37 | 78.78 | 10 100.80 | 271.83 | 24.56 | 15 464.00 | 25 954.35 |
| 总计 | 14 054.49 | 27 391.71 | 156 607.57 | 4 417.52 | 1 834.38 | 19 119.08 | 223 424.75 |
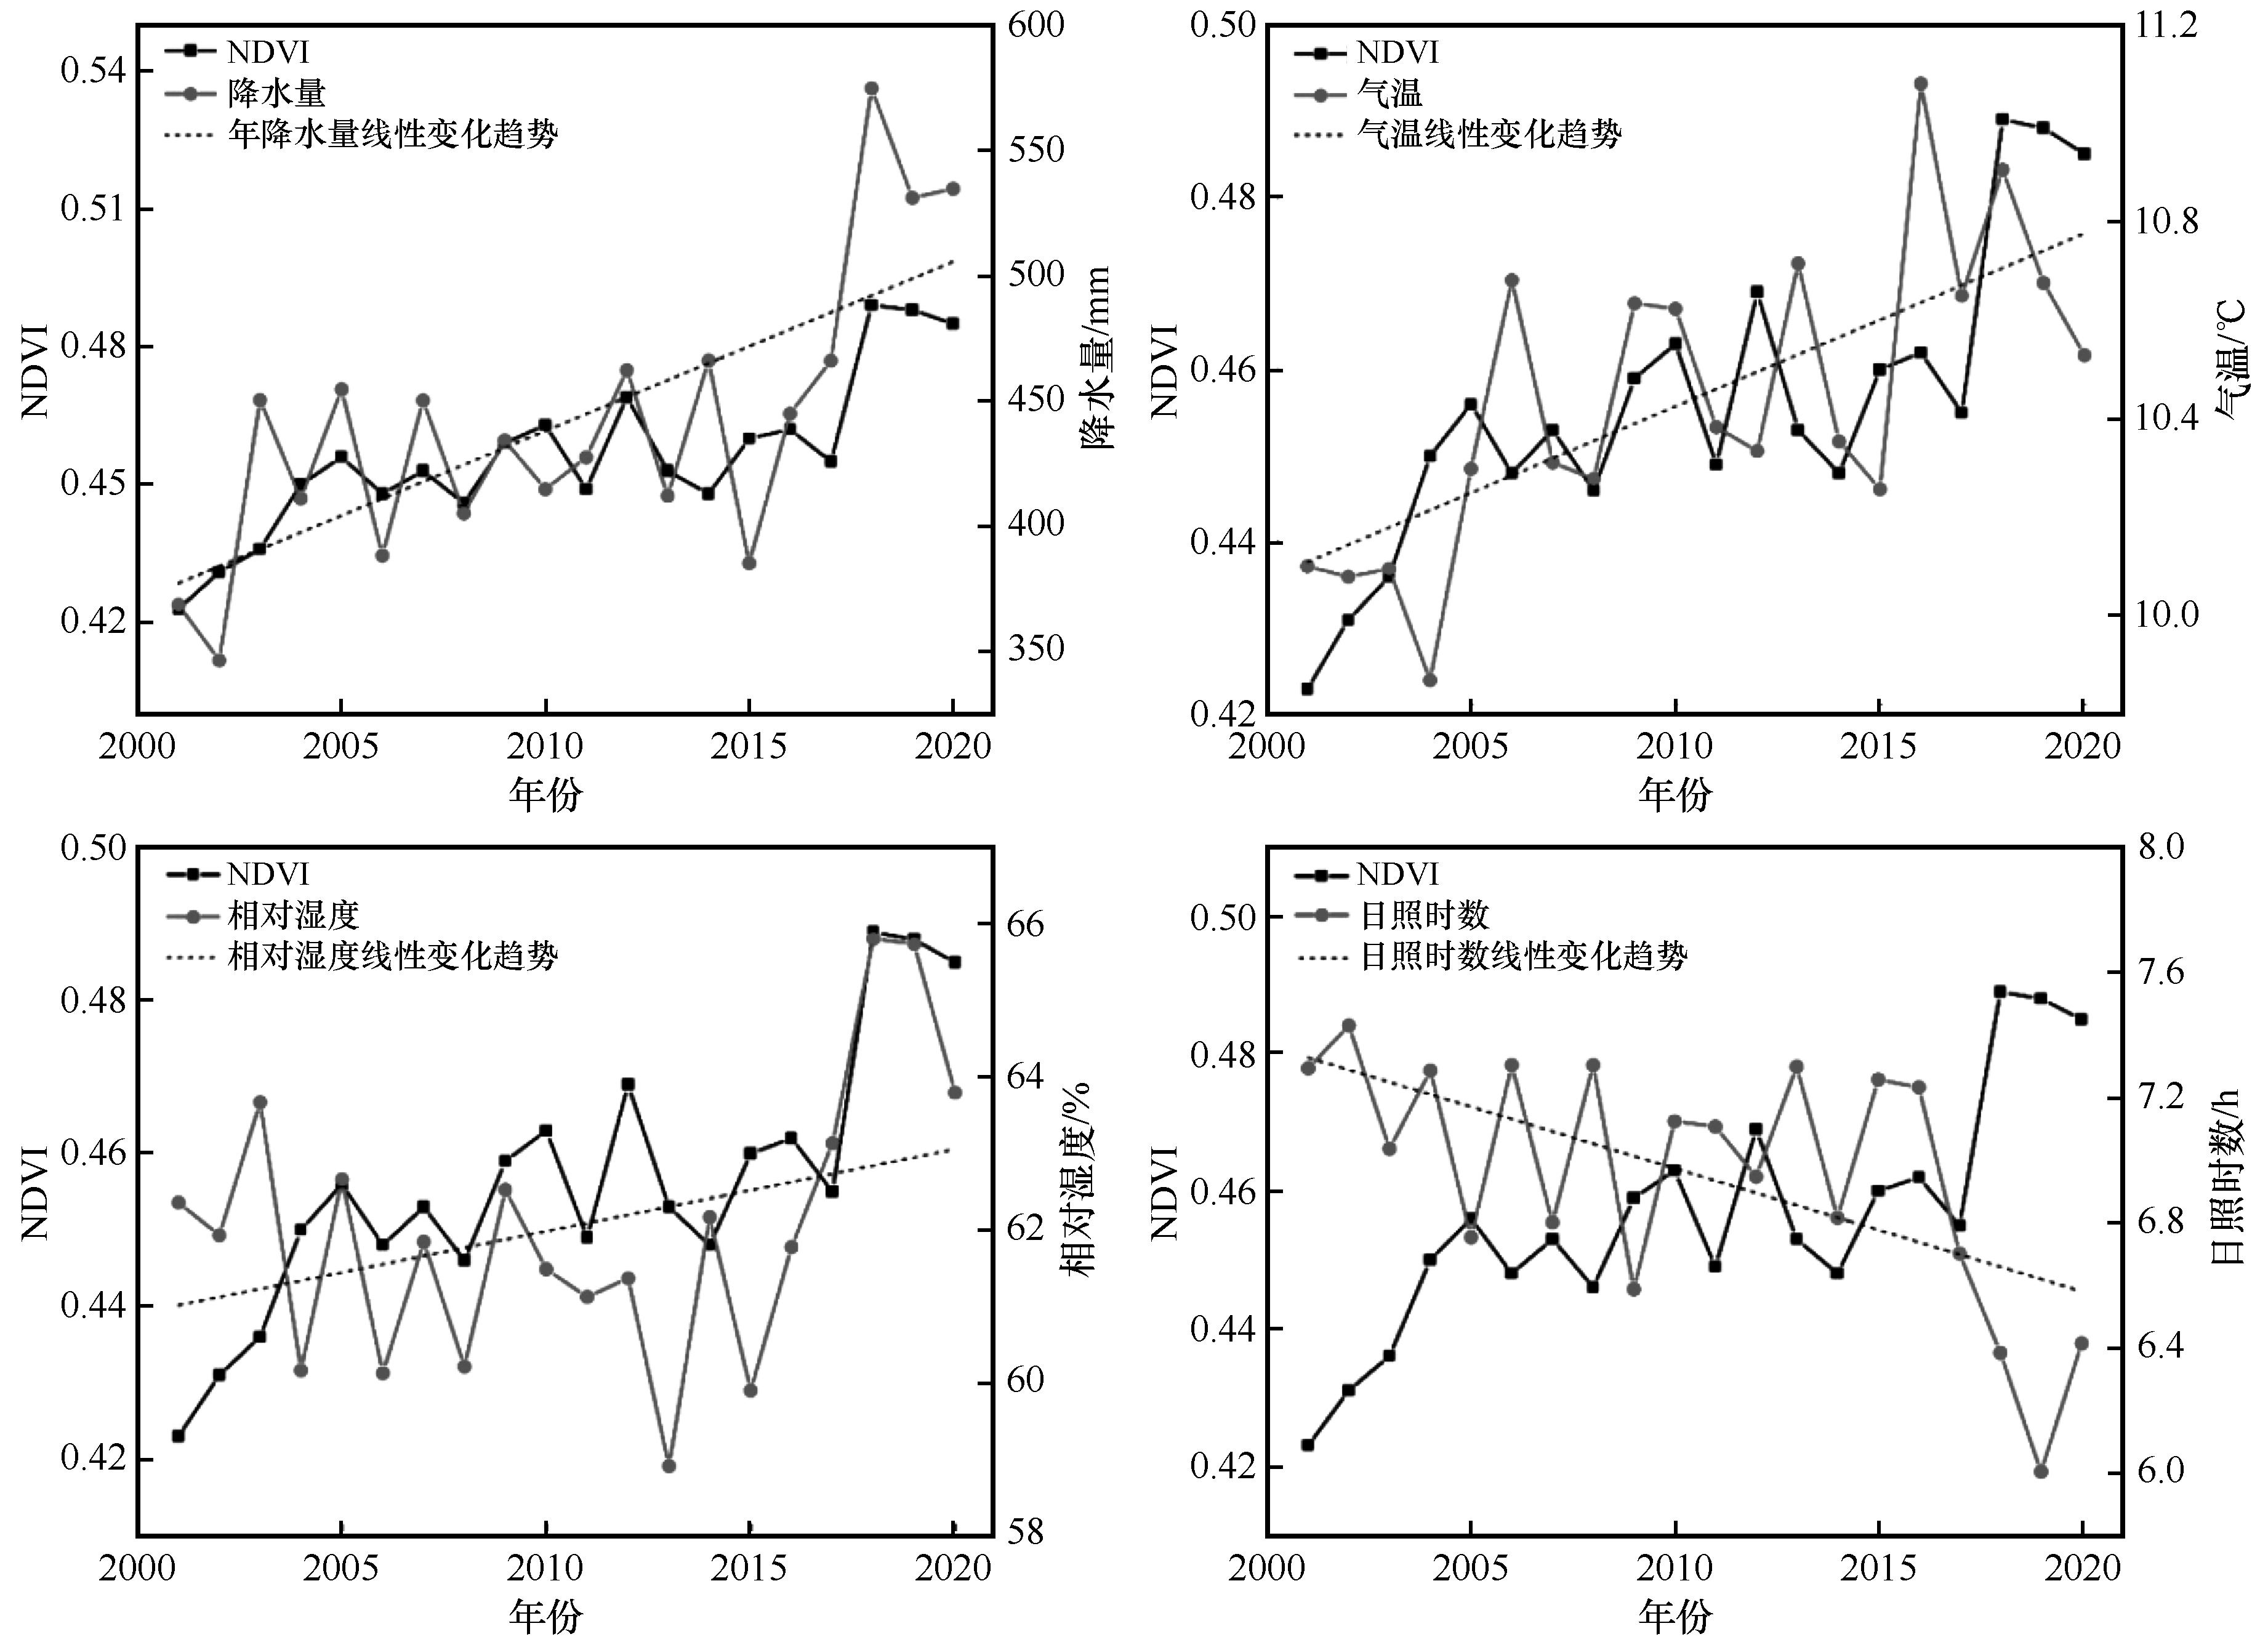
Fig.8 NDVI and the changing trend of climate factors
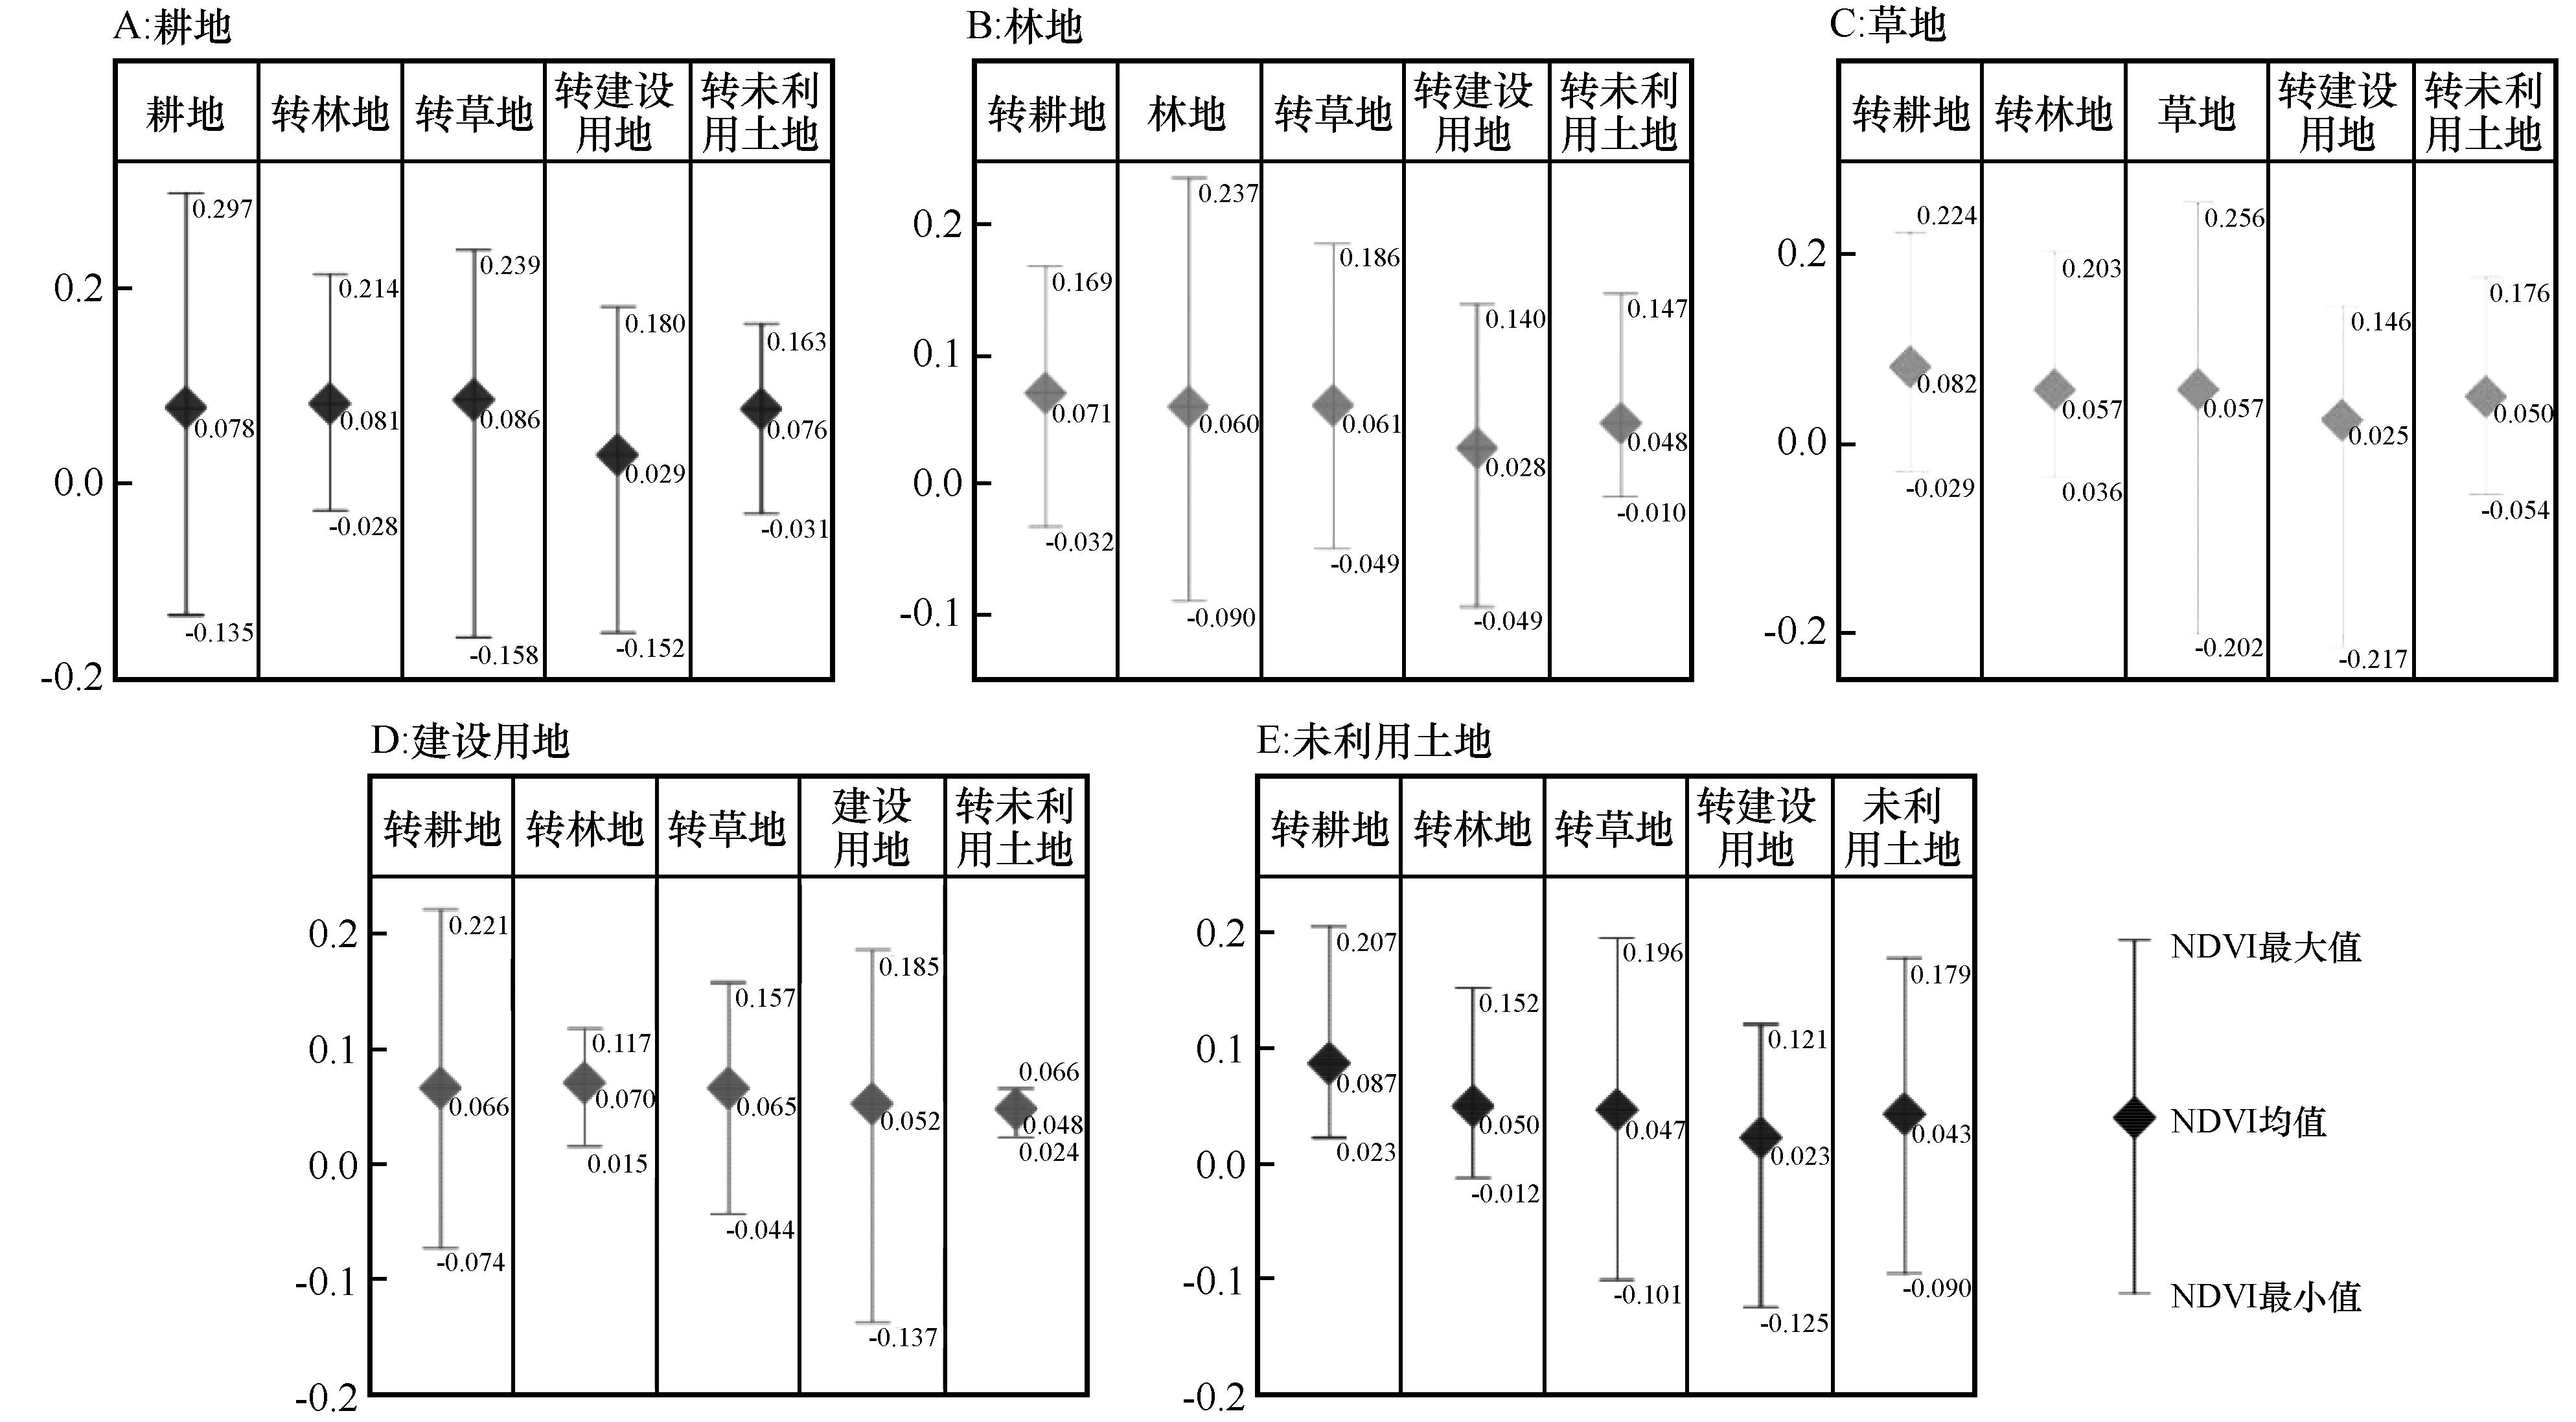
Fig.9 Changes of NDVI in growing season under different land use types from 2001 to 2020
| 1 | 付新雷.基于神东中心区植被覆盖变化的多时相遥感监测[J].中国环境监测,2014,30(2):186-190. |
| 2 | 孟丹,李小娟,宫辉力,等.京津冀地区NDVI变化及气候因子驱动分析[J].地球信息科学学报,2015,17(8):1001-1007. |
| 3 | 张远东,张笑鹤,刘世荣.西南地区不同植被类型归一化植被指数与气候因子的相关分析[J].应用生态学报,2011,22(2):323-330. |
| 4 | Lehnert L W, Meyer H, Wang Y,et al.Retrieval of grassland plant coverage on the Tibetan Plateau based on a multi-scale,multi-sensor and multi-method approach[J].Remote Sensing of Environment,2015,164:197-207. |
| 5 | 宋清洁,崔霞,张瑶瑶,等.基于小型无人机与MODIS数据的草地植被覆盖度研究:以甘南州为例[J].草业科学,2017,34(1):40-50. |
| 6 | 尹振良,冯起,王凌阁,等.2000-2019年中国西北地区植被覆盖变化及其影响因子[J].中国沙漠,2022,42(4):11-21. |
| 7 | Wei Y, Sun S, Liang D,et al.Spatial-temporal variations of NDVI and its response to climate in China from 2001 to 2020[J].International Journal of Digital Earth,2022,15(1):1463-1484. |
| 8 | Gao W, Zheng C, Liu X,et al.NDVI-based vegetation dynamics and their responses to climate change and human activities from 1982 to 2020:a case study in the Mu Us Sandy Land,China[J].Ecological Indicators,2022:108745. |
| 9 | 郭建晓,桑会勇,翟亮.青藏高原植被覆盖度时空变化特征及其驱动因素[J].生态学杂志,2023,42 (11):2665-2674. |
| 10 | Lamchin M, Lee W K, Jeon S W,et al.Long-term trend and correlation between vegetation greenness and climate variables in Asia based on satellite data[J].Science of The Total Environment,2018,618:1089-1095. |
| 11 | 燕丹妮,武心悦,王博恒,等.1982-2015年黄土高原植被变化特征及归因分析[J].生态学报,2023(23):1-11. |
| 12 | 谢绮丽,杨鑫,郝利娜.2001-2020年三江源区植被覆盖时空变化特征及其影响因素[J].水土保持通报,2022,42(5):202-212. |
| 13 | 郑朝菊,曾源,赵玉金,等.近15年中国西南地区植被覆盖度动态变化[J].国土资源遥感,2017,29(3):128-136. |
| 14 | 肖建勇,王世杰,白晓永,等.喀斯特关键带植被时空变化及其驱动因素[J].生态学报,2018,38(24):138-151. |
| 15 | 张亮,丁明军,张华敏,等.1982-2015年长江流域植被覆盖度时空变化分析[J].自然资源学报,2018,33(12):2084-2097. |
| 16 | 郑勇,杨武年,刘冲,等.川西高原近20 a植被覆盖变化遥感动态监测及驱动力分析[J].遥感技术与应用,2020,35(6):1447-1456. |
| 17 | 赵子娟,范蓓蕾,王玉庭,等.2000-2018年西辽河流域植被覆盖度时空变化特征及影响因素[J].中国农业资源与区划,2021,42(12):75-88. |
| 18 | 韩大勇,杨永兴,杨杨,等.湿地退化研究进展[J].生态学报,2012,32(4):289-303. |
| 19 | Gao J, Li X L, Cheng A,et al.Degradation of wetlands on the Qinghai-Tibet Plateau:a comparison of the effectiveness of three indicators[J].Journal of Mountain Science,2013,10(4):658-667. |
| 20 | 范微维,易桂花,张廷斌,等.黄河源区青海省玛多县2000-2014年NDVI变化及气候驱动因子[J].水土保持通报,2017,37(1):335-340. |
| 21 | 刘璐璐,邵全琴,曹巍,等.基于生态服务价值的三江源生态工程成本效益分析[J].草地学报,2018,26(1):30-39. |
| 22 | 邵全琴,樊江文,刘纪远,等.基于目标的三江源生态保护和建设一期工程生态成效评估及政策建议[J].中国科学院院刊,2017,32(1):35-44. |
| 23 | 吴喜芳,李改欣,潘学鹏,等.黄河源区植被覆盖度对气温和降水的响应研究[J].资源科学,2015,37(3):512-521. |
| 24 | 马守存,保广裕,郭广,等.1982-2013年黄河源区植被变化趋势及其对气候变化的响应[J].干旱气象,2018,36(2):226-233. |
| 25 | 梁植,孙若辰,段青云.黄河水源涵养区植被NDVI时空变化特征及其驱动因子[J].地理科学进展,2023,42(9):1717-1732. |
| 26 | 张子涵,王学佳,杨梅学,等.黄河上游水源涵养区近60年关键气候要素的时空变化[J].高原气象,2023,42 (6):1372-1385. |
| 27 | Jin H J, He R X, Cheng G D,et al.Changes in frozen ground in the source area of the Yellow River on the Qinghai-Tibet Plateau,China,and their eco-environmental impacts[J].Environmental Research Letters,2009,4(4):045206. |
| 28 | 王国庆.黄河流域水源涵养区界定[J].水文,2022,42(2):65. |
| 29 | 郑子彦,吕美霞,马柱国.黄河源区气候水文和植被覆盖变化及面临问题的对策建议[J].中国科学院院刊,2020,35(1):61-72. |
| 30 | 康悦,李振朝,田辉,等.黄河源区植被变化趋势及其对气候变化的响应过程研究[J].气候与环境研究,2011,16(4)505-512. |
| 31 | 王莺,李耀辉,孙旭映.气候变化对黄河源区生态环境的影响[J].草业科学,2015,32(4):539-551. |
| 32 | 高思琦,董国涛,蒋晓辉,等.基于地理探测器的三江源植被变化及自然驱动因子分析[J].水土保持研究,2022,29(4):336-343. |
| 33 | 国家气象信息中心.中国国家级地面气象站基本气象要素日值数据集(V3.0)(1951-2010)[Z].时空三极环境大数据平台,2019. |
| 34 | Chen T, Xu H J, Qi X L,et al.Temporal dynamics of satellite-derived vegetation pattern and growth in an arid inland river basin,Tibetan[J].Plateau Global Ecology and Conservation,2022,e02262. |
| 35 | 刘成文,宋生发,喇得元.化隆县草地牧草产量及载畜量调查[J].青海草业,2005(4):54-55. |
| 36 | 郭正刚,张自和,高淑兰.河西绿洲区草畜间粗蛋白质和能量供求关系及其调控措施[J].草业学报,2002(3):22-28. |
| 37 | 严恩萍,林辉,党永峰,等.2000-2012年京津风沙源治理区植被覆盖时空演变特征[J].生态学报,2014,34(17):5007-5020. |
| 38 | 王劲峰,徐成东.地理探测器:原理与展望[J].地理学报,2017,72(1):116-134. |
| 39 | 马永桃,任孝宗,胡慧芳,等.基于地理探测器的浑善达克沙地植被变化定量归因[J].中国沙漠,2021,41(4):195-204. |
| 40 | 孟琪,武志涛,杜自强,等.基于地理探测器的区域植被覆盖度的定量影响:以京津风沙源区为例[J].中国环境科学,2021,41(2):826-836. |
| 41 | 彭文甫,张冬梅,罗艳玫,等.自然因子对四川植被NDVI变化的地理探测[J].地理学报,2019,74(9):1758-1776. |
| 42 | 刘子凡,李娜,李宏韬.基于GEE的陕北退耕还林前后植被变化[J].甘肃林业科技,2023,48(2):35-38. |
| 43 | 马炳鑫,和彩霞,靖娟利,等.1982-2019年中国西南地区植被变化归因研究[J].地理学报,2023,78(3):714-728. |
| 44 | 田佳西.西北地区气候暖湿化演变趋势及其对植被恢复影响研究[D].南京:南京林业大学,2023. |
| 45 | 陈春波,李均力,赵炎,等.新疆草地时空动态及其对气候变化的响应:以昌吉回族自治州为例[J].干旱区研究,2023,40(9):1484-1497. |
| 46 | 陈强强,张佩琳,吴茜.牧民对休牧、禁牧政策的响应分析:以玛曲县为例[J].草原与草坪,2023,43(3):138-145. |
| 47 | Peng C, Yang J.Mountain hazards in the Tibetan Plateau:research status and prospects[J].National Science Review,2015,2:397-399. |
| 48 | Liu C, Wang L, Song X,et al.Towards a mechanistic understanding of the effect that different species of large grazers have on grassland soil N availability[J].Journal of Ecology,2018,106(1):357-366. |
| 49 | 李依璇,朱清科,石若莹,等.2000-2018年黄土高原植被覆盖时空变化及影响因素[J].中国水土保持科学(中英文),2021,19(4):60-68. |
| 50 | 史丹丹,杨涛,胡金明,等.基于NDVI的黄河源区生长季植被时空变化及其与气候因子的关系[J].山地学报,2018,36(2):184-193. |
| 51 | 杨金虎,张强,杨博成,等.黄河上游暖湿化的多时间尺度特征及对生态植被的影响[J].高原气象,2023,42(4):1018-1030. |
| [1] | Wanfeng Su, Guangzhao Han, Deli Ye, Guangchao Cao. Remote sensing evaluation and driving force analysis of ecological environment in Gonghe Basin [J]. Journal of Desert Research, 2023, 43(5): 74-84. |
| [2] | Guocheng Yang, Donglei Mao, Minzhong Wang, Jiantao Zhang, Honglin Pan. Calculation and analysis of summer stable boundary layer height in the hinterland of Taklimakan Desert, China [J]. Journal of Desert Research, 2023, 43(4): 64-75. |
| [3] | Yating Cui, Huan Li, Longxiao Zheng, Mengquan Wu. Study of ecological environmental quality changes in the upper Yellow River basin based on remote sensing ecological index [J]. Journal of Desert Research, 2023, 43(3): 107-118. |
| [4] | Enyue Zhang, Yingqing Su, Yunfeng Zhang, Yuzhen Li, Kexuan Li, Geng Liu. Coupling coordination pattern and driving factors of soil and water resources in Fenhe River Basin of China [J]. Journal of Desert Research, 2023, 43(3): 169-177. |
| [5] | Zhenliang Yin, Qi Feng, Lingge Wang, Zexia Chen, Yabin Chang, Rui Zhu. Vegetation coverage change and its influencing factors across the northwest region of China during 2000-2019 [J]. Journal of Desert Research, 2022, 42(4): 11-21. |
| [6] | Jun Liu, Zhongling Guo, Chunping Chang, Rende Wang, Jifeng Li, Qing Li, Xuyang Wang. Potential wind erosion simulation in the agro-pastoral ecotone of northern China using RWEQ and WEPS models [J]. Journal of Desert Research, 2021, 41(2): 27-37. |
| [7] | Shuxing Xu, Qianqian Wu, Dianxue Qiao, Yinglin Mu, Xiao Zhang, Yanshu Liu, Xiaohui Yang, Zhongjie Shi. Spatiotemporal pattern and effecting factors of wildfire in eastern Mongolia [J]. Journal of Desert Research, 2021, 41(2): 83-91. |
| [8] | Hua Zhang, Huimin An. Analysis of NDVI variation characteristics and trend of Minqin Oasis from 1987 to 2019 based on GEE [J]. Journal of Desert Research, 2021, 41(1): 28-36. |
| [9] | Yang Huaide, Feng Qi, Guo Xiaoyan. Variation of Groundwater Depth and Its Influence Factors in the Minqin Oasis in 1999-2013 [J]. JOURNAL OF DESERT RESEARCH, 2017, 37(3): 562-570. |
| [10] | SHI Fu-xi1, SONG Chang-chun1, ZHAO Cheng-zhang2, ZHANG Jing2, SHI Li-li2. Dynamic of Service Value of Farmland Meta-ecosystem of Mountain, Oasis and Desert and Multiple Regression Analysis of the Influence Factors in the Hexi Corridor, Gansu, China [J]. JOURNAL OF DESERT RESEARCH, 2013, 33(5): 1598-1604. |
| [11] | ZHANG Xin-huan1, XIAO Yan-qiu2, YANG De-gang1, LIU Yun-tong3. Analysis on Driving Forces of Households’ Water-saving Irrigation Decision-making in the Sangonghe River Basin Using the Logistic Model [J]. JOURNAL OF DESERT RESEARCH, 2013, 33(1): 288-294. |
| [12] | YAN Na;Hasi Eerdun;LIU Huai-quan;LI Shuang-quan. Research Progress in Morphology and Evolution of the Parabolic Dunes [J]. JOURNAL OF DESERT RESEARCH, 2010, 30(4): 801-807. |
| [13] | YANG Zhi-peng;LI Xiao-yan;YI Wan-juan. Review on Stemflow of Desert Shrubs—Research Methods and Eco-hydrological Effects [J]. JOURNAL OF DESERT RESEARCH, 2010, 30(2): 303-311. |
| [14] | SHI Xing-he;QIN Ning-sheng;WANG Qing-chun;QIAN You-hai;FENG Shu-qing;YANG Gui-ling;LIU Qing-chun. Analysis on Runoff Variation Characteristics and Influencing Factors in the Upper Yellow River [J]. JOURNAL OF DESERT RESEARCH, 2007, 27(4): 690-697. |
| [15] | SI Jian-hua, FENG Qi, ZHANG Xiao-you. Leaf Water Potential of Populus euphratica and Influencinge Factors in Extreme Arid Region [J]. JOURNAL OF DESERT RESEARCH, 2005, 25(4): 505-510. |
| Viewed | ||||||
|
Full text |
|
|||||
|
Abstract |
|
|||||
©2018Journal of Desert Research
Tel:0931-8267545
Email:caiedit@lzb.ac.cn;desert@lzb.ac.cn
Support:Magtech