
- CN 62-1070/P
- ISSN 1000-694X
- Bimonthly 1981
Journal of Desert Research ›› 2023, Vol. 43 ›› Issue (4): 64-75.DOI: 10.7522/j.issn.1000-694X.2023.00008
Previous Articles Next Articles
Guocheng Yang1,2( ), Donglei Mao1(), Minzhong Wang2, Jiantao Zhang2, Honglin Pan2
Received:2022-11-29
Revised:2023-01-03
Online:2023-07-20
Published:2023-08-14
Contact:
Donglei Mao
CLC Number:
Guocheng Yang, Donglei Mao, Minzhong Wang, Jiantao Zhang, Honglin Pan. Calculation and analysis of summer stable boundary layer height in the hinterland of Taklimakan Desert, China[J]. Journal of Desert Research, 2023, 43(4): 64-75.
Add to citation manager EndNote|Ris|BibTeX
URL: http://www.desert.ac.cn/EN/10.7522/j.issn.1000-694X.2023.00008
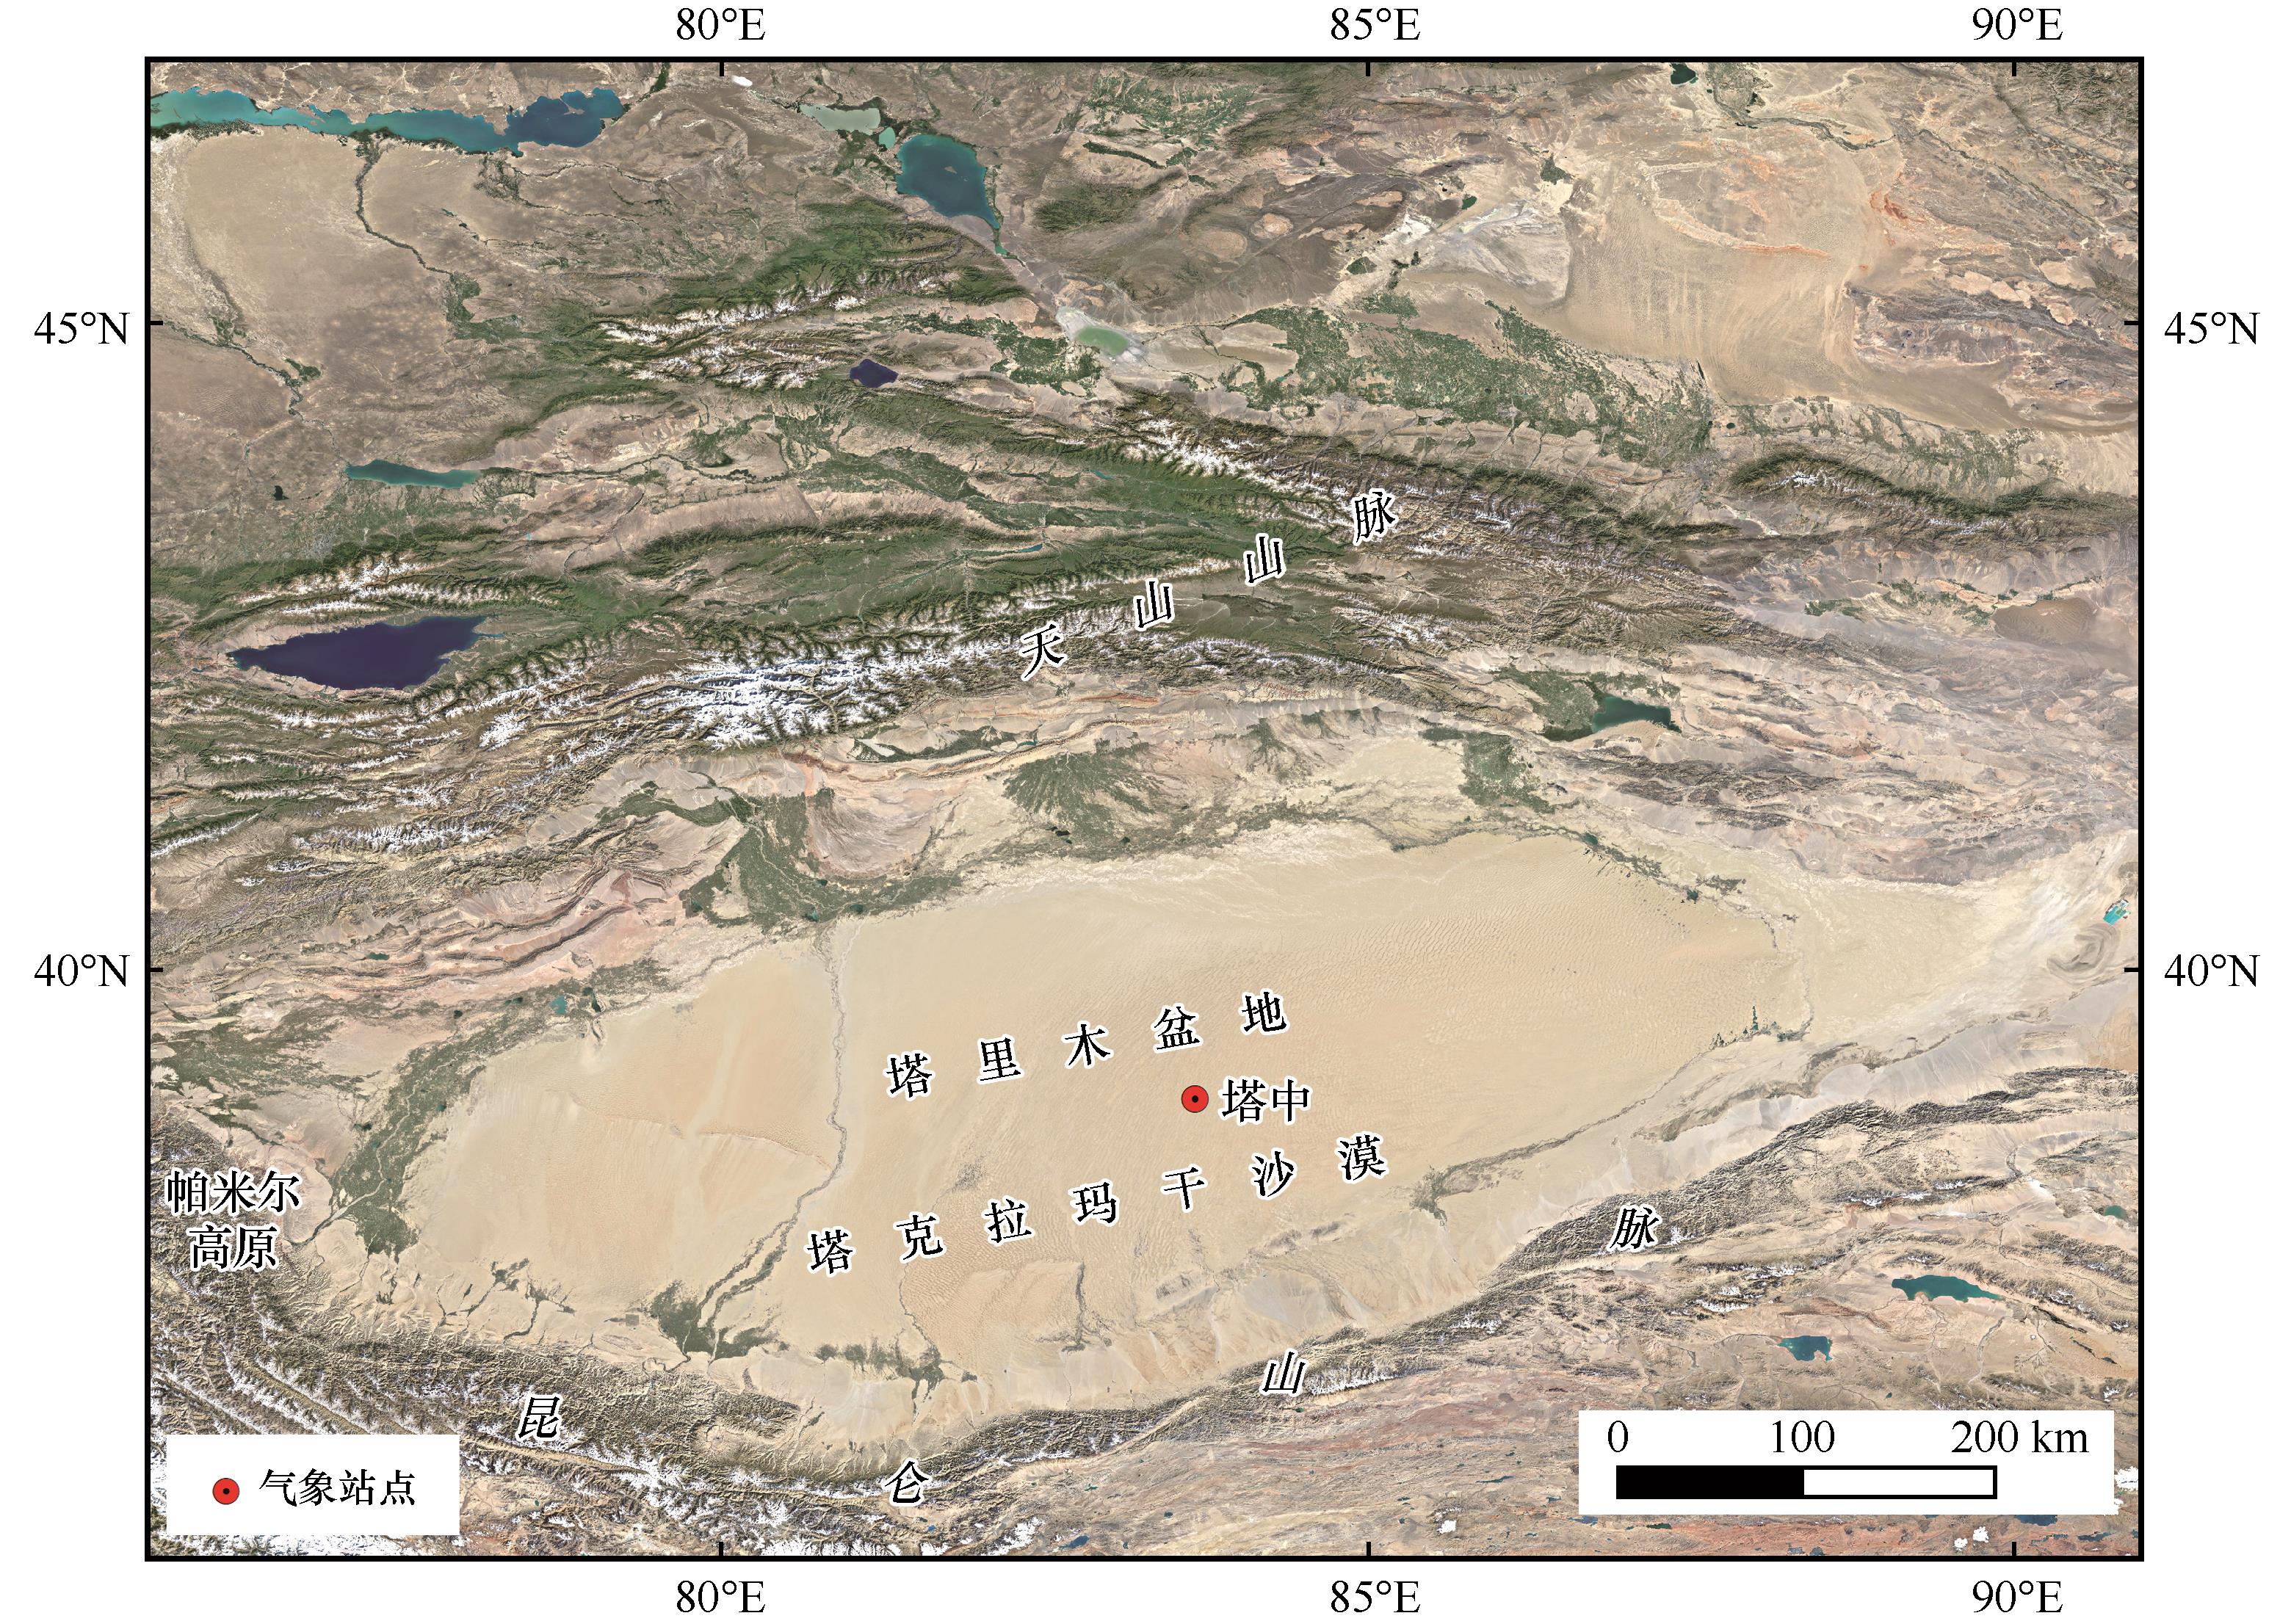
Fig.1 Schematic diagram of research area
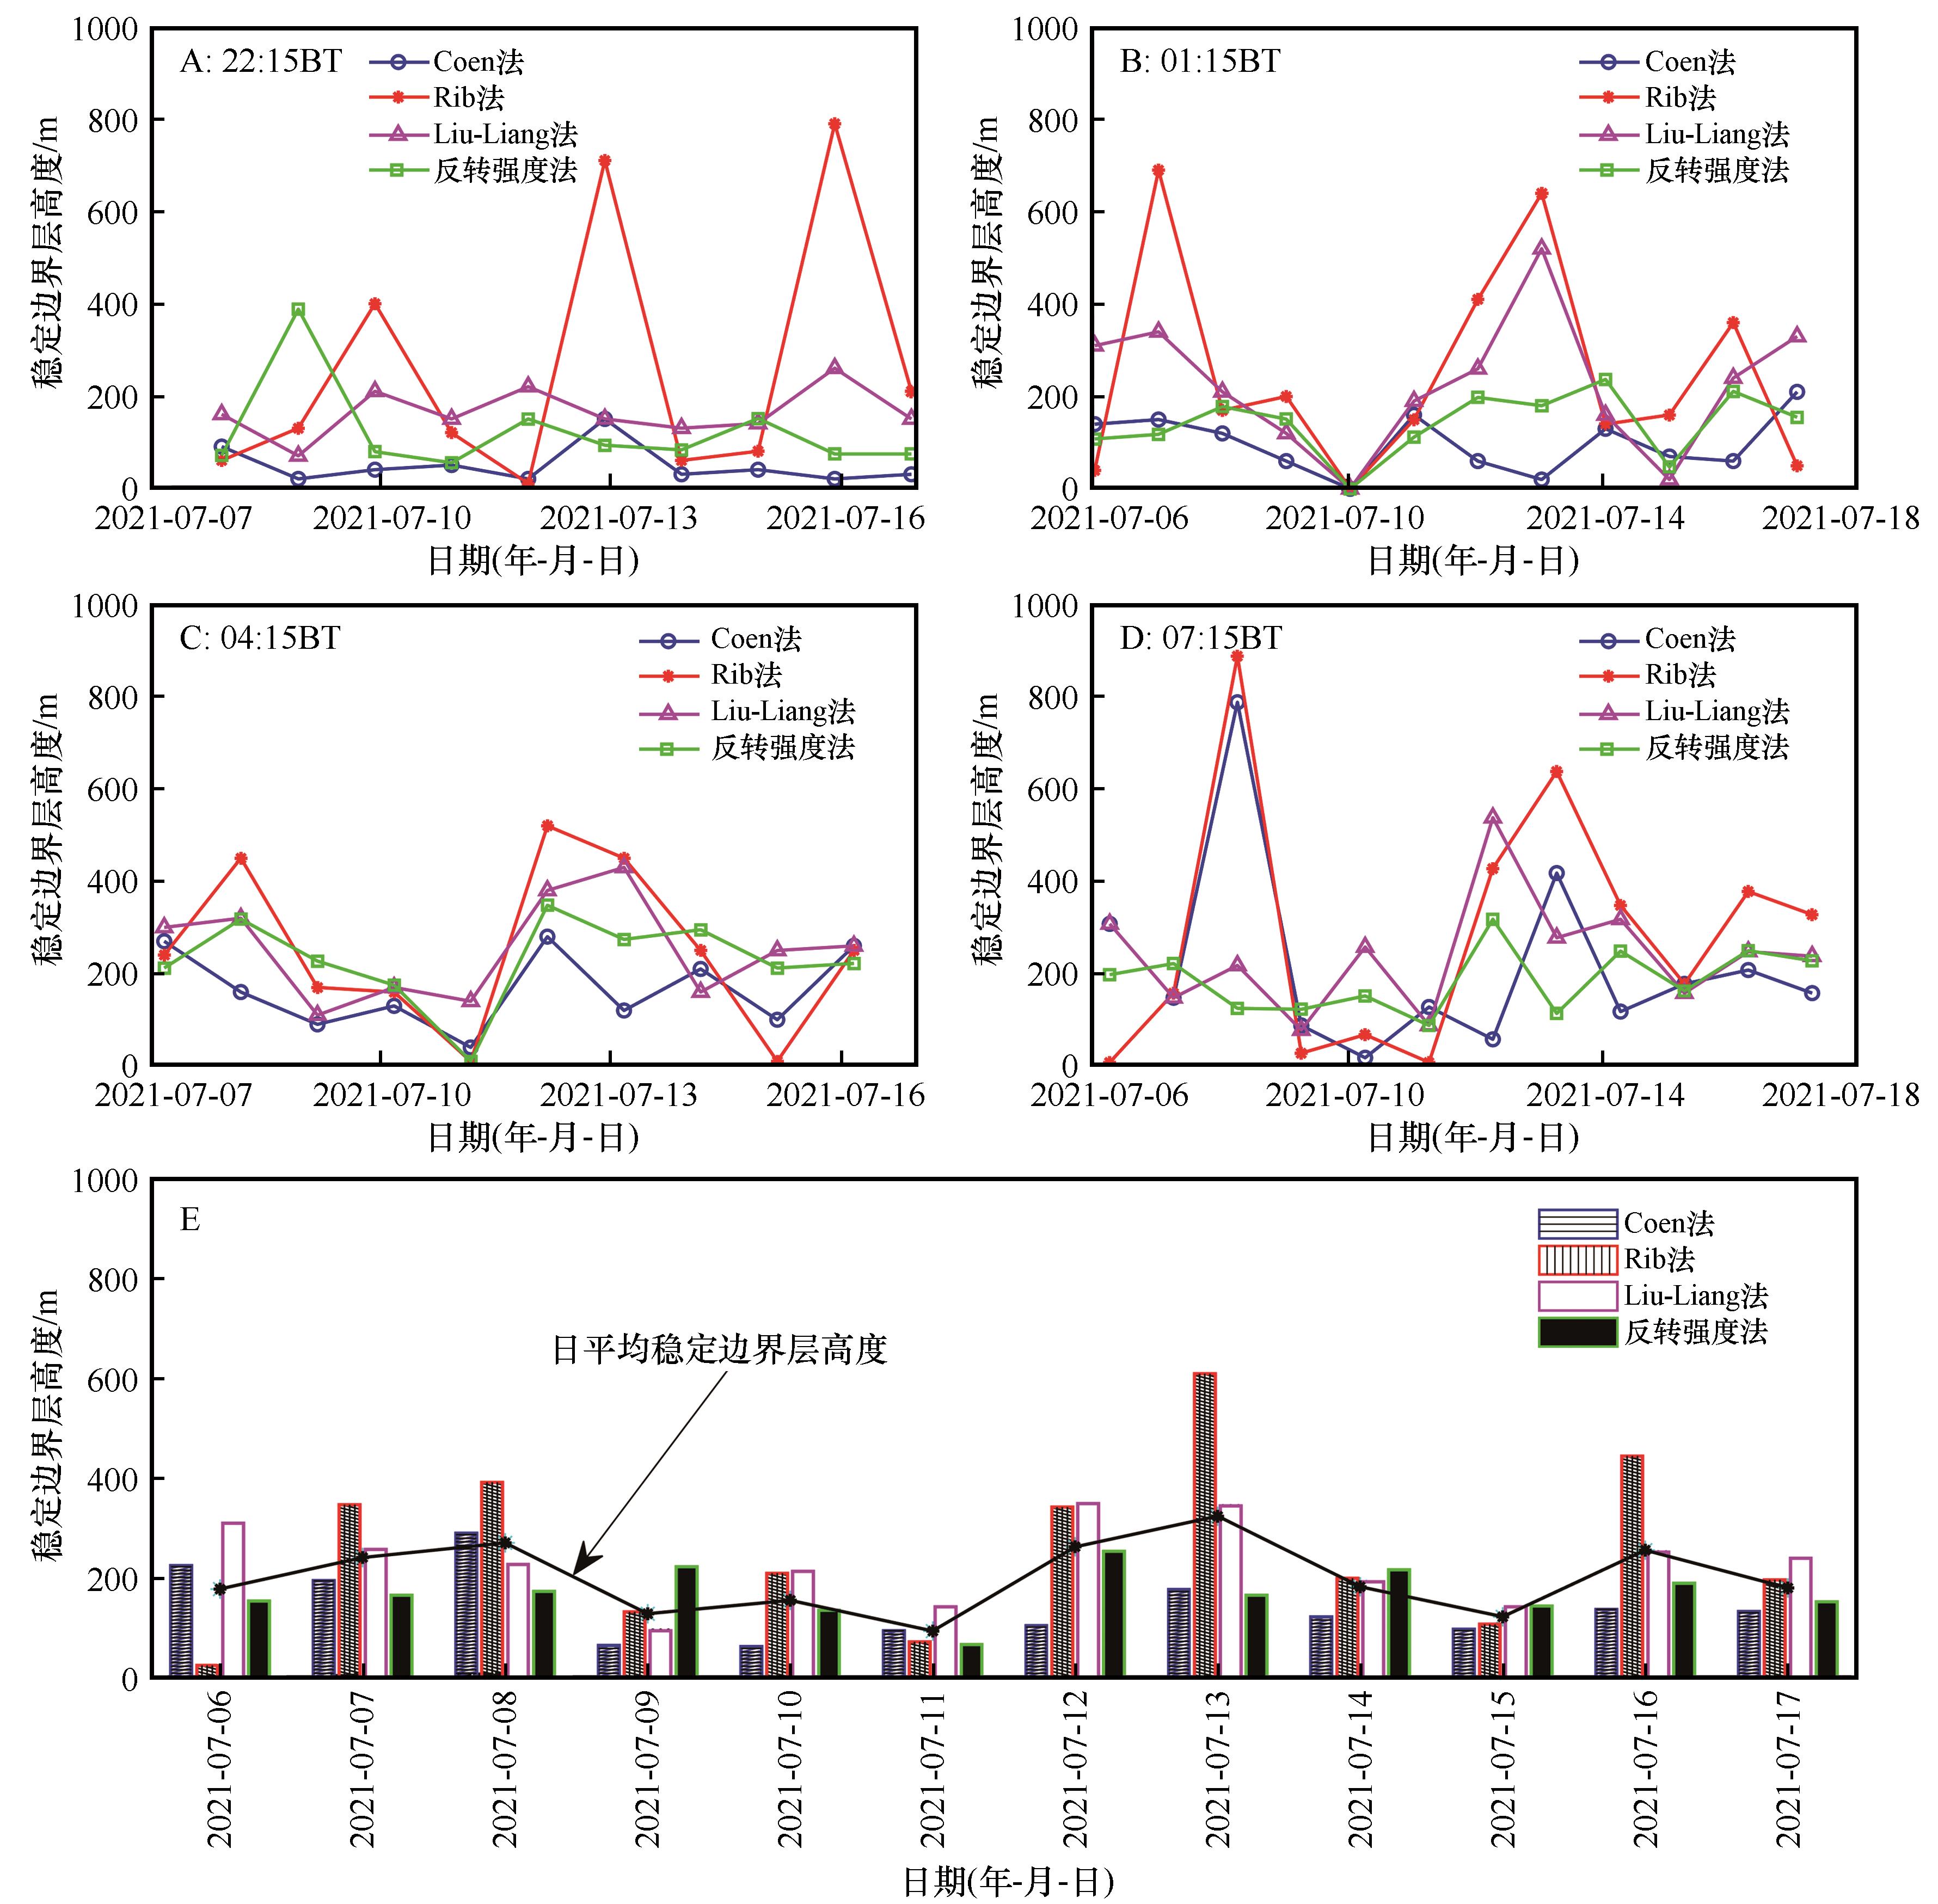
Fig.2 Variation of stable boundary layer height in the hinterland of Taklimakan Desert in summer
| 日期 | Coen法 | Rib法 | Liu-Liang法 | 反转强度法 | 平均值 | 平均偏差 (AD) | 相对平均偏差(RAD) | 标准偏差(SD) | 相对标准偏差(RSD) |
|---|---|---|---|---|---|---|---|---|---|
| 2021-07-06 | 225.00 | 25.00 | 310.00 | 154.00 | 178.50 | 89.00 | 49.86 | 45.19 | 0.04 |
| 2021-07-07 | 195.00 | 347.50 | 257.50 | 165.75 | 241.44 | 61.06 | 25.29 | 35.49 | 0.04 |
| 2021-07-08 | 290.00 | 392.50 | 227.50 | 173.50 | 270.88 | 70.38 | 25.98 | 39.98 | 0.09 |
| 2021-07-09 | 65.00 | 132.50 | 95.00 | 222.75 | 128.81 | 48.80 | 37.89 | 38.67 | 0.02 |
| 2021-07-10 | 63.34 | 210.00 | 213.34 | 136.00 | 155.67 | 56.00 | 35.97 | 28.07 | 0.02 |
| 2021-07-11 | 95.00 | 72.50 | 142.50 | 66.75 | 94.19 | 24.56 | 26.08 | 10.70 | 2.82 |
| 2021-07-12 | 105.00 | 342.50 | 350.00 | 254.00 | 262.88 | 83.38 | 31.72 | 46.65 | 0.01 |
| 2021-07-13 | 177.50 | 610.00 | 345.00 | 165.75 | 324.56 | 152.94 | 47.12 | 84.20 | 0.01 |
| 2021-07-14 | 122.50 | 200.00 | 192.50 | 216.50 | 182.88 | 30.18 | 16.51 | 15.99 | 0.03 |
| 2021-07-15 | 97.50 | 107.50 | 142.50 | 143.75 | 122.81 | 20.31 | 16.54 | 9.76 | 0.08 |
| 2021-07-16 | 137.50 | 445.00 | 252.50 | 189.75 | 256.19 | 94.41 | 36.85 | 46.57 | 0.02 |
| 2021-07-17 | 133.34 | 196.67 | 240.00 | 153.00 | 180.75 | 37.58 | 20.79 | 24.25 | 0.03 |
Table 1 Variation of parameters related to the height of stable boundary layer
| 日期 | Coen法 | Rib法 | Liu-Liang法 | 反转强度法 | 平均值 | 平均偏差 (AD) | 相对平均偏差(RAD) | 标准偏差(SD) | 相对标准偏差(RSD) |
|---|---|---|---|---|---|---|---|---|---|
| 2021-07-06 | 225.00 | 25.00 | 310.00 | 154.00 | 178.50 | 89.00 | 49.86 | 45.19 | 0.04 |
| 2021-07-07 | 195.00 | 347.50 | 257.50 | 165.75 | 241.44 | 61.06 | 25.29 | 35.49 | 0.04 |
| 2021-07-08 | 290.00 | 392.50 | 227.50 | 173.50 | 270.88 | 70.38 | 25.98 | 39.98 | 0.09 |
| 2021-07-09 | 65.00 | 132.50 | 95.00 | 222.75 | 128.81 | 48.80 | 37.89 | 38.67 | 0.02 |
| 2021-07-10 | 63.34 | 210.00 | 213.34 | 136.00 | 155.67 | 56.00 | 35.97 | 28.07 | 0.02 |
| 2021-07-11 | 95.00 | 72.50 | 142.50 | 66.75 | 94.19 | 24.56 | 26.08 | 10.70 | 2.82 |
| 2021-07-12 | 105.00 | 342.50 | 350.00 | 254.00 | 262.88 | 83.38 | 31.72 | 46.65 | 0.01 |
| 2021-07-13 | 177.50 | 610.00 | 345.00 | 165.75 | 324.56 | 152.94 | 47.12 | 84.20 | 0.01 |
| 2021-07-14 | 122.50 | 200.00 | 192.50 | 216.50 | 182.88 | 30.18 | 16.51 | 15.99 | 0.03 |
| 2021-07-15 | 97.50 | 107.50 | 142.50 | 143.75 | 122.81 | 20.31 | 16.54 | 9.76 | 0.08 |
| 2021-07-16 | 137.50 | 445.00 | 252.50 | 189.75 | 256.19 | 94.41 | 36.85 | 46.57 | 0.02 |
| 2021-07-17 | 133.34 | 196.67 | 240.00 | 153.00 | 180.75 | 37.58 | 20.79 | 24.25 | 0.03 |
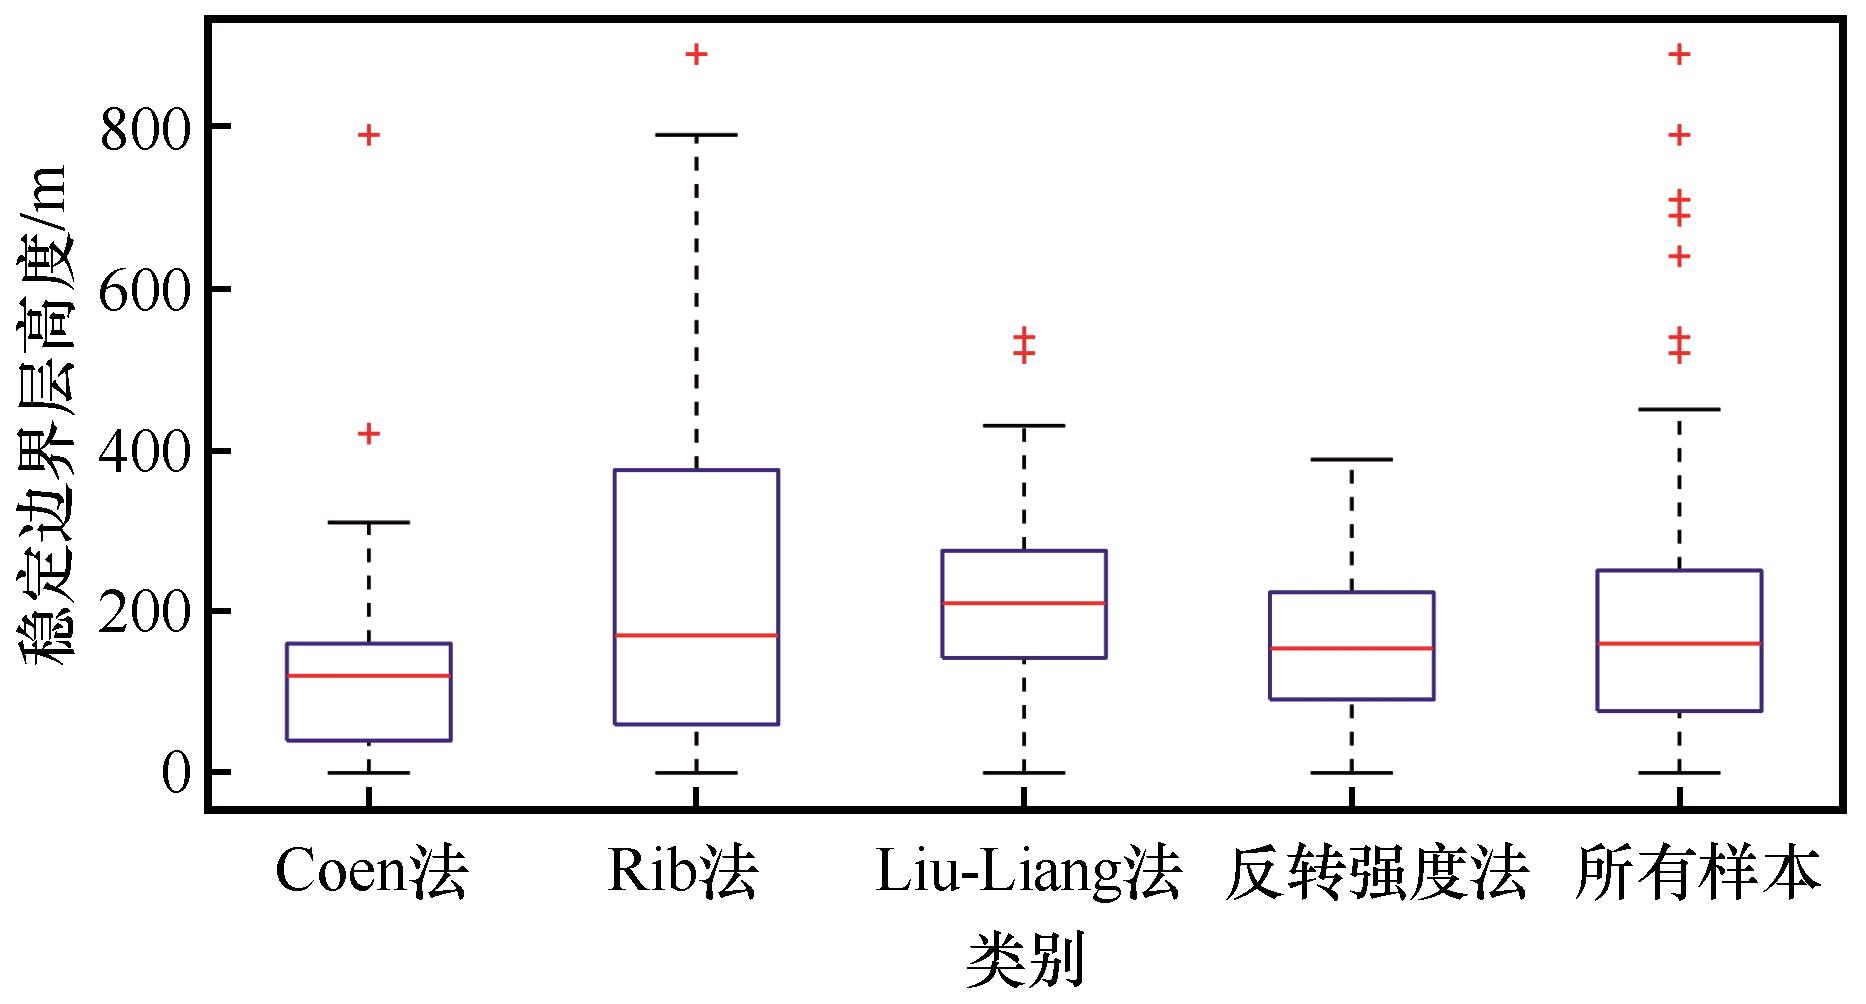
Fig.3 Summer stable boundary layer height box pattern of Tazhong Station calculated by different methods
| 方法 | 最大值 | 最小值 | 中值 | 标准差 | 平均值 | 变异系数/% |
|---|---|---|---|---|---|---|
| Coen法 | 790 | 20 | 120 | 133 | 141 | 94.36 |
| Rib法 | 890 | 10 | 190 | 230 | 269 | 85.51 |
| Liu-Liang法 | 540 | 20 | 220 | 109 | 227 | 47.96 |
| 反转强度法 | 388 | 10 | 160 | 85 | 173 | 49.27 |
Table 2 Comparison of stable boundary layer height characteristics calculated by different methods
| 方法 | 最大值 | 最小值 | 中值 | 标准差 | 平均值 | 变异系数/% |
|---|---|---|---|---|---|---|
| Coen法 | 790 | 20 | 120 | 133 | 141 | 94.36 |
| Rib法 | 890 | 10 | 190 | 230 | 269 | 85.51 |
| Liu-Liang法 | 540 | 20 | 220 | 109 | 227 | 47.96 |
| 反转强度法 | 388 | 10 | 160 | 85 | 173 | 49.27 |
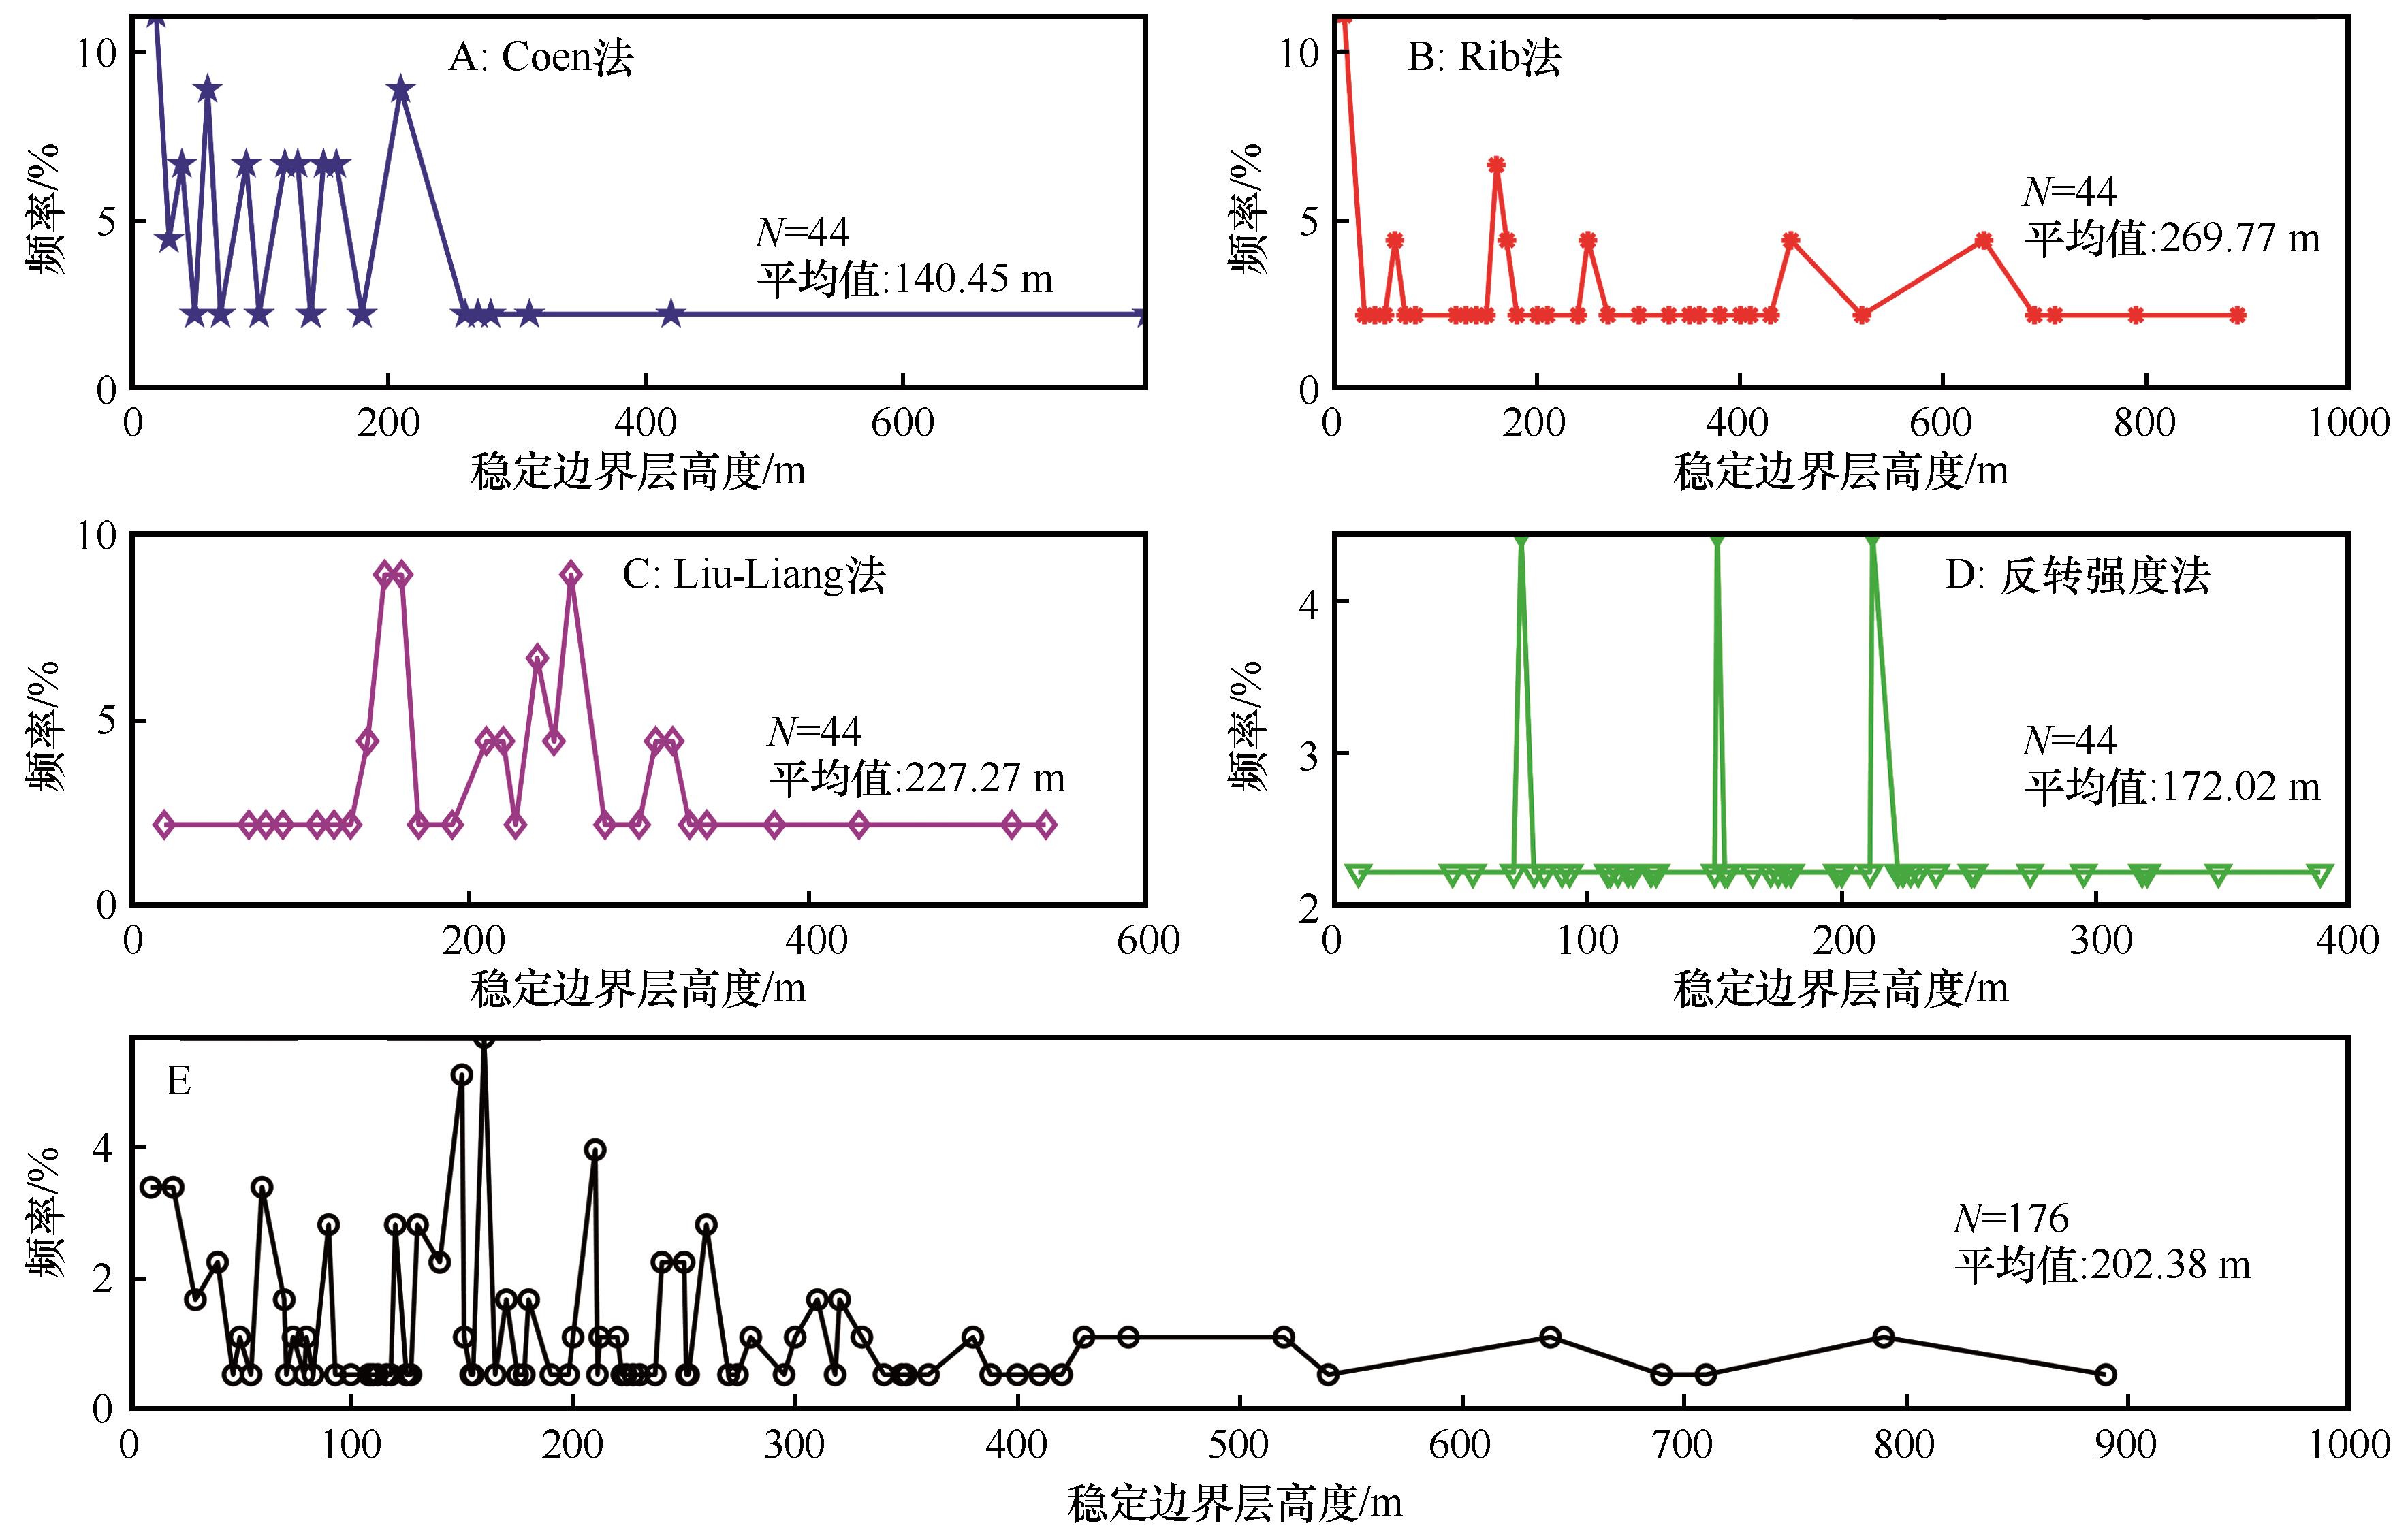
Fig.4 Frequency distribution of stable boundary layer height in Tazhong Station in summer calculated by different methods
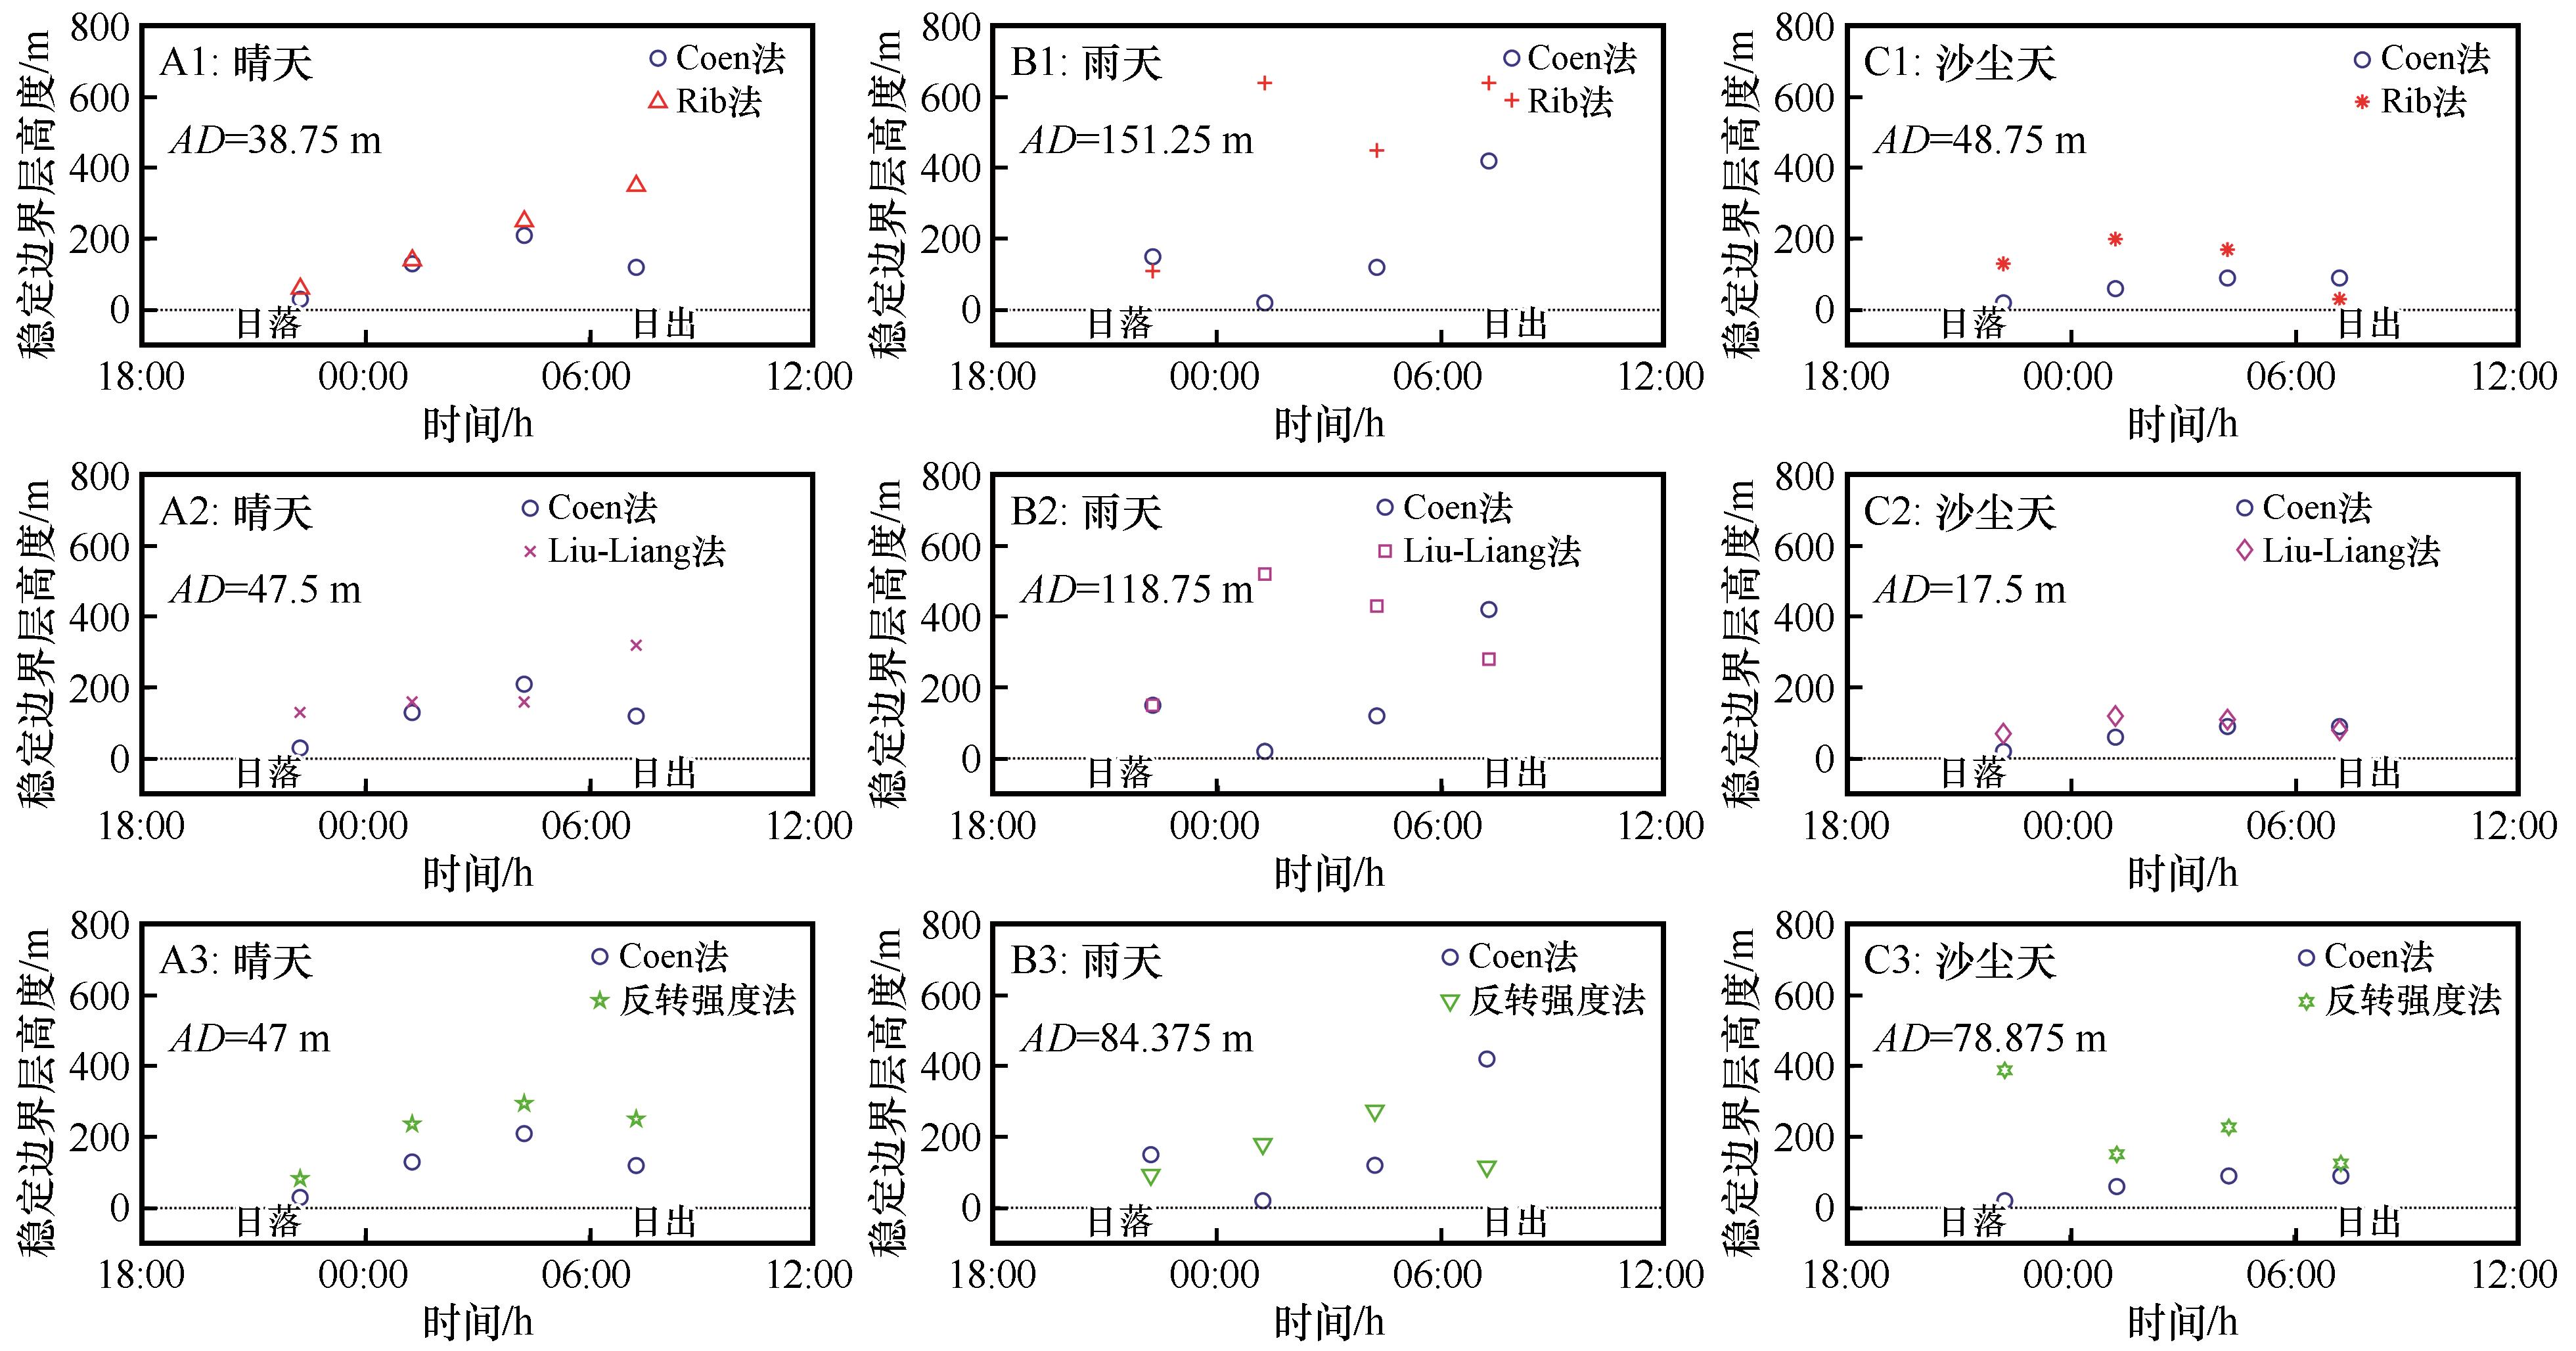
Fig.5 Example comparison of stable boundary layer height of four methods under different weather conditions
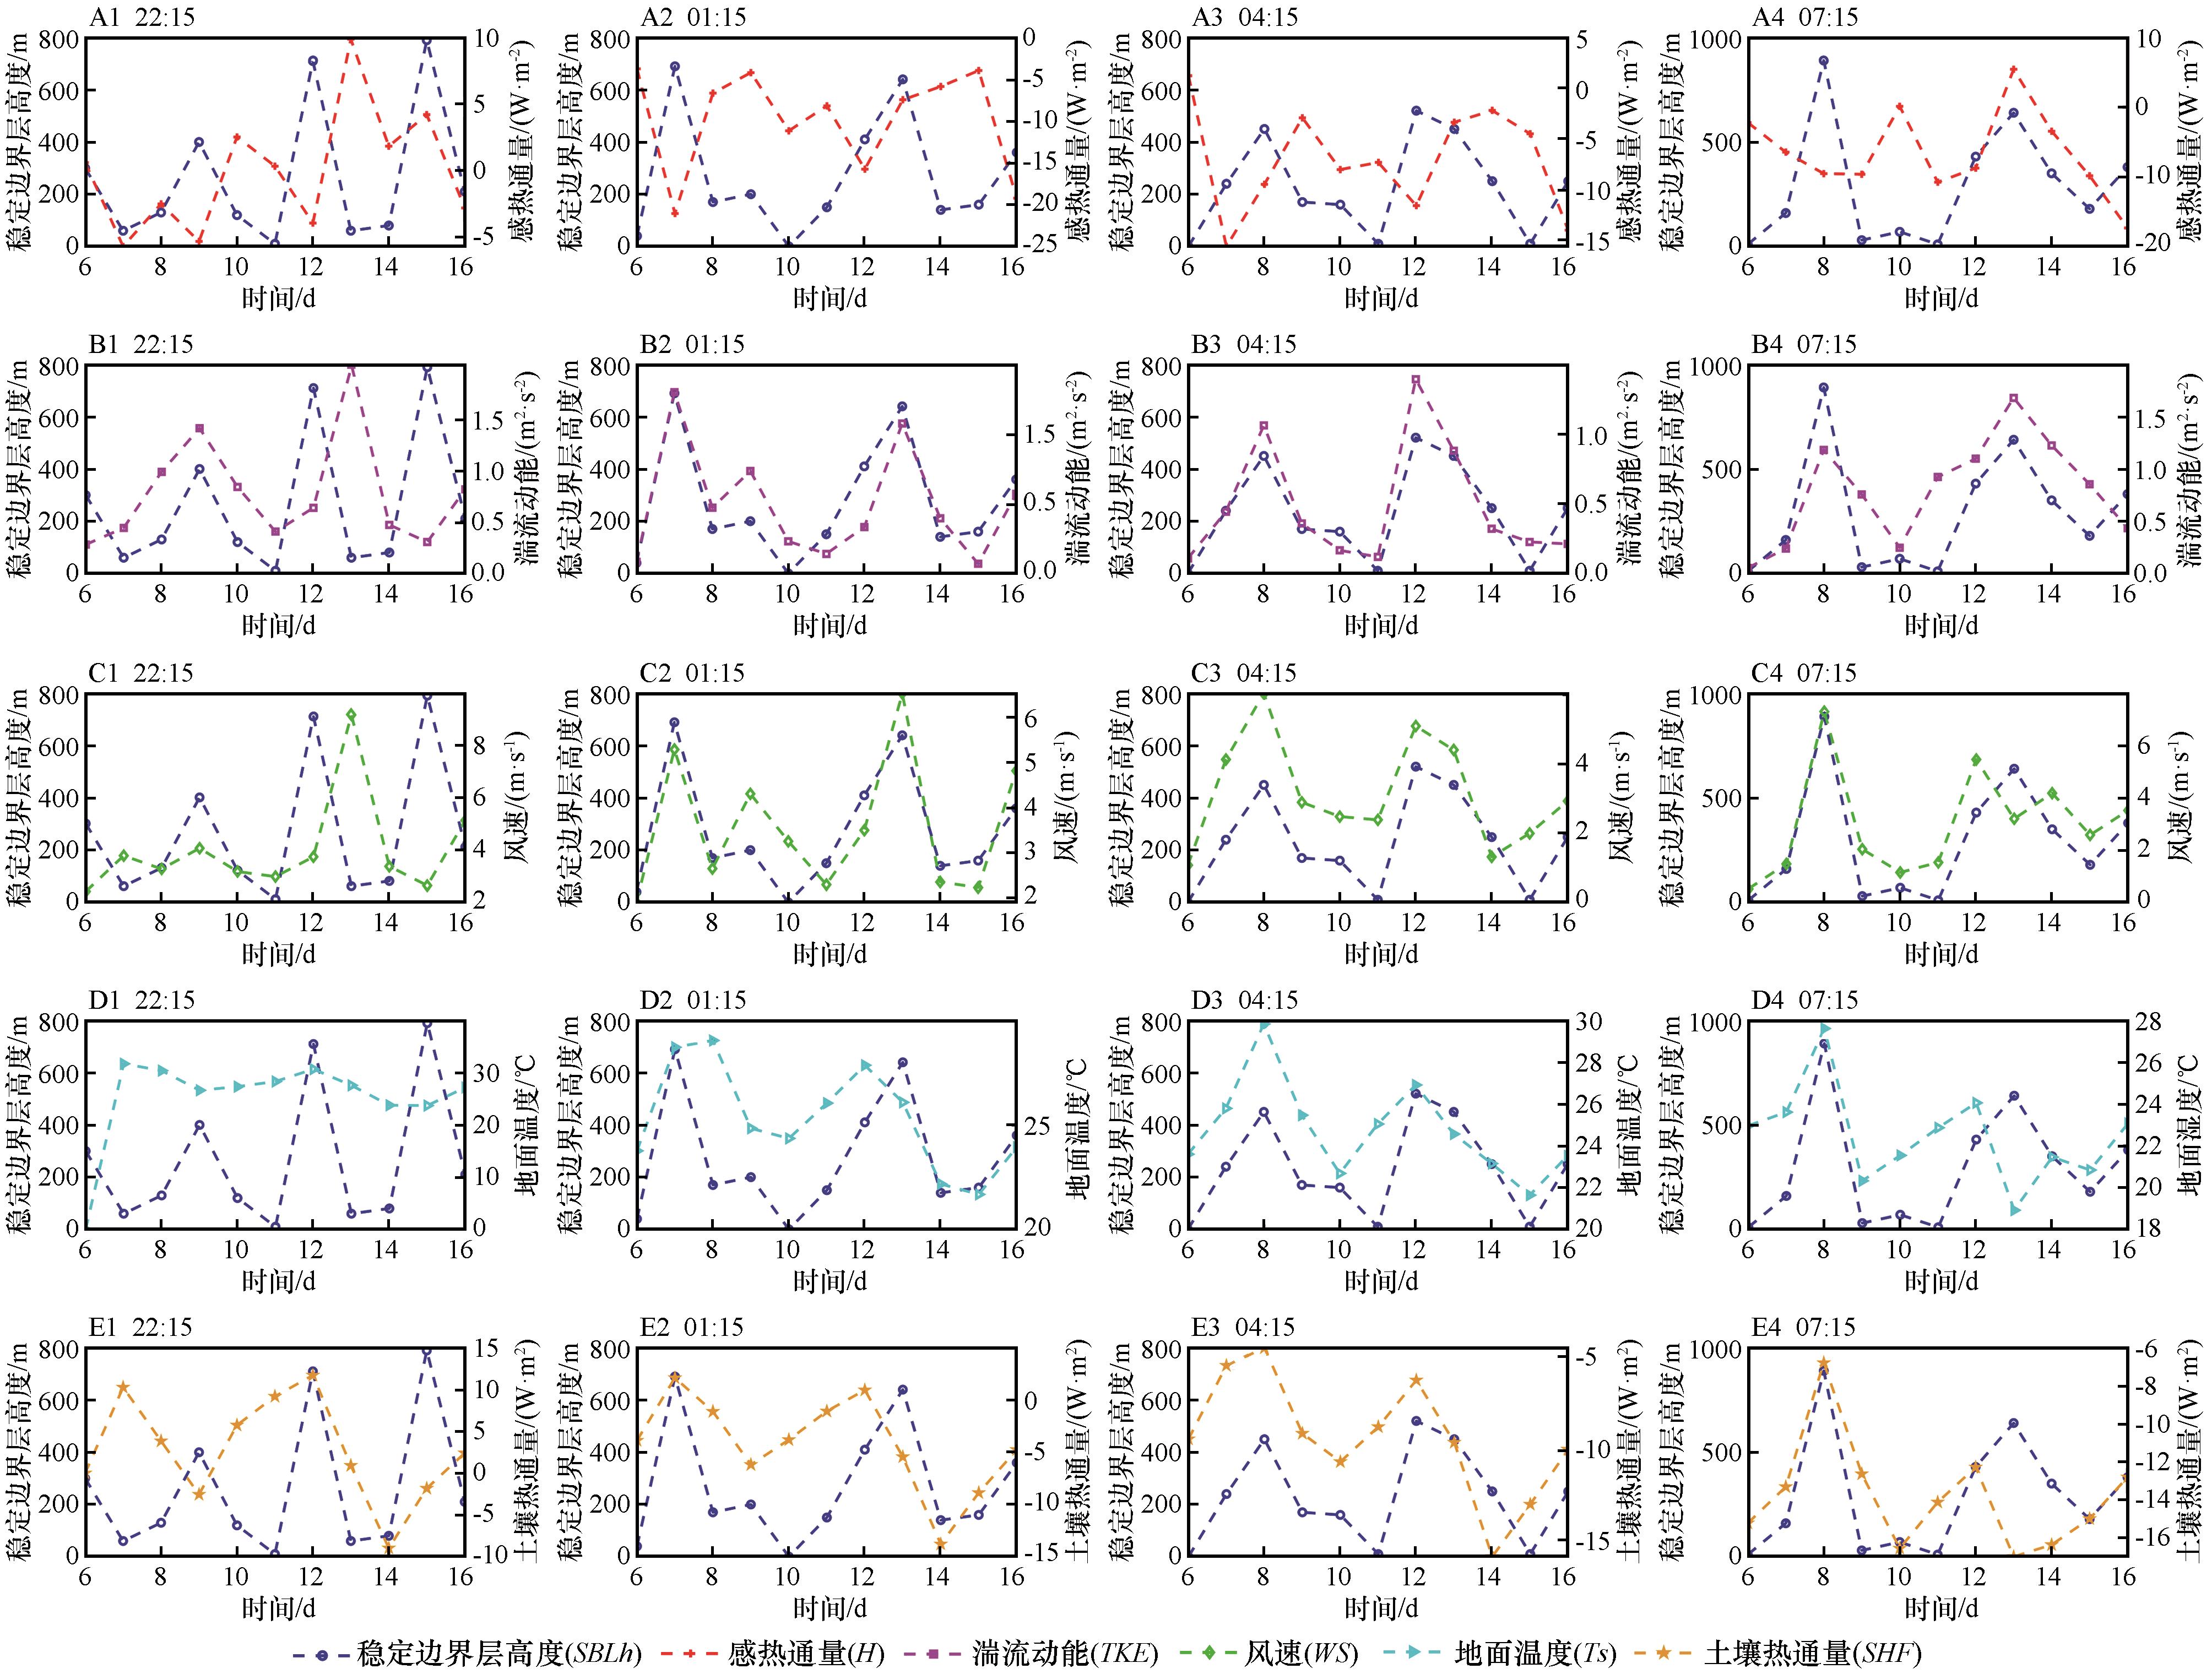
Fig.6 The variation curve between the height of stable boundary layer and near-surface meteorological factors
| 相关系数 | 感热通量(H) | 湍流动能(TKE) | 风速(WS) | 地通温度(Ts) | 土壤热通量(SHF) |
|---|---|---|---|---|---|
| 稳定边界层高度_Rib(22:15) | -0.12* | -0.22* | -0.27* | -0.21* | -0.02 |
| 稳定边界层高度_Rib (01:15) | -0.60* | 0.85* | 0.84* | 0.52* | 0.38* |
| 稳定边界层高度_Rib (04:15) | -0.22* | 0.90* | 0.79* | 0.63* | 0.47* |
| 稳定边界层高度_Rib (07:15) | 0.05* | 0.66* | 0.88* | 0.40* | 0.50* |
Table 3 Correlation between stable boundary layer height and near-surface meteorological factors
| 相关系数 | 感热通量(H) | 湍流动能(TKE) | 风速(WS) | 地通温度(Ts) | 土壤热通量(SHF) |
|---|---|---|---|---|---|
| 稳定边界层高度_Rib(22:15) | -0.12* | -0.22* | -0.27* | -0.21* | -0.02 |
| 稳定边界层高度_Rib (01:15) | -0.60* | 0.85* | 0.84* | 0.52* | 0.38* |
| 稳定边界层高度_Rib (04:15) | -0.22* | 0.90* | 0.79* | 0.63* | 0.47* |
| 稳定边界层高度_Rib (07:15) | 0.05* | 0.66* | 0.88* | 0.40* | 0.50* |
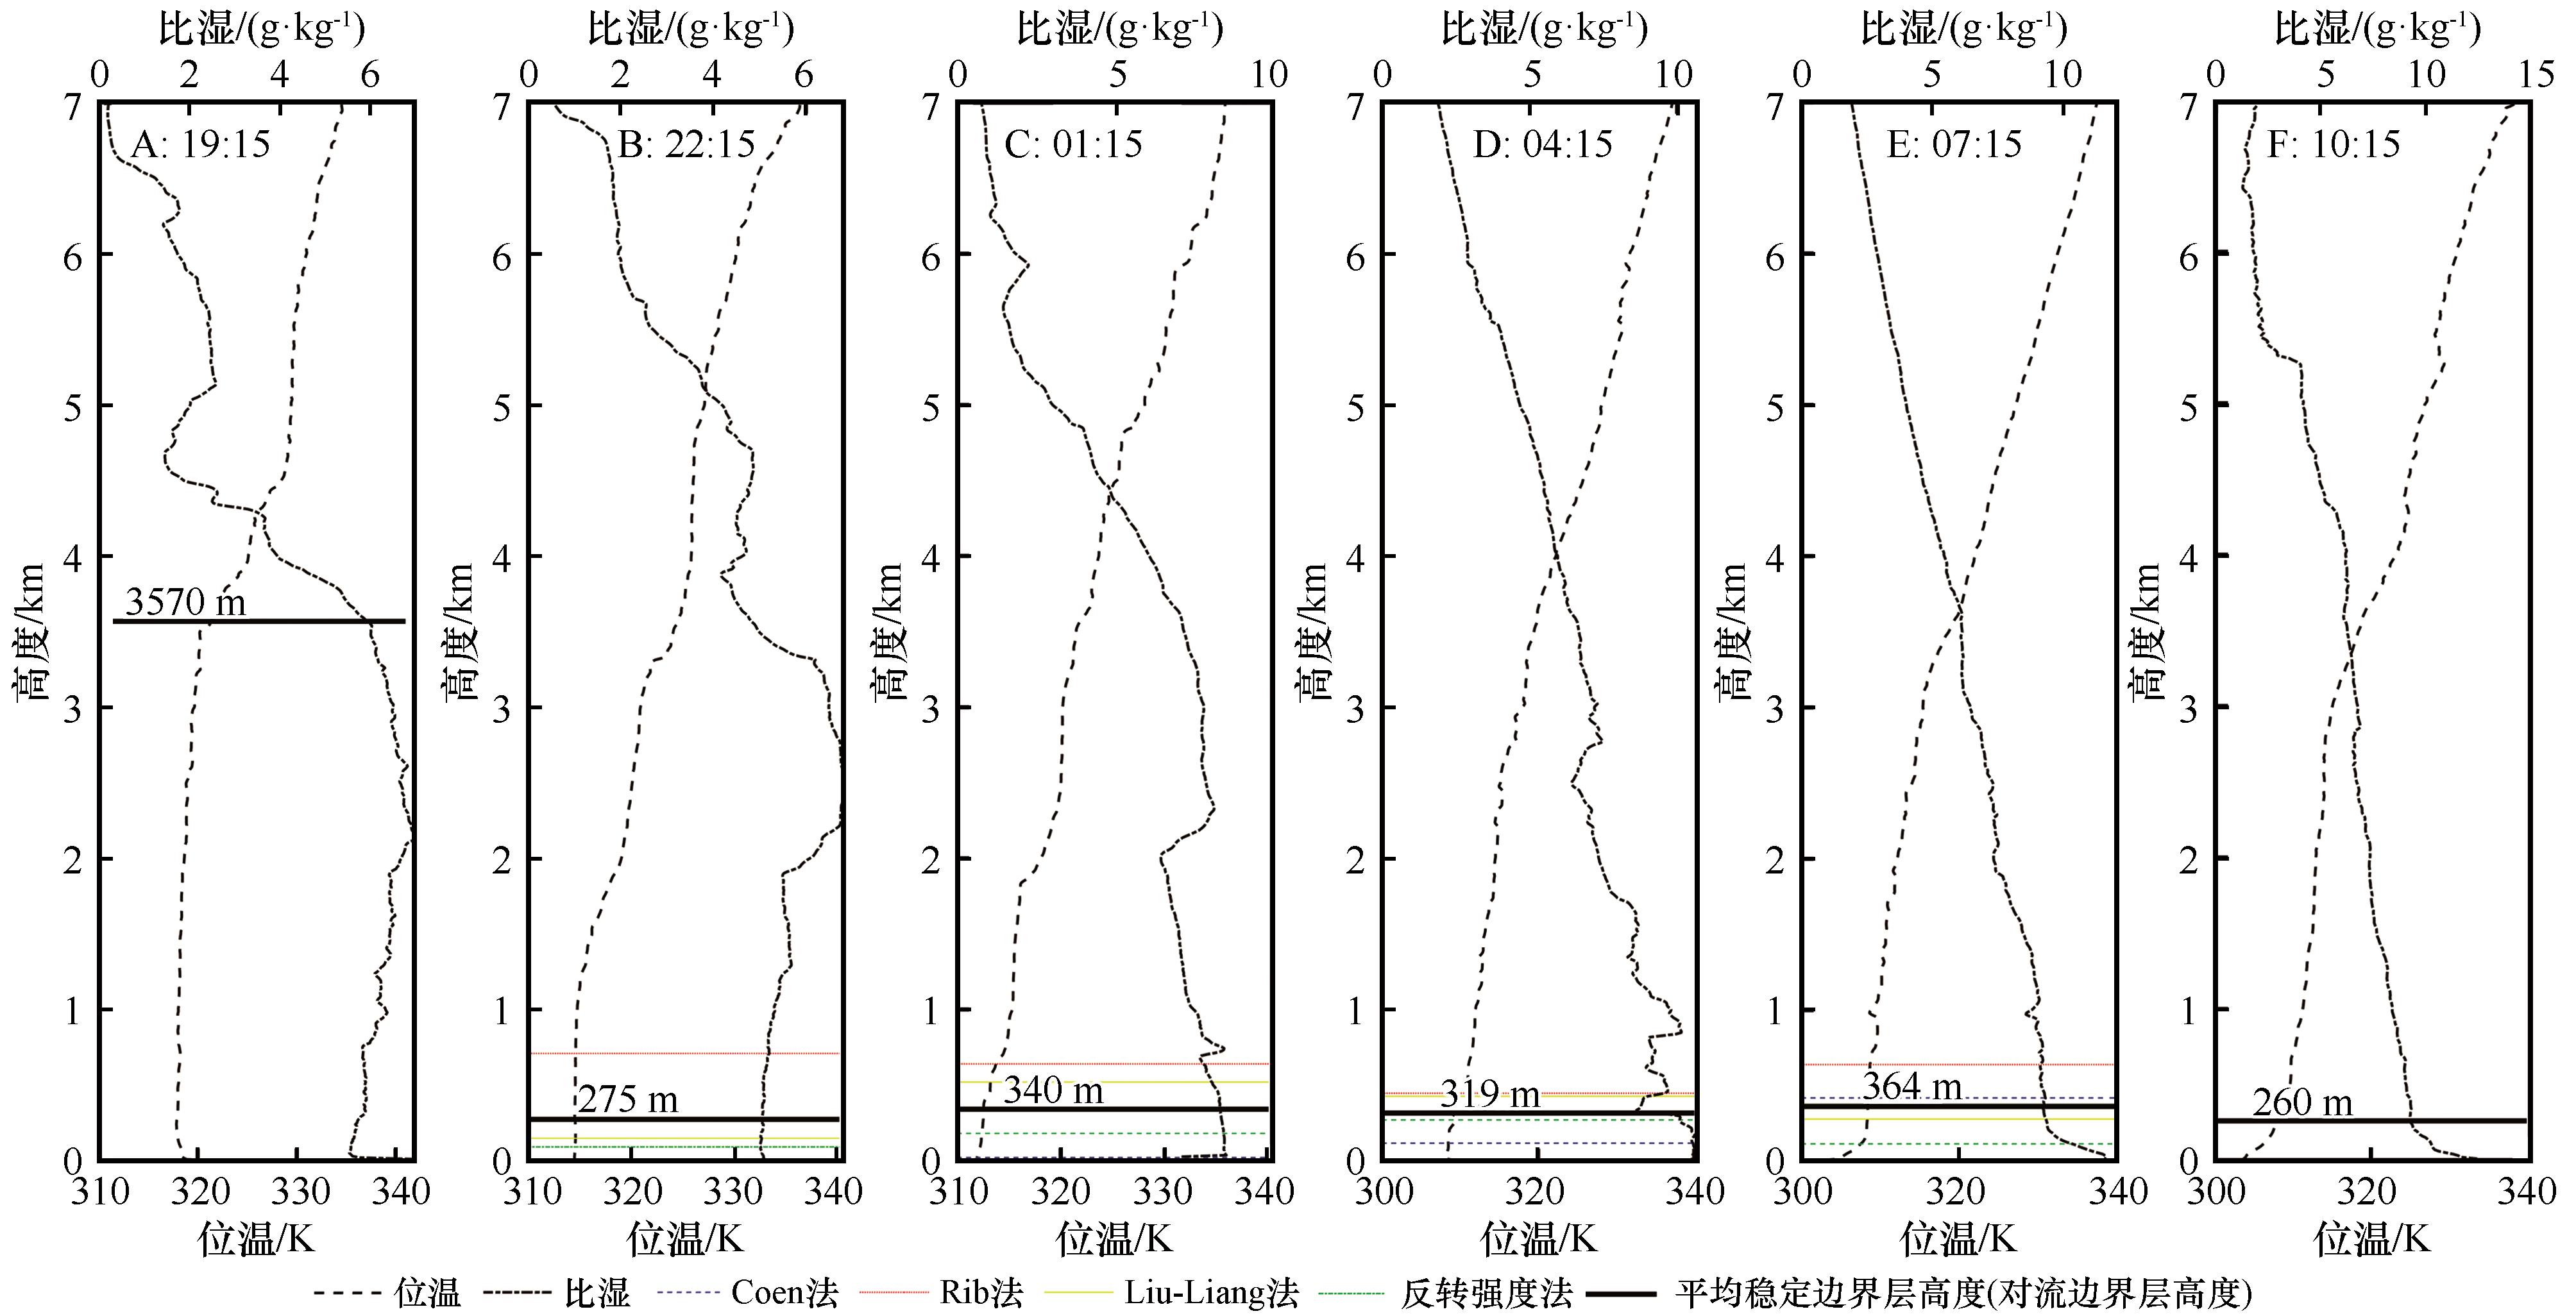
Fig.7 Case difference analysis of stable boundary layer height determined by different methods
| 1 | Stull R B.边界层气象学导论[M].青岛:青岛海洋大学出版社,1991:1-17. |
| 2 | 宋星灼,张宏升,刘新建,等.青藏高原中部地区不稳定大气边界层高度的确定与分析[J].北京大学学报(自然科学版),2006,42(3):328-333. |
| 3 | 徐桂荣,崔春光,周志敏,等.利用探空资料估算青藏高原及下游地区大气边界层高度[J].暴雨灾害,2014,33(3):217-227. |
| 4 | Steeneveld G J, Van de Wiel B J H, Holtslag A A M.Diagnostic equations for the stable boundary layer height:evaluation and dimensional analysis[J].Journal of Applied Meteorology and Climatology,2007,46(2):212-225. |
| 5 | Xiang Y, Zhang T S, Liu J G,et al.Atmosphere boundary layer height and its effect on air pollutants in Beijing during winter heavy pollution[J].Atmospheric Research,2019,215:305-316. |
| 6 | 师宇,胡非,丁伟宸,等.气溶胶激光雷达和无线电探空观测边界层高度的对比分析[J].气候与环境研究,2019,24(5):650-662. |
| 7 | Yi C, Davis K J, Bakwin P S,et al.Observed covariance between ecosystem carbon exchange and atmospheric boundary layer dynamics at a site in northern Wisconsin[J].Journal of Geophysical Research:Atmospheres,2004,109(D8):302-310. |
| 8 | Mahrt L, Heald R C.Comments on "Determining Height of the Nocturnal Boundary Layer"[J].Journal of Applied Meteorology,1979,18(3):383. |
| 9 | 杨飞跃.半干旱区边界层高度的确定方法比较及特征研究[D].兰州:兰州大学,2018. |
| 10 | 张宏昇,张小曳,李倩惠,等.大气边界层高度确定及应用研究进展[J].气象学报,2020,78(3):522-536. |
| 11 | Kosović B, Curry J A.A large eddy simulation study of a quasi-steady,stably stratified atmospheric boundary layer[J].Journal of the Atmospheric Sciences,2000,57(8):1052-1068. |
| 12 | Brost R A, Wyngaard J C.A model study of the stably stratified planetary boundary layer[J].Journal of Atmospheric Sciences,1978,35(8):1427-1440. |
| 13 | Melgarejo J W, Deardorff J W.Stability functions for the boundary-layer resistance laws based upon observed boundary-layer heights[J].Journal of the Atmospheric Sciences,1974,31(5):1324-1333. |
| 14 | 伏薇,李茂善,阴蜀城,等.西风南支与高原季风环流场下青藏高原大气边界层结构研究[J].高原气象,2022,41(1):190-203. |
| 15 | 乔娟.西北干旱区大气边界层时空变化特征及形成机理研究[D].北京:中国气象科学研究院,2009. |
| 16 | 吕雅琼,马耀明,李茂善,等.青藏高原纳木错湖区大气边界层结构分析[J].高原气象,2008,27(6):1205-1210. |
| 17 | 董议文,张蕴斐,张戈,等.不同边界层高度诊断方法对海洋大气边界层高度诊断的适用性研究[J].海洋预报,2021,38(6):64-72. |
| 18 | 周怡雯.台风云系、边界层和气溶胶物理光学特征变化综合遥感分析[D].南京:南京大学,2018. |
| 19 | Shi Y, Hu F, Xiao Z X,et al.Comparison of four different types of planetary boundary layer heights during a haze episode in Beijing[J].Science of the Total Environment,2020,711:134928-134928. |
| 20 | 蔡嘉仪,苗世光,李炬,等.基于激光云高仪反演全天边界层高度的两步曲线拟合法[J].气象学报,2020,78(5):864-876. |
| 21 | 岳平,牛生杰,张强,等.春季晴日蒙古高原半干旱荒漠草原地边界层结构的一次观测研究[J].高原气象,2008,27(4):757-763. |
| 22 | 彭艳梅,王舒,肖高翔,等.塔克拉玛干沙漠腹地塔中地区大气气溶胶散射系数影响因子[J].中国沙漠,2018,38(2):384-392. |
| 23 | 王敏仲,徐洪雄,王寅钧,等.塔克拉玛干沙漠夏季晴空对流边界层大涡模拟[J].中国沙漠,2018,38(6):1275-1286. |
| 24 | 贾瑞,刘玉芝,吴楚樵,等.2007—2017年中国沙尘气溶胶的三维分布特征及输送过程[J].中国沙漠,2019,39(6):108-117. |
| 25 | 金莉莉,李振杰,何清,等.塔克拉玛干沙漠北缘夏季典型晴天近地层湍流能谱特征[J].中国沙漠,2019,39(6):1-12. |
| 26 | 赵佳伟,何清,金莉莉,等.塔克拉玛干沙漠腹地秋季陆面过程特征[J].中国沙漠,2019,39(4):159-167. |
| 27 | 李祥余,何清,艾力·买买提明,等.塔中春季晴天近地层温度、湿度和风速廓线特征[J].干旱区地理,2008,31(3):389-396. |
| 28 | 刘强,何清,杨兴华,等.塔克拉玛干沙漠腹地冬季大气稳定度垂直分布特征分析[J].干旱气象,2009,27(4):308-313. |
| 29 | Wang M Z, Wei W, He Q,et al.Summer atmospheric boundary layer structure in the hinterland of Taklimakan Desert,China[J].Journal of Arid Land,2016,8(6):846-860. |
| 30 | 张建涛,何清,王敏仲,等.塔克拉玛干沙漠腹地夜间稳定边界层观测个例分析[J].高原气象,2018,37(3):826-836. |
| 31 | 张建涛,王敏仲,何清,等.塔克拉玛干沙漠腹地夏季夜间低空急流变化特征[J].中国沙漠,2020,40(5):89-100. |
| 32 | Wei W, Wang M Z, Zhang H S,et al.Diurnal characteristics of turbulent intermittency in the Taklimakan Desert[J].Meteorology and Atmospheric Physics,2019,131(3):287-297. |
| 33 | 朱从祯,赵天良,孟露,等.浮尘气溶胶对沙漠大气边界层结构作用的昼夜差异[J].干旱区研究,2022,39(4):1017-1026. |
| 34 | 魏文寿,王敏仲,何清,等.塔克拉玛干沙漠腹地近地边界层温湿廓线与热量平衡分析[J].科学通报,2008,53():18-24. |
| 35 | 何清,金莉莉.塔克拉玛干沙漠气象野外科学试验成果概述[J].新疆大学学报(自然科学版,中英文),2021,38(3):334-354. |
| 36 | 孔丹.塔克拉玛干沙漠腹地2007年春夏季辐射及沙尘气溶胶特征分析[D].乌鲁木齐:新疆师范大学,2008. |
| 37 | 李振杰.塔克拉玛干沙漠塔中近地层湍流特征研究[D].乌鲁木齐:新疆师范大学,2010. |
| 38 | 赵佳伟.塔克拉玛干沙漠腹地高大沙垄微气象观测研究[D].乌鲁木齐:新疆师范大学,2020. |
| 39 | Liu S Y, Liang X Z.Observed diurnal cycle climatology of planetary boundary layer height[J].Journal of Climate,2010,23(21):5790-5809. |
| 40 | Coen M C, Praz C, Haefele A,et al.Determination and climatology of the planetary boundary layer height above the Swiss plateau by in situ and remote sensing measurements as well as by the COSMO-2 model[J].Atmospheric Chemistry and Physics,2014,14(23):13205-13221. |
| 41 | 田野,刘旭林,于永涛,等.北京城区大气边界层高度的反演研究[J].气象科技,2022,50(1):9-20. |
| 42 | 许智棋.土壤湿度和海拔高度对中国夏季边界层高度的影响及其区域性差异[D].南京:南京信息工程大学,2021. |
| 43 | 涂静.黄东海大气边界层高度时空变化特征[D].青岛:中国海洋大学,2011. |
| 44 | Hyun Y K, Kim K E, Ha K J.A comparison of methods to estimate the height of stable boundary layer over a temperate grassland[J].Agricultural and Forest Meteorology,2005,132(1/2):132-142. |
| 45 | Sun H J, Shi H R, Chen H Y,et al.Evaluation of a method for calculating the height of the stable boundary layer based on wind profile lidar and turbulent fluxes[J].Remote Sensing,2021,13(18):3596. |
| 46 | 王雨婷.中国大气边界层高度特征研究及一次飓风大涡模拟试验[D].杭州:浙江大学,2017. |
| [1] | Yayun Li, Wei Cheng, Ning Wang, Xin Li, Rui Gao. Comparative study on the characteristic of spring sandstorms and the related meteorological factors of the Taklimakan Desert and Gobi Desert [J]. Journal of Desert Research, 2023, 43(4): 1-9. |
| [2] | Jingping Chen, Ziying Yu, Fan Yang, Mi Wang, Han Hu, Guanzhong Ni, Xin Gao, Xin Wang. Particle size characteristics of sandstorm and surface sand at Tazhong area of Taklimakan Desert, China [J]. Journal of Desert Research, 2023, 43(2): 150-158. |
| [3] | Dagang Wang, Yang Yu, Lingxiao Sun, Jing He, Malik Ireneusz, Wistuba Malgorzata, Fengqing Jiang, Ruide Yu. Adaptability evaluation and modification of ET0 models in a typical oases on southern margin of the Taklimakan Desert [J]. Journal of Desert Research, 2021, 41(6): 41-53. |
| [4] | Kailu Liu, Xinping Wu, Yongqiang Liu, Mamtimin Ali, Fan Yang, Qing He. Estimation of hourly surface net radiation in Taklimakan Desert based on multi-source remote sensing data and reanalysis data [J]. Journal of Desert Research, 2021, 41(5): 51-61. |
| [5] | Jun Liu, Zhongling Guo, Chunping Chang, Rende Wang, Jifeng Li, Qing Li, Xuyang Wang. Potential wind erosion simulation in the agro-pastoral ecotone of northern China using RWEQ and WEPS models [J]. Journal of Desert Research, 2021, 41(2): 27-37. |
| [6] | Shuxing Xu, Qianqian Wu, Dianxue Qiao, Yinglin Mu, Xiao Zhang, Yanshu Liu, Xiaohui Yang, Zhongjie Shi. Spatiotemporal pattern and effecting factors of wildfire in eastern Mongolia [J]. Journal of Desert Research, 2021, 41(2): 83-91. |
| [7] | Jiantao Zhang, Minzhong Wang, Qing He, Honglin Pan, Lu Meng, Yanhui Wang. Variation characteristics of nocturnal low-level jet in summer over the hinterland of Taklimakan Desert [J]. Journal of Desert Research, 2020, 40(5): 89-100. |
| [8] | Zhao Jiawei, He Qing, Jin Lili, Li Zhenjie, Ali Mamtimin, Zhang Jiantao, Aikedai Shalamu. The surface layer micrometeorological characteristics of fluctuated surface in the hinterland of Taklimakan Desert [J]. Journal of Desert Research, 2020, 40(2): 144-155. |
| [9] | Li Aimin, Han Zhiwen. Relationship between moving speed and morphological parameters of barchan dunes [J]. Journal of Desert Research, 2020, 40(1): 29-40. |
| [10] | Jin Lili, Li Zhenjie, He Qing, Ali Mamtimin, Huo Wen, Zhang Jiantao. Characteristic of Surface-Layer Turbulence Spectra on Typical Sunny Days over the Northern Marginal Zone of the Taklimakan Desert [J]. Journal of Desert Research, 2019, 39(6): 1-12. |
| [11] | Zhao Jiawei, He Qing, Jin Lili, Li Zhenjie, Ali Mamtimin, Zhang Jiantao. Characteristics of Land Surface Processes in the Hinterland of Taklimakan Desert in Autumn [J]. Journal of Desert Research, 2019, 39(4): 159-167. |
| [12] | Zhou Xueying, Jia Jian, Liu Guoqiang, Wang Fang, Qiu Huimin, Sun Huaiqin. Characteristics of Precipitation at Hinterland of Taklimakan Desert, China [J]. Journal of Desert Research, 2019, 39(1): 187-194. |
| [13] | Wang Minzhong, Xu Hongxiong, Wang Yinjun, Ali Mamtimin, Zhang Jiantao. Large-Eddy Simulation of Summer Clear Sky Convective Boundary Layer in the Taklimakan Desert [J]. Journal of Desert Research, 2018, 38(6): 1275-1286. |
| [14] | Jin Lili, Li Zhenjie, He Qing, Liu Yongqiang, Ali Mamtimin, Xin Yu. Evaluation on Modeling of Land-Atmosphere Interaction in the Northern Marginal Zone of Taklimakan Desert with CoLM and Correction [J]. Journal of Desert Research, 2018, 38(6): 1287-1302. |
| [15] | Li Aimin, Han Zhiwen, Zhong Shuai, Guo Caiyun. Attributive Parameter Extraction of the Barchan Dune Based on CASS and ArcGIS [J]. Journal of Desert Research, 2018, 38(3): 484-491. |
| Viewed | ||||||
|
Full text |
|
|||||
|
Abstract |
|
|||||
©2018Journal of Desert Research
Tel:0931-8267545
Email:caiedit@lzb.ac.cn;desert@lzb.ac.cn
Support:Magtech