中国沙漠 ›› 2023, Vol. 43 ›› Issue (5): 18-30.DOI: 10.7522/j.issn.1000-694X.2023.00026
蒋小芳1,3( ), 徐青霞4, 段翰晨1,2, 廖杰1,2, 郭平林1,3, 黄翠华1,2, 薛娴1,2()
收稿日期:2023-02-06
修回日期:2023-03-22
出版日期:2023-09-20
发布日期:2023-09-27
通讯作者:
薛娴
作者简介:薛娴(E-mail: xianxue@lzb.ac.cn)基金资助:
Xiaofang Jiang1,3(), Qingxia Xu4, Hanchen Duan1,2, Jie Liao1,2, Pinglin Guo1,3, Cuihua Huang1,2, Xian Xue1,2()
Received:2023-02-06
Revised:2023-03-22
Online:2023-09-20
Published:2023-09-27
Contact:
Xian Xue
摘要:
位于中国西北干旱区东部的景电灌区是黄河景泰川电力提灌二期工程覆盖的重要地区。不合理的水资源利用和区内排水不畅导致该区成为次生盐渍化发生的重点区域。为更好地预测景电灌区的土壤盐渍化问题,服务盐渍化防治和盐渍土改良的国家需求,基于地表实测高光谱反射率和土壤电导率数据,从模型稳定性、噪声问题、共线性问题和准确度4个方面对比分析了深度神经网络(Deep neural network,DNN)、分布式随机森林(Distributed random forest,DRF)和梯度提升机(Gradient boosting machine,GBM)3个模型在景电灌区土壤盐分预测方面的适用性。结果表明:(1)实测高光谱反射率数据与土壤电导率之间存在较强的相关性,高光谱数据为土壤盐分预测研究提供了便利;(2)DNN模型的稳定性高,对噪声和共线性问题的处理能力更强,模拟准确度相对较高,而DRF和GBM模型模拟结果差别较小。DNN模型更适于景电灌区土壤盐分预测研究,这在模型适用性方面为该区域的土壤盐渍化研究提供了参考。
中图分类号:
蒋小芳, 徐青霞, 段翰晨, 廖杰, 郭平林, 黄翠华, 薛娴. 黄河景电灌区土壤盐渍化反演的多模型对比[J]. 中国沙漠, 2023, 43(5): 18-30.
Xiaofang Jiang, Qingxia Xu, Hanchen Duan, Jie Liao, Pinglin Guo, Cuihua Huang, Xian Xue. Multi-model comparison on soil salinization inversion in Jingdian irrigation area of the Yellow River[J]. Journal of Desert Research, 2023, 43(5): 18-30.
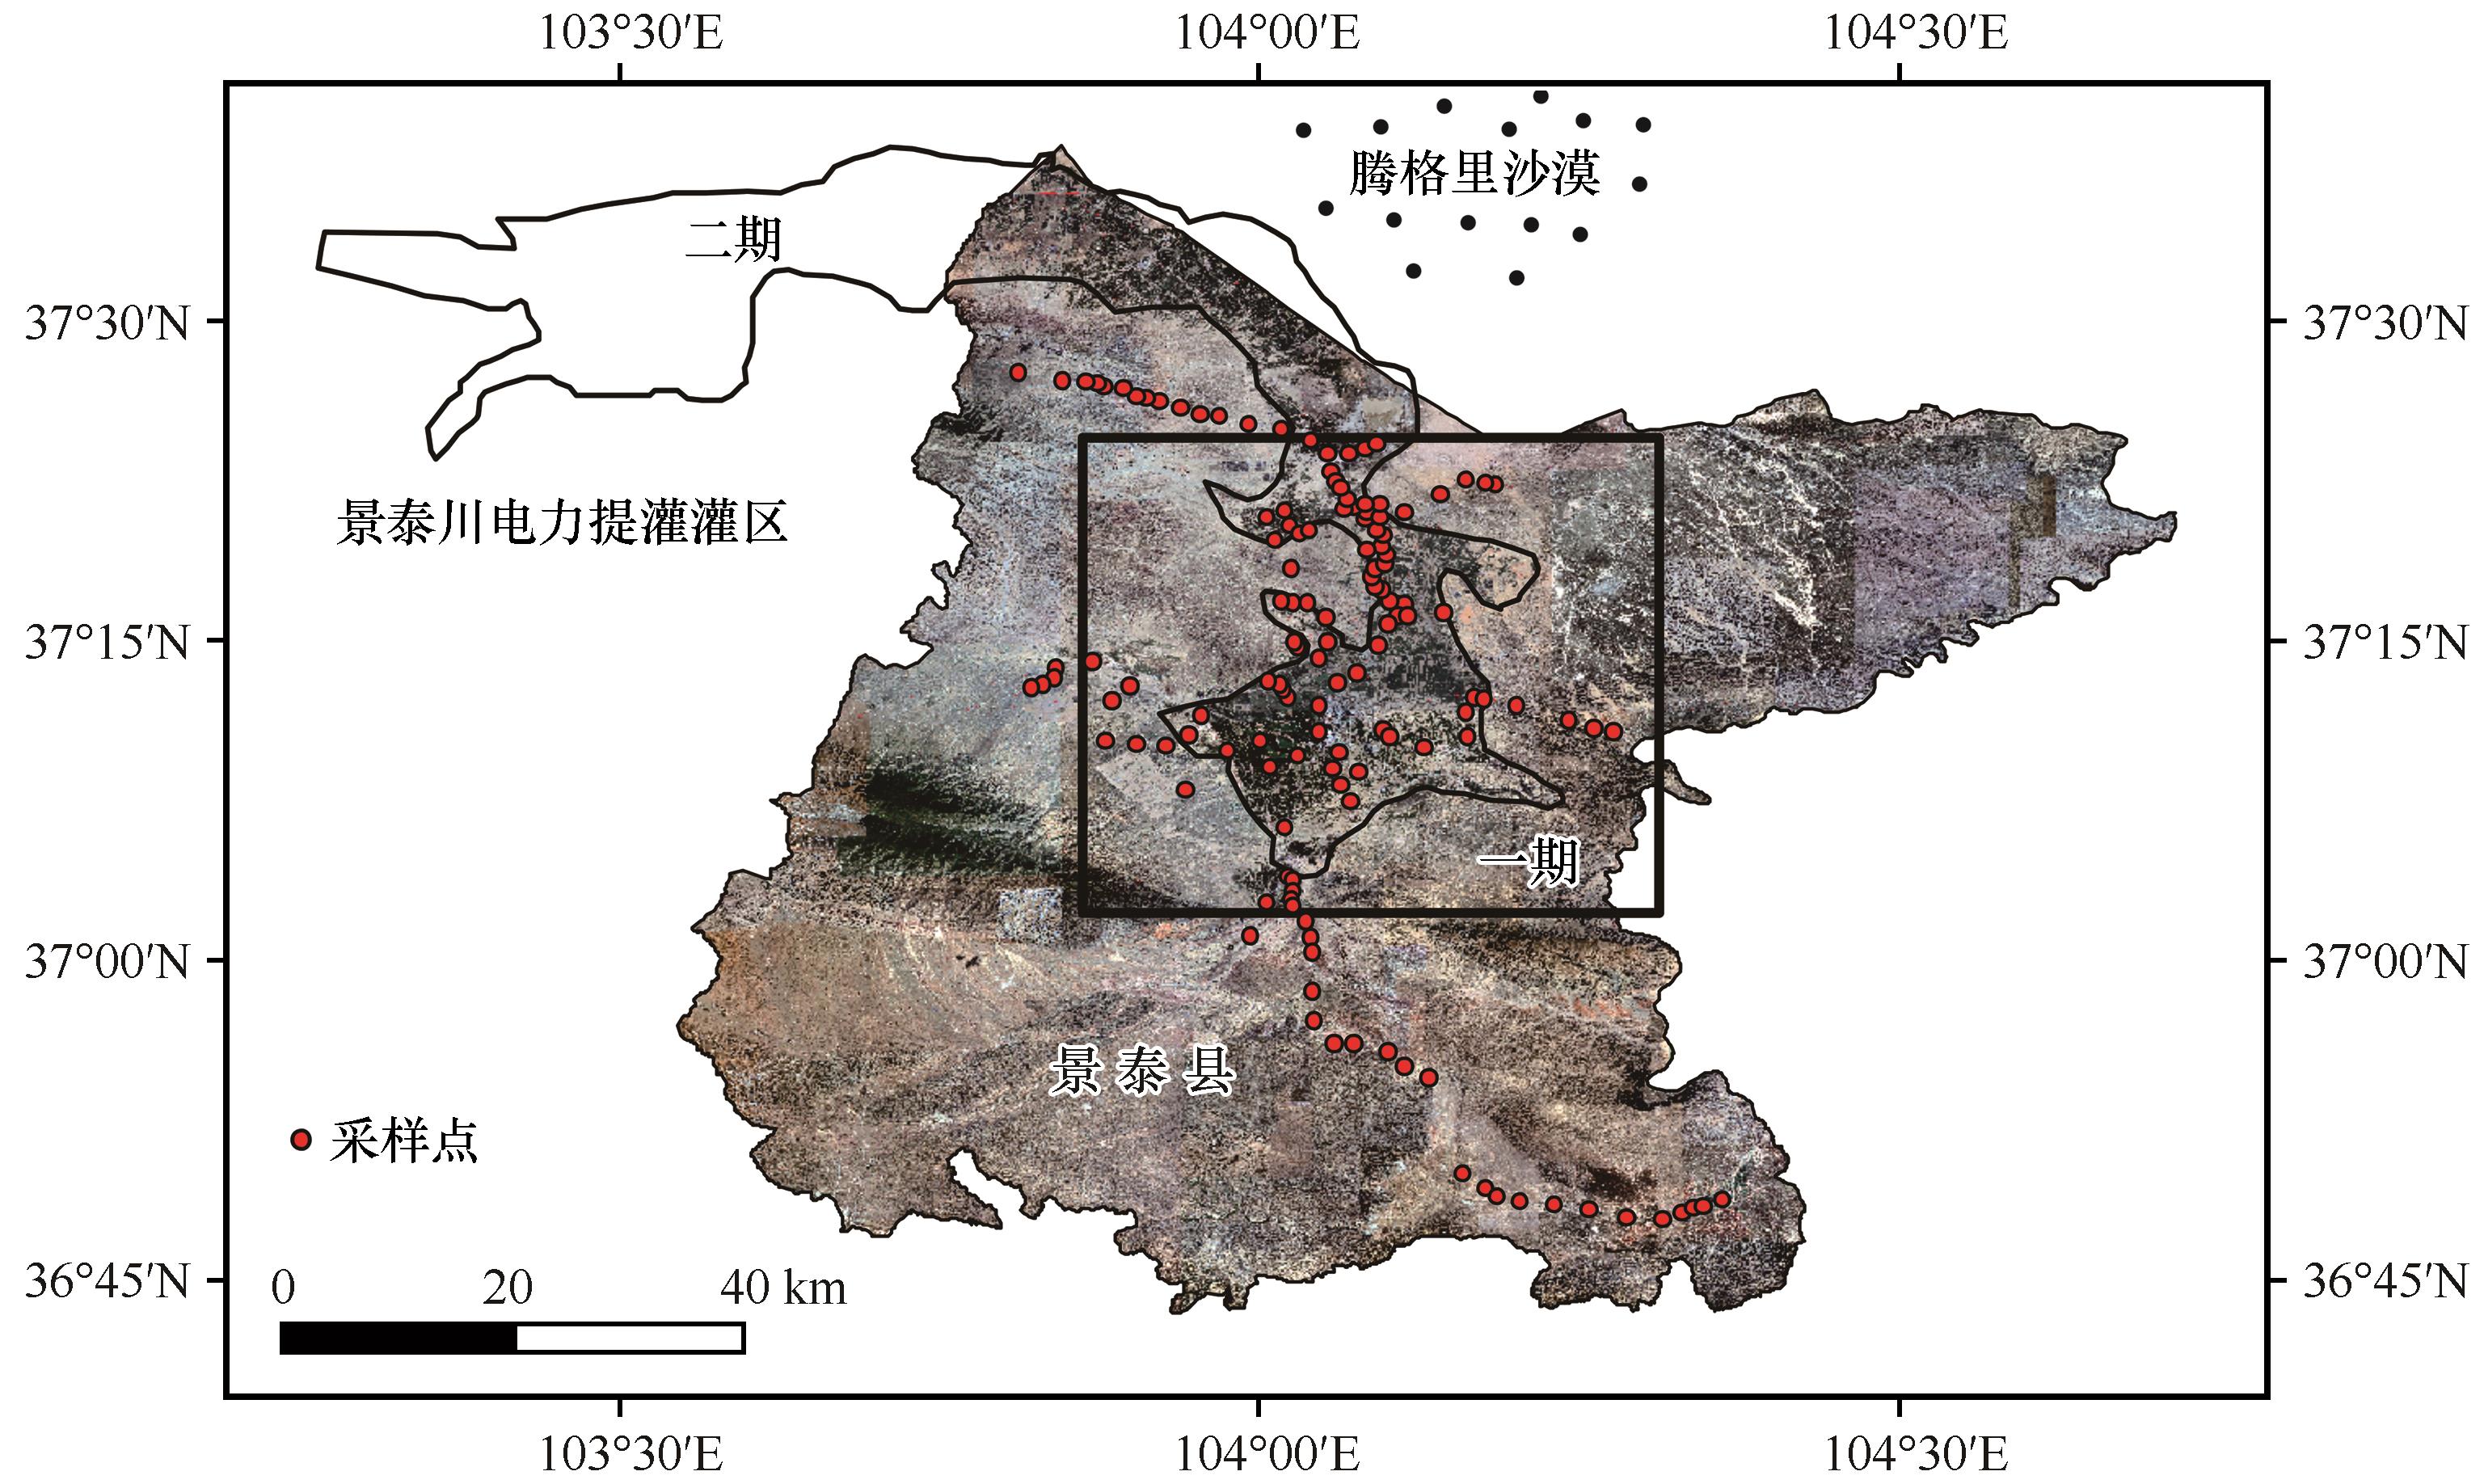
图1 研究区地理位置和土壤取样点分布
Fig.1 Location of the study area and soil samples
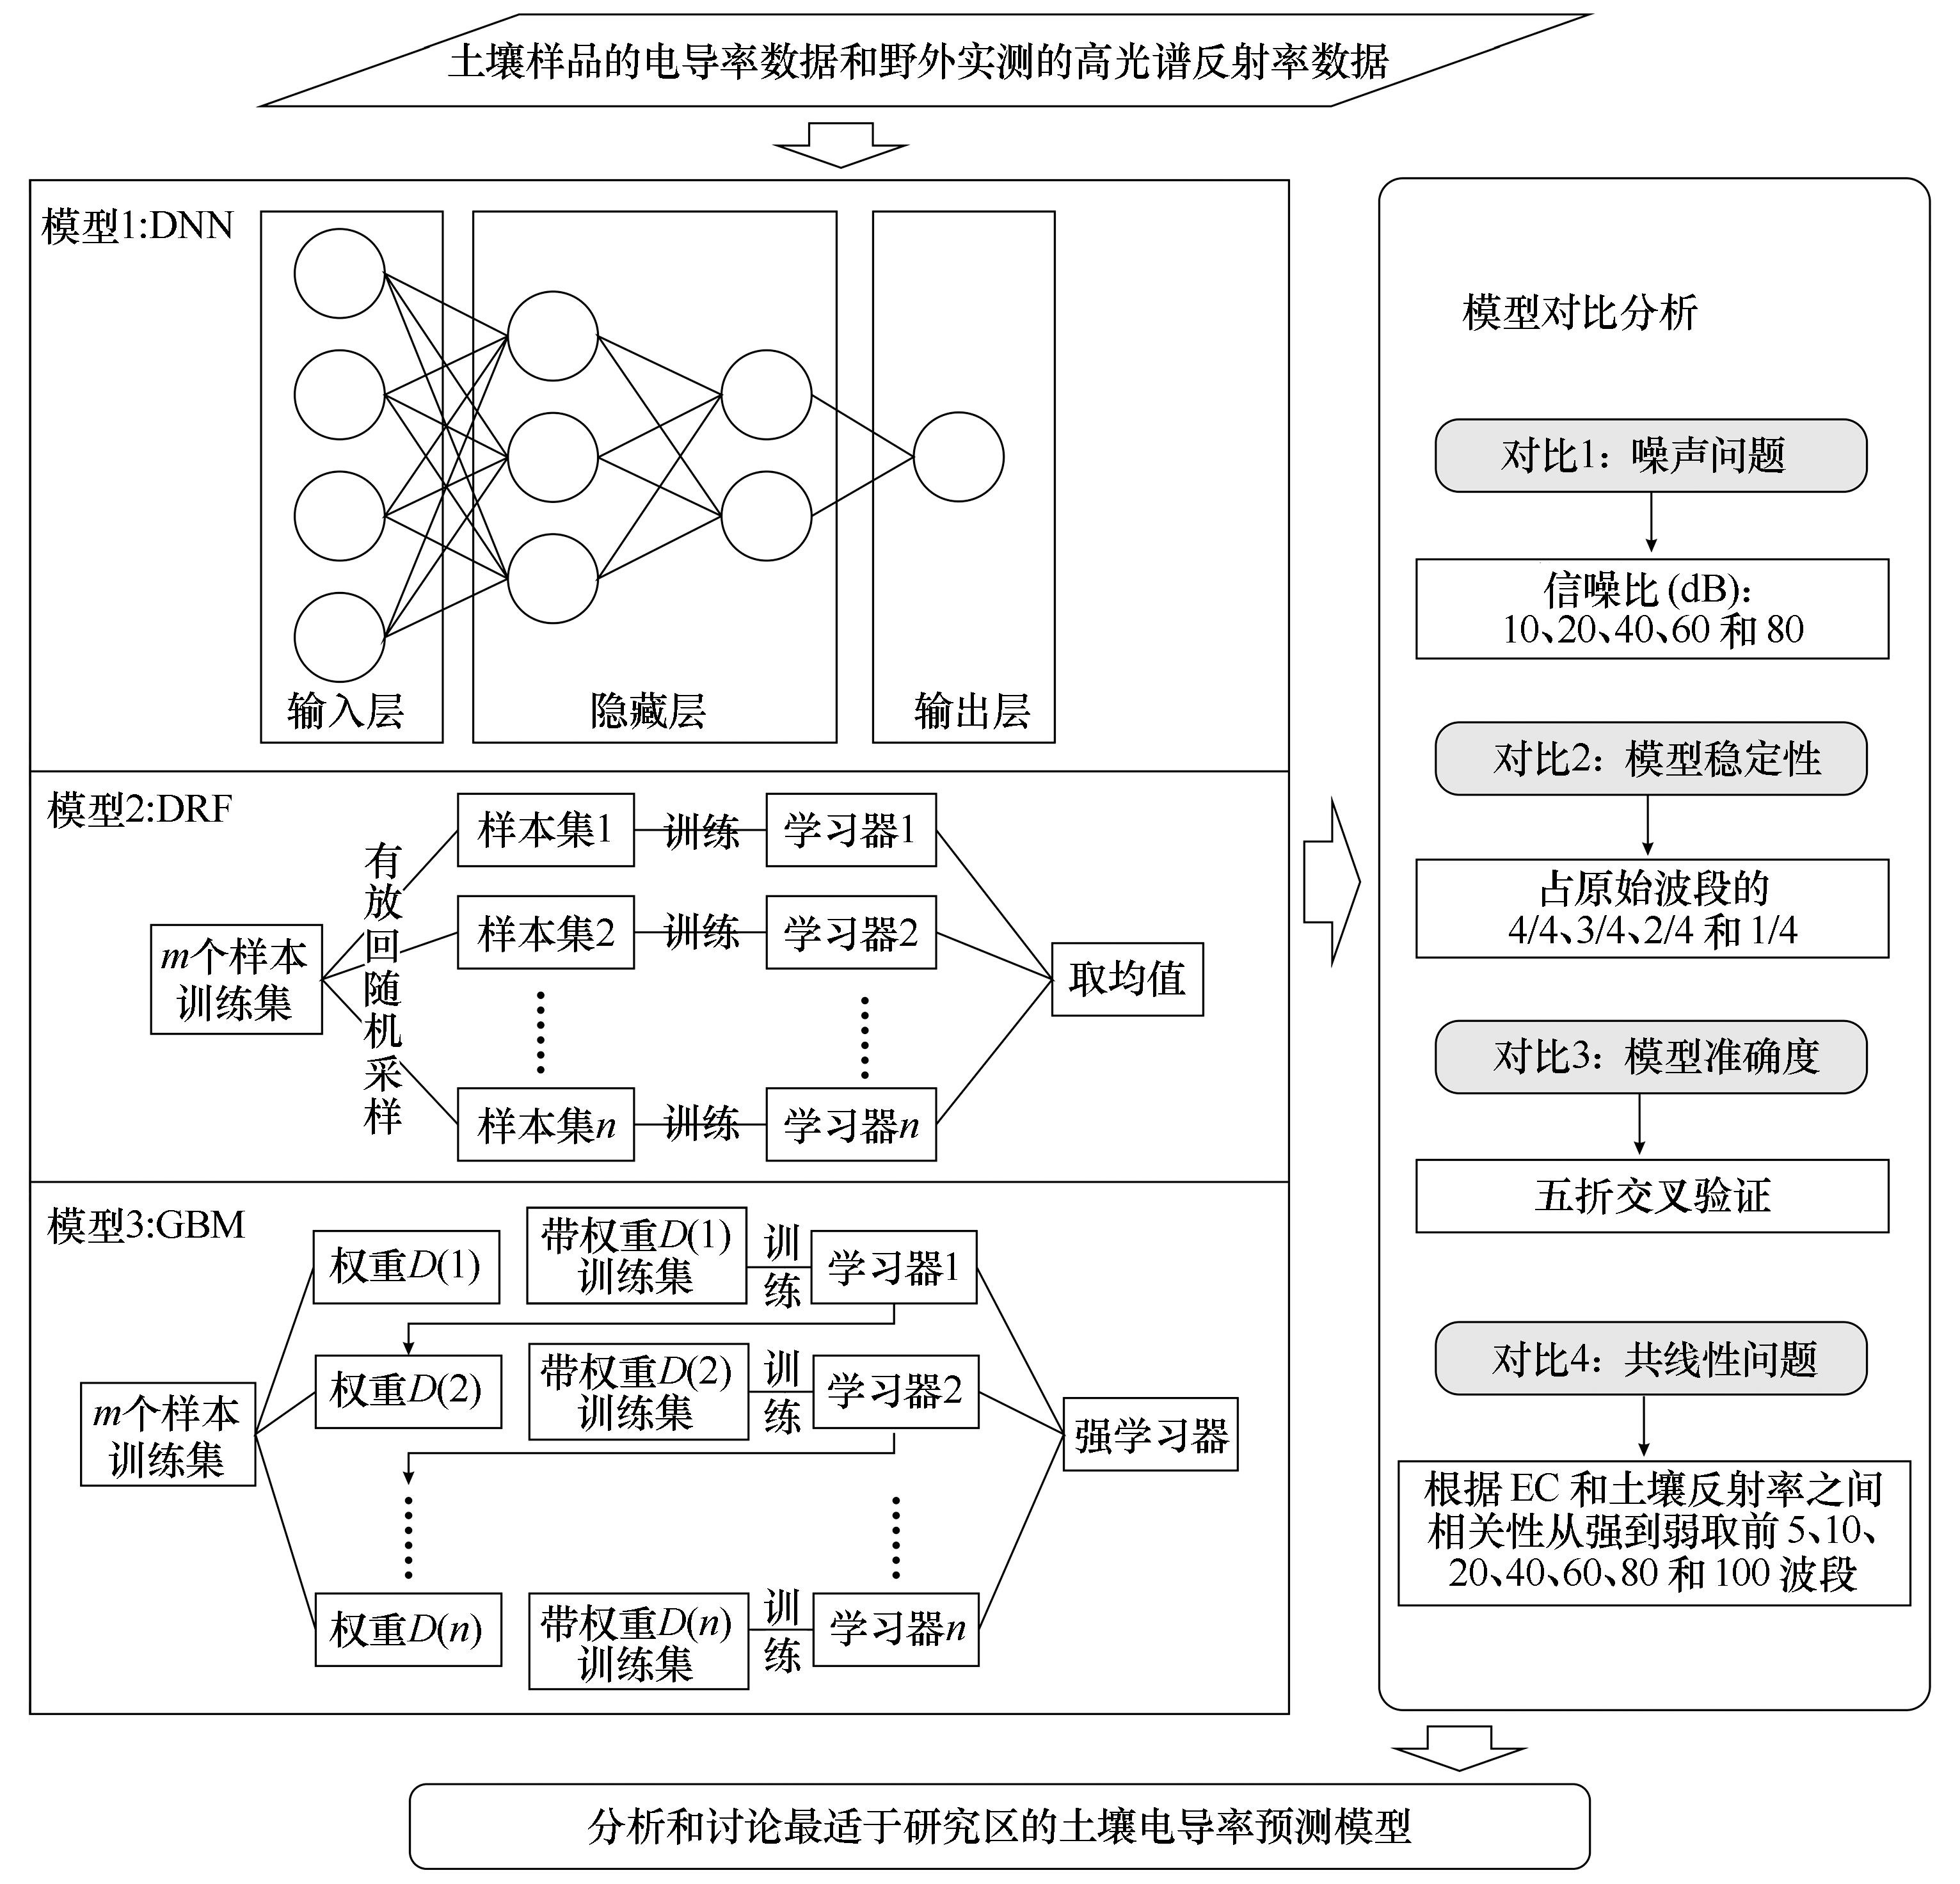
图2 技术流程
Fig.2 Technical flow chart of this study
| 数据集 | 样品 数目 | 最大值 /(mS·cm-1) | 最小值 /(mS·cm-1) | 平均值 /(mS·cm-1) | 中位数 /(mS·cm-1) | 标准差 /(mS·cm-1) | 变异 系数 |
|---|---|---|---|---|---|---|---|
| 训练集 | 104 | 23.00 | 0.04 | 2.93 | 0.34 | 5.20 | 1.77 |
| 验证集 | 35 | 25.20 | 0.08 | 3.57 | 0.22 | 6.57 | 1.84 |
| 全部样品 | 139 | 25.20 | 0.04 | 3.09 | 0.28 | 5.56 | 1.80 |
表1 景电灌区土壤样本电导率数据统计特征
Table 1 Statistical characteristics of soil samples
| 数据集 | 样品 数目 | 最大值 /(mS·cm-1) | 最小值 /(mS·cm-1) | 平均值 /(mS·cm-1) | 中位数 /(mS·cm-1) | 标准差 /(mS·cm-1) | 变异 系数 |
|---|---|---|---|---|---|---|---|
| 训练集 | 104 | 23.00 | 0.04 | 2.93 | 0.34 | 5.20 | 1.77 |
| 验证集 | 35 | 25.20 | 0.08 | 3.57 | 0.22 | 6.57 | 1.84 |
| 全部样品 | 139 | 25.20 | 0.04 | 3.09 | 0.28 | 5.56 | 1.80 |
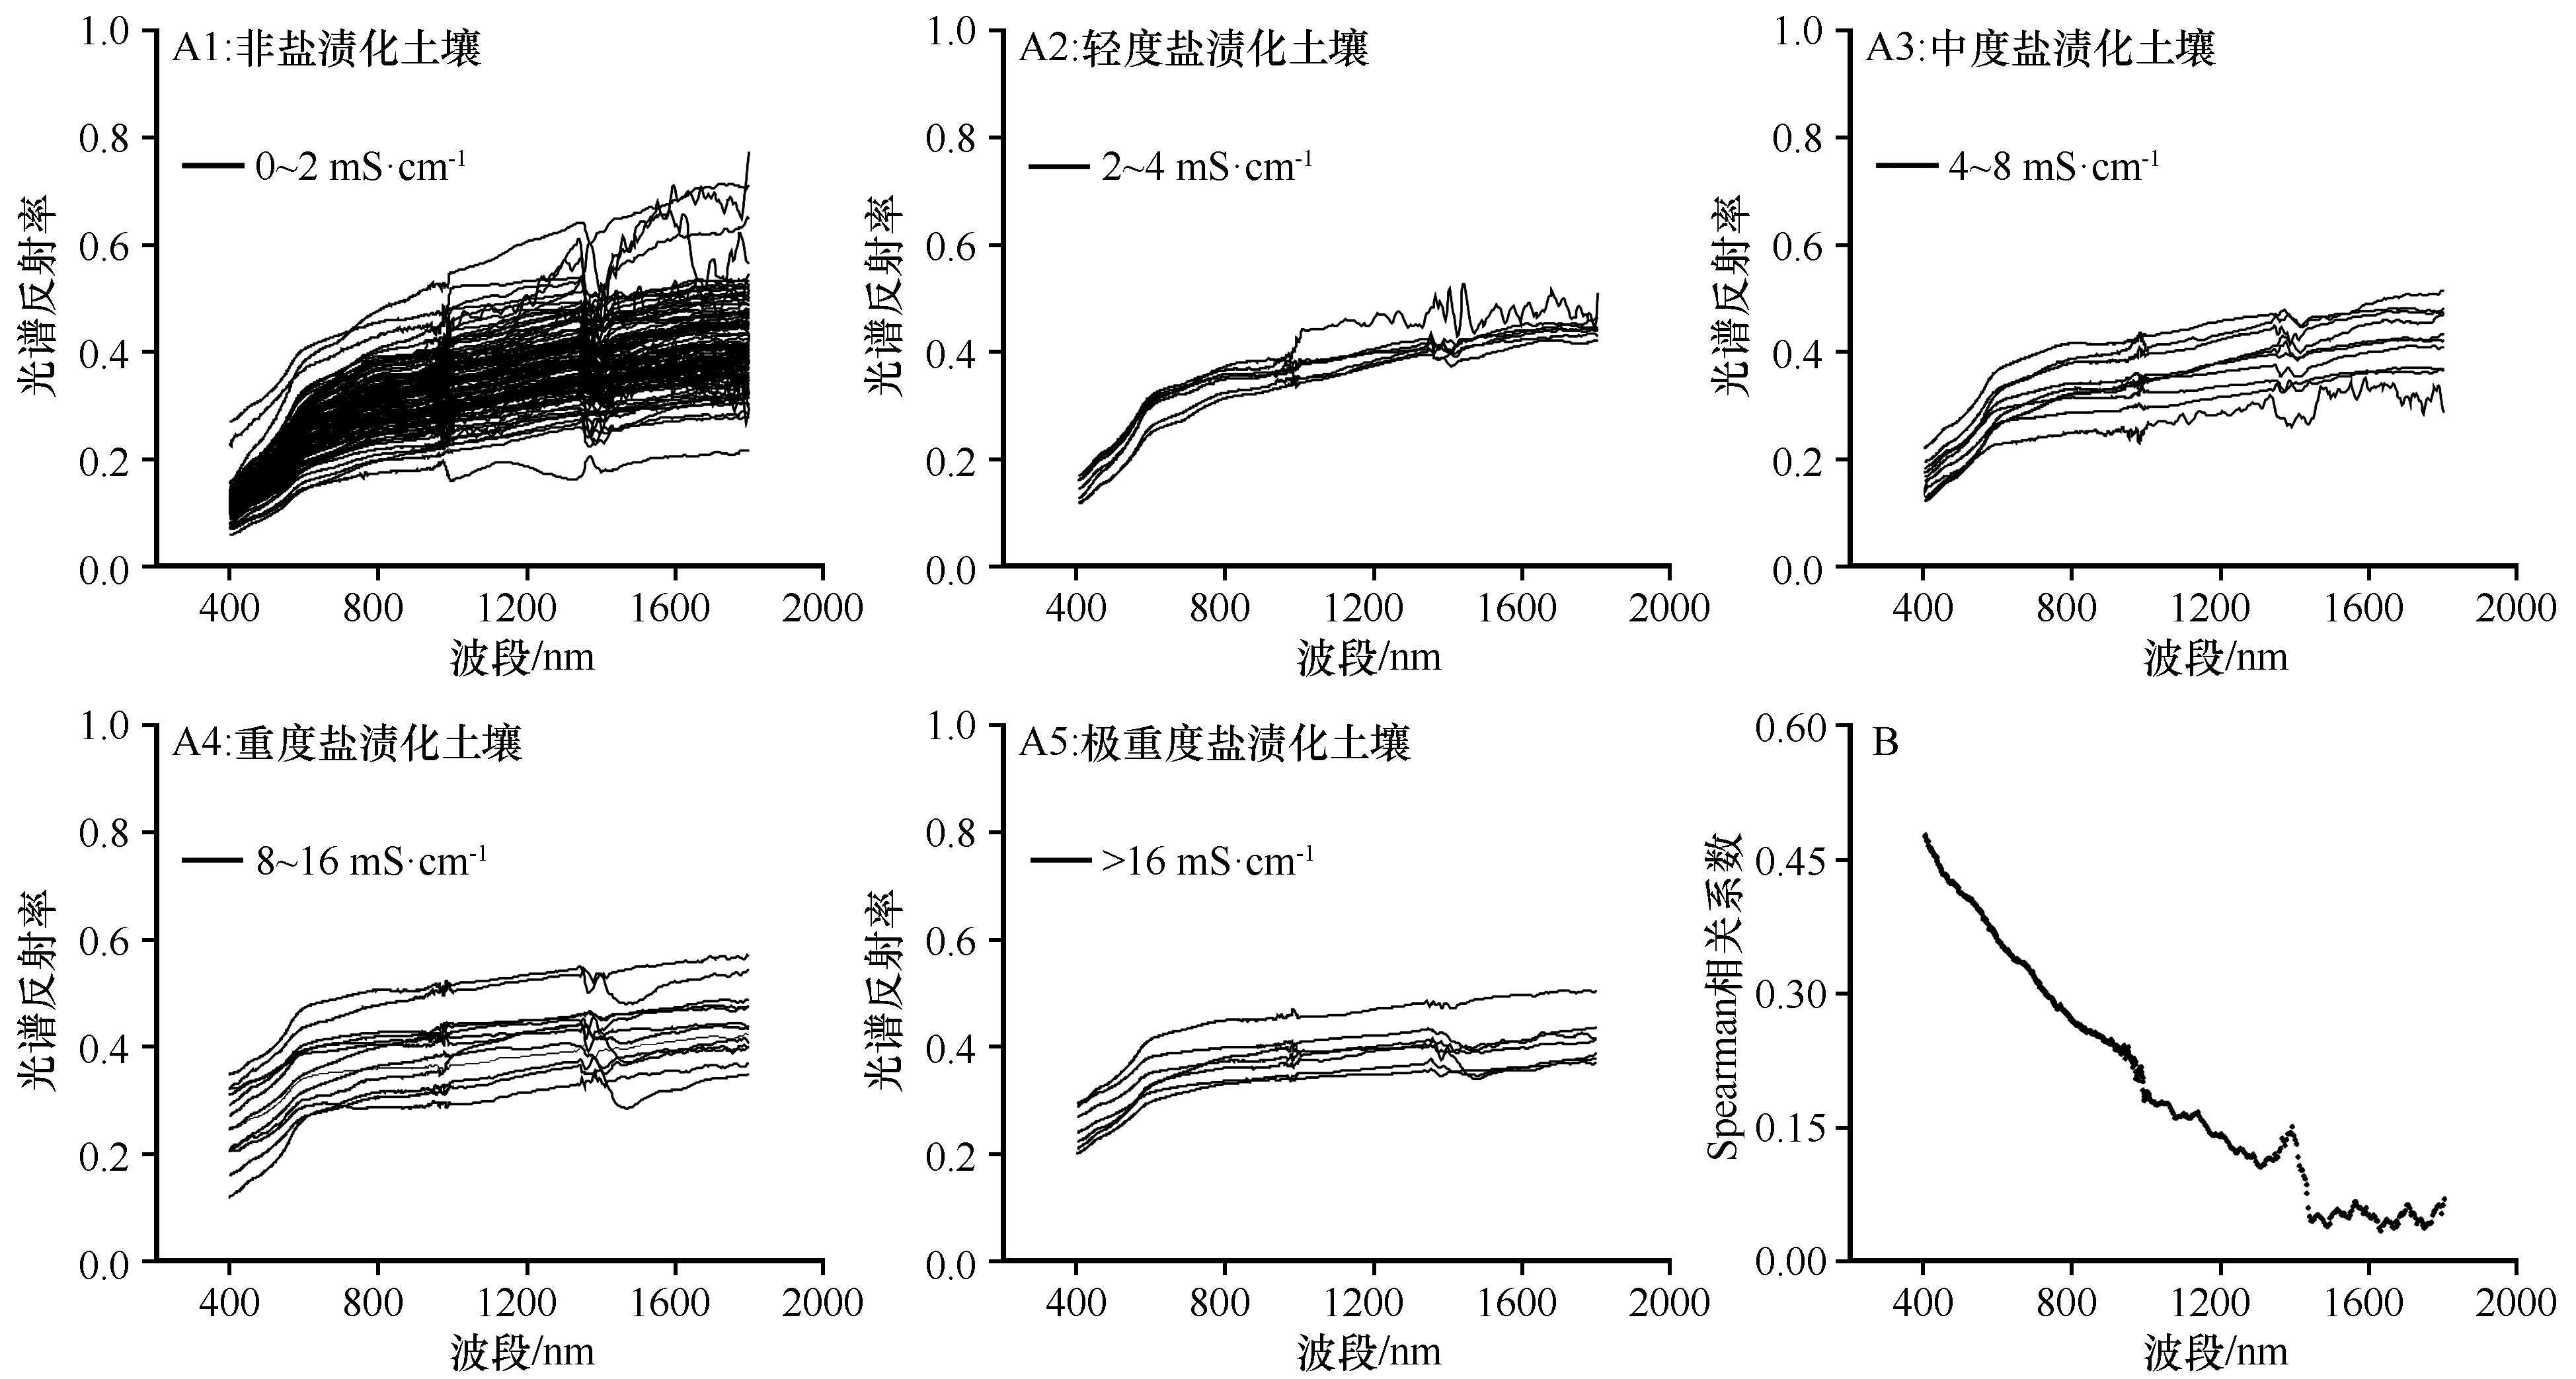
图3 景电灌区土壤样品光谱反射率(A1~A5)和EC-地表反射率之间的相关性(B)
Fig.3 Soil samples reflectance (A1-A5) and correlation between EC and soil reflectance (B)
| 波段数 | DNN | DRF | GBM | |||||
|---|---|---|---|---|---|---|---|---|
| RMSE | R2 | RMSE | R2 | RMSE | R2 | |||
| 5 | 1.73 | 0.80 | 2.36 | 0.63 | 1.88 | 0.77 | ||
| 10 | 2.86 | 0.74 | 3.26 | 0.70 | 3.16 | 0.74 | ||
| 20 | 3.36 | 0.69 | 3.40 | 0.56 | 3.57 | 0.65 | ||
| 40 | 3.51 | 0.73 | 4.2 | 0.64 | 3.57 | 0.72 | ||
| 60 | 3.46 | 0.72 | 3.56 | 0.70 | 3.49 | 0.71 | ||
| 80 | 2.25 | 0.75 | 3.55 | 0.51 | 2.99 | 0.59 | ||
| 100 | 3.27 | 0.66 | 3.58 | 0.62 | 3.22 | 0.65 | ||
| 均值 | 2.92 | 0.73 | 3.42 | 0.62 | 3.13 | 0.79 | ||
表2 基于相关性倒序排列筛选的不同波段数目的建模结果
Table 2 Modeling results of different band filtering number based on correlation reversed arrangement
| 波段数 | DNN | DRF | GBM | |||||
|---|---|---|---|---|---|---|---|---|
| RMSE | R2 | RMSE | R2 | RMSE | R2 | |||
| 5 | 1.73 | 0.80 | 2.36 | 0.63 | 1.88 | 0.77 | ||
| 10 | 2.86 | 0.74 | 3.26 | 0.70 | 3.16 | 0.74 | ||
| 20 | 3.36 | 0.69 | 3.40 | 0.56 | 3.57 | 0.65 | ||
| 40 | 3.51 | 0.73 | 4.2 | 0.64 | 3.57 | 0.72 | ||
| 60 | 3.46 | 0.72 | 3.56 | 0.70 | 3.49 | 0.71 | ||
| 80 | 2.25 | 0.75 | 3.55 | 0.51 | 2.99 | 0.59 | ||
| 100 | 3.27 | 0.66 | 3.58 | 0.62 | 3.22 | 0.65 | ||
| 均值 | 2.92 | 0.73 | 3.42 | 0.62 | 3.13 | 0.79 | ||
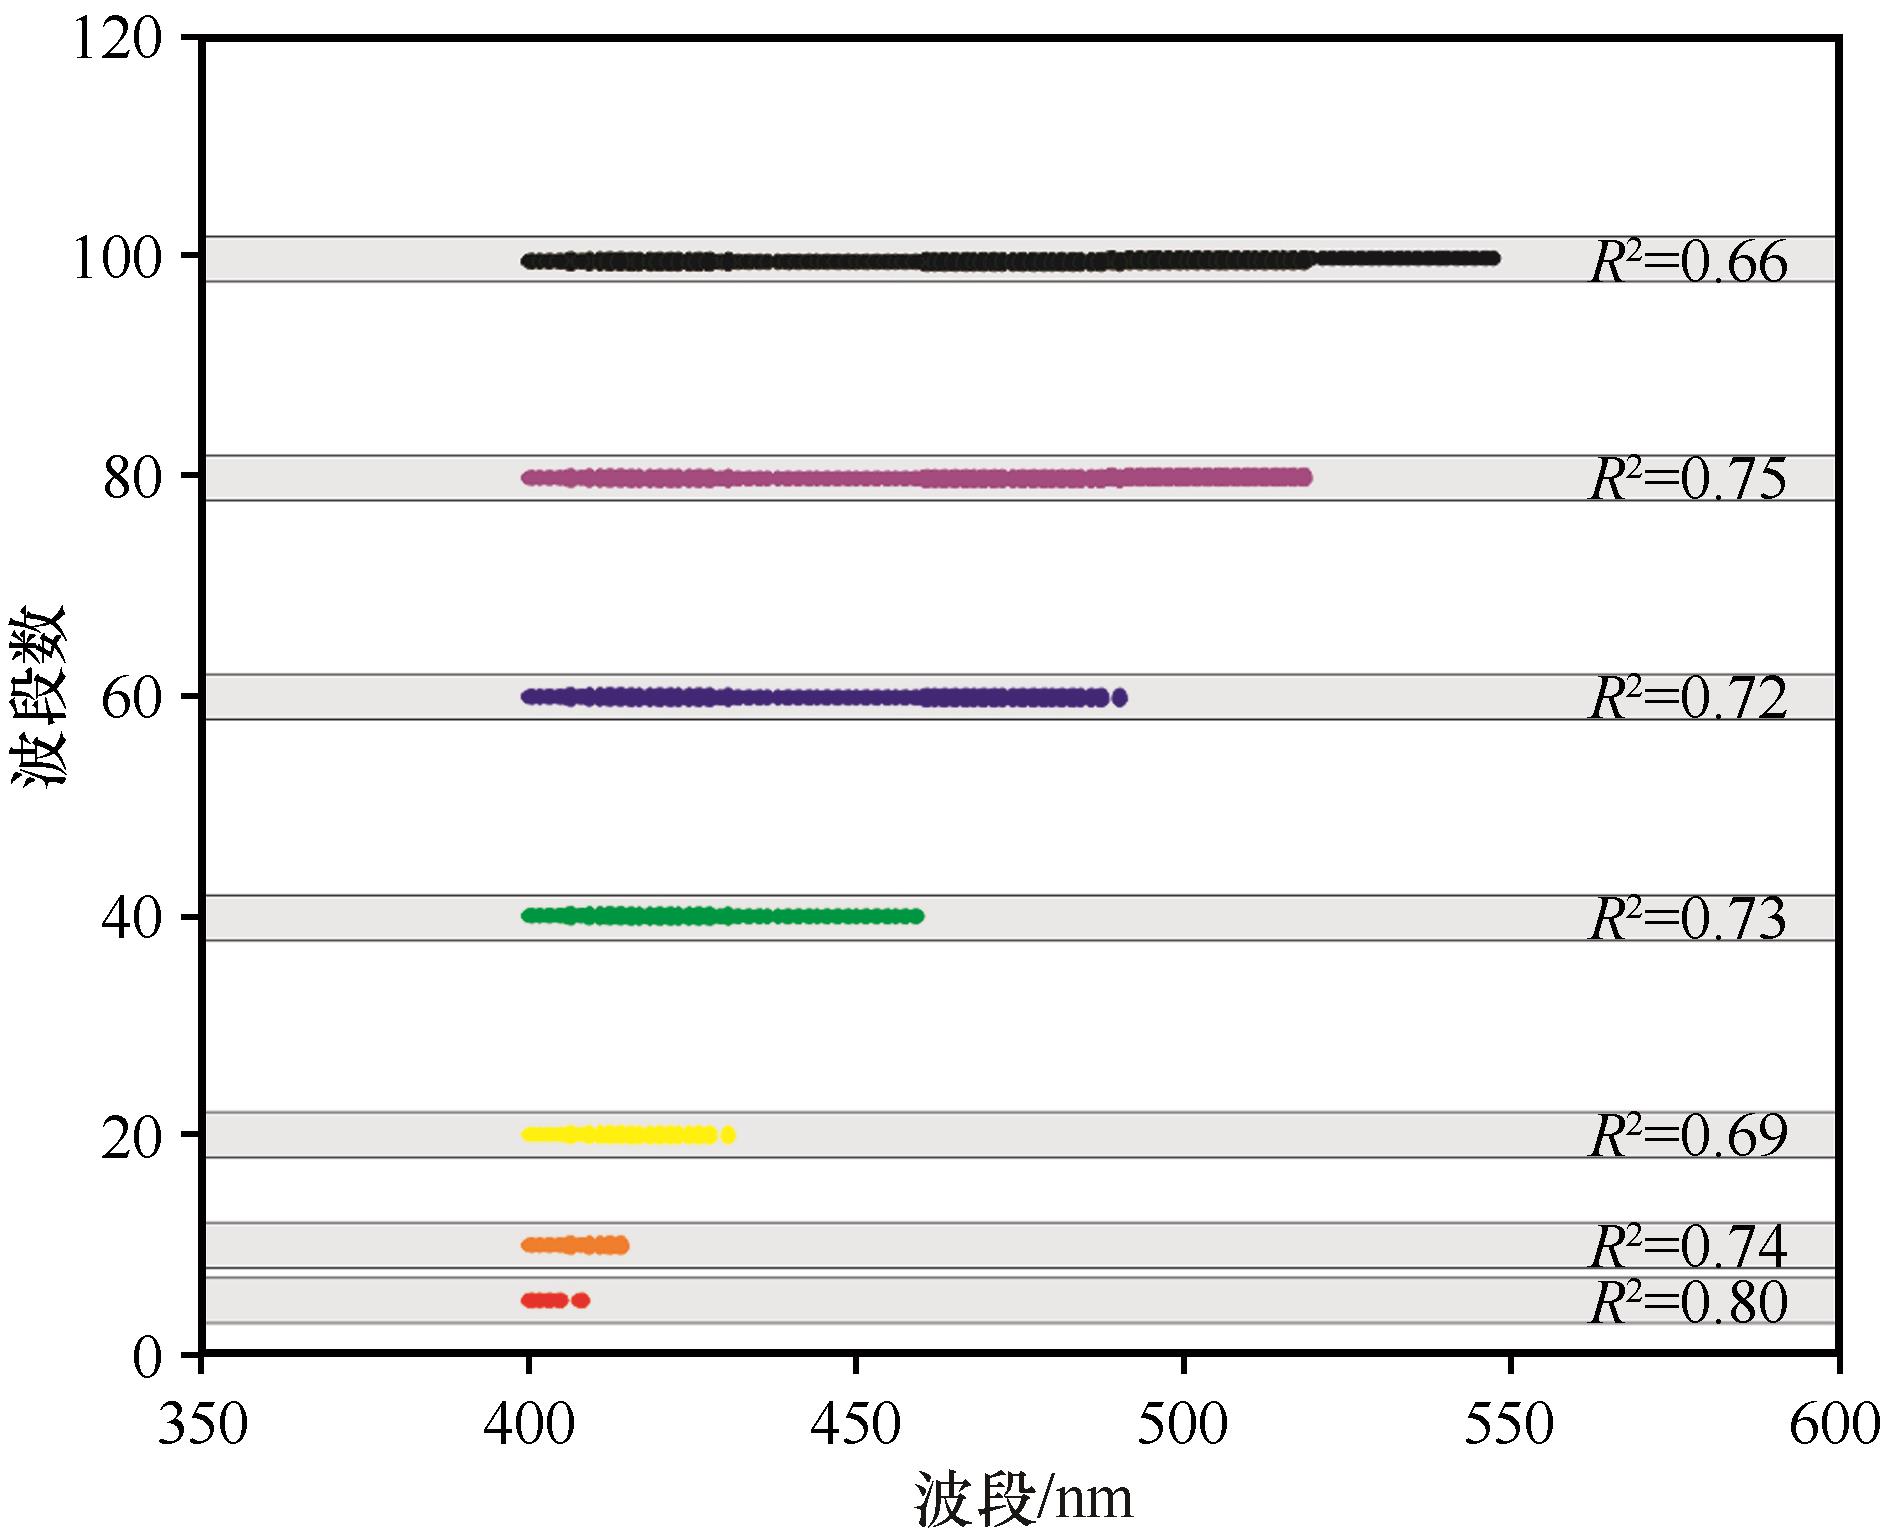
图4 基于相关性倒序排列筛选的不同波段及DNN、DRF和GBM中的最佳建模结果
Fig.4 The best modeling results in DNN, DRF, and GBM based on the different bands filtered by reversed correlation order
| 数据 类型 | DNN | DRF | GBM | |||||
|---|---|---|---|---|---|---|---|---|
| RMSE | R2 | RMSE | R2 | RMSE | R2 | |||
| SNR-5 dB | 4.87 | 0.51 | 5.88 | 0.24 | 5.61 | 0.31 | ||
| SNR-10 dB | 4.60 | 0.54 | 4.94 | 0.42 | 5.12 | 0.39 | ||
| SNR-20 dB | 2.30 | 0.75 | 1.82 | 0.81 | 2.04 | 0.75 | ||
| SNR-30 dB | 2.86 | 0.71 | 2.76 | 0.69 | 3.19 | 0.61 | ||
| SNR-40 dB | 3.62 | 0.61 | 2.99 | 0.62 | 2.96 | 0.66 | ||
| SNR-50 dB | 3.69 | 0.50 | 3.75 | 0.48 | 3.37 | 0.60 | ||
| 均值 | 3.66 | 0.60 | 3.69 | 0.54 | 3.72 | 0.55 | ||
表3 基于不同信噪比数据源的建模结果
Table 3 Modeling results of data source with different signal-to-noise ratio
| 数据 类型 | DNN | DRF | GBM | |||||
|---|---|---|---|---|---|---|---|---|
| RMSE | R2 | RMSE | R2 | RMSE | R2 | |||
| SNR-5 dB | 4.87 | 0.51 | 5.88 | 0.24 | 5.61 | 0.31 | ||
| SNR-10 dB | 4.60 | 0.54 | 4.94 | 0.42 | 5.12 | 0.39 | ||
| SNR-20 dB | 2.30 | 0.75 | 1.82 | 0.81 | 2.04 | 0.75 | ||
| SNR-30 dB | 2.86 | 0.71 | 2.76 | 0.69 | 3.19 | 0.61 | ||
| SNR-40 dB | 3.62 | 0.61 | 2.99 | 0.62 | 2.96 | 0.66 | ||
| SNR-50 dB | 3.69 | 0.50 | 3.75 | 0.48 | 3.37 | 0.60 | ||
| 均值 | 3.66 | 0.60 | 3.69 | 0.54 | 3.72 | 0.55 | ||

图5 不同数据源的Z分数
Fig.5 Z score of different data sources
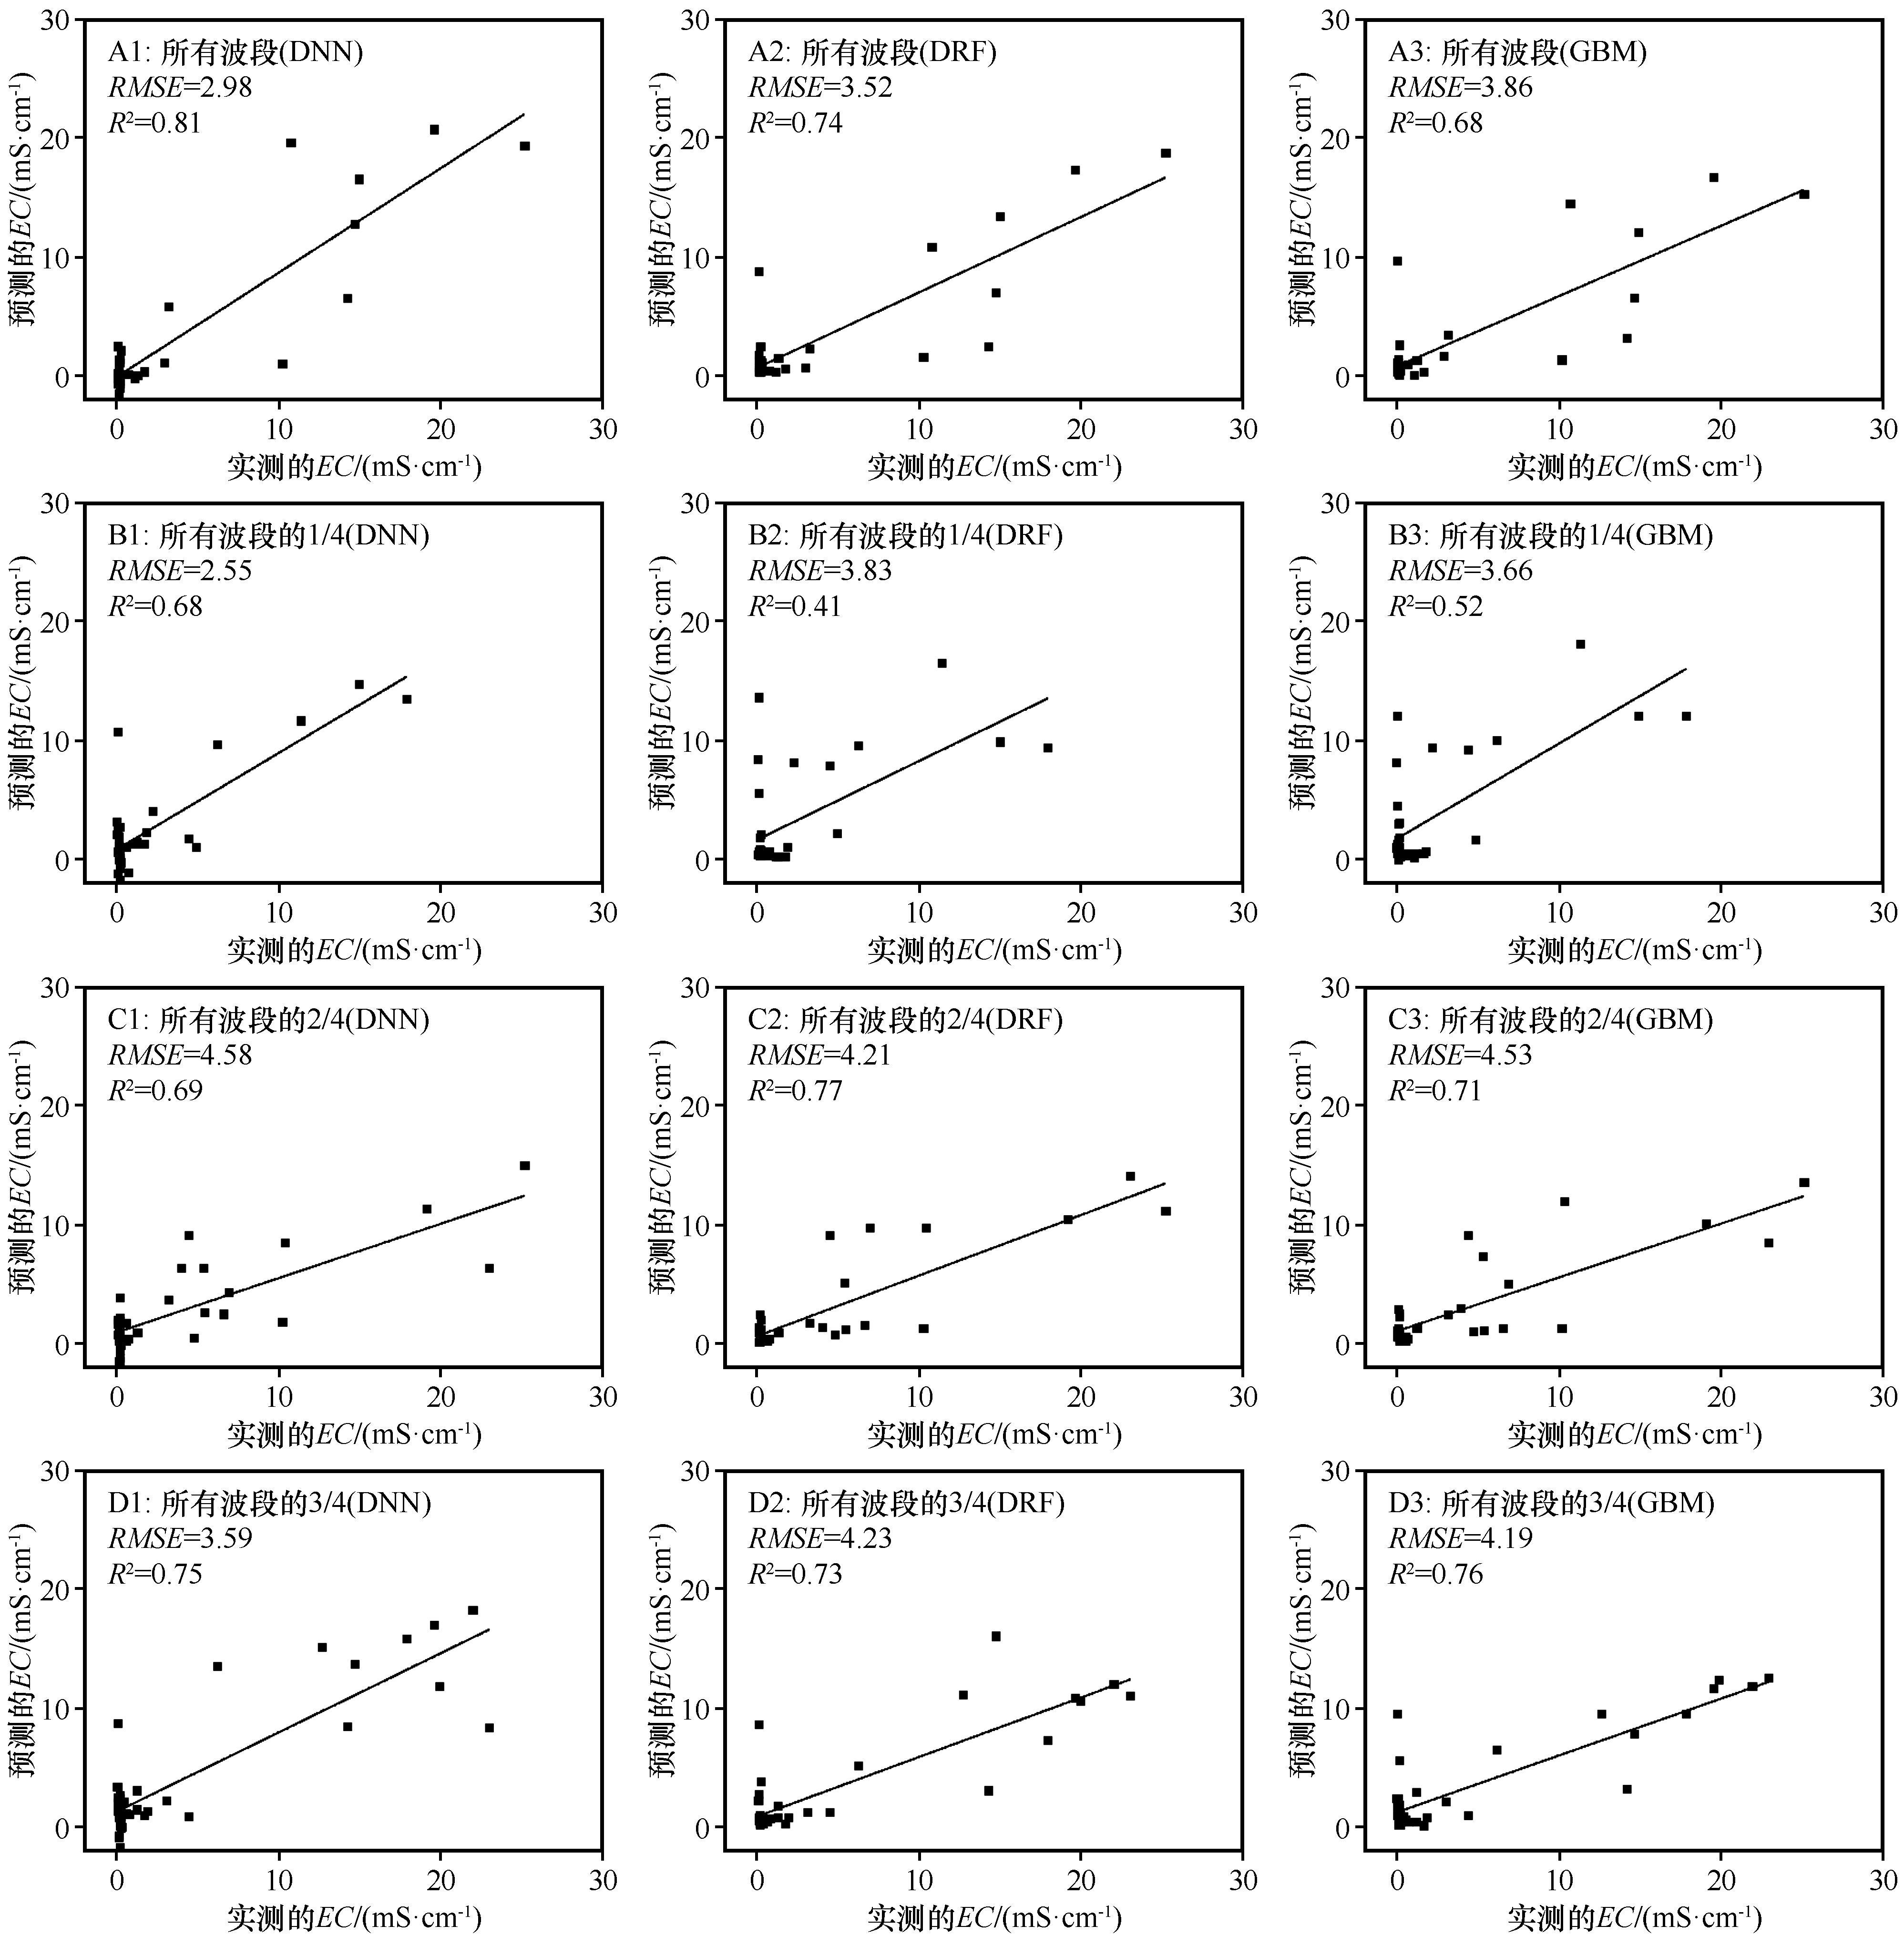
图6 基于在所有波段中占比不同的波段数量的模型拟合结果
Fig.6 Modeling fitting results of different bands proportion in all bands
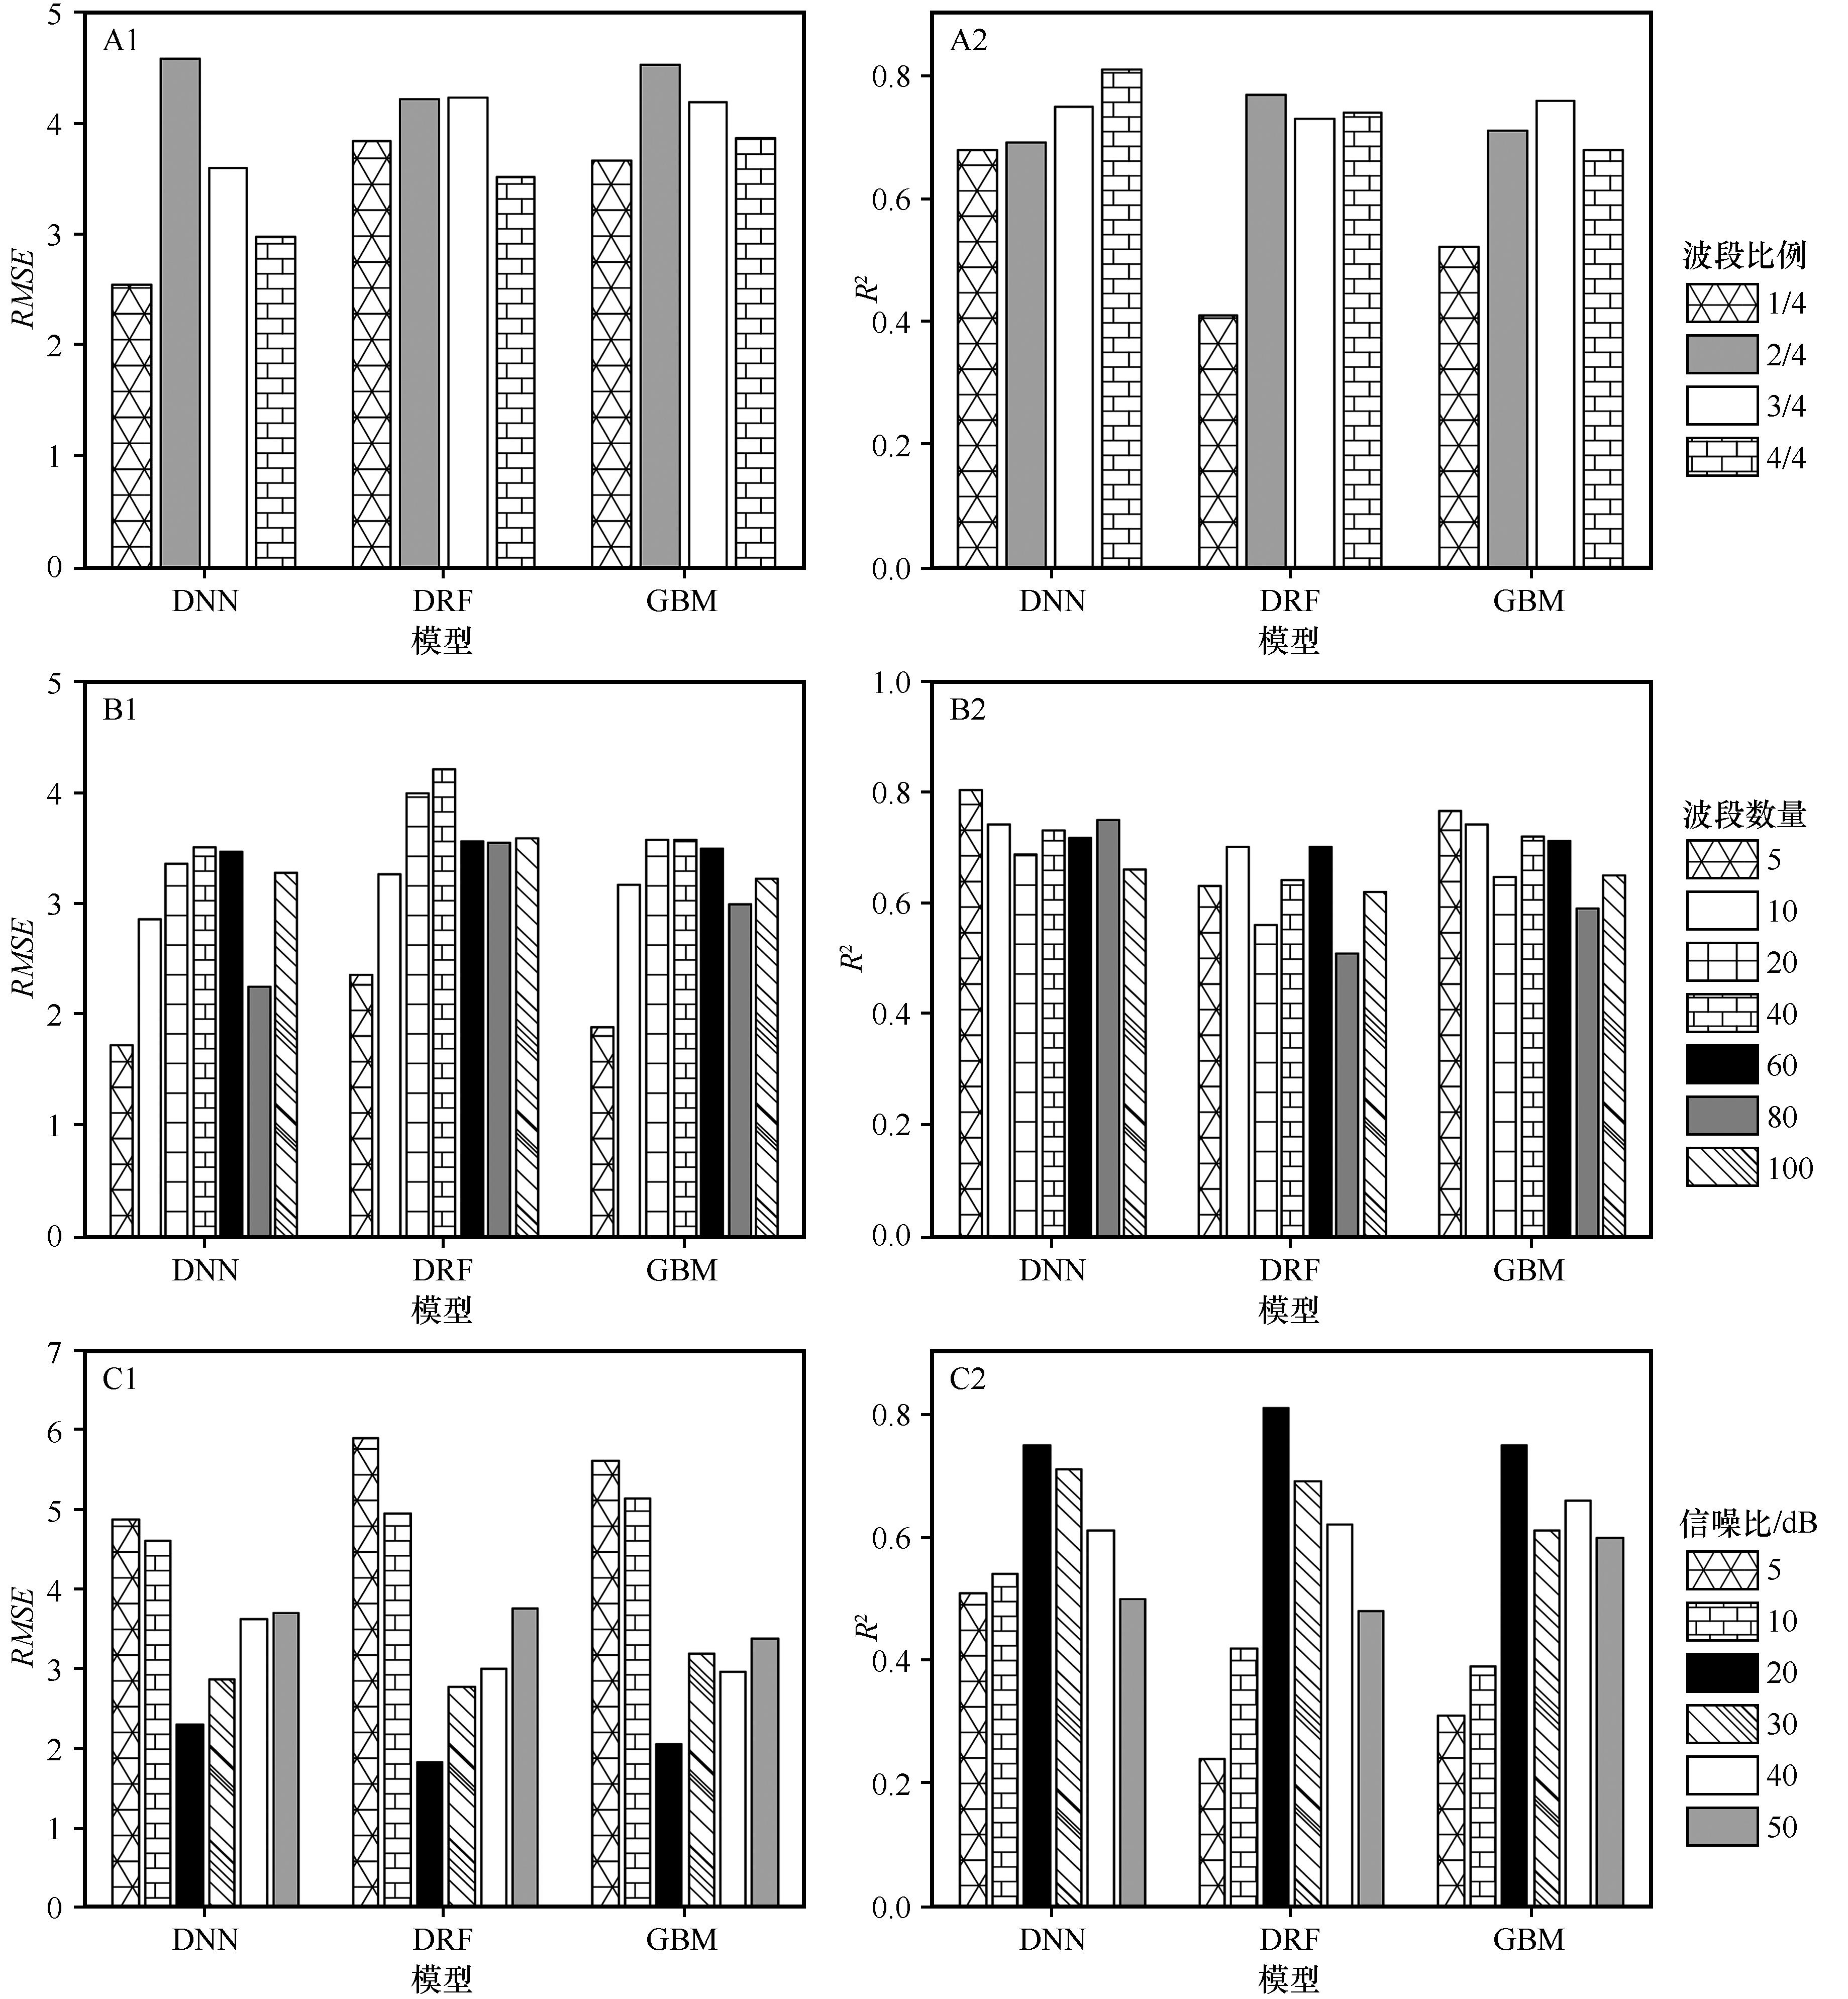
图7 不同数据源的建模结果(A1、A2:在所有波段中占比不同的波段的建模结果;B1、B2:基于相关性倒序排列筛选不同数目波段的建模结果;C1、C2:基于不同信噪比输入数据的建模结果)
Fig.7 Modeling results of different data sources (A1, A2: modeling results of different bands proportion in all bands; B1, B2: modeling results of different band filtering number based on correlation reversed arrangement; C1, C2: modeling results of data source with different signal-to-noise ratio)
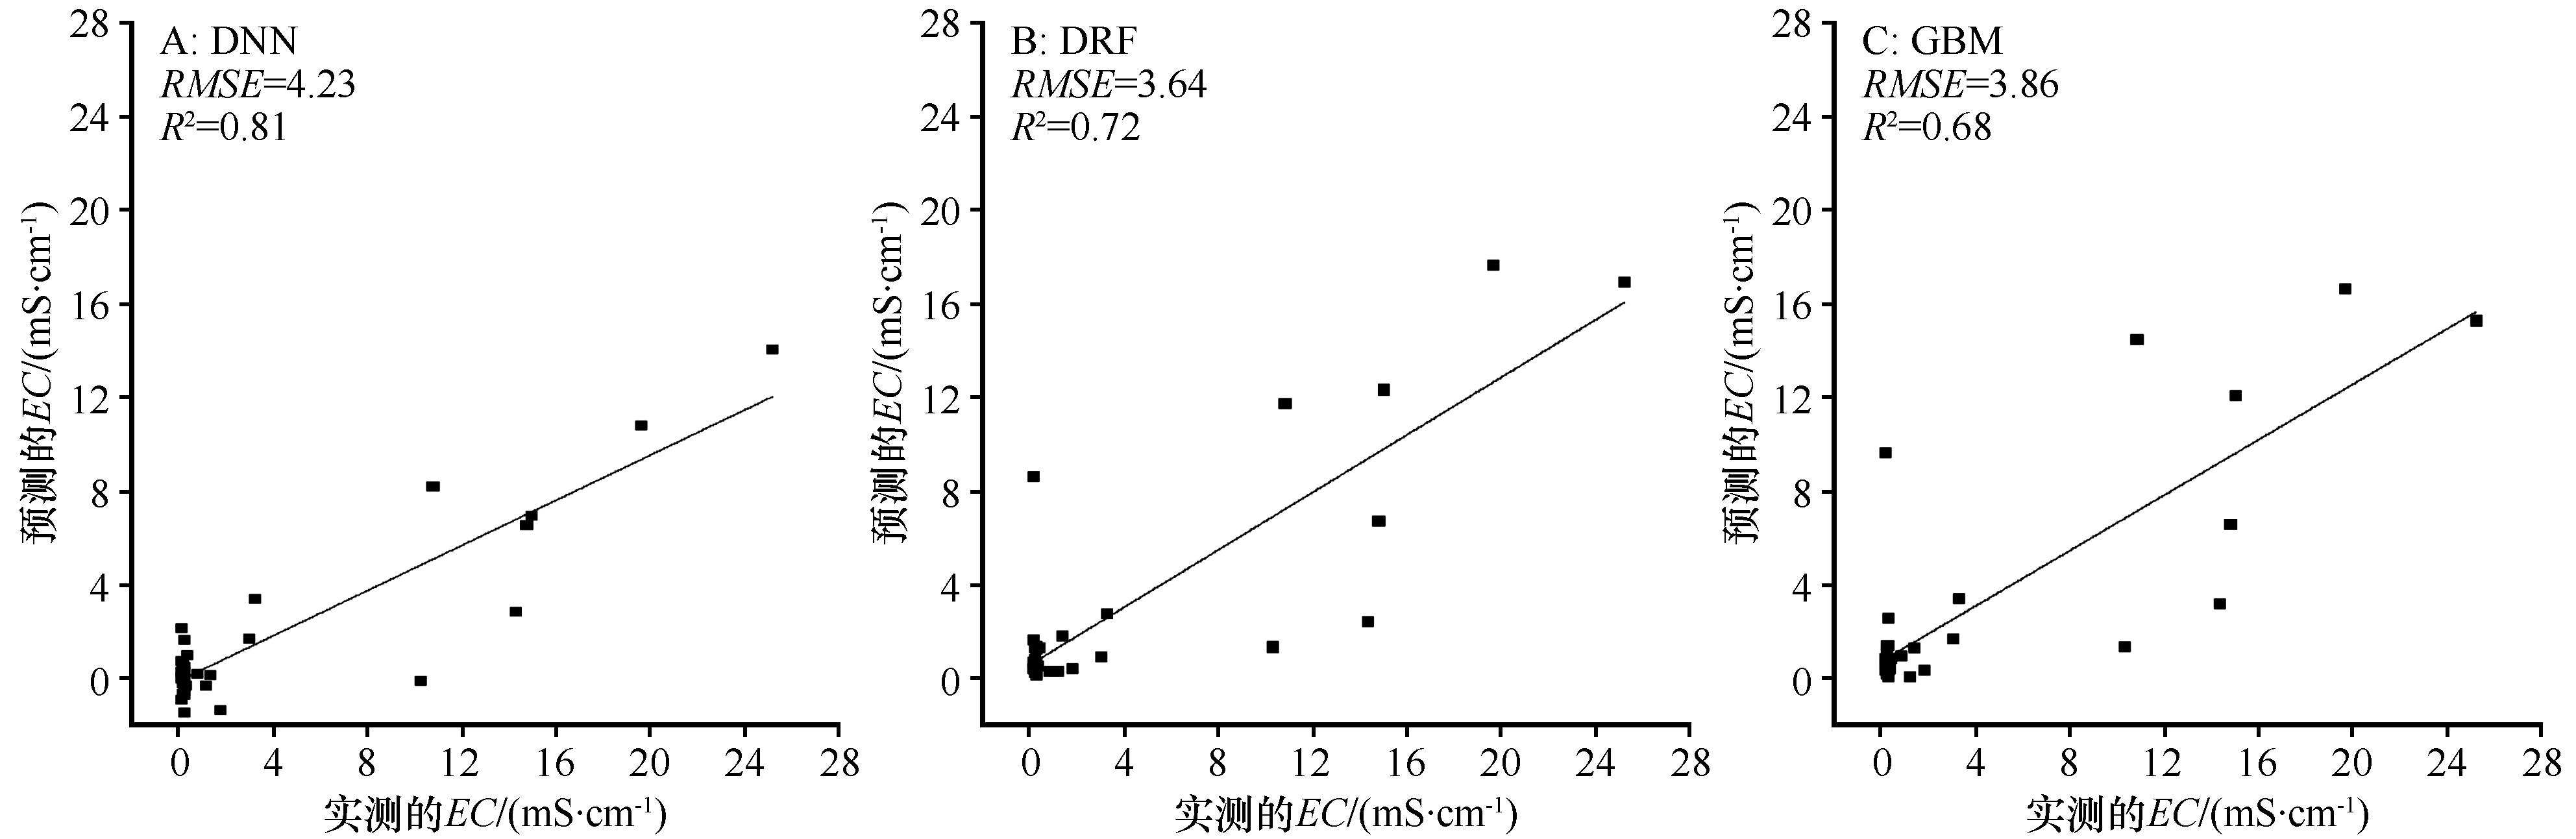
图8 不同模型的五折交叉验证结果
Fig.8 Results of five-fold cross-validation of different models
| 1 | Sidike A, Zhao S, Wen Y.Estimating soil salinity in Pingluo County of China using QuickBird data and soil reflectance spectra[J].International Journal of Applied Earth Observation and Geoinformation,2014,26:156-175. |
| 2 | Gorji T, Yildirim A, Hamzehpour N,et al.Soil salinity analysis of Urmia Lake Basin using Landsat-8 OLI and Sentinel-2A based spectral indices and electrical conductivity measurements[J].Ecological Indicators,2020,112:106173. |
| 3 | Hopmans J W, Qureshi A S, Kisekka I,et al.Critical knowledge gaps and research priorities in global soil salinity[M]//Sparks Donald L.Advances in Agronomy.Pittsburgh,USA:Academic Press,2021. |
| 4 | Allbed A, Kumar L, Aldakheel Y Y.Assessing soil salinity using soil salinity and vegetation indices derived from IKONOS high-spatial resolution imageries:applications in a date palm dominated region[J].Geoderma,2014,230:1-8. |
| 5 | Aldabaa A A A, Weindorf D C, Chakraborty S,et al.Combination of proximal and remote sensing methods for rapid soil salinity quantification[J].Geoderma,2015,239/240:34-46. |
| 6 | Corwin D L.Climate change impacts on soil salinity in agricultural areas[J].European Journal of Soil Science,2021(2):13010. |
| 7 | Metternicht G I, Zinck J A.Remote sensing of soil salinity:potentials and constraints[J].Remote Sensing of Environment,2003,85(1):1-20. |
| 8 | Guzinski R, Nieto H.Evaluating the feasibility of using Sentinel-2 and Sentinel-3 satellites for high-resolution evapotranspiration estimations[J].Remote Sensing of Environment,2019,221:157-172. |
| 9 | Hong Y, Chen S, Chen Y,et al.Comparing laboratory and airborne hyperspectral data for the estimation and mapping of topsoil organic carbon:Feature selection coupled with random forest[J].Soil & Tillage Research,2020,199:104589. |
| 10 | Castaldi F, Palombo A, Santini F,et al.Evaluation of the potential of the current and forthcoming multispectral and hyperspectral imagers to estimate soil texture and organic carbon[J].Remote Sensing of Environment,2016,179:54-65. |
| 11 | An D, Zhao G, Chang C,et al.Hyperspectral field estimation and remote-sensing inversion of salt content in coastal saline soils of the Yellow River Delta[J].International Journal of Remote Sensing,2016,37(2):455-470. |
| 12 | Roy C M, Das S, Christopher J,et al.Improving biomass and grain yield prediction of wheat genotypes on sodic soil using integrated high-resolution multispectral,hyperspectral,3d point cloud,and machine learning techniques[J].Remote Sensing,2021,13(17):3482. |
| 13 | Zhu K, Sun Z, Zhao F,et al.Relating hyperspectral vegetation indices with soil salinity at different depths for the diagnosis of winter wheat salt stress[J].Remote Sensing,2021,13(2):250. |
| 14 | Gomez C, Adeline K, Bacha S,et al.Sensitivity of clay content prediction to spectral configuration of VNIR/SWIR imaging data,from multispectral to hyperspectral scenarios[J].Remote Sensing of Environment,2018,204:18-30. |
| 15 | 唐海涛,孟祥添,苏循新,等.基于CARS算法的不同类型土壤有机质高光谱预测[J].农业工程学报,2021,37(2):105-113. |
| 16 | 钟亮,郭熙,国佳欣,等.基于不同卷积神经网络模型的红壤有机质高光谱估算[J].农业工程学报,2021,37(1):203-212. |
| 17 | Lu P, Wang L, Niu Z,et al.Prediction of soil properties using laboratory VIS-NIR spectroscopy and Hyperion imagery[J].Journal of Geochemical Exploration,2013,132:26-33. |
| 18 | Peng J, Biswas A, Jiang Q,et al.Estimating soil salinity from remote sensing and terrain data in southern Xinjiang Province,China[J].Geoderma,2019,337:1309-1319. |
| 19 | Yang N, Yang S, Cui W,et al.Effect of spring irrigation on soil salinity monitoring with UAV-borne multispectral sensor[J].International Journal of Remote Sensing,2021,23/24:1-18. |
| 20 | Zeraatpisheh M, Ayoubi S, Jafari A,et al.Digital mapping of soil properties using multiple machine learning in a semi-arid region,central Iran[J].Geoderma,2019,338:445-452. |
| 21 | Wang S J, Chen Y H, Wang M G,et al.Performance comparison of machine learning algorithms for estimating the soil salinity of salt-affected soil using field spectral data[J].Remote sensing,2019,11(22):2605. |
| 22 | Wang F, Shi Z, Biswas A,et al.Multi-algorithm comparison for predicting soil salinity[J].Geoderma,2020,365:114211. |
| 23 | Savitzky A, Golay M J.Smoothing and differentiation of data by simplified least squares procedures[J].Analytical Chemistry,1964,36(8):1627-1639. |
| 24 | Wang F, Yang S, Wei Y,et al.Characterizing soil salinity at multiple depth using electromagnetic induction and remote sensing data with random forests:a case study in Tarim River Basin of southern Xinjiang,China[J].The Science of the Total Environment,2021,754:142030. |
| 25 | Gomez C, Lagacherie P, Coulouma G.Regional predictions of eight common soil properties and their spatial structures from hyperspectral Vis-NIR data[J].Geoderma,2012,189/190:176-185. |
| 26 | Ivushkin K, Bartholomeus H, Bregt A K,et al.Global mapping of soil salinity change[J].Remote Sensing of Environment,2019,231:111260. |
| 27 | Rao B R M, Sharma R C, Ravi Sankar T,et al.Spectral behaviour of salt-affected soils[J].International Journal of Remote Sensing,1995,16(12):2125-2136. |
| 28 | Bowers S A, Smith S J.Spectrophotometric determination of soil-water content[J].Soil Science Society of America Journal,1972,36(6):978-980. |
| 29 | Camacho De Coca F, Baret F, Weiss M,et al.Comparison of physically-based and empirical methods for retrieval of LAI and FAPAR over specific and generic crops using Landsat-8 data[C]//Recent Advance in Quantitative Remote Sensing.Torrent,Valencia,Spain,2017. |
| 30 | Suo X, Jiang Y, Mei Y,et al.Artificial neural network to predict leaf population chlorophyll content from cotton plant images[J].Agricultural Sciences in China,2010,9(1):38-45. |
| 31 | Liu M, Liu X, Li M,et al.Neural-network model for estimating leaf chlorophyll concentration in rice under stress from heavy metals using four spectral indices[J].Biosystems Engineering,2010,106(3):223-233. |
| 32 | Kira O, Linker R, Gitelson A.Non-destructive estimation of foliar chlorophyll and carotenoid contents:focus on informative spectral bands[J].International Journal of Applied Earth Observation and Geoinformation,2015,38:251-260. |
| 33 | Sehgal V K, Chakraborty D, Sahoo R N.Inversion of radiative transfer model for retrieval of wheat biophysical parameters from broadband reflectance measurements[J].Information Processing in Agriculture,2016,3(2):107-118. |
| 34 | Verrelst J, Muñoz J, Alonso L,et al.Machine learning regression algorithms for biophysical parameter retrieval:opportunities for Sentinel-2 and-3[J].Remote Sensing of Environment,2012,118:127-139. |
| 35 | Zhang Q, Li L, Sun R,et al.Retrieval of the soil salinity from Sentinel-1 dual-polarized sar data based on deep neural network regression[J].IEEE Geoscience and Remote Sensing Letters,2022,19:1-5. |
| 36 | Farifteh J, Van der Meer F, Atzberger C,et al.Quantitative analysis of salt-affected soil reflectance spectra:a comparison of two adaptive methods (PLSR and ANN)[J].Remote Sensing of Environment,2007,110(1):59-78. |
| 37 | Golden C E, Rothrock M J, Mishra A.Comparison between random forest and gradient boosting machine methods for predicting Listeria spp.prevalence in the environment of pastured poultry farms[J].Food Research International,2019,122:47-55. |
| 38 | Brillante L, Gaiotti F, Lovat L,et al.Investigating the use of gradient boosting machine,random forest and their ensemble to predict skin flavonoid content from berry physical-mechanical characteristics in wine grapes[J].Computers and Electronics in Agriculture,2015,117:186-193. |
| 39 | Belgiu M, Drăguţ L.Random forest in remote sensing:a review of applications and future directions[J].ISPRS Journal of Photogrammetry and Remote Sensing,2016,114:24-31. |
| 40 | Breiman L.Random forests[J].Machine Learning,2001,45(1):5-32. |
| 41 | Friedman J H.Stochastic gradient boosting[J].Computational Statistics & Data Analysis,2002,38(4):367-378. |
| 42 | Cutler D R, Edwards T C, Beard K H,et al.Random forests for classification in ecology[J].Ecology,2007,88(11):2783-2792. |
| 43 | Rodriguez-Galiano V F, Ghimire B, Rogan J,et al.An assessment of the effectiveness of a random forest classifier for land-cover classification[J].ISPRS Journal of Photogrammetry and Remote Sensing,2012,67:93-104. |
| 44 | Wang X, Gao X, Zhang Y,et al.Land-cover classification of coastal wetlands using the RF algorithm for Worldview-2 and Landsat 8 images[J].Remote Sensing,2019,11(16):1927. |
| 45 | Jang E, Kim Y J, Im J,et al.Global sea surface salinity via the synergistic use of SMAP satellite and HYCOM data based on machine learning[J].Remote Sensing of Environment,2022,273:112980. |
| 46 | Nawar S, Mouazen A M.Comparison between random forests,artificial neural networks and gradient boosted machines methods of on-line VIS-NIR spectroscopy measurements of soil total nitrogen and total carbon[J].Sensors,2017,17:2428. |
| 47 | Sorenson P T, Small C, Tappert M C,et al.Monitoring organic carbon,total nitrogen,and pH for reclaimed soils using field reflectance spectroscopy[J].Canadian Journal of Soil Science,2017,97(2):241-248. |
| 48 | Quintano C, Fernandez-Manso A, Roberts D A.Enhanced burn severity estimation using fine resolution ET and MESMA fraction images with machine learning algorithm[J].Remote Sensing of Environment,2020,244:111815. |
| 49 | Zhang T, Zeng S, Gao Y,et al.Using hyperspectral vegetation indices as a proxy to monitor soil salinity[J].Ecological Indicators,2011,11(6):1552-1562. |
| 50 | Ben-Dor E, Chabrillat S, Demattê J A M,et al.Using imaging spectroscopy to study soil properties[J].Remote Sensing of Environment,2009,113:S38-S55. |
| 51 | Rossel R A V, Behrens T.Using data mining to model and interpret soil diffuse reflectance spectra[J].Geoderma,2010,158(1/2):46-54. |
| 52 | Viscarra Rossel R A, Fouad Y, Walter C.Using a digital camera to measure soil organic carbon and iron contents[J].Biosystems Engineering,2008,100(2):149-159. |
| 53 | Melendez-Pastor I, Navarro-Pedreño J, Gómez I,et al.Identifying optimal spectral bands to assess soil properties with VNIR radiometry in semi-arid soils[J].Geoderma,2008,147(3/4):126-132. |
| 54 | 王爽,丁建丽,王璐,等.基于地表光谱建模的区域土壤盐渍化遥感监测研究[J].干旱区地理,2016,39(1):190-198. |
| 55 | Lobell D B, Asner G P.Moisture effects on soil reflectance[J].Soil Science Society of America Journal,2002,66(3):722-727. |
| 56 | Guo L, Zhang H, Shi T,et al.Prediction of soil organic carbon stock by laboratory spectral data and airborne hyperspectral images[J].Geoderma,2019,337:32-41. |
| 57 | Ding J L, Yao Y, Wang F.Detecting soil salinization in arid regions using spectral feature space derived from remote sensing data[J].Acta Ecologica Sinica,2014,34(16):4620-4631. |
| 58 | Ding J, Yu D.Monitoring and evaluating spatial variability of soil salinity in dry and wet seasons in the Werigan-Kuqa Oasis,China,using remote sensing and electromagnetic induction instruments[J].Geoderma,2014,235/236:316-322. |
| 59 | Garajeh M K, Blaschke T, Haghi V H,et al.A comparison between Sentinel-2 and Landsat 8 OLI satellite images for soil salinity distribution mapping using a deep learning convolutional neural network[J].Canadian Journal of Remote Sensing,2022,48(3):452-468. |
| [1] | 赵欣悦, 席海洋, 赵静, 马克华, 程文举, 陈雨晴. 阿拉善地区土壤盐渍化的遥感反演及分布特征[J]. 中国沙漠, 2023, 43(1): 27-36. |
| [2] | 杨爱霞, 丁建丽, 李艳红, 邓凯, 王瑾杰. 基于表观电导率与实测光谱的干旱区湿地土壤盐分监测[J]. 中国沙漠, 2016, 36(5): 1365-1373. |
| [3] | 袁泽, 丁建丽, 牛增懿, 李艳华. 基于GF-1遥感影像的艾比湖区域田间尺度土壤盐渍化监测方法[J]. 中国沙漠, 2016, 36(4): 1070-1078. |
| [4] | 丁建丽, 陈文倩, 陈芸. 干旱区土壤盐渍化灾害预警——以渭-库绿洲为例[J]. 中国沙漠, 2016, 36(4): 1079-1086. |
| [5] | 彭飞, 黄翠华, 廖杰, 薛娴, 王涛. 盐爪爪(Kalidium foliatum)群落对土壤盐分影响[J]. 中国沙漠, 2015, 35(1): 90-93. |
| [6] | 庞国锦, 王涛, 孙家欢, 李森. 基于高光谱的民勤土壤盐分定量分析[J]. 中国沙漠, 2014, 34(4): 1073-1079. |
| [7] | 姚远, 丁建丽, 张芳, 江红南, 雷磊. 基于电磁感应技术的塔里木盆地北缘绿洲土壤盐分空间变异特性[J]. 中国沙漠, 2014, 34(3): 765-772. |
| [8] | 谢姆斯叶·艾尼瓦尔, 塔西甫拉提·特依拜, 王宏卫, 买买提·沙吾提, 张飞. 人工智能计算技术在新疆干旱区典型绿洲土壤盐分预测中的应用[J]. 中国沙漠, 2014, 34(1): 153-161. |
| [9] | 张怀山, 代立兰, 赵桂琴, 王平, 王春梅. 3种耐盐植物的根际微环境比较[J]. 中国沙漠, 2014, 34(1): 184-190. |
| [10] | 雷 磊, 塔西甫拉提·特依拜, 丁建丽, 江红南, 张 飞, 姚 远, 阿尔达克·克里木. 基于HJ-1A高光谱影像的盐渍化土壤信息提取——以渭干河-库车河绿洲为例[J]. 中国沙漠, 2013, 33(4): 1104-1109. |
| [11] | 尤全刚;薛 娴;黄翠华. 地下水深埋区咸水灌溉对土壤盐渍化影响的初步研究——以民勤绿洲为例[J]. 中国沙漠, 2011, 31(2): 302-308. |
| [12] | 赵哈林;赵学勇;张铜会;张小由;李玉霖;刘立超. 我国西北干旱区的荒漠化过程及其空间分异规律[J]. 中国沙漠, 2011, 31(1): 1-8. |
| [13] | 王玉刚;肖笃宁;李 彦. 干旱内流区尾闾绿洲土壤积盐的动态特征[J]. 中国沙漠, 2009, 29(4): 604-610. |
| [14] | 王玉刚;肖笃宁;李 彦. 三工河流域中上游绿洲土壤盐化的时空动态[J]. 中国沙漠, 2008, 28(3): 478-484. |
| [15] | 李自珍, 李维德, 石洪华, 贾晓红. 生态风险灰色评价模型及其在绿洲盐渍化农田生态系统中的应用[J]. 中国沙漠, 2002, 22(6): 617-622. |
| 阅读次数 | ||||||
|
全文 |
|
|||||
|
摘要 |
|
|||||
©2018中国沙漠 编辑部
地址: 兰州市天水中路8号 (730000)
电话:0931-8267545
Email:caiedit@lzb.ac.cn;desert@lzb.ac.cn

 甘公网安备 62010202000688号