中国沙漠 ›› 2023, Vol. 43 ›› Issue (5): 139-154.DOI: 10.7522/j.issn.1000-694X.2023.00033
李宏宇1,2( ), 张强2, 岳平2, 曾剑3(), 郭晓楠1
收稿日期:2023-01-11
修回日期:2023-04-12
出版日期:2023-09-20
发布日期:2023-09-27
通讯作者:
曾剑
作者简介:曾剑(E-mail: zengjian@cuit.edu.cn)基金资助:
Hongyu Li1,2(), Qiang Zhang2, Ping Yue2, Jian Zeng3(), Xiaonan Guo1
Received:2023-01-11
Revised:2023-04-12
Online:2023-09-20
Published:2023-09-27
Contact:
Jian Zeng
摘要:
在东亚夏季风影响过渡区,陆面蒸散发(Evapotranspiration,ET)时空变化对夏季风活动响应规律的研究对理解陆地水热循环过程至关重要。本研究利用夏季风过渡区及邻近区域14个陆面观测站点的蒸散发观测数据评估了6种常用蒸散发全球产品的适用性,并对它们在过渡区的年际变化进行了比较。评估表明,JRA-55(Japanese 55-Year Reanalysis)可以较好模拟站点尺度的蒸散发,而且能够合理刻画过渡区平均蒸散发的长期年际变化,因此将JRA-55作为蒸散发参考数据集。在理解过渡区蒸散发时空变化的基础上,考察了陆面蒸散发对夏季风活动的响应特征。为识别东亚夏季风在影响过渡区的活跃度和活动规律,引入夏季风持续时间,该指数较常用的夏季风强度指标能更合理地反映过渡区夏季降水和夏季风活动的年际变化特征。本研究发现陆面蒸散发在年际时间尺度上与夏季风持续时间的散点呈现近似对数/幂函数曲线。在弱夏季风年,蒸散发年际变化对夏季风持续时间更为敏感。对蒸散发和夏季风持续时间进行集合经验模态分解,结果显示出夏季风活动在3年、年代际和长期趋势上显著影响蒸散发。未来气候情景下,东亚夏季风系统的活跃度很可能将增强,这会加速陆面蒸散发等水循环过程,同时对流域水资源和生态系统的稳定性将会产生重大影响。
中图分类号:
李宏宇, 张强, 岳平, 曾剑, 郭晓楠. 夏季风影响过渡区陆面蒸散发对夏季风活跃度的响应[J]. 中国沙漠, 2023, 43(5): 139-154.
Hongyu Li, Qiang Zhang, Ping Yue, Jian Zeng, Xiaonan Guo. Response of surface evapotranspiration to the East Asian summer monsoon over the summer monsoon transition zone of China[J]. Journal of Desert Research, 2023, 43(5): 139-154.
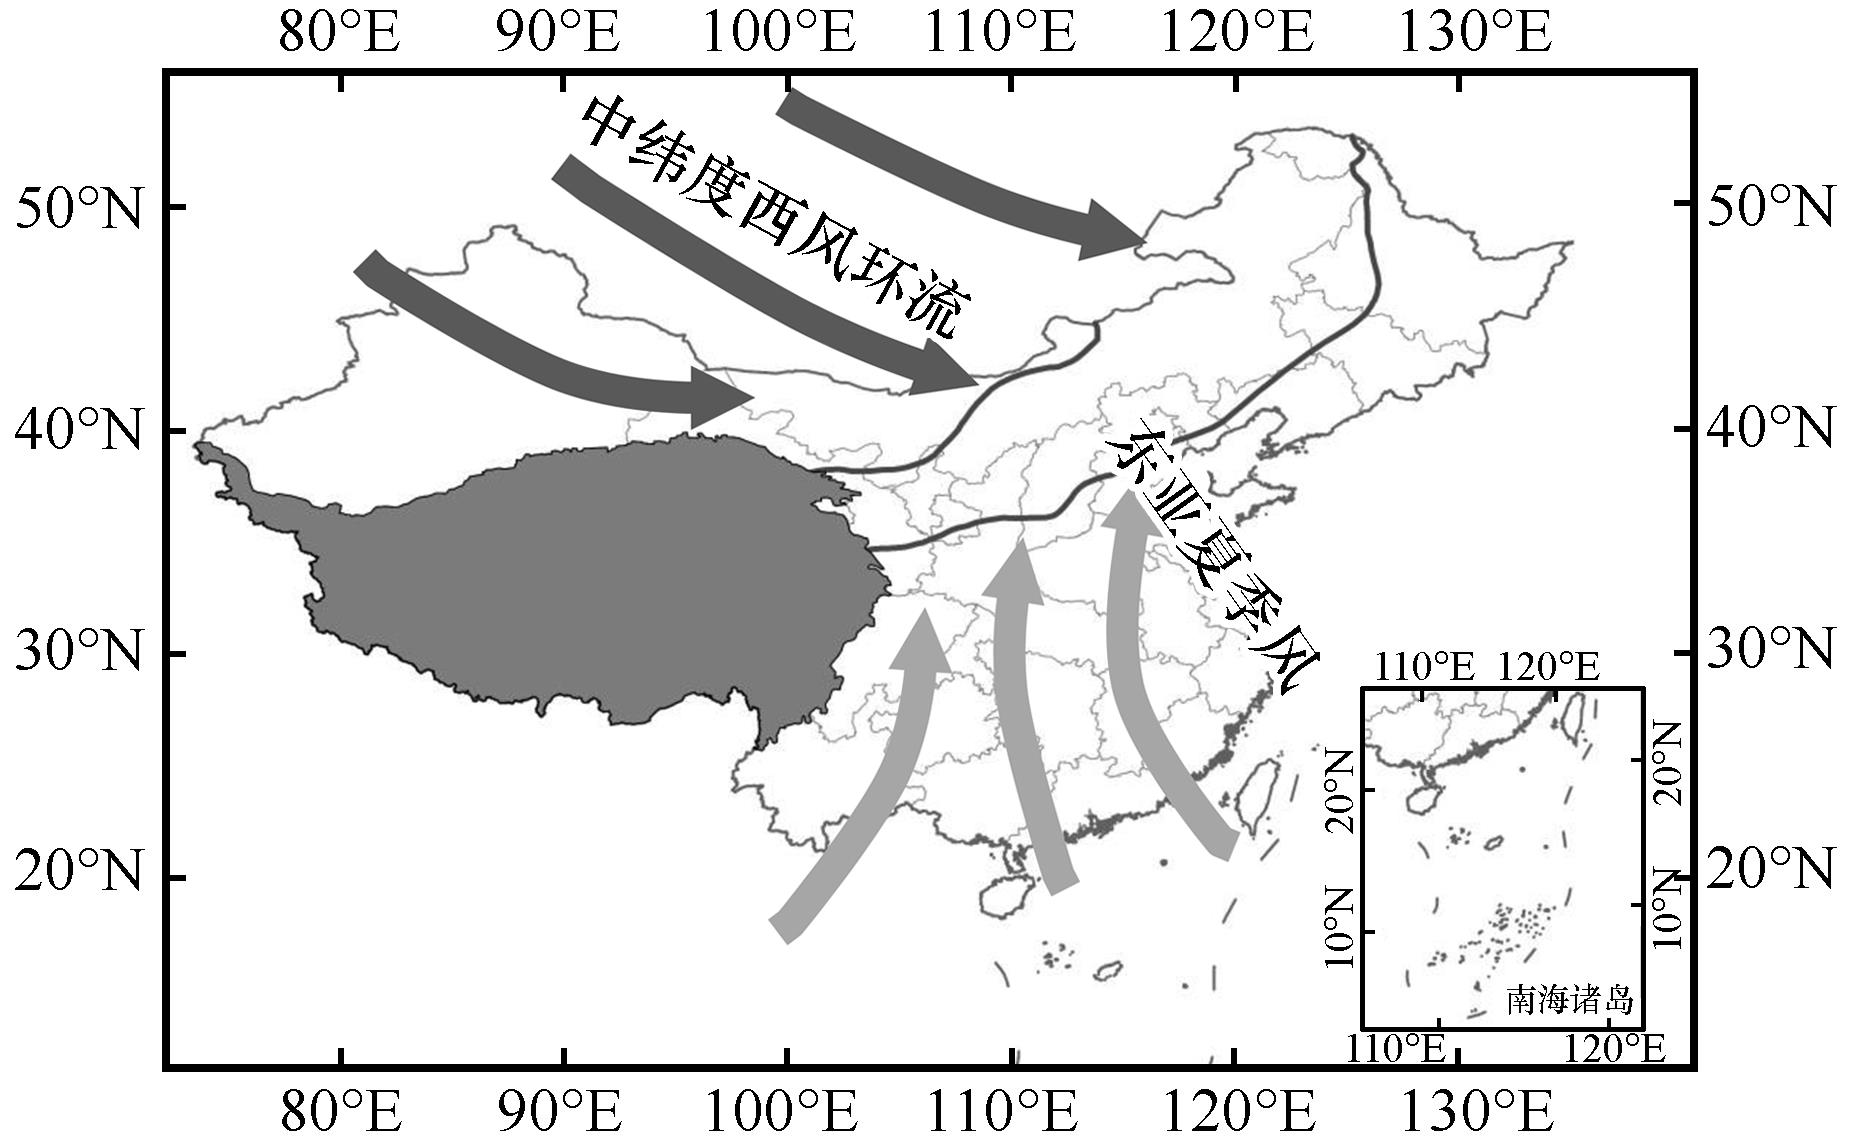
图1 夏季风影响过渡区范围(两条黑实线之间的区域)基于自然资源部标准地图服务网站GS(2020)4619号标准地图制作,底图边界无修改
Fig.1 Scope of the summer monsoon transition zone (the area between the two black solid lines)
| 数据类型 | 名称 | 蒸散发方案/陆面模型 | 空间分辨率 | 时间分辨率 | 时间长度 |
|---|---|---|---|---|---|
| 再分析资料 | NCEP/DOE | OSU LSM | T62 (200 km) | 6 h | 1979—2021年 |
| JRA-55 | SiB | 0.5°×0.5° | 3 h | 1958—2021年 | |
| ERA5 | HTESSEL | 0.25°×0.25° | 1 h | 1959—2021年 | |
| MERRA2 | Catchment LSM | 0.5°×0.625° | 1 h | 1980—2021年 | |
| 离线陆面模式数据集 | GLDAS2.0_NOAH | NOAH | 1°×1° | 3 h | 1958—2014年 |
| 蒸散发遥感产品 | GLEAMv3.6a | 改进的Priestley-Taylor方程 | 0.25°×0.25° | 1 month | 1980—2021年 |
| 陆面观测 | 中国北方陆面过程观测 | 涡动相关方法 | 14个站点 | 30 min | 详见 |
表1 本文使用资料简介
Table 1 Introduction of data used in the study
| 数据类型 | 名称 | 蒸散发方案/陆面模型 | 空间分辨率 | 时间分辨率 | 时间长度 |
|---|---|---|---|---|---|
| 再分析资料 | NCEP/DOE | OSU LSM | T62 (200 km) | 6 h | 1979—2021年 |
| JRA-55 | SiB | 0.5°×0.5° | 3 h | 1958—2021年 | |
| ERA5 | HTESSEL | 0.25°×0.25° | 1 h | 1959—2021年 | |
| MERRA2 | Catchment LSM | 0.5°×0.625° | 1 h | 1980—2021年 | |
| 离线陆面模式数据集 | GLDAS2.0_NOAH | NOAH | 1°×1° | 3 h | 1958—2014年 |
| 蒸散发遥感产品 | GLEAMv3.6a | 改进的Priestley-Taylor方程 | 0.25°×0.25° | 1 month | 1980—2021年 |
| 陆面观测 | 中国北方陆面过程观测 | 涡动相关方法 | 14个站点 | 30 min | 详见 |
| 站点名称 | 纬度 | 经度 | 下垫面类型 | 观测时段 |
|---|---|---|---|---|
| 沙坡头 | 37.45°N | 104.95°E | 荒漠 | 2008年7—9月;2009年7—9月 |
| 张掖 | 38.86°N | 100.41°E | 裸地 | 2008年7—9月;2009年7—9月 |
| 长武 | 35.20°N | 107.67°E | 农田 | 2008年7—9月;2009年7—9月 |
| 锦州 | 41.15°N | 121.20°E | 农田(玉米) | 2008年7—9月;2009年7—9月 |
| 密云 | 40.63°N | 117.32°E | 农田/果林 | 2008年7—9月;2009年7—9月 |
| 平凉 | 35.53°N | 106.94°E | 农田 | 2009年7月至2010年12月 |
| 庆阳 | 35.66°N | 107.84°E | 农田(小麦) | 2009年5月至2010年12月 |
| 馆陶 | 36.52°N | 115.13°E | 农田 | 2009年6—9月 |
| 阿柔 | 38.04°N | 100.46°E | 亚高山草甸 | 2008年7—9月;2009年7—9月 |
| 东苏 | 44.09°N | 113.57°E | 荒漠化草原 | 2008年7—9月;2009年7—9月 |
| 奈曼 | 42.93°N | 120.70°E | 荒漠化草原 | 2008年7—9月;2009年7—9月 |
| 通榆 | 44.88°N | 122.88°E | 退化草原 | 2003年1月至2008年12月 |
| 榆中 | 35.95°N | 104.13°E | 草原 | 2007年1月至2012年12月 |
| 锡林格勒 | 44.13°N | 116.32°E | 草原 | 2004年1月至2008年12月 |
表2 所选观测站点基本情况
Table 2 Basic information on selected observation sites
| 站点名称 | 纬度 | 经度 | 下垫面类型 | 观测时段 |
|---|---|---|---|---|
| 沙坡头 | 37.45°N | 104.95°E | 荒漠 | 2008年7—9月;2009年7—9月 |
| 张掖 | 38.86°N | 100.41°E | 裸地 | 2008年7—9月;2009年7—9月 |
| 长武 | 35.20°N | 107.67°E | 农田 | 2008年7—9月;2009年7—9月 |
| 锦州 | 41.15°N | 121.20°E | 农田(玉米) | 2008年7—9月;2009年7—9月 |
| 密云 | 40.63°N | 117.32°E | 农田/果林 | 2008年7—9月;2009年7—9月 |
| 平凉 | 35.53°N | 106.94°E | 农田 | 2009年7月至2010年12月 |
| 庆阳 | 35.66°N | 107.84°E | 农田(小麦) | 2009年5月至2010年12月 |
| 馆陶 | 36.52°N | 115.13°E | 农田 | 2009年6—9月 |
| 阿柔 | 38.04°N | 100.46°E | 亚高山草甸 | 2008年7—9月;2009年7—9月 |
| 东苏 | 44.09°N | 113.57°E | 荒漠化草原 | 2008年7—9月;2009年7—9月 |
| 奈曼 | 42.93°N | 120.70°E | 荒漠化草原 | 2008年7—9月;2009年7—9月 |
| 通榆 | 44.88°N | 122.88°E | 退化草原 | 2003年1月至2008年12月 |
| 榆中 | 35.95°N | 104.13°E | 草原 | 2007年1月至2012年12月 |
| 锡林格勒 | 44.13°N | 116.32°E | 草原 | 2004年1月至2008年12月 |
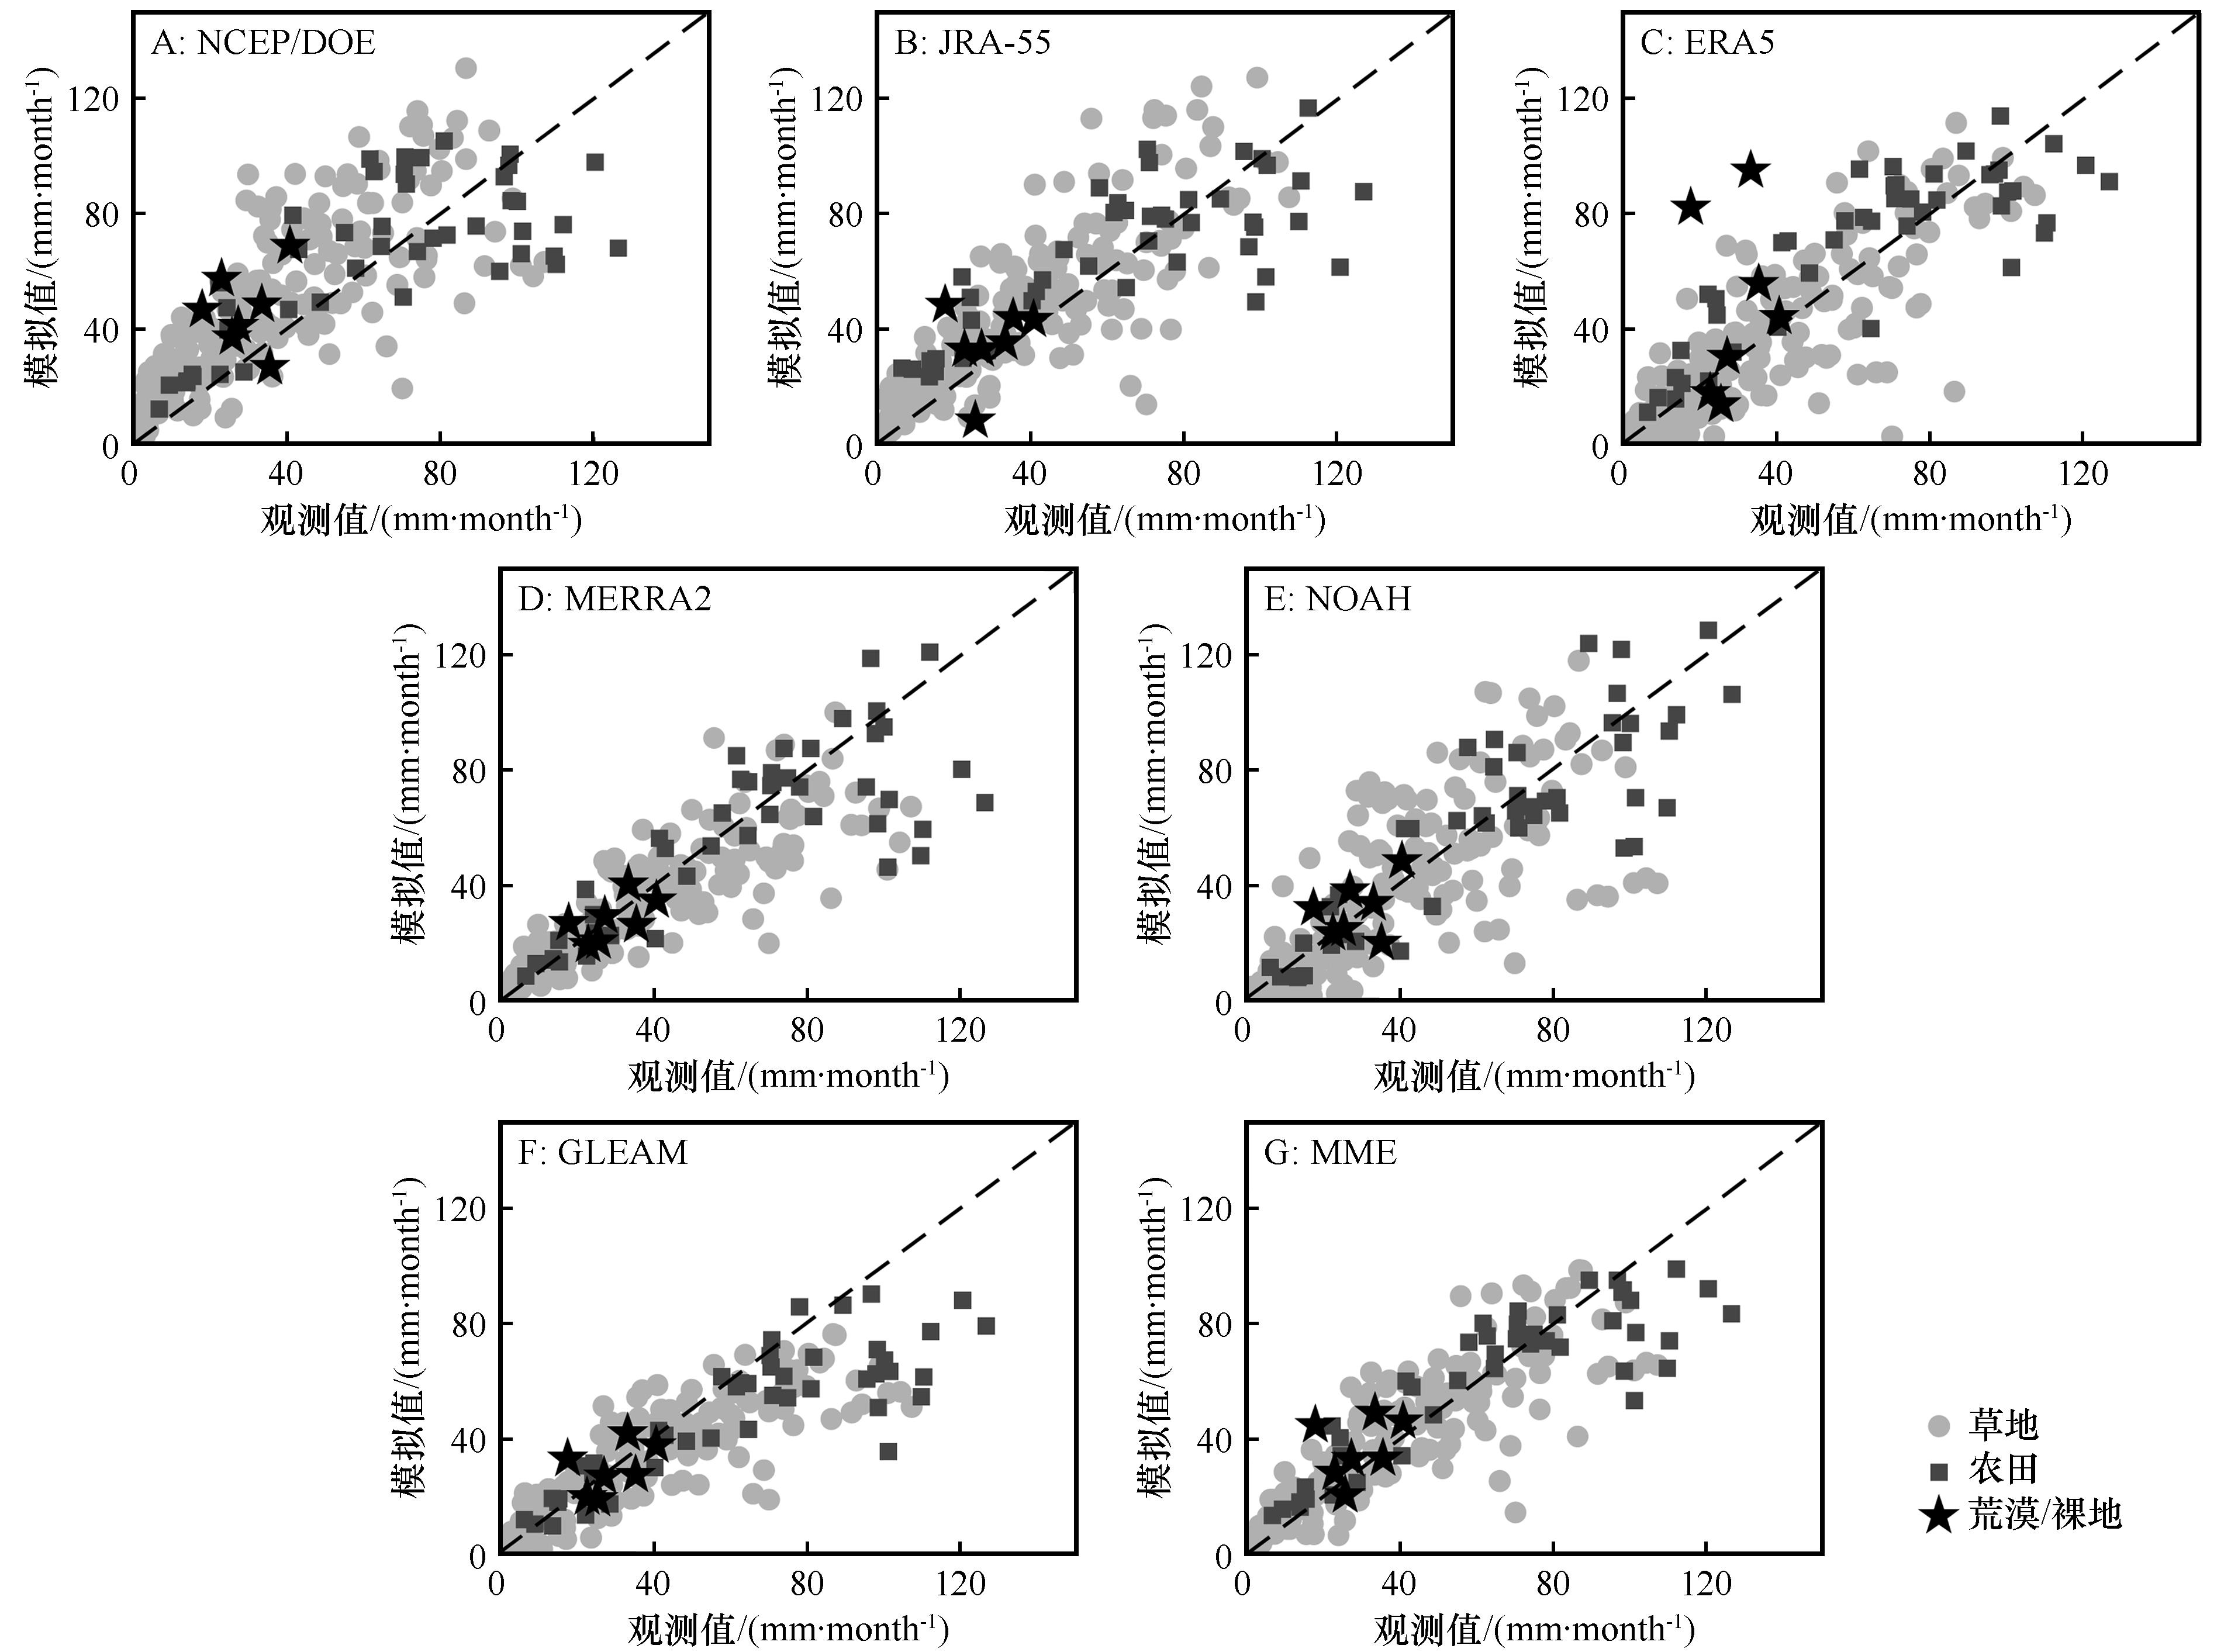
图2 草地、农田和荒漠/裸地3种下垫面类型蒸散发模拟值与观测值的散点分布(MME表示6种蒸散发产品的集合平均值)Fig.2 The scatter distributions of ET from simulation and observation in grassland, cropland, and desert / bare land(MME represents the ensemble mean of the six gridded datasets)
| 下垫面 | 统计指标 | 资料集 | ||||||
|---|---|---|---|---|---|---|---|---|
| NCEP/DOE | JRA-55 | ERA5 | MERRA2 | NOAH | GLEAM | MME | ||
| 草地 | RMSE/(mm·month-1) | 21.69 | 16.63 | 15.01 | 13.60 | 18.71 | 14.29 | 12.97 |
| Bias/(mm·month-1) | 12.34 | 6.88 | -1.23 | -2.79 | -1.32 | -4.94 | 1.49 | |
| R | 0.805 | 0.857 | 0.851 | 0.871 | 0.779 | 0.876 | 0.879 | |
| 农田 | RMSE/(mm·month-1) | 23.42 | 21.96 | 18.90 | 21.48 | 18.43 | 24.19 | 17.61 |
| Bias/(mm·month-1) | 0.45 | 1.40 | 3.98 | -5.35 | -3.29 | -14.97 | -2.96 | |
| R | 0.726 | 0.765 | 0.839 | 0.794 | 0.856 | 0.847 | 0.868 | |
| 所有站点 | RMSE/(mm·month-1) | 22.01 | 17.63 | 16.62 | 15.15 | 18.46 | 16.35 | 13.89 |
| Bias/(mm·month-1) | 10.39 | 5.89 | 0.26 | -3.18 | -1.57 | -6.57 | 0.87 | |
| R | 0.791 | 0.848 | 0.855 | 0.874 | 0.824 | 0.885 | 0.890 | |
表3 7种蒸散发格点资料的误差统计情况
Table 3 Error statistics of seven gridded ET dataset
| 下垫面 | 统计指标 | 资料集 | ||||||
|---|---|---|---|---|---|---|---|---|
| NCEP/DOE | JRA-55 | ERA5 | MERRA2 | NOAH | GLEAM | MME | ||
| 草地 | RMSE/(mm·month-1) | 21.69 | 16.63 | 15.01 | 13.60 | 18.71 | 14.29 | 12.97 |
| Bias/(mm·month-1) | 12.34 | 6.88 | -1.23 | -2.79 | -1.32 | -4.94 | 1.49 | |
| R | 0.805 | 0.857 | 0.851 | 0.871 | 0.779 | 0.876 | 0.879 | |
| 农田 | RMSE/(mm·month-1) | 23.42 | 21.96 | 18.90 | 21.48 | 18.43 | 24.19 | 17.61 |
| Bias/(mm·month-1) | 0.45 | 1.40 | 3.98 | -5.35 | -3.29 | -14.97 | -2.96 | |
| R | 0.726 | 0.765 | 0.839 | 0.794 | 0.856 | 0.847 | 0.868 | |
| 所有站点 | RMSE/(mm·month-1) | 22.01 | 17.63 | 16.62 | 15.15 | 18.46 | 16.35 | 13.89 |
| Bias/(mm·month-1) | 10.39 | 5.89 | 0.26 | -3.18 | -1.57 | -6.57 | 0.87 | |
| R | 0.791 | 0.848 | 0.855 | 0.874 | 0.824 | 0.885 | 0.890 | |
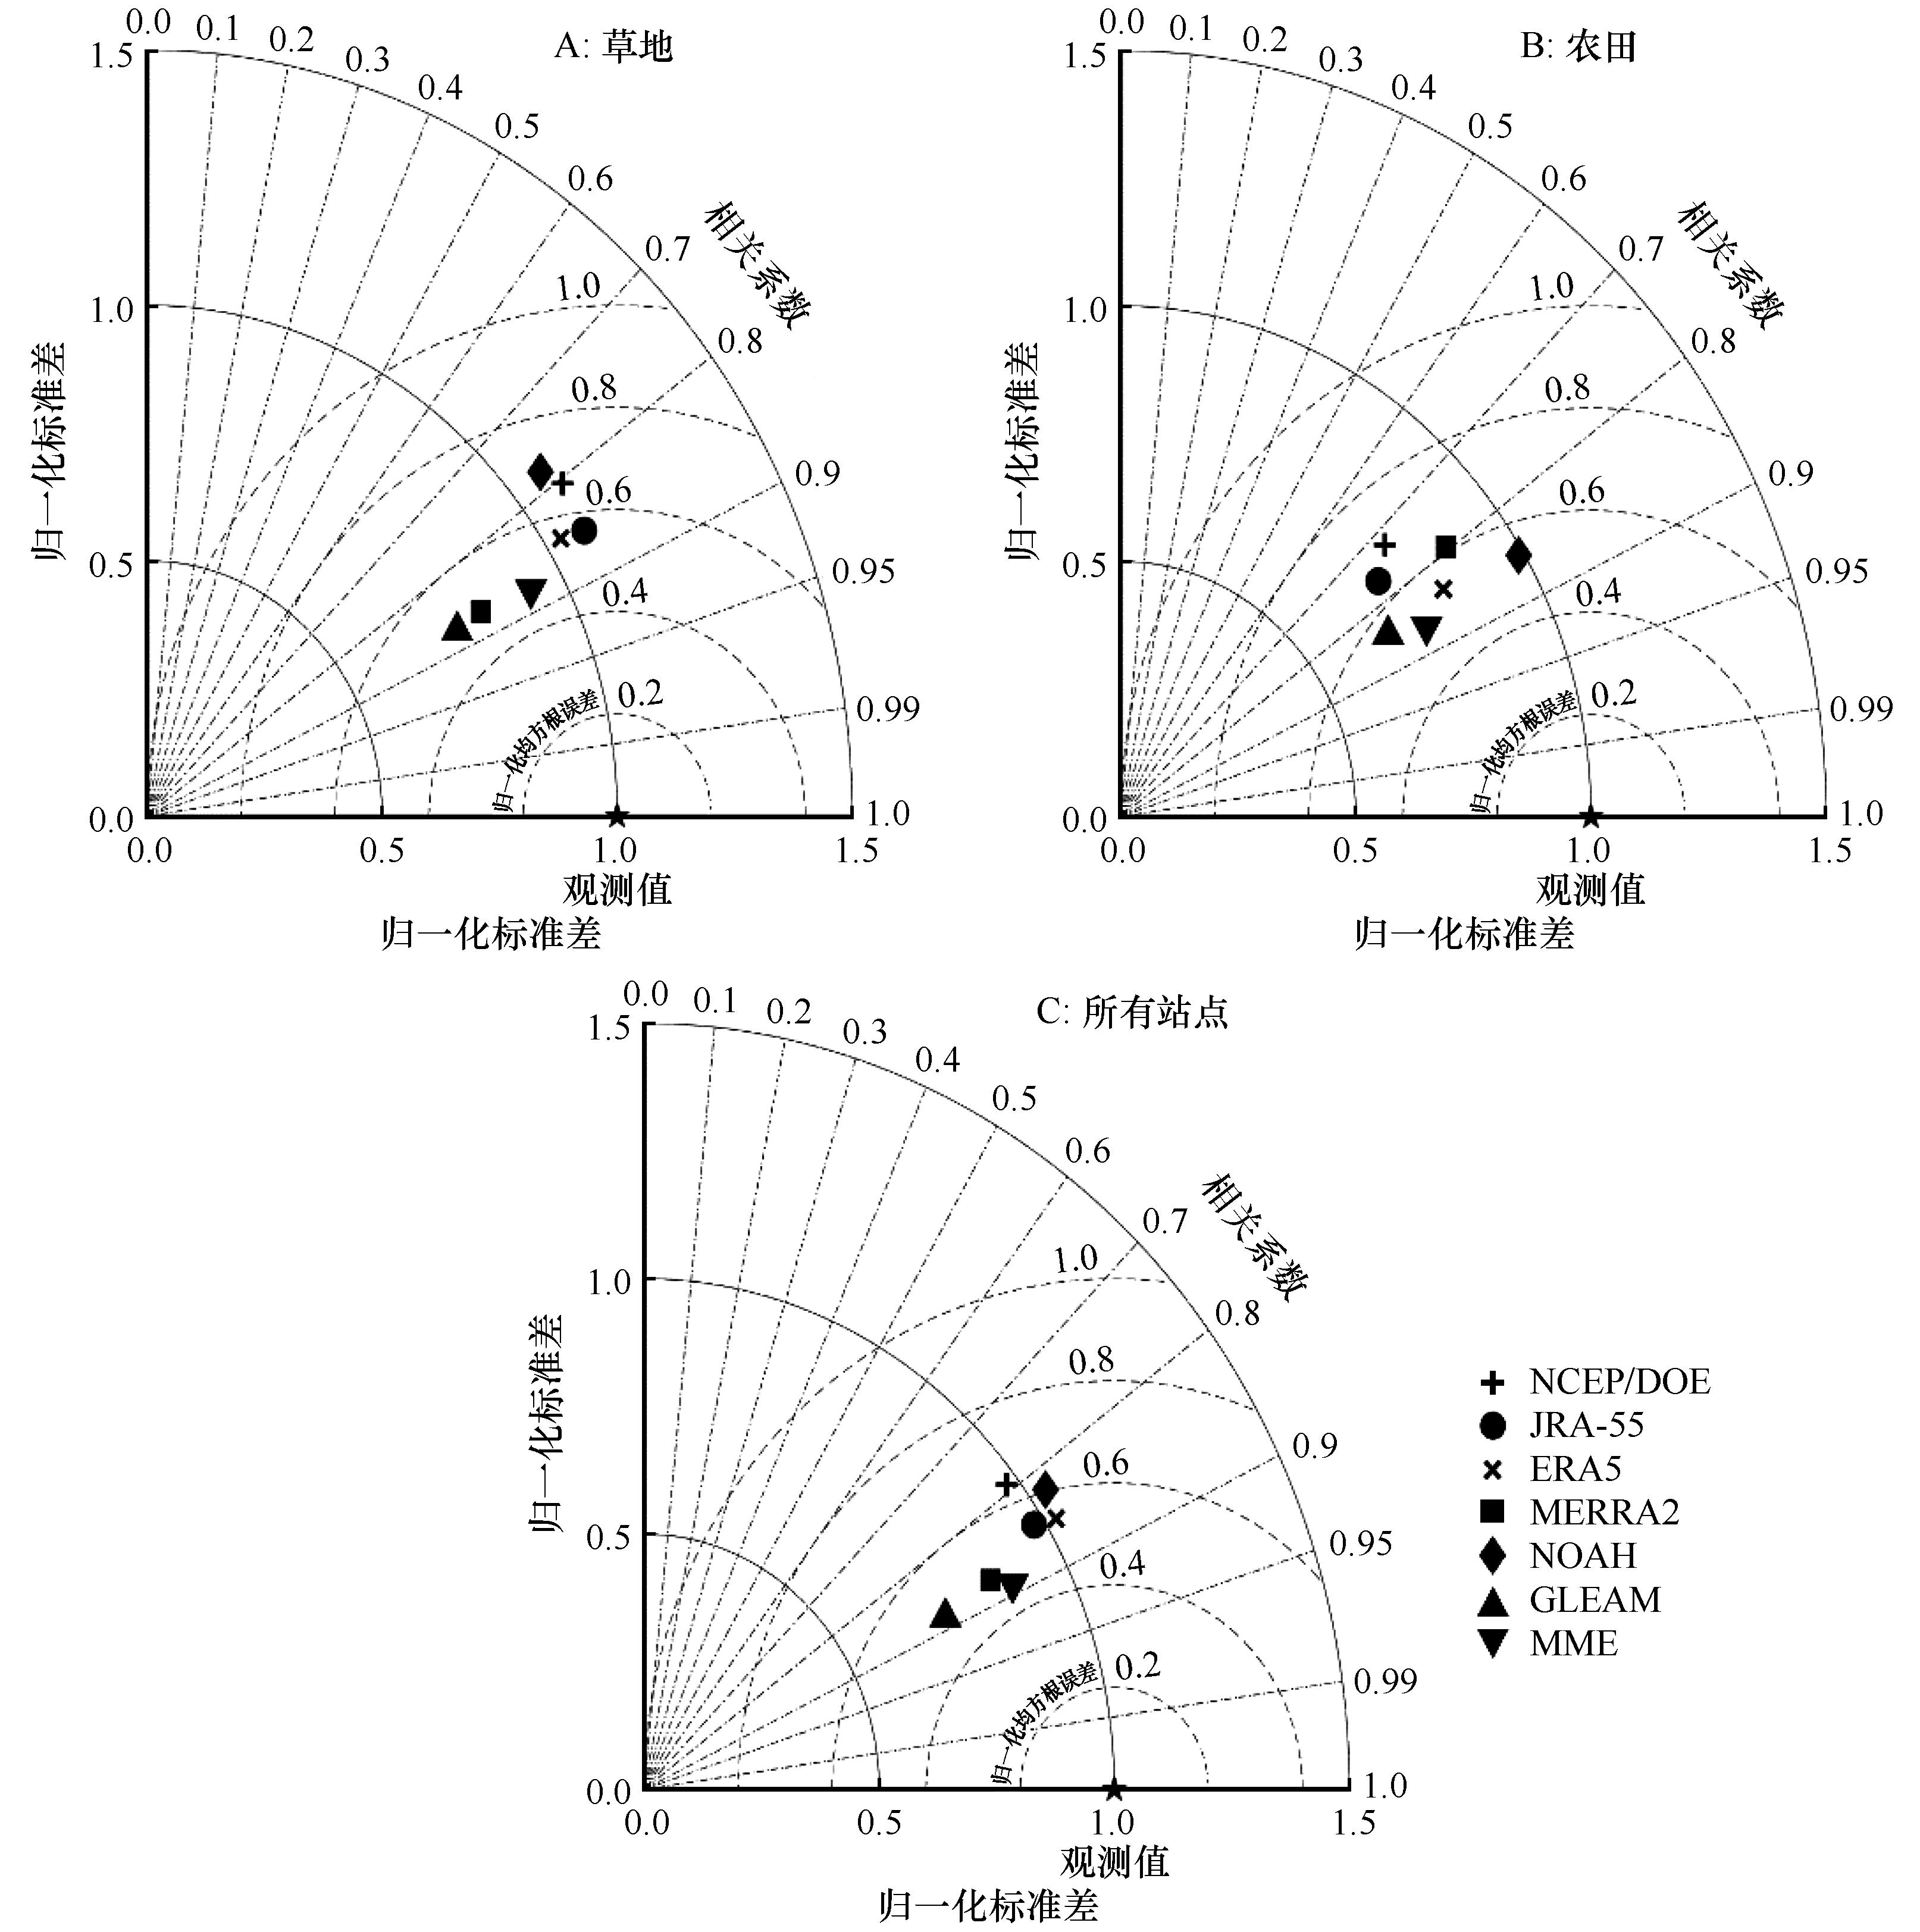
图3 7种蒸散发格点资料在草地下垫面(A)、农田下垫面(B)和所有站点(C)的统计泰勒图
Fig.3 Taylor diagram for seven ET gridded datasets over grassland (A), cropland (B) and all sites (C)
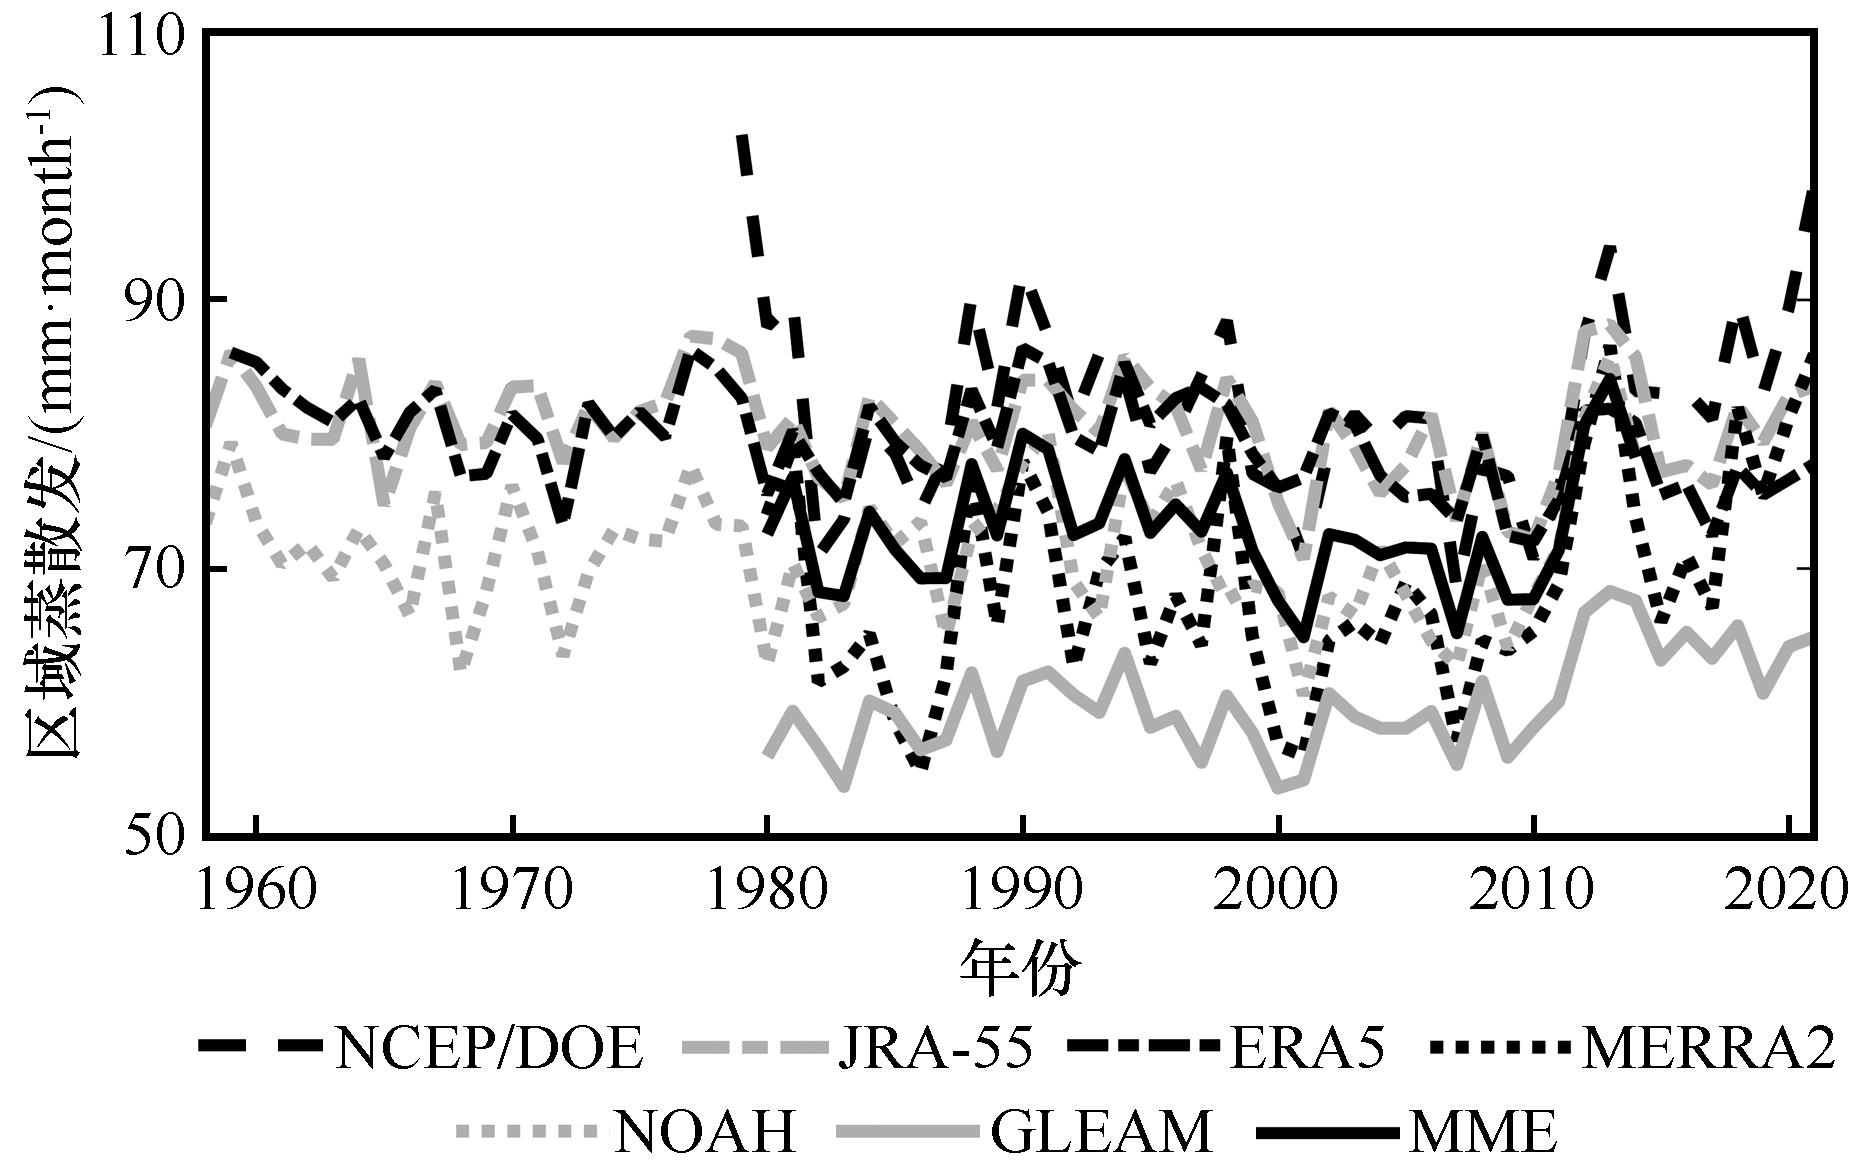
图4 夏季风影响过渡区7种格点资料夏季蒸散发的年际变化
Fig.4 Interannual variations in ET averaged over the summer monsoon transition zone for seven ET grid products during summer
| JRA-55 | ERA5 | MERRA2 | NOAH | GLEAM | MME | |
|---|---|---|---|---|---|---|
| NCEP/DOE | 0.719 | 0.676 | 0.869 | 0.549 | 0.617 | 0.889 |
| JRA-55 | 0.77 | 0.688 | 0.747 | 0.835 | 0.900 | |
| ERA5 | 0.513 | 0.68 | 0.587 | 0.788 | ||
| MERRA2 | 0.563 | 0.731 | 0.885 | |||
| NOAH | 0.749 | 0.814 | ||||
| GLEAM | 0.859 |
表4 夏季风影响过渡区夏季平均蒸散发在不同数据集之间的相关系数
Table 4 Coefficients of correlation between the gridded datasets for interannual variations in ET averaged over the summer monsoon transition zone (The five highest values in the first five columns are marked in bold)
| JRA-55 | ERA5 | MERRA2 | NOAH | GLEAM | MME | |
|---|---|---|---|---|---|---|
| NCEP/DOE | 0.719 | 0.676 | 0.869 | 0.549 | 0.617 | 0.889 |
| JRA-55 | 0.77 | 0.688 | 0.747 | 0.835 | 0.900 | |
| ERA5 | 0.513 | 0.68 | 0.587 | 0.788 | ||
| MERRA2 | 0.563 | 0.731 | 0.885 | |||
| NOAH | 0.749 | 0.814 | ||||
| GLEAM | 0.859 |
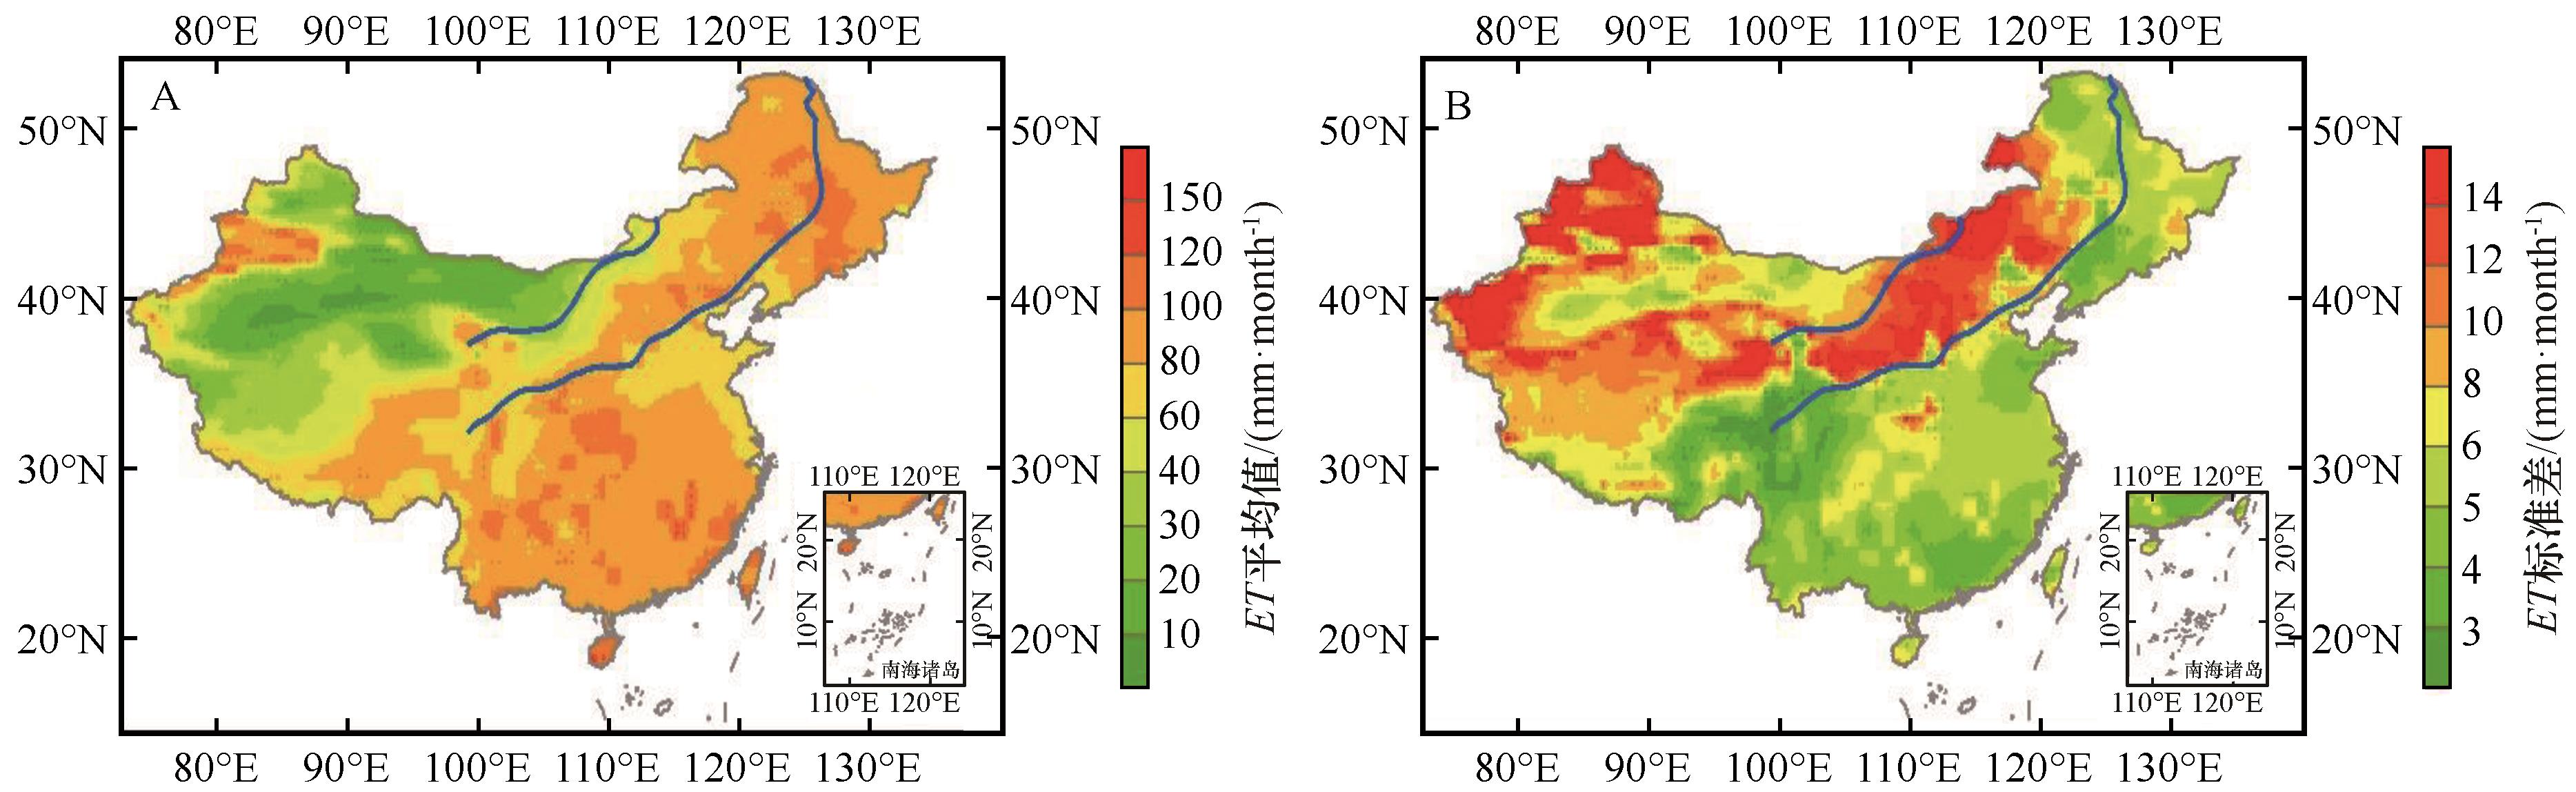
图5 夏季风影响过渡区蒸散发夏季气候平均(A)和年际变率(B)空间分布(蓝色实线表示夏季风影响过渡区的南北边界线)基于自然资源部标准地图服务网站GS(2020)4619号标准地图制作,底图边界无修改
Fig.5 Spatial patterns of the (A) mean and (B) standard deviation (STD) of interannual variations in ET averaged in summer (The area between the two blue lines represents the summer monsoon transition zone)
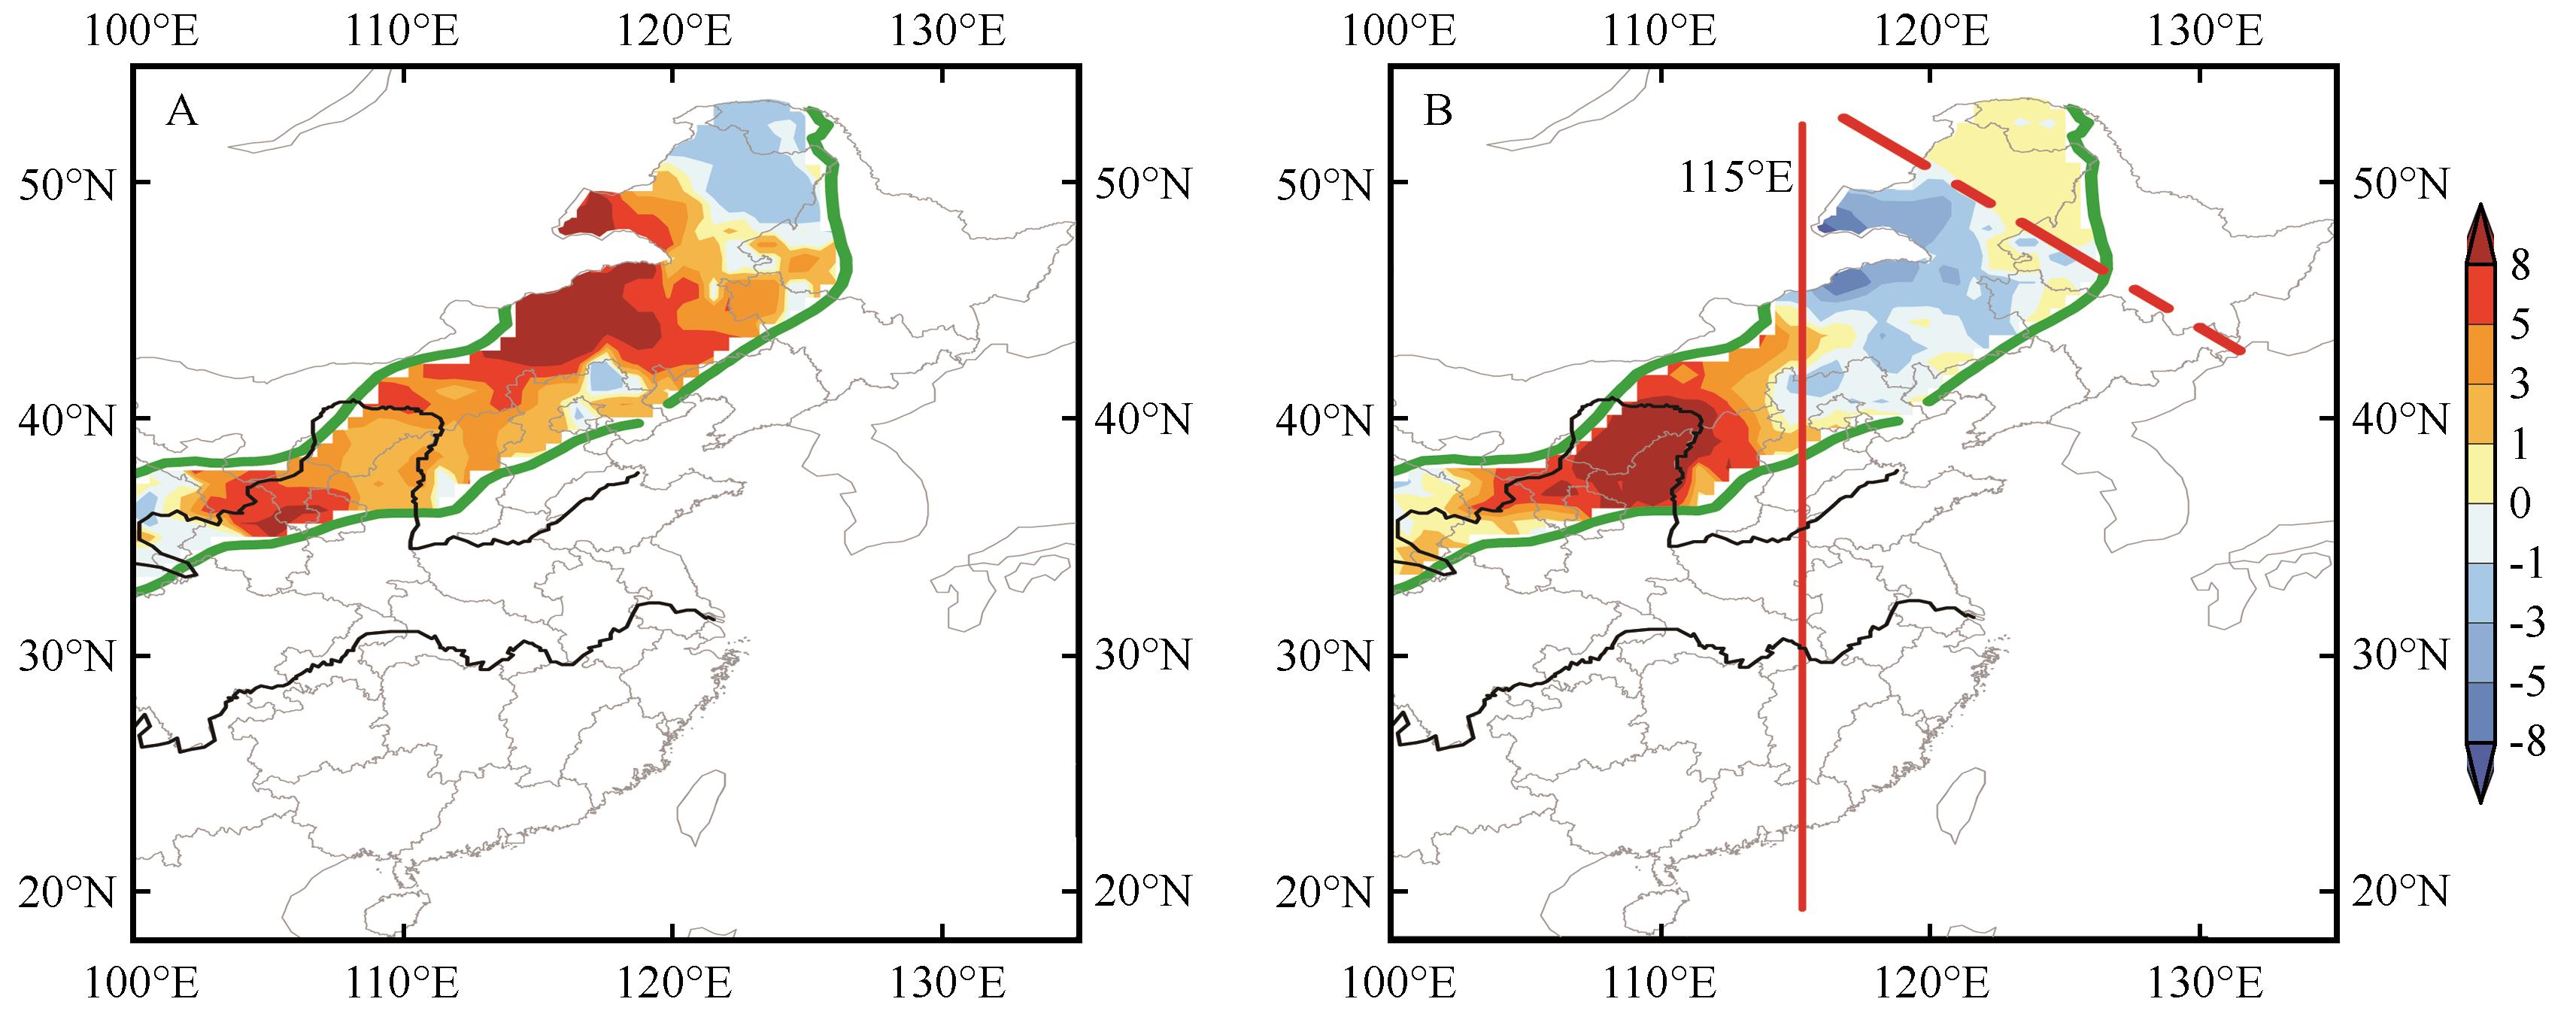
图6 夏季风影响过渡区蒸散发EOF分解第一(A)和第二(B)空间模态(115°E处的红色实线表示夏季风影响过渡区的东西部之间的边界;红色虚线表示夏季风影响过渡区北部和东部之间的边界)
Fig.6 The first two modes of EOF analysis of ET averaged in summer over the summer monsoon transition zone(The red solid line at 115°E indicates the boundary between the western and eastern parts. The red dashed line represents the boundary between the northern and eastern parts)
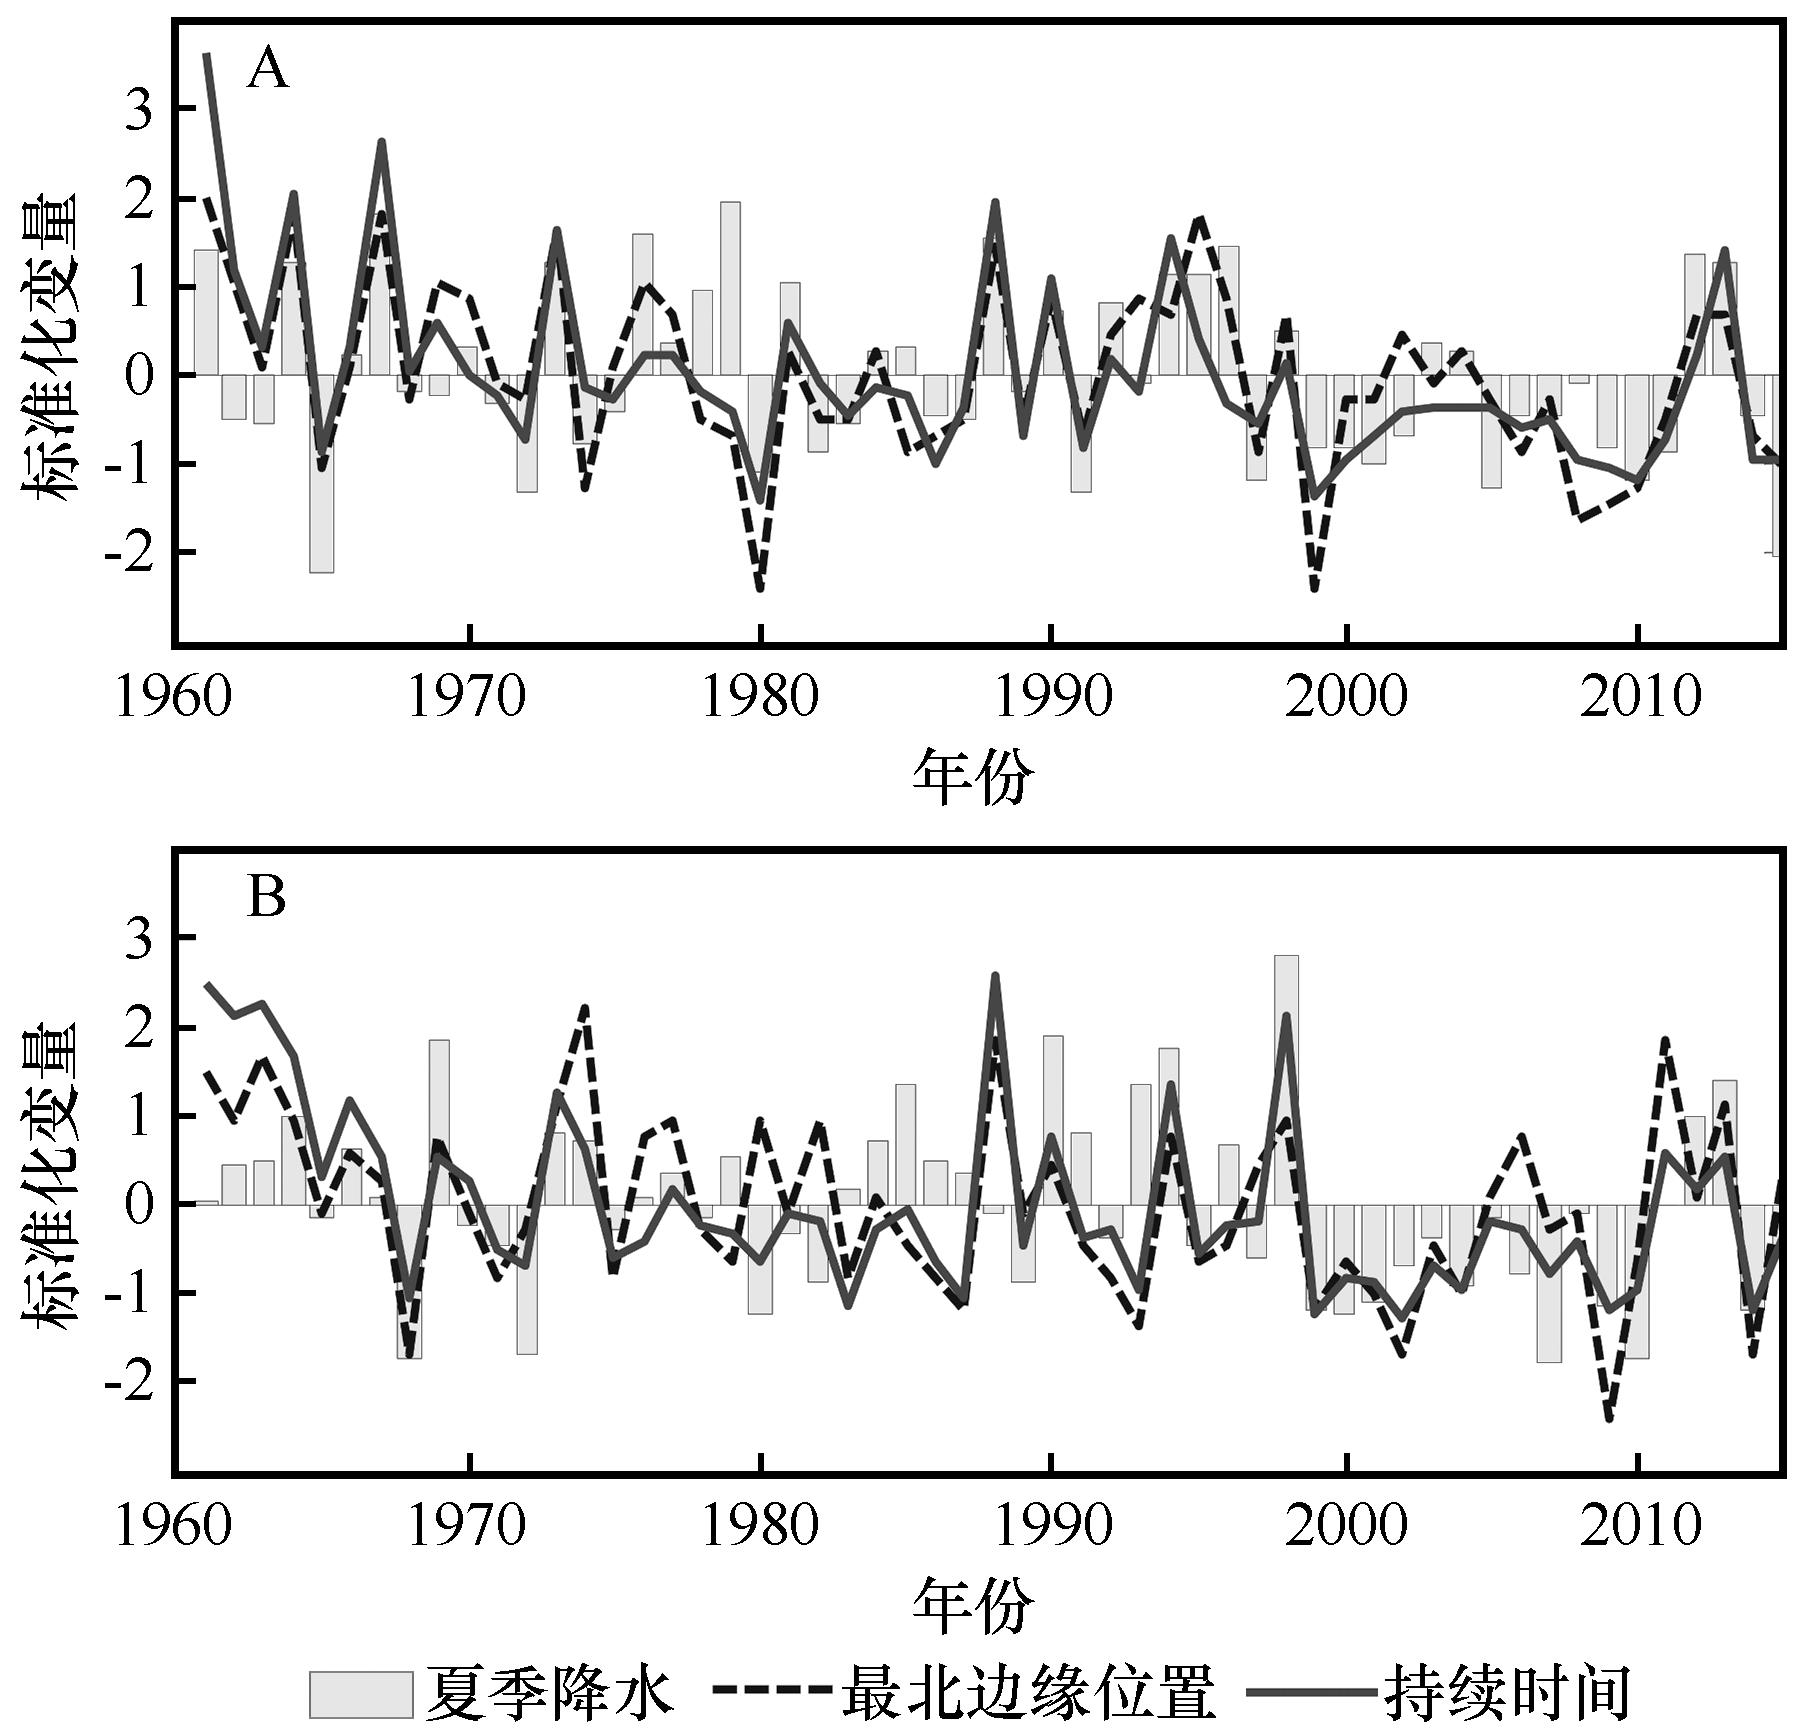
图7 过渡区西部(A)和东部(B)标准化的夏季降水、夏季风最北边缘位置和持续时间年际变化
Fig.7 Interannual variations of standardized values of summer rainfall, the monsoon northernmost marginal index, and the monsoon temporal duration index (MTDI) over the (A) western and (B) eastern parts of the summer monsoon transition zone
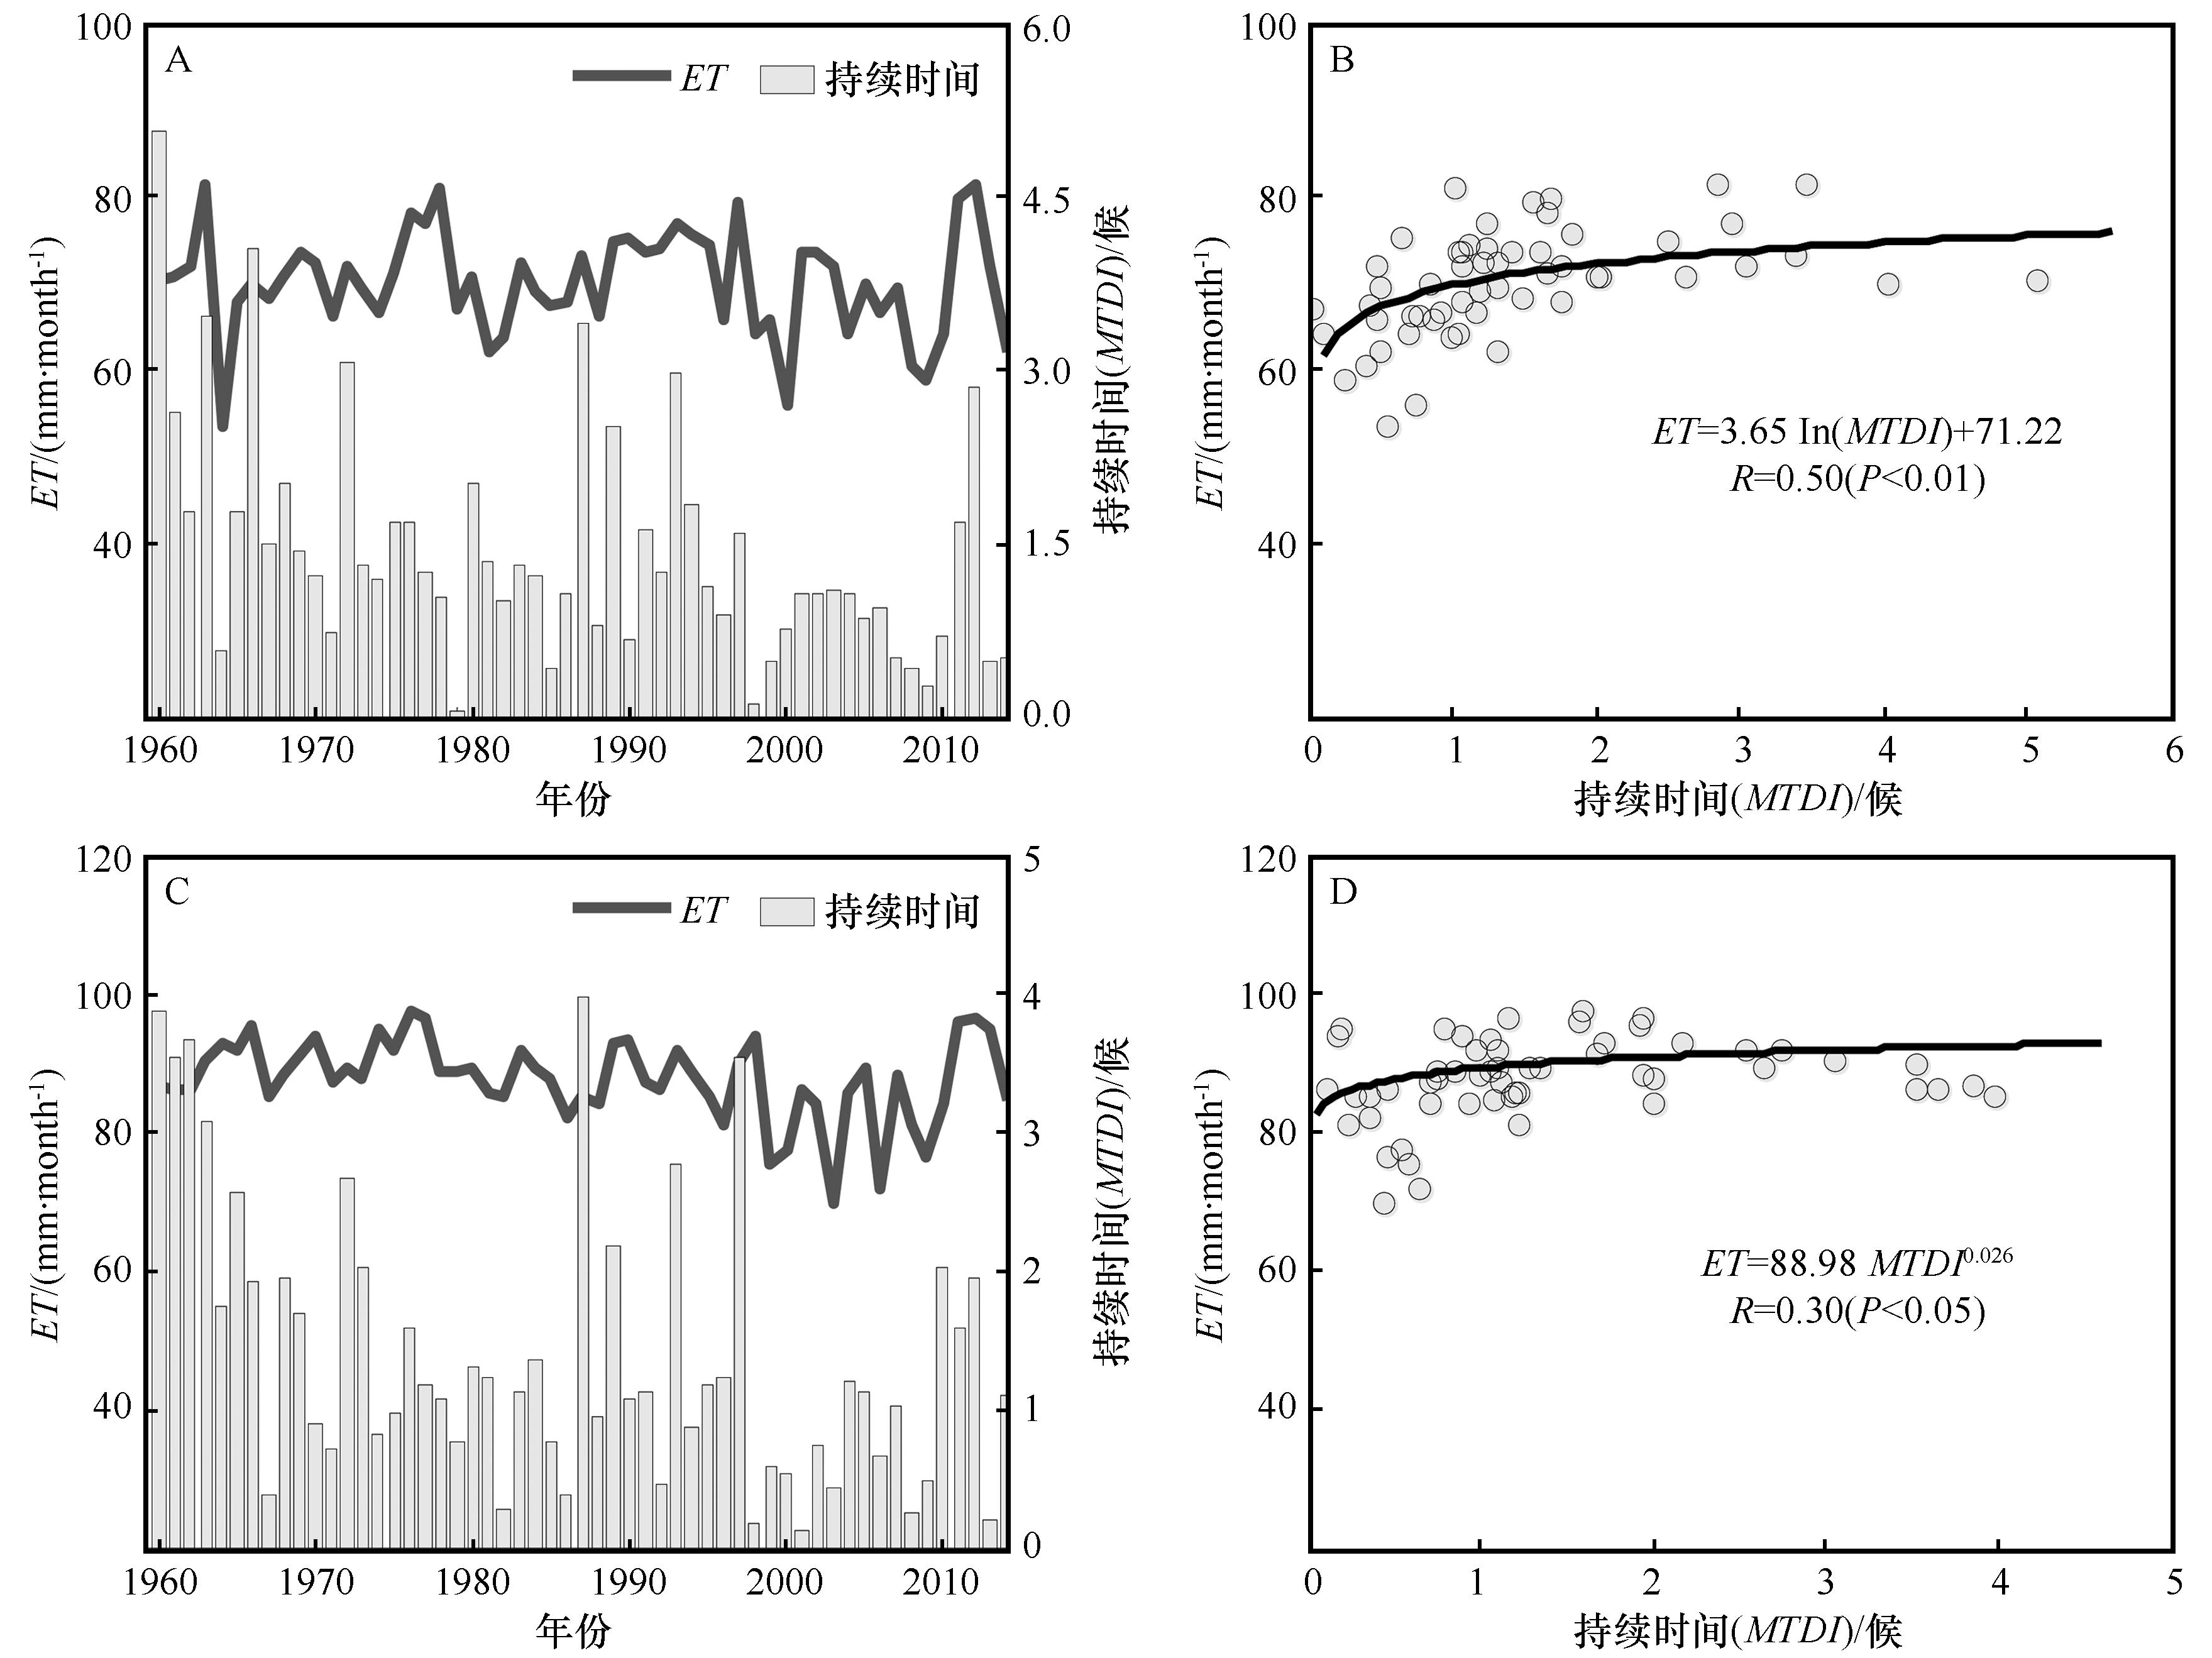
图8 夏季风影响过渡区西部(A)和东部(C)区域蒸散发和夏季风持续时间年际变化以及西部(B)和东部(D)二者散点分布
Fig.8 Interannual variations in ET and the monsoon temporal duration index (MTDI) for the (A) western and (C) eastern parts of the summer monsoon transition zone, and scatterplots between ET and the MTDI for the (B) western and (D) eastern parts of the summer monsoon transition zone
| 周期 | 夏季风持续时间(MTDI) | 蒸散发(ET) |
|---|---|---|
| ~3年 | 3.4年(25.4%) | 3.2年(59.7%) |
| 5~8年 | 7.9年(9.8%) | 6.9年(12.6%) |
| 年代际 | 18.0年(3.5%) | 13.8年(14.4%),27.5年(7.6%) |
| 非线性趋势 | (61.3%) | (5.8%) |
表5 夏季风影响过渡区西部区域夏季风持续时间和蒸散发通过集合经验模态分解获得的平均周期和方差贡献(括号内数值)
Table 5 Mean periods and their variance contributions (in parentheses) of various time scale components of the monsoon temporal duration index (MTDI) and the summer mean ET over the western part of the summer monsoon transition zone obtained from the ensemble empirical mode decomposition method
| 周期 | 夏季风持续时间(MTDI) | 蒸散发(ET) |
|---|---|---|
| ~3年 | 3.4年(25.4%) | 3.2年(59.7%) |
| 5~8年 | 7.9年(9.8%) | 6.9年(12.6%) |
| 年代际 | 18.0年(3.5%) | 13.8年(14.4%),27.5年(7.6%) |
| 非线性趋势 | (61.3%) | (5.8%) |
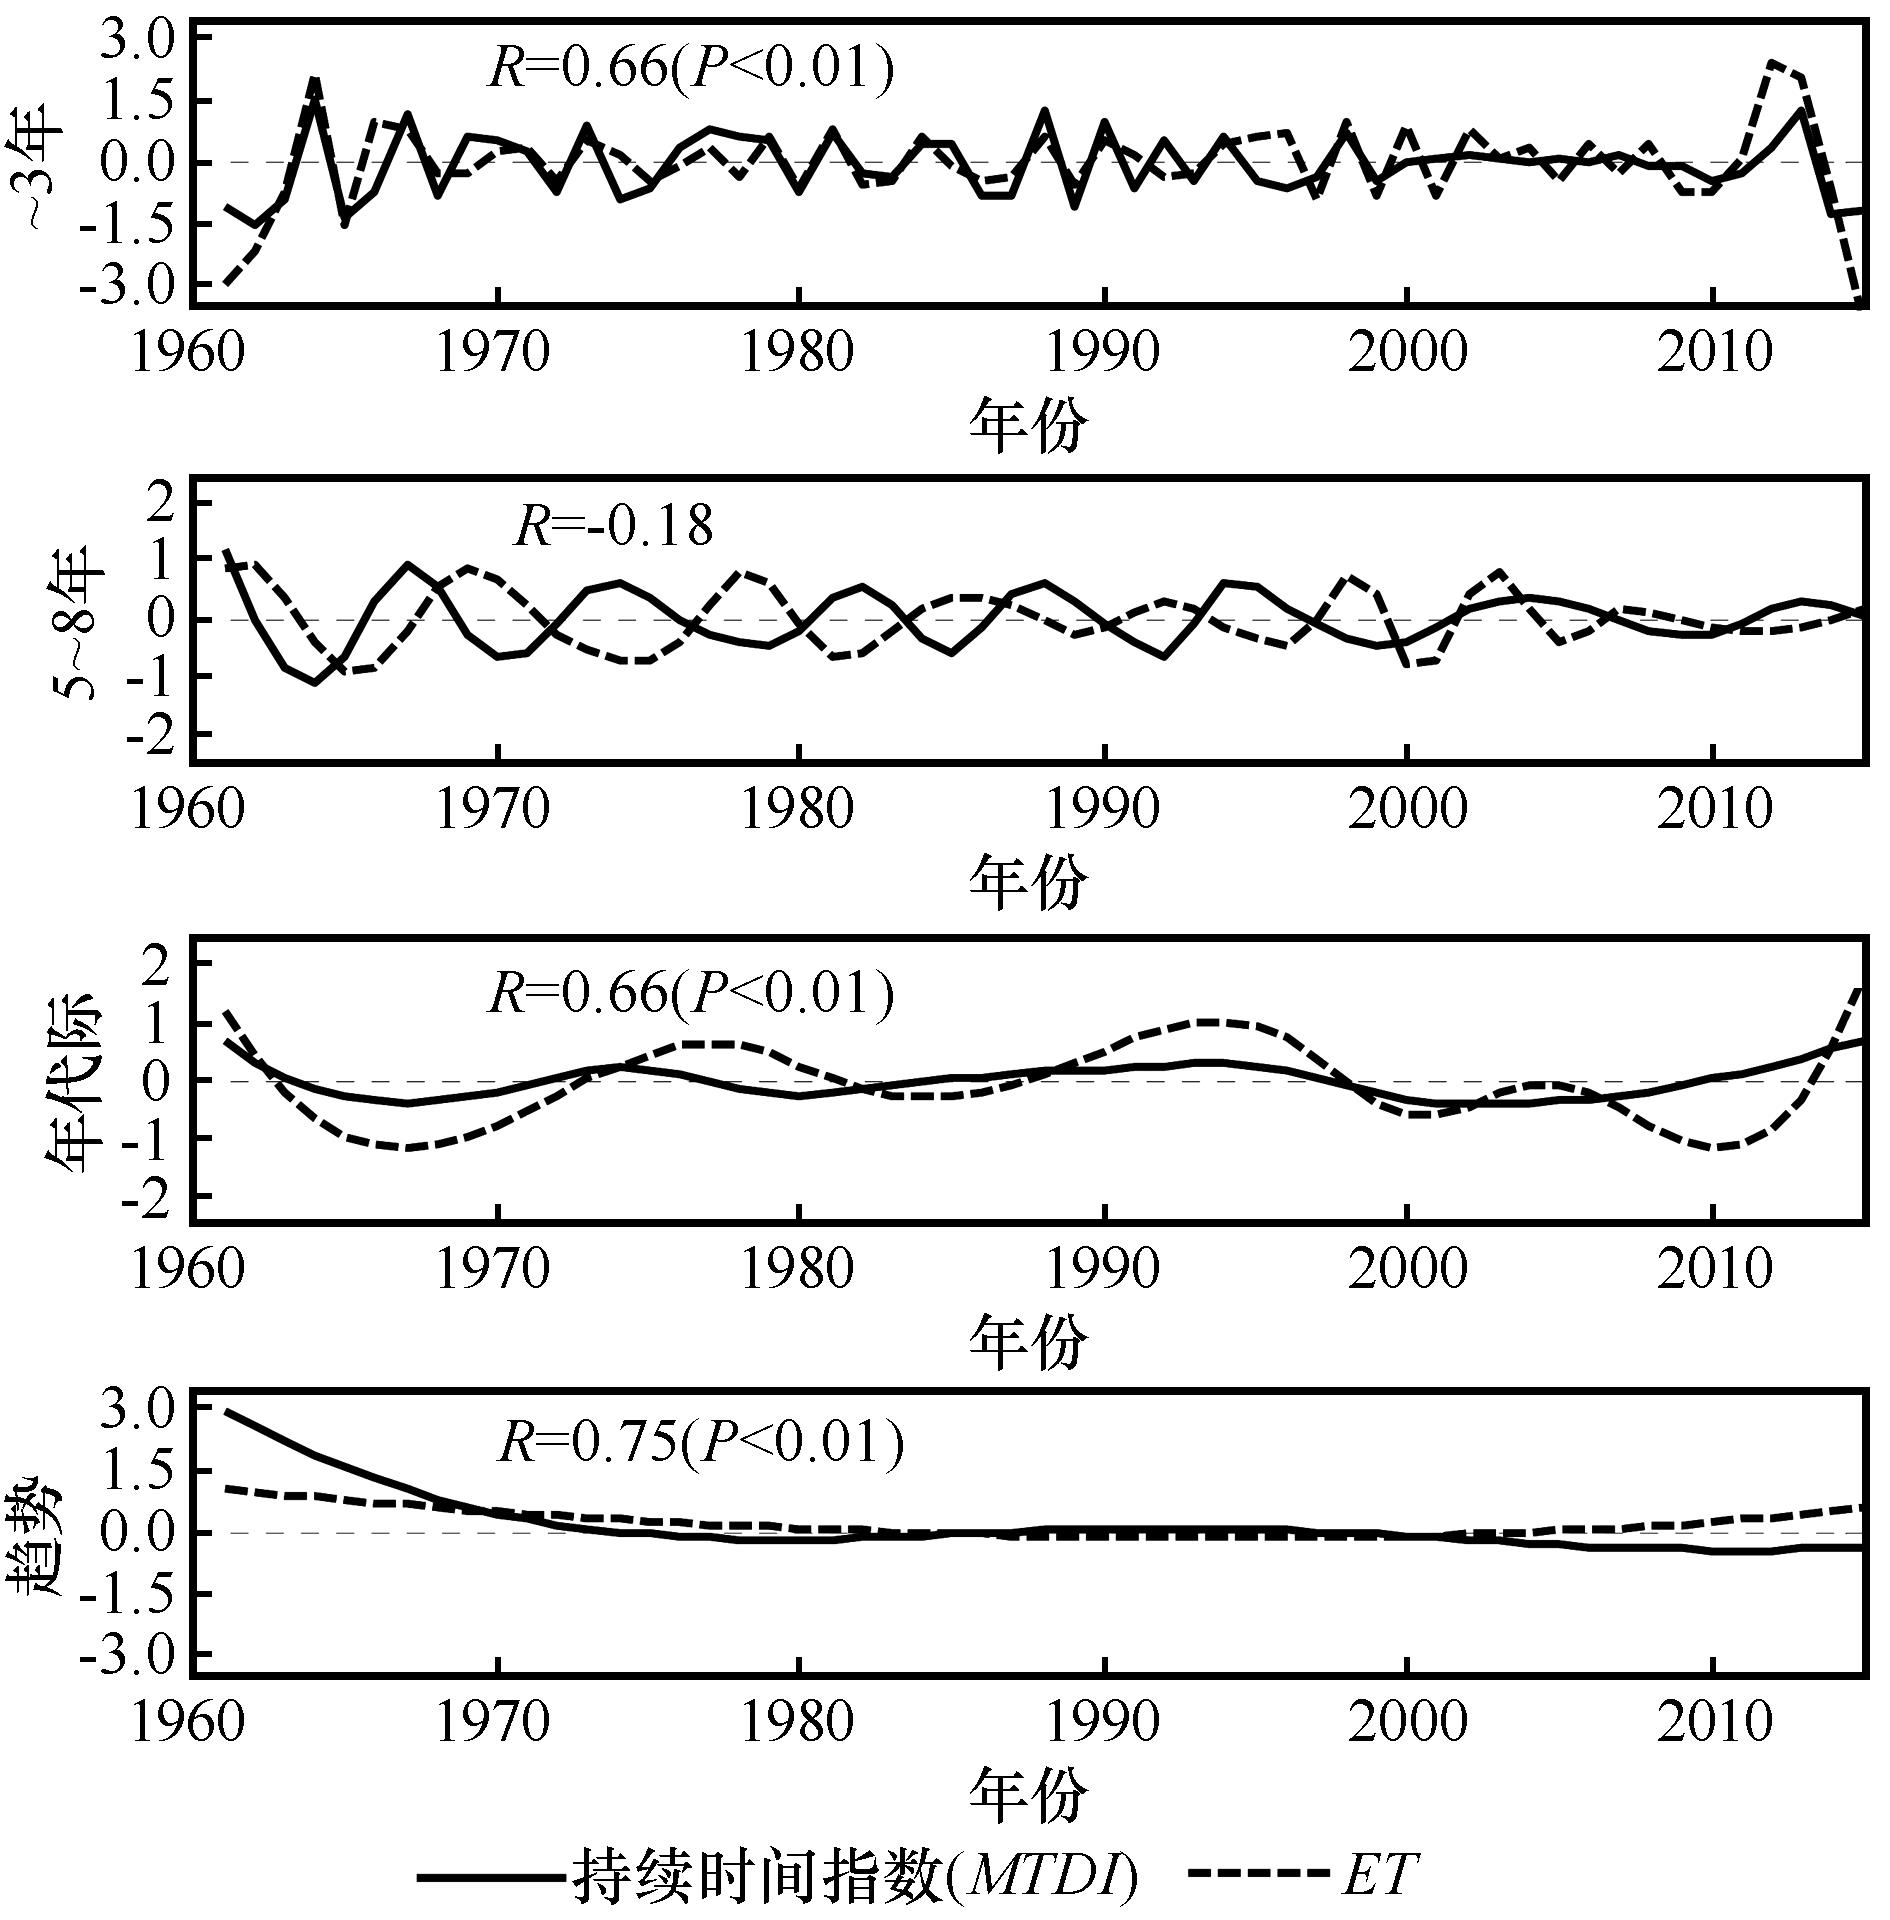
图9 夏季风影响过渡区西部区域夏季风持续时间和蒸散发集合经验模态分解结果
Fig.9 Decomposition of the monsoon temporal duration index (MTDI) and ET over the western part of the summer monsoon transition zone obtained from the ensemble empirical mode decomposition method
| 1 | 林祥,钱维宏.全球季风和季风边缘研究[J].地球科学进展,2012,27(1):26-34. |
| 2 | 欧廷海,钱维宏.东亚季风边缘带上的植被变化[J].地球物理学报,2006,49(3):698-705. |
| 3 | 符淙斌,马柱国.全球变化与区域干旱化[J].大气科学,2008,32(4):752-760. |
| 4 | Wang K, Dickinson R E.A review of global terrestrial evapotranspiration:observation,modeling,climatology,and climatic variability[J].Reviews of Geophysics,2012,50:RG2005. |
| 5 | Yue P, Zhang Q, Yang Y,et al.Seasonal and inter-annual variability of the bowen ratio over semi-arid grassland in the Chinese Loess Plateau[J].Agricultural & Forest Meteorology,2018,252:99-108. |
| 6 | Huang J, Li Y, Fu C,et al.Dryland climate change: recent progress and challenges[J].Reviews of Geophysics,2017,55:719-778. |
| 7 | Zhang Q, Yang Z S, Hao X C,et al.Conversion features of evapotranspiration responding to climate warming in transitional climate regions in northern China[J].Climate Dynamics,2018,52(7):3891-3903. |
| 8 | Koster R D, Dirmeyer P A, Guo Z C,et al.Regions of strong coupling between soil moisture and precipitation[J].Science,2004,305:1138-1140. |
| 9 | 黄菲,李栋梁,汤绪,等.用过程透雨量确定的东亚夏季风北边缘特征[J].应用气象学报,2009,20(5):530-538. |
| 10 | 胡豪然,钱维宏.东亚夏季风北边缘的确认[J].自然科学进展,2007,17(1):57-65. |
| 11 | Zhang H L, Zhang Q, Yue P,et al.Aridity over a semi-arid zone in Northern China and responses to the East Asian Summer Monsoon[J].Journal of Geophysical Research:Atmospheres,2016,121:13901-13918. |
| 12 | Kanamitsu M, Ebisuzaki W, Woollen J,et al.The NCEP-DOE AMIP-II reanalysis (R2)[J].Bulletin of the American Meteorological Society,2002,83:1631-1643. |
| 13 | Kobayashi S, Ota Y, Harada Y,et al.The JRA-55 Reanalysis: General specifications and basic characteristics[J].Journal of the Meteorological Society of Japan,2015,93:5-48. |
| 14 | Hersbach H, Bell B, Berrisford P,et al.The ERA5 global reanalysis[J].Quarterly Journal of the Royal Meteorological Society,2020,146(730):1999-2049. |
| 15 | Gelaro R, Mccarty W, Suárez M J,et al.The modern-era retrospective analysis for research and applications,version 2 (MERRA-2)[J].Journal of Climate,2017,30:5419-5454. |
| 16 | Rodell M, Houser P R, Jambor U.The global land data assimilation system[J].Bulletin of the American Meteorological Society,2004,85:381-394. |
| 17 | Miralles D G, Holmes T R H, De Jeu R,et al.Global land-surface evaporation estimated from satellite-based observations[J].Hydrology and Earth System Sciences,2011,15:453-469. |
| 18 | Li H, Fu C, Guo W.An integrated evaluation of land surface energy fluxes over China in seven reanalysis/ modeling products[J].Journal Of Geophysical Research-atmospheres,2017,122(16):8543-8566. |
| 19 | 曾剑,张强,王胜.中国北方不同气候区晴天陆面过程区域特征差异[J].大气科学,2011,35(3):483-494. |
| 20 | Zhang Q, Zeng J, Zhang L Y.Characteristics of land surface thermal-hydrologic processes for different regions over North China during prevailing summer monsoon period[J].Science China-Earth Sciences,2012,55(11):1872-1880. |
| 21 | 李宏宇,张强,王春玲,等.基于多源陆面通量数据相融合的新资料及其在中国夏季风影响过渡区的应用[J].大气科学,2020,44(6):1224-1242. |
| 22 | Twine T E, Kustas W P, Norman J M.Correcting eddy-covariance flux underestimates over a grassland[J].Agricultural & Forest Meteorology,2000,103(3):279-300. |
| 23 | Taylor K E.Summarizing multiple aspects of model performance in a single diagram[J].Journal of Geophysical Research Atmospheres,2001,106(D7):7183-7192. |
| 24 | Huang N E, Wu Z H.A review on Hilbert-Huang transform: method and its applications to geophysical studies[J].Reviews of Geophysics,2008,46:RG2006. |
| 25 | Krishnamurti T N, Kishtawal C M, Larow T E,et al.Improved weather and seasonal climate forecasts from multimodel superensemble[J].Science,1999,285:1548-1550. |
| 26 | Lu J, Wang G, Chen T,et al.A harmonized global land evaporation dataset from model-based products covering 1980-2017[J].Earth System Science Data,2021,13:5879-5898. |
| 27 | Pan S F, Pan N Q, Tian H Q,et al.Evaluation of global terrestrial evapotranspiration using state-of-the-art approaches in remote sensing,machine learning and land surface modeling[J].Hydrology and Earth System Sciences,2020,24:1485-1509. |
| 28 | Jiménez C, Prigent C, Mueller B,et al.Global intercomparison of 12 land surface heat flux estimates[J].Journal of Geophysical Research: Atmospheres,2011,116:D02102. |
| 29 | Chen W, Wang L, Feng J,et al.Recent progress in studies of the variabilities and mechanisms of the East Asian Monsoon in a changing climate[J].Advances in Atmospheric Sciences,2019,36(9):887-901. |
| 30 | 张强,岳平,张良,等.夏季风过渡区的陆-气相互作用:述评与展望[J].气象学报,2019,77(4):758-773. |
| 31 | 曾剑,张强,王春玲.东亚夏季风边缘摆动区陆面能量时空分布规律及其与气候环境的关系[J].气象学报,2016,74(6):876-888. |
| 32 | Nemani R R, Keeling C D, Hashimoto H,et al.Climate-driven increases in global terrestrial net primary production from 1982 to 1999[J].Science,2003,300(5625):1560-1563. |
| 33 | Jung M, Reichstein M, Ciais P,et al.Recent decline in the global land evapotranspiration trend due to limited moisture supply[J].Nature,2010,467(7318):951-954. |
| 34 | Li J P, Zeng Q C.A unified monsoon index[J].Geophysical Research Letters,2002,29(8):1274. |
| 35 | Webster P J, Yang S.Monsoon and ENSO:selectively interactive systems[J].Quarterly Journal of the Royal Meteorological Society,1992,118:877-926. |
| 36 | Chen H, Ding Y H, He J H.Reappraisal of Asian summer monsoon indices and the long-term variation of monsoon[J].Acta Meteorologica Sinica,2006,64(6):770-779. |
| 37 | Zeng J, Zhang Q.A humidity index for the summer monsoon transition zone in East Asia[J].Climate Dynamics,2019,53(9):5511-5527. |
| 38 | Belmont A D, Dartt D G.Variation with longitude of the quasi-biennial oscillation[J].Monthly Weather Review,1968,96:767-777. |
| 39 | Li C Y, Pan J, Que Z P.Variation of the East Asian Monsoon and the tropospheric biennial oscillation [J].Chinese Science Bulletin,2011,56:70-75. |
| 40 | Qian C, Zhou T J.Multidecadal variability of North China aridity and its relationship to PDO during 1900-2010[J].Journal of Climate,2014,27(3):1210-1222. |
| 41 | Wu Q Y, Li Q Q, Ding Y H,et al.Asian summer monsoon responses to the change of landsea thermodynamic contrast in a warming climate:CMIP6 projections[J].Advances in Climate Change Research,2022,13(2):205-217. |
| 42 | Yang K, Wu H, Qin J,et al.Recent climate changes over the Tibetan Plateau and their impacts on energy and water cycle:a review [J].Global and Planetary Change,2014,112:79-91. |
| 43 | 周天军,陈梓明,陈晓龙,等.IPCC AR6报告解读:未来的全球气候:基于情景的预估和近期信息[J].气候变化研究进展,2021,17(6): 652-663. |
| [1] | 付光祥, 何清, 王国胜, 马明杰, 阴璐璐, 张乾, 田伟. 塔克拉玛干沙漠南缘生态过渡区辐射平衡特征[J]. 中国沙漠, 2023, 43(5): 116-128. |
| [2] | 张琦, 苏永红, 冯起, 鱼腾飞, 马小红. 以地下水位估算的荒漠河岸胡杨( Populus euphratica )林生态系统地下水蒸散发[J]. 中国沙漠, 2022, 42(6): 243-254. |
| [3] | 李琳, 刘鹄, 孙程鹏, 赵文智. 基于地下水位与土壤含水量的地下水蒸散发估算[J]. 中国沙漠, 2022, 42(6): 277-287. |
| [4] | 王大刚, 于洋, 孙凌霄, 何婧, Ireneusz Malik, Malgorzata Wistuba, 姜逢清, 于瑞德. 塔克拉玛干沙漠南缘典型绿洲ET0模型适用性评价及修正[J]. 中国沙漠, 2021, 41(6): 41-53. |
| [5] | 田敏, 钱广强, 杨转玲, 罗万银, 逯军峰. 柴达木盆地东北部哈勒腾河流域风况特征及其对风沙地貌发育的影响[J]. 中国沙漠, 2021, 41(1): 1-9. |
| [6] | 祁秀娇, 刘廷玺, 段利民, 陈小平, 黄天宇. 基于茎干液流法和涡度相关法的小叶锦鸡儿(Caragana microphylla)群落蒸散特征[J]. 中国沙漠, 2019, 39(4): 73-82. |
| [7] | 包永志, 段利民, 刘廷玺, 王冠丽, 童新. 小叶锦鸡儿(Caragana microphylla)群落蒸散发模拟[J]. 中国沙漠, 2019, 39(4): 177-186. |
| [8] | 孟阳阳, 刘冰, 刘婵. 荒漠绿洲湿地土壤水热盐动态过程及其影响机制[J]. 中国沙漠, 2019, 39(1): 149-160. |
| [9] | 李肖娟, 张福平, 王虎威, 雷声剑, 高张. 黑河流域植被水分利用效率时空变化特征及其与气候因子的关系[J]. 中国沙漠, 2017, 37(4): 733-741. |
| [10] | 黄玉霞, 王宝鉴, 王研峰, 黄武斌, 王琳. 东亚夏季风的变化特征及其对甘肃夏季暴雨日数的影响[J]. 中国沙漠, 2017, 37(1): 140-147. |
| [11] | 张圆, 郑江华, 刘志辉, 姚俊强. 基于Landsat8与GEOEYE-1数据融合的天山北坡县域蒸散量计算——以呼图壁县为例[J]. 中国沙漠, 2016, 36(2): 508-514. |
| [12] | 李玲萍, 刘维成, 张宇林, 王荣喆, 李岩瑛, 李红英. 石羊河流域主汛期降水日变化特征[J]. 中国沙漠, 2015, 35(5): 1291-1300. |
| [13] | 高云飞, 赵传燕, 彭守璋, 马文瑛, 李文娟, 袁亚鹏. 黑河上游天涝池流域草地蒸散发模拟及其敏感性分析[J]. 中国沙漠, 2015, 35(5): 1338-1345. |
| [14] | 位贺杰, 张艳芳, 朱妮, 王鹏涛, 喻元. 基于MOD16数据的渭河流域地表实际蒸散发时空特征[J]. 中国沙漠, 2015, 35(2): 414-422. |
| [15] | 李万元, 吕世华, 董治宝, 范广州, 陈雷华. 巴丹吉林沙漠周边地区降水量的时空变化特征[J]. 中国沙漠, 2015, 35(1): 94-105. |
| 阅读次数 | ||||||
|
全文 |
|
|||||
|
摘要 |
|
|||||
©2018中国沙漠 编辑部
地址: 兰州市天水中路8号 (730000)
电话:0931-8267545
Email:caiedit@lzb.ac.cn;desert@lzb.ac.cn

 甘公网安备 62010202000688号