中国沙漠 ›› 2024, Vol. 44 ›› Issue (2): 78-89.DOI: 10.7522/j.issn.1000-694X.2023.00124
乌友罕1( ), 殷婕2, 武子丰1, 哈斯额尔敦1()
收稿日期:2023-07-12
修回日期:2023-09-17
出版日期:2024-03-20
发布日期:2024-03-19
通讯作者:
哈斯额尔敦
作者简介:哈斯额尔敦(E-mail: hasi@bnu.edu.cn)基金资助:
Youhan Wu1(), Jie Yin2, Zifeng Wu1, Eerdun Hasi1()
Received:2023-07-12
Revised:2023-09-17
Online:2024-03-20
Published:2024-03-19
Contact:
Eerdun Hasi
摘要:
巴丹吉林沙漠与乌兰布和沙漠之间的输沙带由波状高平原带状流沙和山麓带状流沙组成。利用多期高分辨率遥感影像对输沙带新月形沙丘动态开展了监测。选取山麓输沙带、高平原输沙带主体区及其南北两侧4个样区,提取并计算沙丘各参数,分析探讨了沙丘移动、形态和输沙通量的时空变化及其影响因素。结果表明,2003—2020年,沙丘动态因地形、风况和沙丘规模等差异显示不同的时空变化特征。(1)沙丘移动速率为2.09~40.93 m·a-1,平均为12.89 m·a-1,山麓输沙带沙丘移动快于高平原输沙带沙丘,随合成输沙势的变化,沙丘移动速率在高平原输沙带趋于减小,山麓输沙带趋于增加;(2)沙丘移动方向介于102°~152°,平均为126°,受控于各方向起沙风强弱变化,在高平原输沙带向北偏移,在山麓输沙带向南偏移,但均与合成输沙方向不一致;(3)沙丘移动过程中,迎风坡长度趋于增加、高度趋于降低,主风(W)与次主风(NW)交替作用使南翼伸长;(4)近20年,低矮沙丘出现沙物质损失,相对高大沙丘沙物质收支平衡;(5)考虑输沙带宽度及沙丘密度计算的输沙带输沙通量达117 t·m-1·a-1,估计巴丹吉林沙漠每年向乌兰布和沙漠至少贡献55万t沙物质。
中图分类号:
乌友罕, 殷婕, 武子丰, 哈斯额尔敦. 巴丹吉林-乌兰布和沙漠输沙带新月形沙丘动态[J]. 中国沙漠, 2024, 44(2): 78-89.
Youhan Wu, Jie Yin, Zifeng Wu, Eerdun Hasi. Barchan dune dynamics in the sand belt between the Badain Jaran Desert and Ulan Buh Desert[J]. Journal of Desert Research, 2024, 44(2): 78-89.
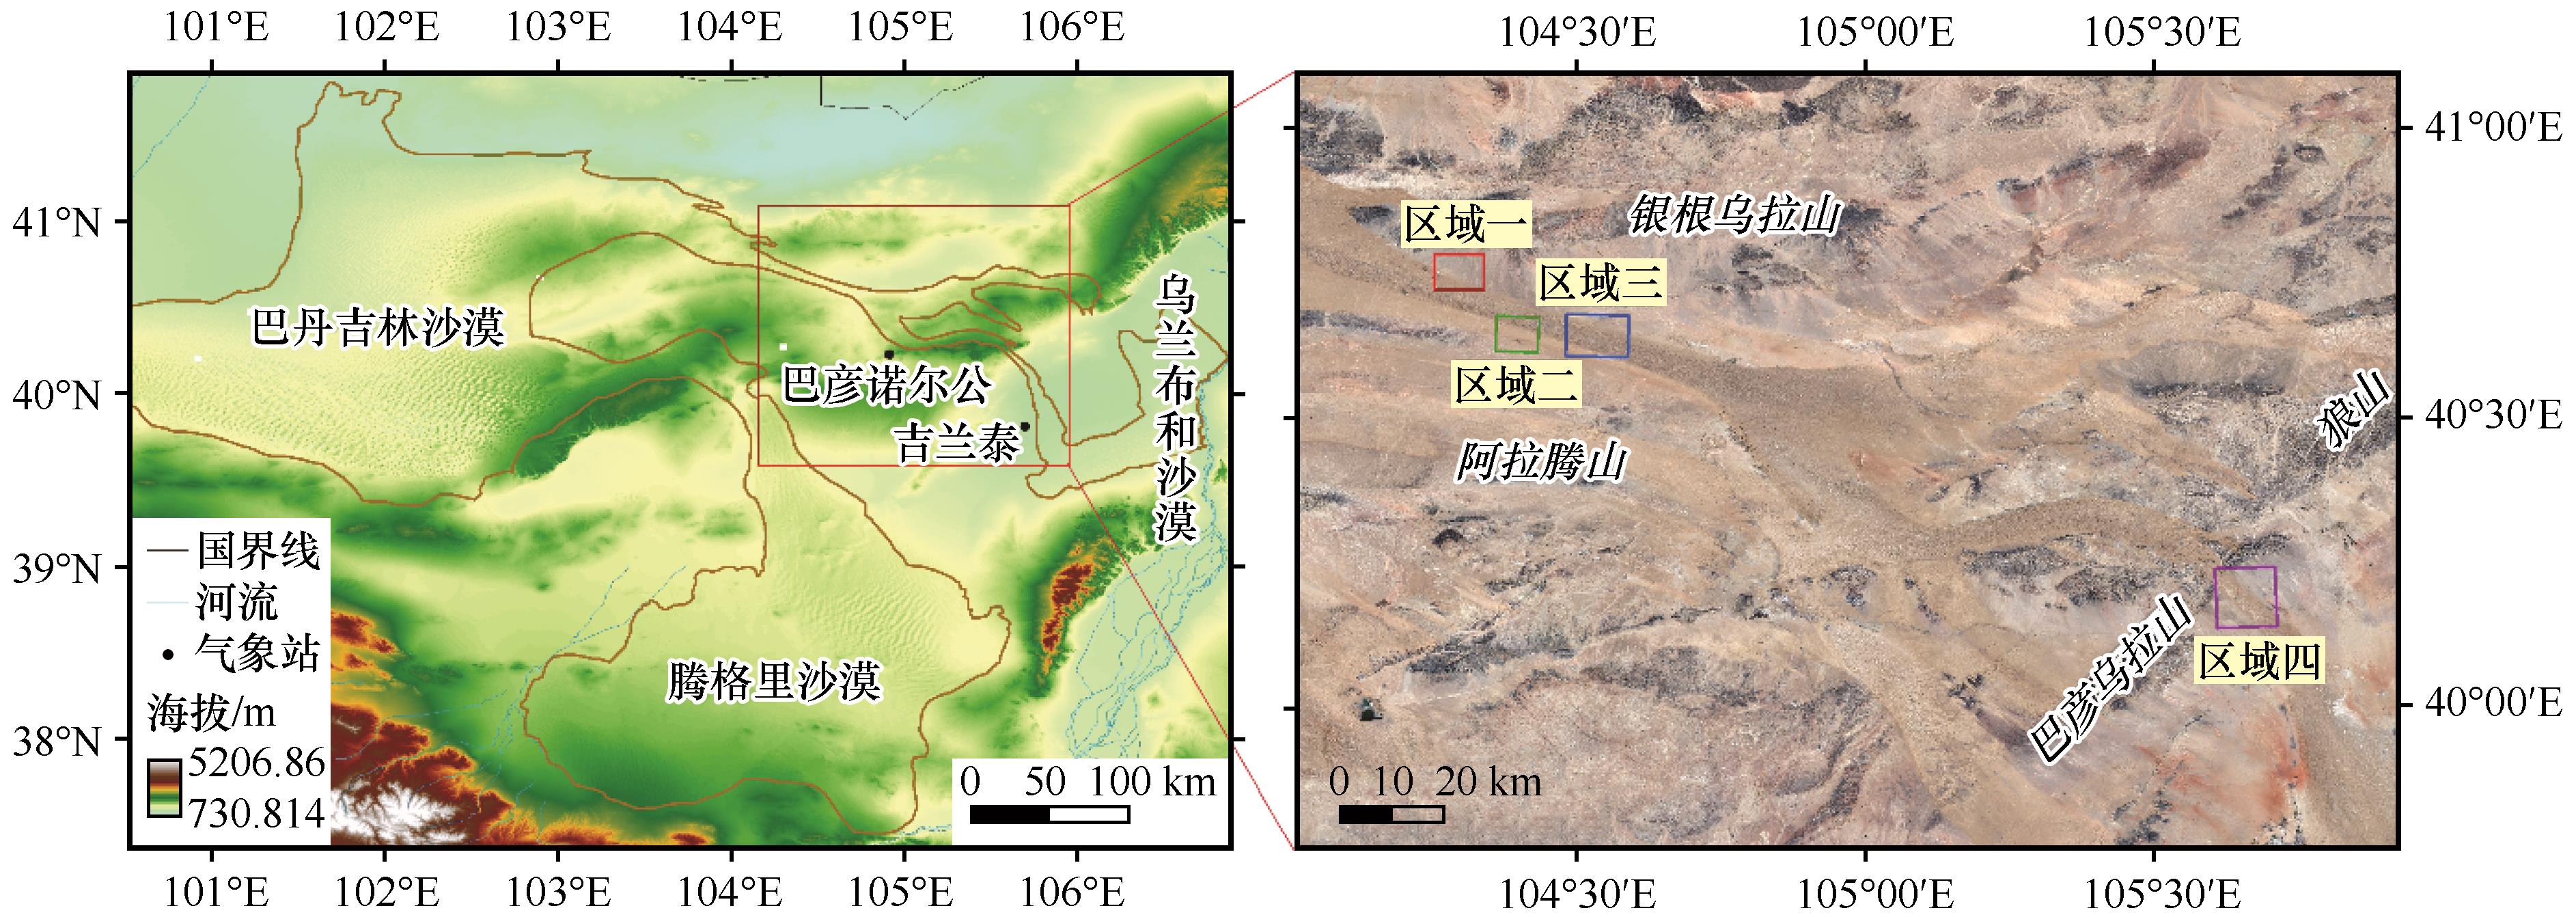
图1 研究区位置注:基于自然资源部标准地图服务网站标准地图(审图号GS(2016)1607号)制作,底图边界无修改
Fig.1 Location of the study area
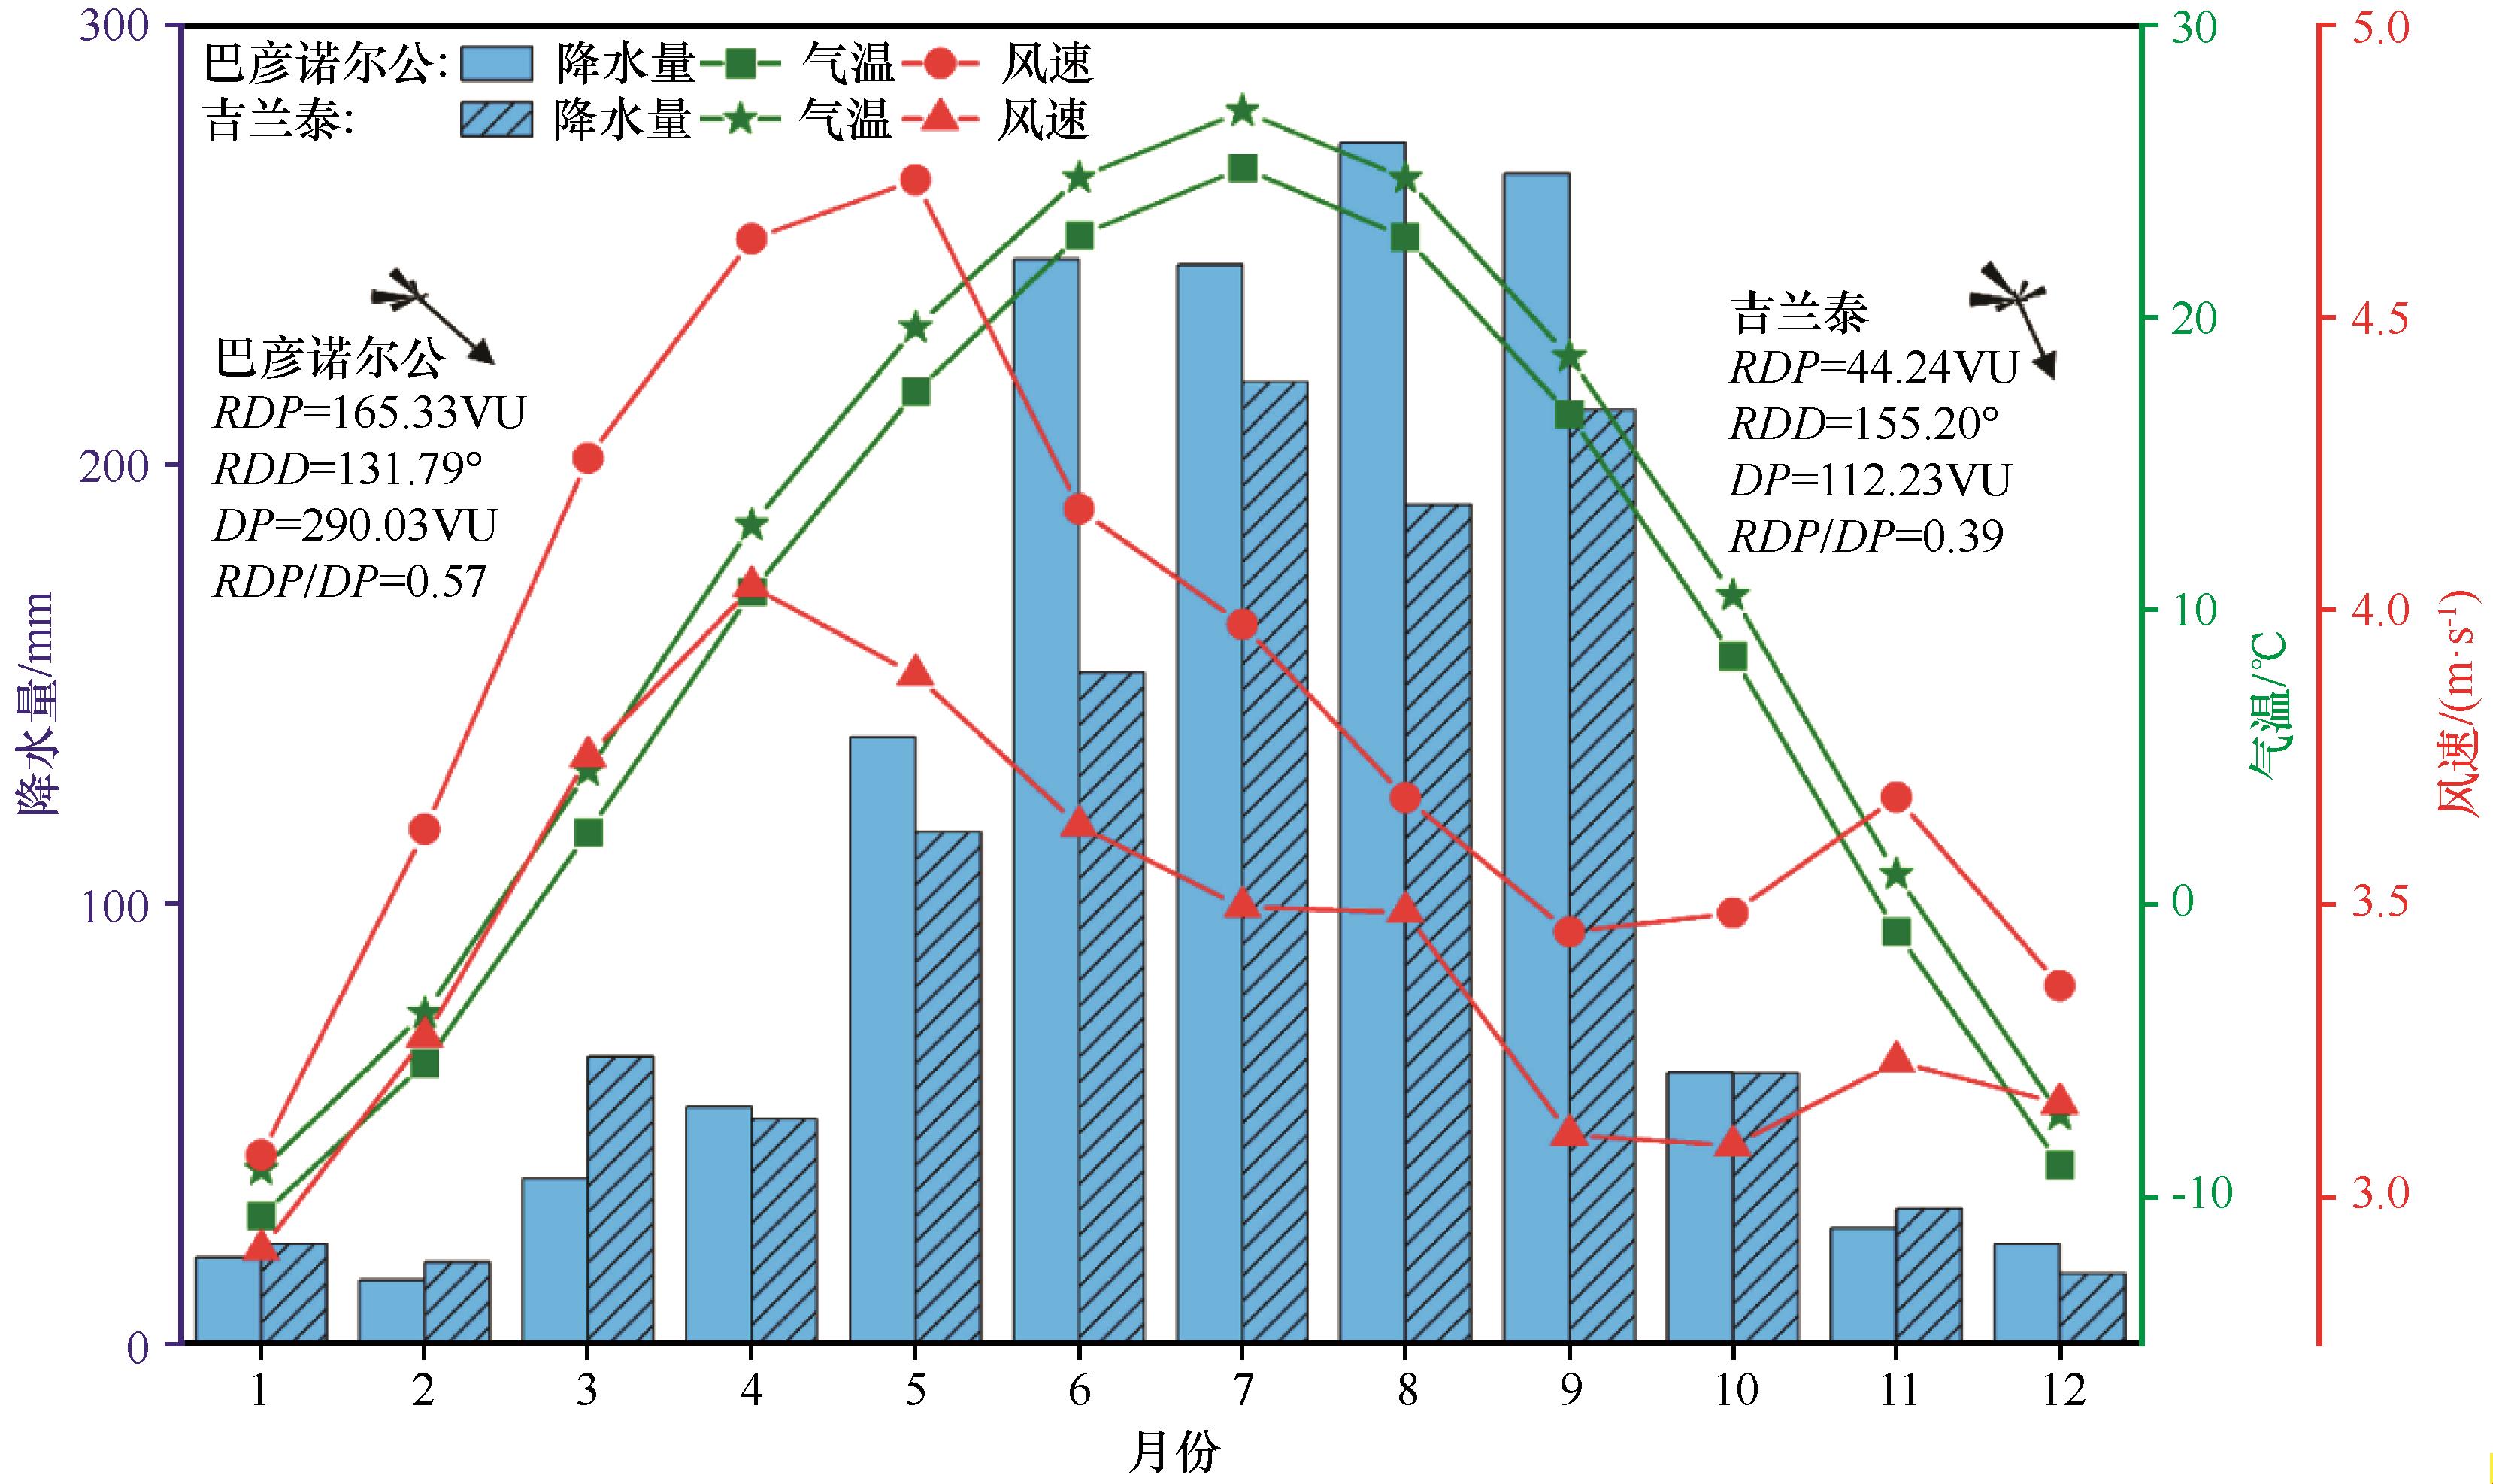
图2 2000—2020年多年平均月气象要素
Fig.2 Multi-year monthly average meteorological elements from 2000 to 2020
| 典型沙丘区域 | 影像日期(年-月-日) | 分辨率/m |
|---|---|---|
| 高平原输沙带北侧 | 2010-07-19 | 0.45 |
| 2013-12-21 | ||
| 2019-11-30 | ||
| 高平原输沙带南侧 | 2010-10-12 | 0.45 |
| 2013-12-21 | ||
| 2019-11-30 | ||
| 高平原输沙带主体 | 2003-09-28 | 0.45 |
| 2010-10-12 | ||
| 2013-12-21 | ||
| 2020-01-09 | ||
| 山麓输沙带 | 2010-10-01 | 0.46 |
| 2013-07-21 | ||
| 2020-10-29 |
表1 卫星影像信息
Table 1 The detailed information of satellite images
| 典型沙丘区域 | 影像日期(年-月-日) | 分辨率/m |
|---|---|---|
| 高平原输沙带北侧 | 2010-07-19 | 0.45 |
| 2013-12-21 | ||
| 2019-11-30 | ||
| 高平原输沙带南侧 | 2010-10-12 | 0.45 |
| 2013-12-21 | ||
| 2019-11-30 | ||
| 高平原输沙带主体 | 2003-09-28 | 0.45 |
| 2010-10-12 | ||
| 2013-12-21 | ||
| 2020-01-09 | ||
| 山麓输沙带 | 2010-10-01 | 0.46 |
| 2013-07-21 | ||
| 2020-10-29 |
| 参数名称 | 参数意义 |
|---|---|
| 长度(L) | 迎风坡基部与较长翼角间垂直于宽度连线的水平距离 |
| 迎风坡长度(La) | 迎风坡基部到丘顶的水平距离 |
| 宽度(W) | 两翼最远弧段切线的水平距离 |
| 高度(H) | 沙丘最低轮廓面至丘顶的垂直距离 |
| 周长(C) | 沙丘最低轮廓线总长度 |
| 底面积(S) | 沙丘最低轮廓面面积 |
表2 沙丘形态参数意义
Table 2 The significance of dune morphology parameters
| 参数名称 | 参数意义 |
|---|---|
| 长度(L) | 迎风坡基部与较长翼角间垂直于宽度连线的水平距离 |
| 迎风坡长度(La) | 迎风坡基部到丘顶的水平距离 |
| 宽度(W) | 两翼最远弧段切线的水平距离 |
| 高度(H) | 沙丘最低轮廓面至丘顶的垂直距离 |
| 周长(C) | 沙丘最低轮廓线总长度 |
| 底面积(S) | 沙丘最低轮廓面面积 |
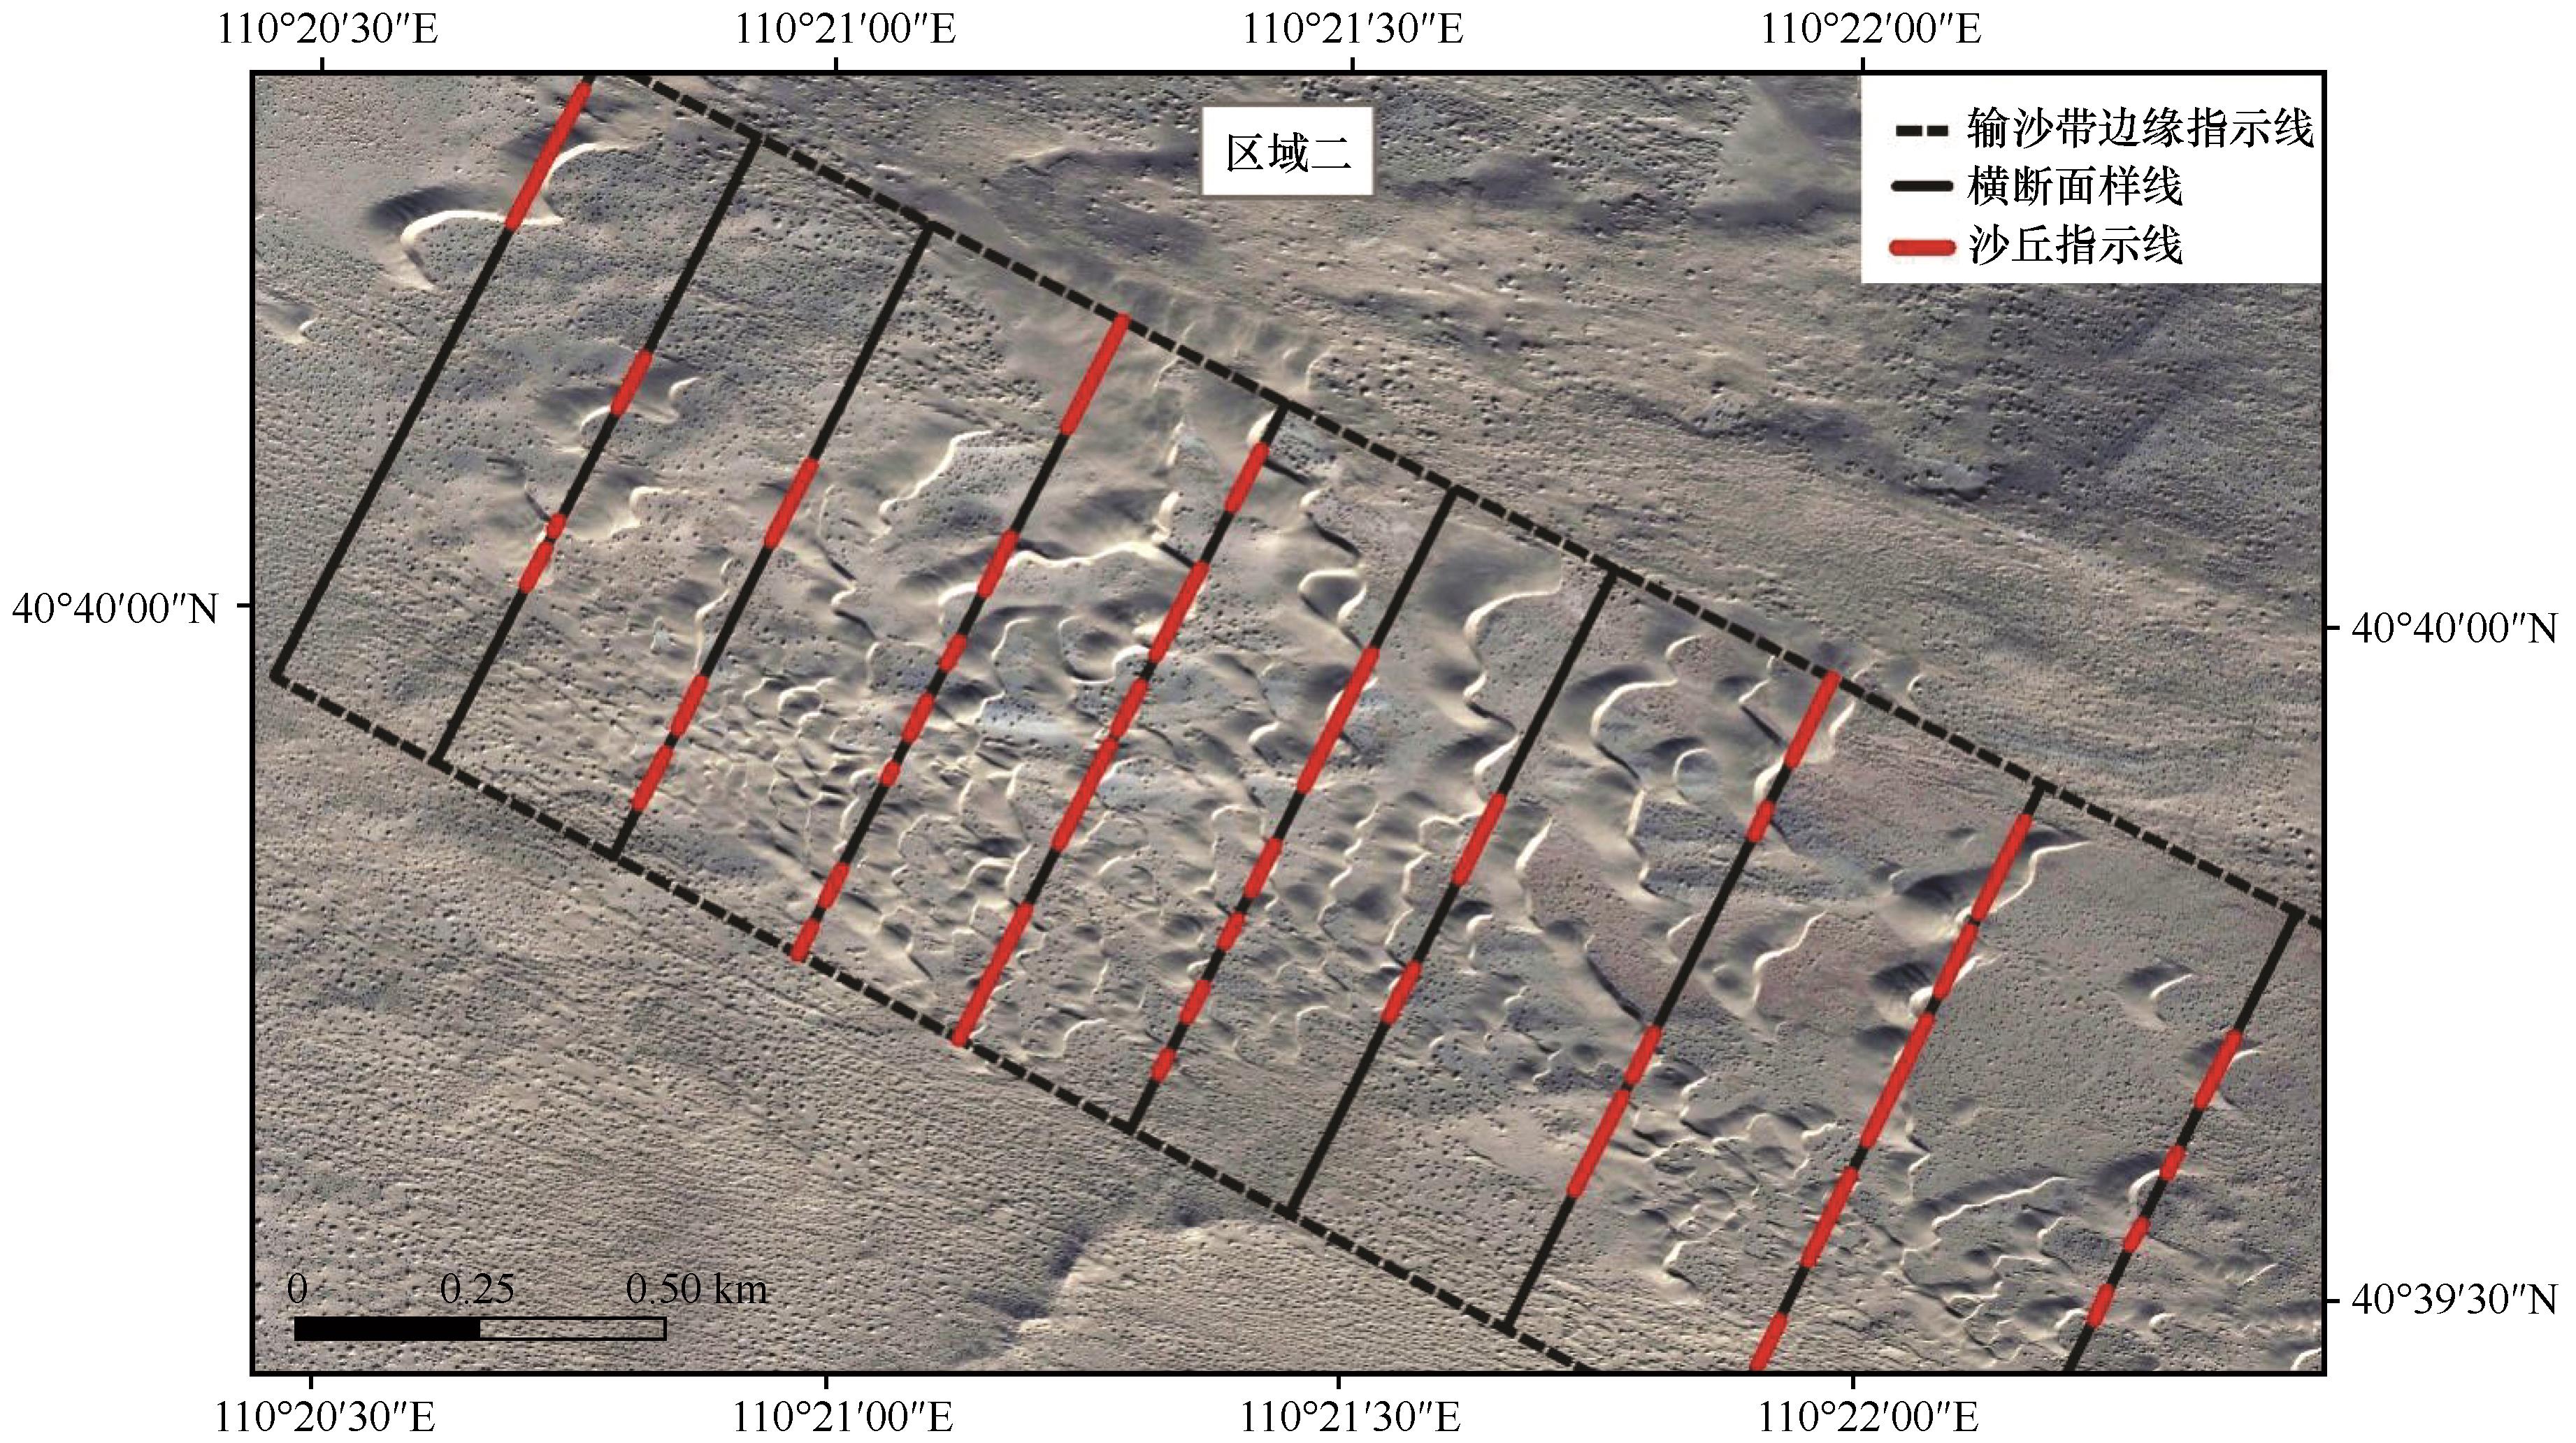
图3 输沙通量修正计算示意图
Fig.3 Schematic diagram of sand transport flux correction calculation
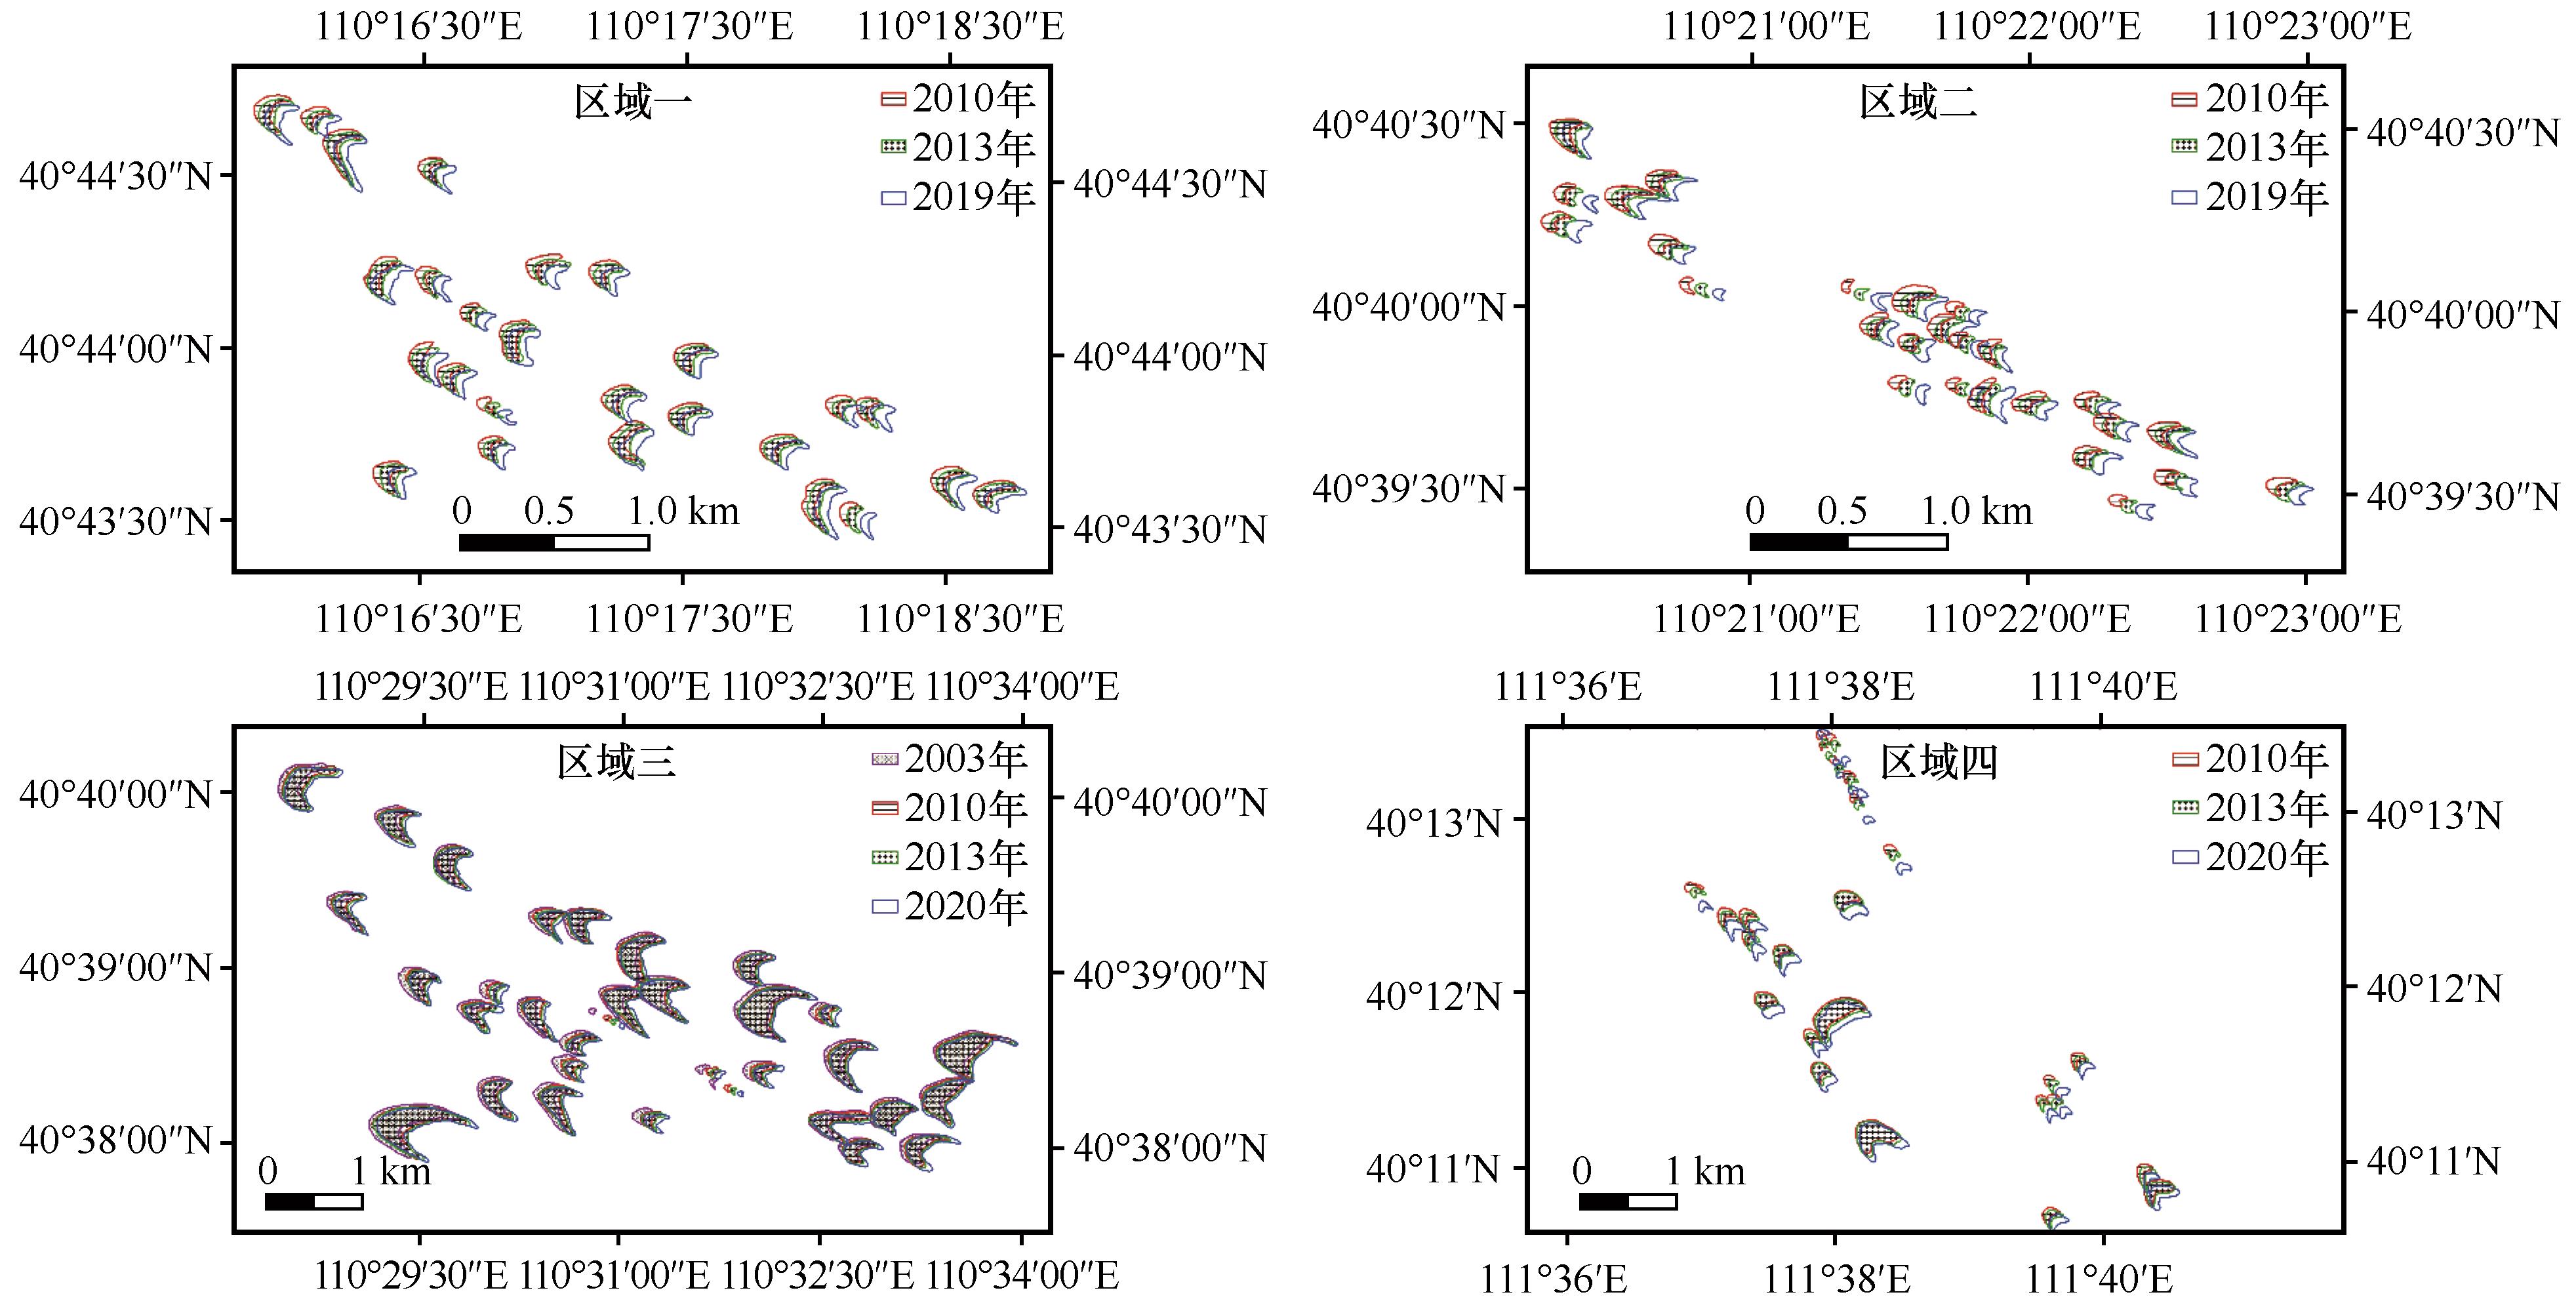
图4 沙丘平面轮廓变化
Fig.4 The changes of dune plane contour
| 参数 | 高平原输沙带北侧(26个) | 高平原输沙带南侧(26个) | 高平原输沙带主体(33个) | 山麓输沙带(27个) | ||||||||||
|---|---|---|---|---|---|---|---|---|---|---|---|---|---|---|
| 2010—2013年 | 2013—2020年 | 2010—2013年 | 2013—2020年 | 2003—2010年 | 2010—2013年 | 2013—2020年 | 2010—2013年 | 2013—2020年 | ||||||
速率 /(m·a-1) | 丘顶 | 范围 | 6.42~18.13 | 5.67~11.99 | 9.83~27.85 | 6.44~15.05 | 2.96~23.53 | 2.26~26.82 | 2.02~18.44 | 7.79~40.79 | 3.07~44.22 | |||
| 均值 | 11.89 | 8.36 | 15.91 | 10.99 | 9.01 | 9.64 | 5.53 | 20.73 | 22.43 | |||||
| 迎风坡 | 范围 | 5.52~17.58 | 5.80~13.12 | 6.48~27.22 | 6.54~17.82 | 2.44~20.21 | 2.69~27.24 | 1.77~17.01 | 3.93~41.25 | 5.46~44.95 | ||||
| 均值 | 10.58 | 8.63 | 15.89 | 10.99 | 8.46 | 7.81 | 5.50 | 18.58 | 21.91 | |||||
| 背风坡 | 范围 | 5.98~18.08 | 4.45~11.93 | 8.88~29.31 | 6.59~15.12 | 4.82~24.18 | 3.13~24.80 | 2.37~17.78 | 4.65~40.21 | 4.34~44.50 | ||||
| 均值 | 10.11 | 8.25 | 14.99 | 10.85 | 8.57 | 8.20 | 5.75 | 19.91 | 21.88 | |||||
| 北翼 | 范围 | 5.65~20.67 | 4.22~13.14 | 7.23~30.59 | 2.89~19.78 | 4.32~25.00 | 3.09~26.51 | 2.00~16.94 | 5.51~41.31 | 10.30~44.69 | ||||
| 均值 | 11.74 | 7.69 | 15.00 | 10.86 | 10.30 | 10.19 | 6.33 | 20.39 | 22.98 | |||||
| 南翼 | 范围 | 5.80~22.71 | 5.59~13.43 | 9.86~26.75 | 4.86~21.27 | 4.57~24.35 | 4.05~25.81 | 1.93~17.42 | 7.73~42.39 | 9.01~43.81 | ||||
| 均值 | 12.11 | 9.13 | 17.32 | 11.89 | 10.01 | 11.43 | 7.12 | 23.53 | 21.75 | |||||
| 平均 | 11.29 | 8.41 | 15.82 | 11.12 | 9.27 | 9.45 | 6.05 | 20.63 | 22.19 | |||||
方向 /(°) | 丘顶 | 范围 | 104~136 | 110~143 | 105~137 | 99~124 | 96~128 | 112~144 | 94~139 | 113~158 | 129~160 | |||
| 均值 | 118 | 121 | 118 | 112 | 111 | 125 | 111 | 140 | 147 | |||||
| 迎风坡 | 范围 | 106~129 | 104~129 | 105~126 | 97~124 | 98~138 | 96~141 | 97~131 | 103~153 | 127~152 | ||||
| 均值 | 117 | 116 | 115 | 108 | 112 | 116 | 113 | 138 | 143 | |||||
| 背风坡 | 范围 | 102~144 | 103~143 | 103~130 | 99~118 | 101~127 | 98~150 | 99~138 | 130~157 | 134~153 | ||||
| 均值 | 119 | 125 | 117 | 110 | 113 | 124 | 113 | 144 | 146 | |||||
| 北翼 | 范围 | 110~146 | 109~139 | 107~153 | 99~127 | 98~139 | 96~141 | 93~139 | 126~156 | 125~158 | ||||
| 均值 | 125 | 122 | 122 | 108 | 112 | 116 | 111 | 144 | 142 | |||||
| 南翼 | 范围 | 107~139 | 104~142 | 99~128 | 100~131 | 99~125 | 99~153 | 98~142 | 109~153 | 127~164 | ||||
| 均值 | 125 | 119 | 115 | 111 | 110 | 120 | 114 | 138 | 148 | |||||
| 平均 | 121 | 120 | 117 | 110 | 112 | 120 | 112 | 141 | 145 | |||||
表3 沙丘移动方向及速率
Table 3 Dune movement direction and rate
| 参数 | 高平原输沙带北侧(26个) | 高平原输沙带南侧(26个) | 高平原输沙带主体(33个) | 山麓输沙带(27个) | ||||||||||
|---|---|---|---|---|---|---|---|---|---|---|---|---|---|---|
| 2010—2013年 | 2013—2020年 | 2010—2013年 | 2013—2020年 | 2003—2010年 | 2010—2013年 | 2013—2020年 | 2010—2013年 | 2013—2020年 | ||||||
速率 /(m·a-1) | 丘顶 | 范围 | 6.42~18.13 | 5.67~11.99 | 9.83~27.85 | 6.44~15.05 | 2.96~23.53 | 2.26~26.82 | 2.02~18.44 | 7.79~40.79 | 3.07~44.22 | |||
| 均值 | 11.89 | 8.36 | 15.91 | 10.99 | 9.01 | 9.64 | 5.53 | 20.73 | 22.43 | |||||
| 迎风坡 | 范围 | 5.52~17.58 | 5.80~13.12 | 6.48~27.22 | 6.54~17.82 | 2.44~20.21 | 2.69~27.24 | 1.77~17.01 | 3.93~41.25 | 5.46~44.95 | ||||
| 均值 | 10.58 | 8.63 | 15.89 | 10.99 | 8.46 | 7.81 | 5.50 | 18.58 | 21.91 | |||||
| 背风坡 | 范围 | 5.98~18.08 | 4.45~11.93 | 8.88~29.31 | 6.59~15.12 | 4.82~24.18 | 3.13~24.80 | 2.37~17.78 | 4.65~40.21 | 4.34~44.50 | ||||
| 均值 | 10.11 | 8.25 | 14.99 | 10.85 | 8.57 | 8.20 | 5.75 | 19.91 | 21.88 | |||||
| 北翼 | 范围 | 5.65~20.67 | 4.22~13.14 | 7.23~30.59 | 2.89~19.78 | 4.32~25.00 | 3.09~26.51 | 2.00~16.94 | 5.51~41.31 | 10.30~44.69 | ||||
| 均值 | 11.74 | 7.69 | 15.00 | 10.86 | 10.30 | 10.19 | 6.33 | 20.39 | 22.98 | |||||
| 南翼 | 范围 | 5.80~22.71 | 5.59~13.43 | 9.86~26.75 | 4.86~21.27 | 4.57~24.35 | 4.05~25.81 | 1.93~17.42 | 7.73~42.39 | 9.01~43.81 | ||||
| 均值 | 12.11 | 9.13 | 17.32 | 11.89 | 10.01 | 11.43 | 7.12 | 23.53 | 21.75 | |||||
| 平均 | 11.29 | 8.41 | 15.82 | 11.12 | 9.27 | 9.45 | 6.05 | 20.63 | 22.19 | |||||
方向 /(°) | 丘顶 | 范围 | 104~136 | 110~143 | 105~137 | 99~124 | 96~128 | 112~144 | 94~139 | 113~158 | 129~160 | |||
| 均值 | 118 | 121 | 118 | 112 | 111 | 125 | 111 | 140 | 147 | |||||
| 迎风坡 | 范围 | 106~129 | 104~129 | 105~126 | 97~124 | 98~138 | 96~141 | 97~131 | 103~153 | 127~152 | ||||
| 均值 | 117 | 116 | 115 | 108 | 112 | 116 | 113 | 138 | 143 | |||||
| 背风坡 | 范围 | 102~144 | 103~143 | 103~130 | 99~118 | 101~127 | 98~150 | 99~138 | 130~157 | 134~153 | ||||
| 均值 | 119 | 125 | 117 | 110 | 113 | 124 | 113 | 144 | 146 | |||||
| 北翼 | 范围 | 110~146 | 109~139 | 107~153 | 99~127 | 98~139 | 96~141 | 93~139 | 126~156 | 125~158 | ||||
| 均值 | 125 | 122 | 122 | 108 | 112 | 116 | 111 | 144 | 142 | |||||
| 南翼 | 范围 | 107~139 | 104~142 | 99~128 | 100~131 | 99~125 | 99~153 | 98~142 | 109~153 | 127~164 | ||||
| 均值 | 125 | 119 | 115 | 111 | 110 | 120 | 114 | 138 | 148 | |||||
| 平均 | 121 | 120 | 117 | 110 | 112 | 120 | 112 | 141 | 145 | |||||
| 形态参数 | 高平原输沙带北侧(26个) | 高平原输沙带南侧(26个) | 高平原输沙带主体(33个) | 山麓输沙带(27个) | |||||||||||||
|---|---|---|---|---|---|---|---|---|---|---|---|---|---|---|---|---|---|
| 2010年 | 2013年 | 2019年 | 2010年 | 2013年 | 2019年 | 2003年 | 2010年 | 2013年 | 2020年 | 2010年 | 2013年 | 2020年 | |||||
| 长度/m | 范围 | 80.70~ 202.52 | 84.68~ 216.38 | 83.65~ 229.35 | 56.01~ 239.00 | 64.45~235.20 | 64.06~ 232.18 | 75.24~ 944.82 | 65.83~ 930.82 | 62.69~ 978.76 | 60.84~ 1 037.29 | 79.13~ 346.78 | 75.93~ 379.25 | 62.52~ 440.69 | |||
| 均值 | 134.30 | 139.13 | 138.35 | 107.91 | 112.73 | 121.22 | 351.15 | 363.04 | 372.85 | 392.42 | 154.16 | 162.04 | 166.11 | ||||
| 迎风坡长/m | 范围 | 40.22~ 104.08 | 30.42~ 106.89 | 37.72~ 133.72 | 24.42~ 89.53 | 35.18~118.53 | 35.14~ 151.02 | 32.65~ 448.07 | 20.82~ 392.12 | 14.57~ 380.61 | 43.95~ 417.08 | 41.94~ 221.62 | 44.97~ 220.14 | 41.96~ 287.38 | |||
| 均值 | 63.61 | 68.76 | 73.83 | 51.04 | 53.95 | 64.17 | 181.60 | 181.65 | 187.48 | 197.98 | 88.80 | 102.10 | 101.51 | ||||
| 宽度/m | 范围 | 76.07~ 269.01 | 79.55~ 279.72 | 74.25~ 282.59 | 60.03~ 212.21 | 62.46~181.98 | 59.54~ 185.01 | 60.50~ 607.92 | 70.44~ 697.76 | 70.25~ 688.30 | 51.39~ 685.67 | 68.20~ 575.50 | 66.14~ 585.37 | 63.45~ 579.09 | |||
| 均值 | 172.80 | 173.13 | 169.67 | 120.07 | 110.60 | 112.62 | 361.15 | 360.24 | 363.57 | 371.49 | 184.08 | 181.15 | 188.03 | ||||
| 高度/m | 范围 | 3.83~ 15.85 | 5.37~ 14.19 | 4.54~ 12.50 | 3.19~ 14.31 | 3.39~ 11.89 | 3.19~ 11.85 | 4.30~ 39.69 | 3.49~ 30.98 | 4.00~ 30.02 | 2.23~ 32.99 | 4.28~ 31.95 | 3.54~ 32.72 | 2.79~ 34.24 | |||
| 均值 | 11.99 | 9.62 | 7.99 | 8.71 | 7.53 | 7.18 | 22.94 | 20.86 | 18.50 | 19.63 | 11.59 | 10.36 | 10.51 | ||||
| 周长/m | 范围 | 314.36~ 846.93 | 328.13~ 880.22 | 337.10~ 874.95 | 213.47~ 682.44 | 229.63~715.64 | 207.10~ 685.58 | 222.06~ 2 750.45 | 231.93~ 2 790.24 | 227.64~ 2 888.7 | 197.28~ 3 118.51 | 269.11~ 1 584.36 | 249.49~ 1 641.55 | 246.39~ 1 651.12 | |||
| 均值 | 549.21 | 560.70 | 553.44 | 408.63 | 403.92 | 417.57 | 1 261.65 | 1 299.11 | 1 334.37 | 1 393.03 | 584.38 | 601.47 | 618.17 | ||||
| 面积/km2 | 范围 | 4.20~ 18.21 | 4.15~ 19.34 | 3.76~ 19.47 | 2.55~ 16.51 | 2.47~ 16.39 | 2.36~ 15.53 | 3.07~ 218.14 | 2.54~ 196.78 | 2.34~ 212.54 | 2.14~ 204.38 | 3.73~ 104.11 | 3.50~ 106.40 | 3.64~ 115.72 | |||
| 均值 | 12.08 | 12.09 | 11.78 | 7.57 | 7.11 | 7.19 | 69.71 | 69.17 | 71.11 | 75.25 | 20.67 | 21.51 | 22.40 | ||||
表4 沙丘形态参数
Table 4 Dune morphological parameters
| 形态参数 | 高平原输沙带北侧(26个) | 高平原输沙带南侧(26个) | 高平原输沙带主体(33个) | 山麓输沙带(27个) | |||||||||||||
|---|---|---|---|---|---|---|---|---|---|---|---|---|---|---|---|---|---|
| 2010年 | 2013年 | 2019年 | 2010年 | 2013年 | 2019年 | 2003年 | 2010年 | 2013年 | 2020年 | 2010年 | 2013年 | 2020年 | |||||
| 长度/m | 范围 | 80.70~ 202.52 | 84.68~ 216.38 | 83.65~ 229.35 | 56.01~ 239.00 | 64.45~235.20 | 64.06~ 232.18 | 75.24~ 944.82 | 65.83~ 930.82 | 62.69~ 978.76 | 60.84~ 1 037.29 | 79.13~ 346.78 | 75.93~ 379.25 | 62.52~ 440.69 | |||
| 均值 | 134.30 | 139.13 | 138.35 | 107.91 | 112.73 | 121.22 | 351.15 | 363.04 | 372.85 | 392.42 | 154.16 | 162.04 | 166.11 | ||||
| 迎风坡长/m | 范围 | 40.22~ 104.08 | 30.42~ 106.89 | 37.72~ 133.72 | 24.42~ 89.53 | 35.18~118.53 | 35.14~ 151.02 | 32.65~ 448.07 | 20.82~ 392.12 | 14.57~ 380.61 | 43.95~ 417.08 | 41.94~ 221.62 | 44.97~ 220.14 | 41.96~ 287.38 | |||
| 均值 | 63.61 | 68.76 | 73.83 | 51.04 | 53.95 | 64.17 | 181.60 | 181.65 | 187.48 | 197.98 | 88.80 | 102.10 | 101.51 | ||||
| 宽度/m | 范围 | 76.07~ 269.01 | 79.55~ 279.72 | 74.25~ 282.59 | 60.03~ 212.21 | 62.46~181.98 | 59.54~ 185.01 | 60.50~ 607.92 | 70.44~ 697.76 | 70.25~ 688.30 | 51.39~ 685.67 | 68.20~ 575.50 | 66.14~ 585.37 | 63.45~ 579.09 | |||
| 均值 | 172.80 | 173.13 | 169.67 | 120.07 | 110.60 | 112.62 | 361.15 | 360.24 | 363.57 | 371.49 | 184.08 | 181.15 | 188.03 | ||||
| 高度/m | 范围 | 3.83~ 15.85 | 5.37~ 14.19 | 4.54~ 12.50 | 3.19~ 14.31 | 3.39~ 11.89 | 3.19~ 11.85 | 4.30~ 39.69 | 3.49~ 30.98 | 4.00~ 30.02 | 2.23~ 32.99 | 4.28~ 31.95 | 3.54~ 32.72 | 2.79~ 34.24 | |||
| 均值 | 11.99 | 9.62 | 7.99 | 8.71 | 7.53 | 7.18 | 22.94 | 20.86 | 18.50 | 19.63 | 11.59 | 10.36 | 10.51 | ||||
| 周长/m | 范围 | 314.36~ 846.93 | 328.13~ 880.22 | 337.10~ 874.95 | 213.47~ 682.44 | 229.63~715.64 | 207.10~ 685.58 | 222.06~ 2 750.45 | 231.93~ 2 790.24 | 227.64~ 2 888.7 | 197.28~ 3 118.51 | 269.11~ 1 584.36 | 249.49~ 1 641.55 | 246.39~ 1 651.12 | |||
| 均值 | 549.21 | 560.70 | 553.44 | 408.63 | 403.92 | 417.57 | 1 261.65 | 1 299.11 | 1 334.37 | 1 393.03 | 584.38 | 601.47 | 618.17 | ||||
| 面积/km2 | 范围 | 4.20~ 18.21 | 4.15~ 19.34 | 3.76~ 19.47 | 2.55~ 16.51 | 2.47~ 16.39 | 2.36~ 15.53 | 3.07~ 218.14 | 2.54~ 196.78 | 2.34~ 212.54 | 2.14~ 204.38 | 3.73~ 104.11 | 3.50~ 106.40 | 3.64~ 115.72 | |||
| 均值 | 12.08 | 12.09 | 11.78 | 7.57 | 7.11 | 7.19 | 69.71 | 69.17 | 71.11 | 75.25 | 20.67 | 21.51 | 22.40 | ||||
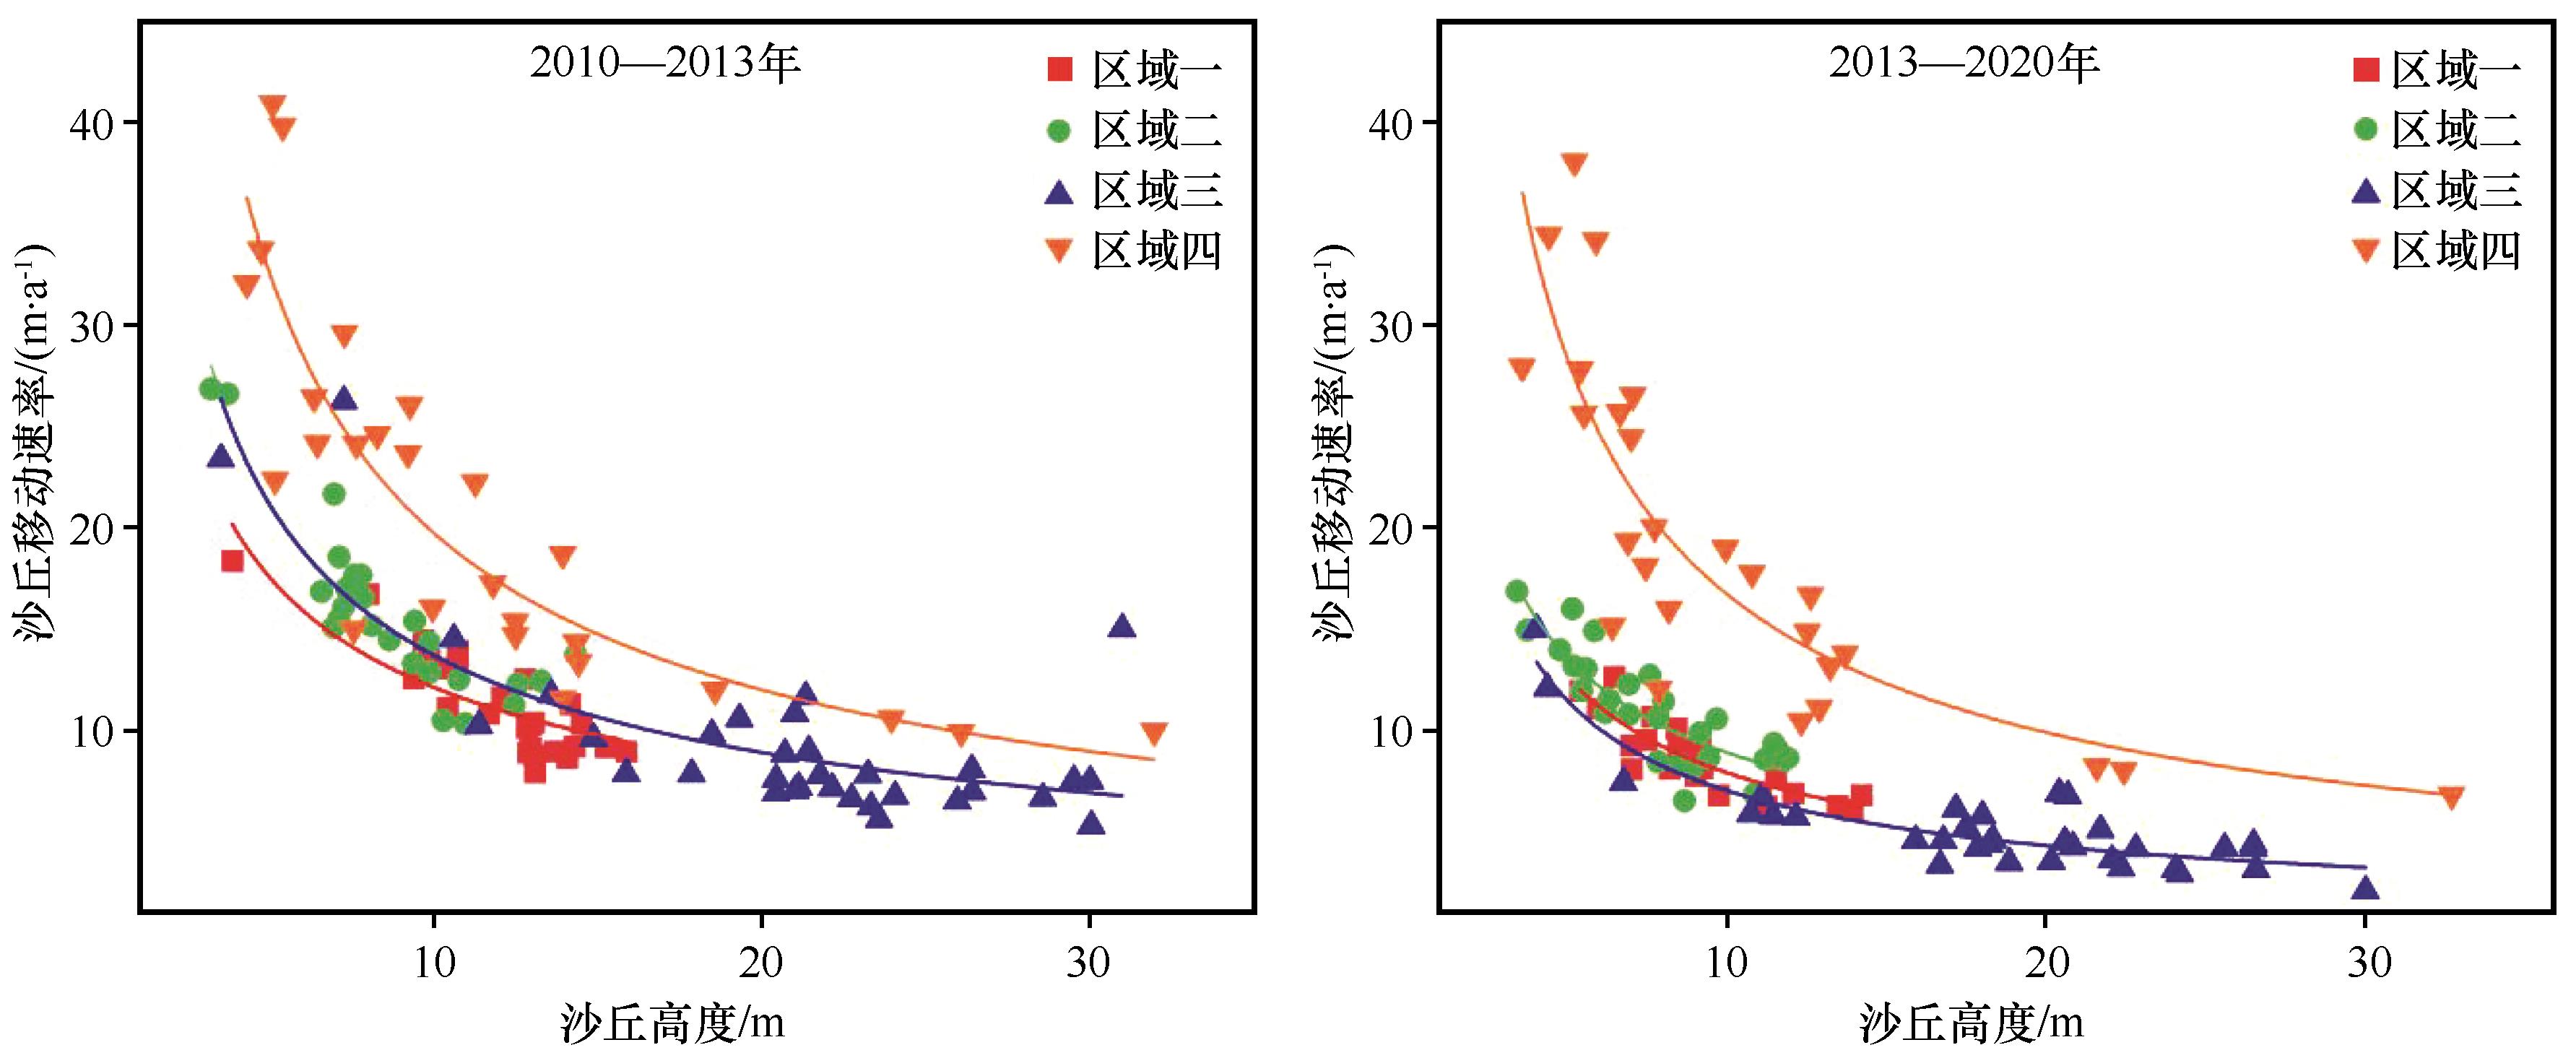
图5 沙丘高度与移动速率间的关系
Fig.5 The relationship between dune height and movement rate
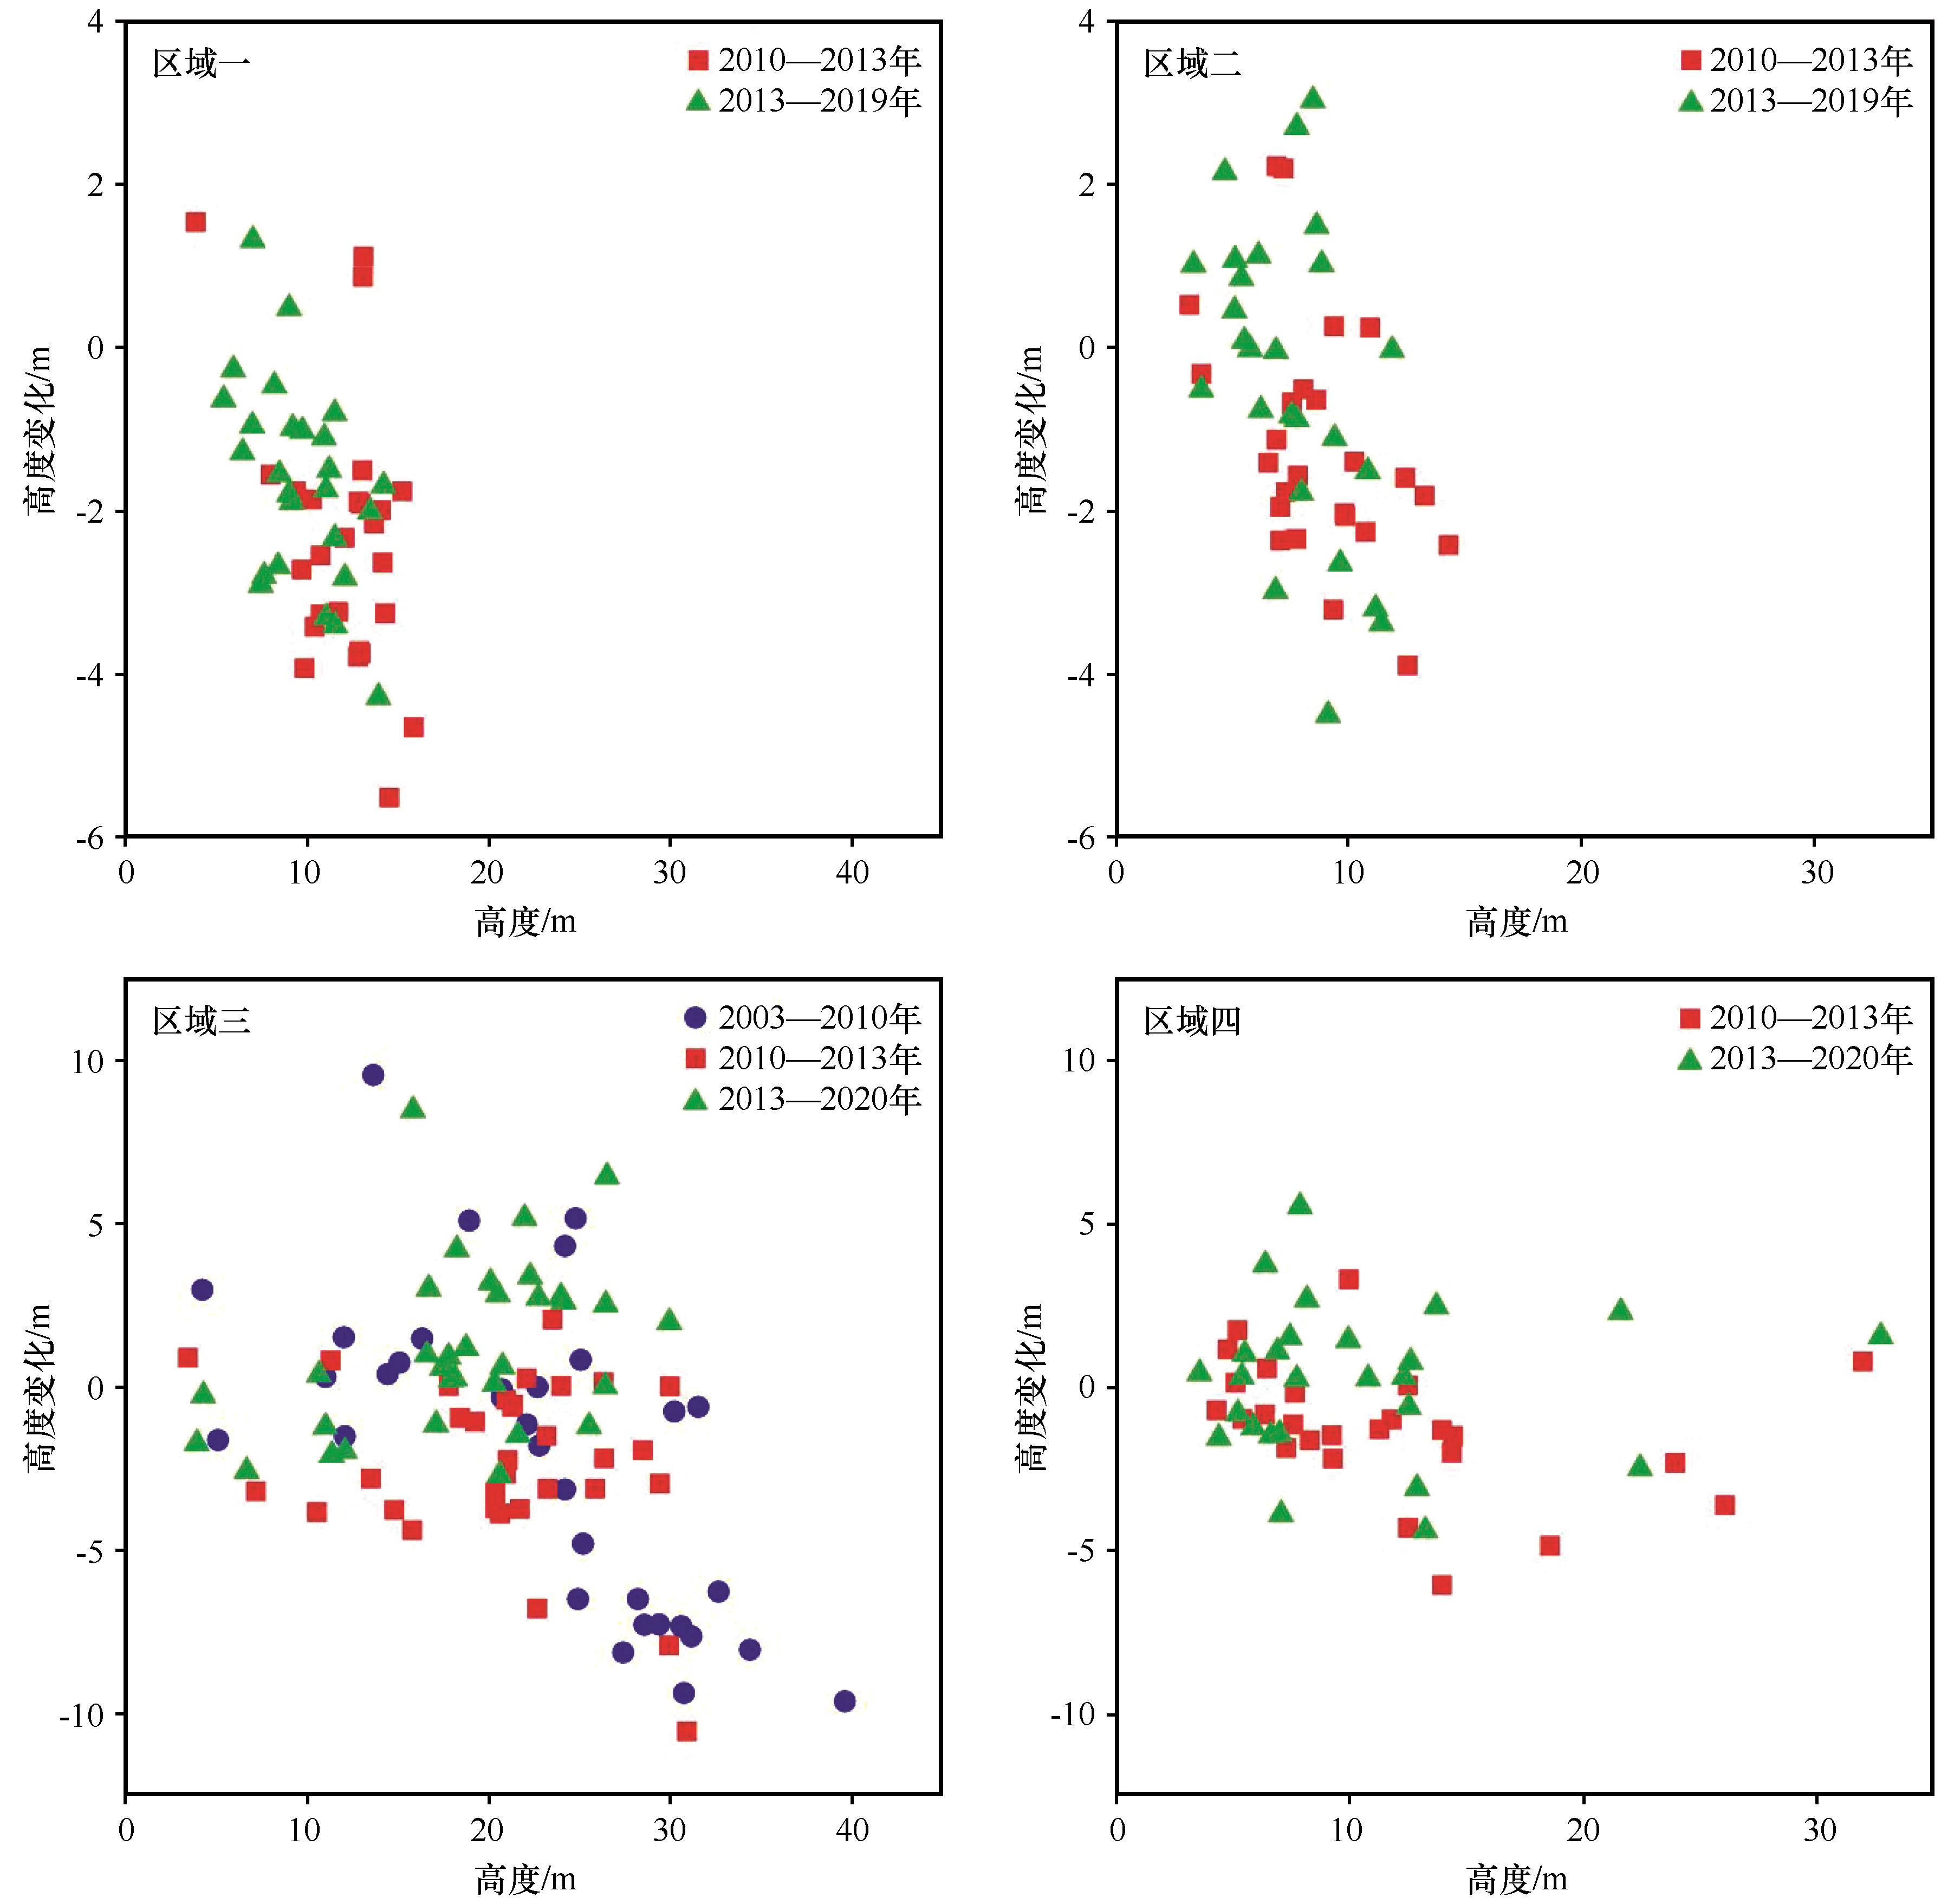
图6 沙丘高度变化值与高度之间的散点图
Fig.6 The scatter plot between the change value of dune height and height
| 区域 | 不考虑沙丘密度输沙通量/(t·m-1·a-1) | 考虑沙丘密度输沙通量/(t·m-1·a-1) | ||||||||
|---|---|---|---|---|---|---|---|---|---|---|
| 2003—2010年 | 2010—2013年 | 2013—2020年 | 平均 | 2003—2010年 | 2010—2013年 | 2013—2020年 | 平均 | |||
高平原 输沙带 | 北侧 | 343.36 | 205.27 | 274.32 | 112.73 | 67.40 | 89.98 | |||
| 南侧 | 342.05 | 207.93 | 274.99 | 125.13 | 76.06 | 100.65 | ||||
| 主体 | 494.58 | 470.41 | 221.84 | 395.61 | 260.93 | 219.64 | 103.58 | 180.77 | ||
| 山麓输沙带 | 528.85 | 427.90 | 478.38 | 105.15 | 85.08 | 95.20 | ||||
表5 输沙通量计算
Table 5 The calculation of sand transport flux
| 区域 | 不考虑沙丘密度输沙通量/(t·m-1·a-1) | 考虑沙丘密度输沙通量/(t·m-1·a-1) | ||||||||
|---|---|---|---|---|---|---|---|---|---|---|
| 2003—2010年 | 2010—2013年 | 2013—2020年 | 平均 | 2003—2010年 | 2010—2013年 | 2013—2020年 | 平均 | |||
高平原 输沙带 | 北侧 | 343.36 | 205.27 | 274.32 | 112.73 | 67.40 | 89.98 | |||
| 南侧 | 342.05 | 207.93 | 274.99 | 125.13 | 76.06 | 100.65 | ||||
| 主体 | 494.58 | 470.41 | 221.84 | 395.61 | 260.93 | 219.64 | 103.58 | 180.77 | ||
| 山麓输沙带 | 528.85 | 427.90 | 478.38 | 105.15 | 85.08 | 95.20 | ||||
| 区域 | 输沙通量/(t·m-1·a-1) | 输沙带宽度/m | 输沙带年输沙量/(万t·a-1) | |
|---|---|---|---|---|
高平原 输沙带 | 北侧 | 89.98 | 6 250 | 77.38 |
| 南侧 | 100.65 | |||
| 主体 | 180.77 | |||
| 山麓输沙带 | 95.20 | 5 750 | 54.74 | |
表6 输沙带年输沙量
Table 6 Annual sand transport in sand transport belt
| 区域 | 输沙通量/(t·m-1·a-1) | 输沙带宽度/m | 输沙带年输沙量/(万t·a-1) | |
|---|---|---|---|---|
高平原 输沙带 | 北侧 | 89.98 | 6 250 | 77.38 |
| 南侧 | 100.65 | |||
| 主体 | 180.77 | |||
| 山麓输沙带 | 95.20 | 5 750 | 54.74 | |
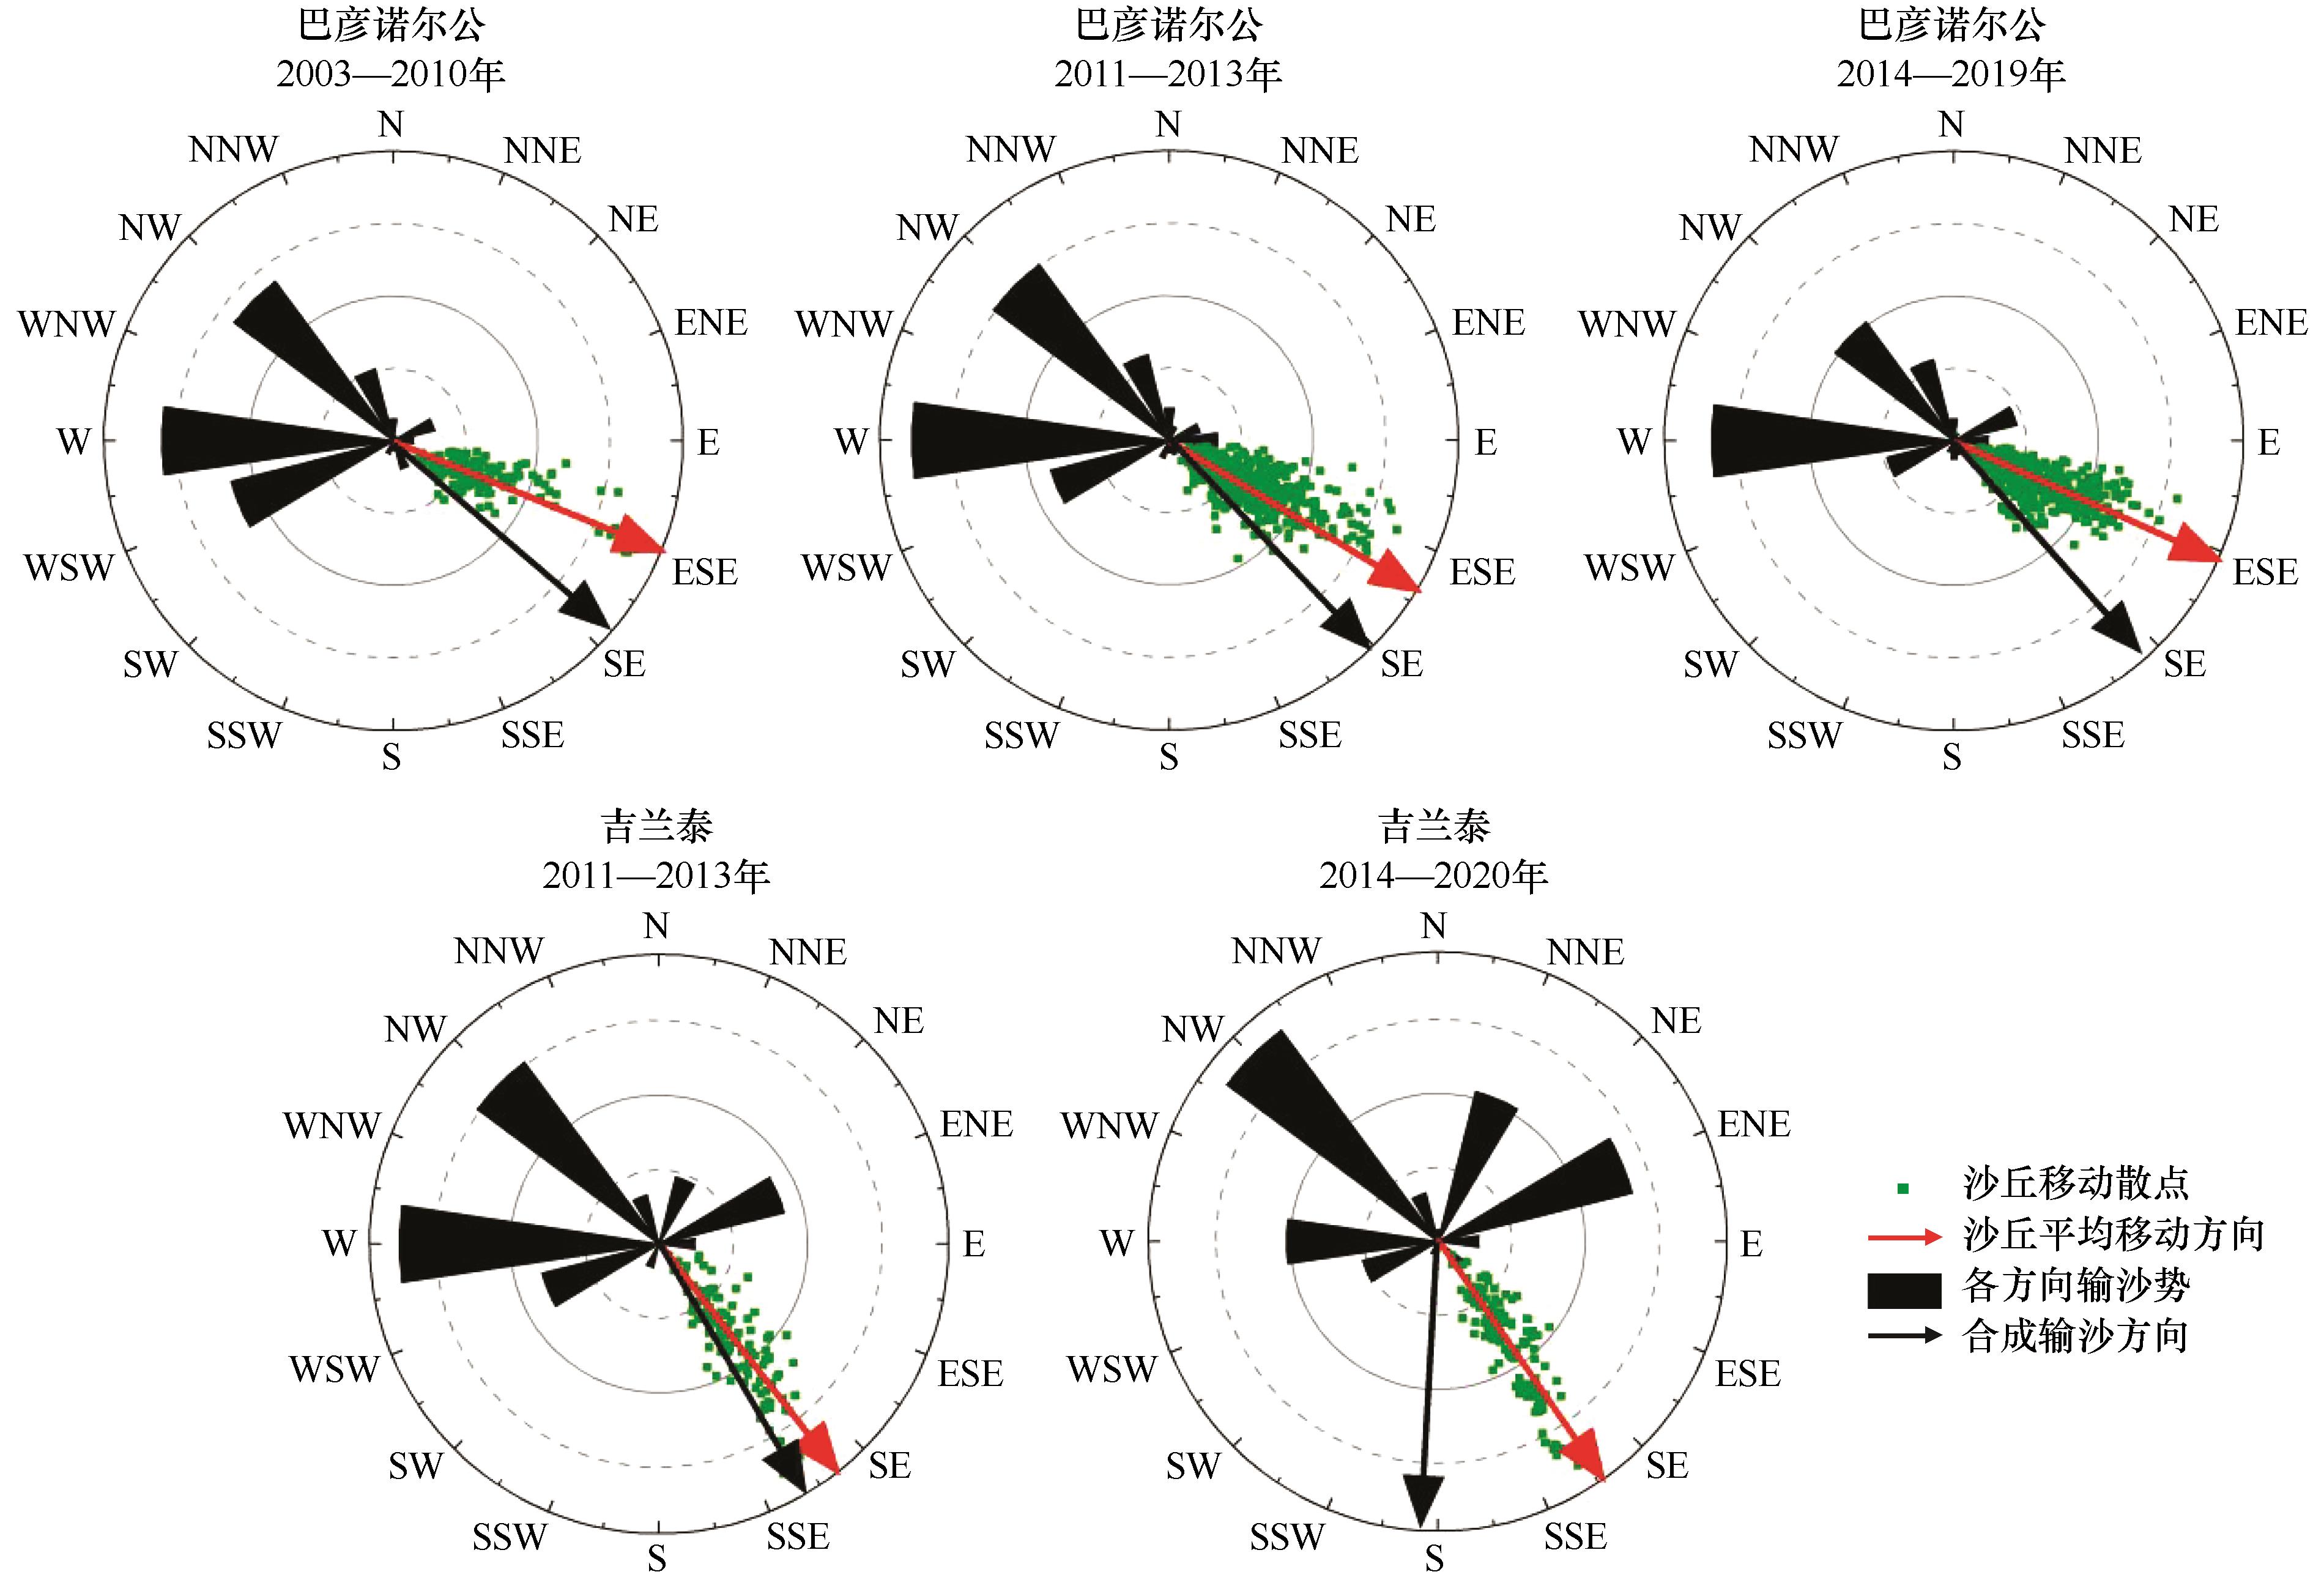
图7 各时间段输沙势与同期沙丘移动方向
Fig.7 Sand drift potentiality and dune movement direction for each time period
| 1 | 邹桂香,高宏智,边庆策,等.沙丘移动速度的观测与计算[J].干旱区资源与环境,1988,2(3):38-44. |
| 2 | Livingstone I, Warren A.Aeolian Geomorphology:An Introduction[M].Singapore:Longman,1996:211. |
| 3 | 吴正.塔克拉玛干沙漠成因的探讨[J].地理学报,1981,36(3):280-291. |
| 4 | 黄鹏展,赵建平.沙丘移动的研究现状与未来研究思路[J].沙漠与绿洲气象,2010,4(1):1-5. |
| 5 | 王宁波,李生宇,王海峰,等.塔克拉玛干沙漠腹地垄间地上覆沙丘形态的空间变化特征及其成因[J].干旱区地理,2014,37(1):89-96. |
| 6 | 许明静.毛乌素沙地西北部沙丘移动和形态演变特征研究[D].西安:陕西师范大学,2021. |
| 7 | 常兆丰,张剑挥,王强强,等.新月形沙丘及新月形沙丘链存在的环境条件:以甘肃河西沙区为例[J].干旱区资源与环境,2016,30(11):167-173. |
| 8 | Hunter R E, Richmond B M, Alpha T R.Storm-control ledoblique dunes of the Oregon coast[J].Geological Society of America Bulletin,1983,94(12):1450. |
| 9 | 石学刚,刘世增,常兆丰.新月形沙丘的移动规律及其影响因子:以甘肃河西沙区为例[J].世界生态学,2017,6(2):93-102. |
| 10 | 杨军怀,董治宝,刘铮瑶,等.库鲁克沙漠风沙地貌与沙丘移动[J].中国沙漠,2019,39(4):1-8. |
| 11 | 刘宇胜.阿拉善北部戈壁地区新月形沙丘移动规律研究[D].呼和浩特:内蒙古农业大学,2018. |
| 12 | 宁文晓,王振亭.巴丹吉林沙漠东南部典型高大沙丘形态参数分析[J].福建农林大学学报(自然科学版),2018,47(6):755-763. |
| 13 | 李爱敏,韩致文.新月形沙丘形态参数与移动速度的关系[J].中国沙漠,2020,40(1):29-40. |
| 14 | 石学刚.民勤绿洲边缘新月形沙丘移动规律与环境因子的关系研究[D].兰州:甘肃农业大学,2017. |
| 15 | 王静璞,王光镇,韩柳,等.毛乌素沙地不同固沙措施下沙丘的移动特征[J].甘肃农业大学学报,2017,52(2):54-60. |
| 16 | 董玉祥,黄德全.河北昌黎翡翠岛海岸沙丘移动的初步观测[J].中国沙漠,2013,33(2):486-492. |
| 17 | 郭建英,董智,李锦荣,等.黄河乌兰布和沙漠段沿岸沙丘形态及其运移特征[J].水土保持研究,2016,23(6):40-44. |
| 18 | Kilibarda Z, Kilibarda V.Seasonal geomorphic processes and rates of sand movement at Mount Baldy dune in Indiana,USA[J].Aeolian Research,2016,23:103-114. |
| 19 | Dong Z, Wang X, Chen G.Monitoring sand dune advance in the Taklimakan Desert[J].Geomorphology,2000,35(3/4):219-231. |
| 20 | 胡晓刚,王苗苗,刘勇.基于多源高分辨率遥感影像的腾格里沙漠沙丘移动分析[J].中国科技博览,2016(2):337. |
| 21 | Kilibarda Z, Shillinglaw C.A 70 year history of coastal dune migration and beach erosion along the southern shore of Lake Michigan[J].Aeolian Research,2014,17(12):263-273. |
| 22 | Yao Z Y, Ta W Q, Jia X P,et al.Bank erosion and accretion along the Ningxia-Inner Mongolia reaches of the Yellow River from 1958 to 2008[J].Geomorphology,2011,127(1/2):99-106. |
| 23 | 刘羽,王秀红,张雪芹,等.巴丹吉林-腾格里沙漠间沙丘活化带发展过程及其驱动力分析[J].干旱区研究,2011,28(6):957-966. |
| 24 | 张云枫,马义娟,苏志珠,等.巴丹吉林沙漠与腾格里沙漠连接带沙丘移动规律[J].中国沙漠,2022,42(5):82-91. |
| 25 | 张稼乐,裴浩,苗百岭,等.巴丹吉林沙漠与亚玛雷克沙漠之间连接带的动态研究[J].内蒙古气象,2021(4):22-29. |
| 26 | Dong Z B, Qian G Q, Lv P,et al.Investigation of the sand sea with the tallest dunes on Earth:China's Badain Jaran Sand Sea[J].Earth-Science Reviews,2013,120:20-39. |
| 27 | 哈斯,董光荣,王贵勇.腾格里沙漠东南缘格状沙丘的形态动力学研究[J].中国科学D辑:地球科学,1999(5):466-471. |
| 28 | Yang Y Y, Qu Z Q, Shi P J,et al.Wind regime and sand transport in the corridor between the Badain Jaran and Tengger Deserts,central Alxa Plateau,China[J].Aeolian Research,2014,12:143-156. |
| 29 | 张诚.阿拉善沙漠风积砂重矿物组成及物源分析[D].兰州:兰州大学,2020. |
| 30 | 刘婵,赵文智,刘冰,等.基于无人机和MODIS数据的巴丹吉林沙漠植被分布特征与动态变化研究[J].中国沙漠,2019,39(4):92-102. |
| 31 | 李建军,焦菊英,曹雪,等.柴达木盆地沙丘移动的空间分异及对形态参数的响应[J].农业工程学报,2021,37(7):309-314. |
| 32 | 王静璞,刘连友,沈玲玲.基于Google Earth的毛乌素沙地新月形沙丘移动规律研究[J].遥感技术与应用,2013,28(6):1094-1100. |
| 33 | 刘佳,王利民,滕飞,等.Google Earth影像辅助的农作物面积地面样方调查[J].农业工程学报,2015,31(24):149-154. |
| 34 | Lancaster N.Geomorphology of Desert Dunes[M].London,UK:Taylor & Francis e-Library,2005. |
| 35 | Katsuki A, Kikuchi M.Simulation of barchan dynamics with inter-dune sand streams[J].New Journal of Physics,2011,13(6):63049. |
| 36 | 刘建宝,王乃昂,程弘毅,等.沙丘沙休止角影响因素实验研究[J].中国沙漠,2010,30(4):758-762. |
| 37 | Yang J H, Dong Z B, Liu Z Y,et al.Migration of barchan dunes in the western Quruq Desert,northwestern China[J].Earth Surface Processes and Land forms,2019,44(10):2016-2029. |
| 38 | 贾光普.阿拉善戈壁地区新月形沙丘形态特征与动态演变过程研究[D].呼和浩特:内蒙古农业大学,2022. |
| 39 | 邹桐,杨转玲,韦锦芝,等.柴达木盆地西南缘新月形沙丘移动特征及其影响因素[J].中国沙漠,2023,43(1):212-221. |
| 40 | Laity J.Deserts and Desert Environments[M].Hoboken,USA:John Wiley & Sons,2008. |
| 41 | 朱震达,陈治平,吴正,等.塔克拉玛干沙漠风沙地貌研究[M].北京:科学出版社,1981:27-80. |
| 42 | 杨军怀.塔克拉玛干沙漠沙丘移动研究[D].西安:陕西师范大学,2020. |
| 43 | White B R, Tsoar H.Slop effect on saltation over a climbing dune[J].Geomorphology,1998,22(2):159-180. |
| 44 | Tsoar H, White B R.The effect of slopes on sand transport-numerical modeling[J].Landscape and Urban Planning,1996,34(3/4):171-181. |
| 45 | Nickling W G, Mckenna N C, Lancaster N.Grainfall processes in the lee of transverse dunes,Silver Peak,Nevada[J].Sedimentology,2002,49(1):191-209. |
| 46 | 哈斯.腾格里沙漠东南缘沙丘表面风沙流结构变异的初步研究[J].科学通报,2004,49(11):1099-1104. |
| 47 | Tsoar H.The formation of seif dunes from barchans-a discussion[J].Zeitschrift fur Geomorphologie,1984,28(1):99-103. |
| 48 | 闫德仁,姚洪林,李纯英.巴音温都尔沙漠考察报告[J].内蒙古林业科技,2017,43(2):49-51. |
| [1] | 李爱敏, 赵培臣, 韩致文. 基于三维数字模型的新月形沙丘移动轨迹拟合[J]. 中国沙漠, 2024, 44(2): 48-56. |
| [2] | 何晨晨, 王振亭, 王宗礼. 利用 14C测年法确定新月形沙丘移动速率[J]. 中国沙漠, 2024, 44(1): 119-121. |
| [3] | 张欣, 董治宝, 南维鸽, 陈国祥, 石唯康, 王晓枝, 高冲. 巴丹吉林沙漠湖泊颜色季节性变化成因[J]. 中国沙漠, 2023, 43(6): 89-97. |
| [4] | 李永山, 贾晓鹏, 王海兵, 王建, 马启民. 1966—2019年黄河乌兰布和沙漠宽谷段河道深泓横向摆动特征[J]. 中国沙漠, 2023, 43(5): 59-65. |
| [5] | 甘开元, 张金霞, 陈丽娟, 席海洋, 张斌武, 雍天, 卫雨西. 乌兰布和沙漠沿黄河段植物群落特征及空间分异[J]. 中国沙漠, 2023, 43(4): 180-190. |
| [6] | 罗霖炎, 高鑫, 赵永成. 新月形沙丘表面流场特征[J]. 中国沙漠, 2023, 43(4): 41-54. |
| [7] | 姜亚东, 吕世杰, 刘红梅, 娜仁花, 刘昕宇. 巴丹吉林沙漠东缘主要灌木数量特征及空间分布[J]. 中国沙漠, 2023, 43(3): 295-304. |
| [8] | 肖雨婷, 张国明, 洪畅, 刘连友, 杨岩岩, 谷雨, 刘勇, 向明珠, 曲书锋, 孙煦然. 巴丹吉林沙漠西缘不同地表沙尘水平通量[J]. 中国沙漠, 2023, 43(2): 104-113. |
| [9] | 李静芸, 傅天阳, 申玉龙, 王立辉, 伍永秋. 毛乌素沙地新月形和抛物线形沙丘表层沉积物粒度特征[J]. 中国沙漠, 2023, 43(2): 226-232. |
| [10] | 张潇, 严平, 董苗, 刘小槺, 袁文杰, 王晓旭. 柴达木盆地托拉海河下游复合新月形沙丘沉积构造探地雷达探测初步结果[J]. 中国沙漠, 2023, 43(1): 160-168. |
| [11] | 邹桐, 杨转玲, 韦锦芝, 廖应英, 邢学刚, 钱广强, 梁晓磊. 柴达木盆地西南缘新月形沙丘移动特征及其影响因素[J]. 中国沙漠, 2023, 43(1): 212-221. |
| [12] | 李映坤, 李锦荣, 董雷, 罗祥英, 韩兆恩, 王茹. 乌兰布和沙漠周边典型植物群落防风阻沙效果[J]. 中国沙漠, 2022, 42(6): 65-73. |
| [13] | 李星, 马媛, 李星, 高君亮, 辛智鸣, 卢琦. 乌兰布和沙漠植物群落相异性及其影响因素[J]. 中国沙漠, 2022, 42(5): 187-194. |
| [14] | 刘雅莉, 白建华, 熊伟, 韩雨晴, 廉泓林, 郭浩, 辛智鸣, 刘湘杰, 刘怀远. 乌兰布和沙漠梭梭( Haloxylon ammodendron )夜间液流特征及其环境驱动机制[J]. 中国沙漠, 2022, 42(5): 195-203. |
| [15] | 王蒙, 逯军峰, 付鹏, 董治宝. 巴丹吉林沙漠周边地区土壤养分和粒度特征[J]. 中国沙漠, 2022, 42(5): 232-244. |
| 阅读次数 | ||||||
|
全文 |
|
|||||
|
摘要 |
|
|||||
©2018中国沙漠 编辑部
地址: 兰州市天水中路8号 (730000)
电话:0931-8267545
Email:caiedit@lzb.ac.cn;desert@lzb.ac.cn

 甘公网安备 62010202000688号