中国沙漠 ›› 2025, Vol. 45 ›› Issue (1): 204-214.DOI: 10.7522/j.issn.1000-694X.2024.00154
• • 上一篇
高娜( ), 胡光印(), 董治宝
收稿日期:2024-09-29
修回日期:2024-11-07
出版日期:2025-01-20
发布日期:2025-01-13
通讯作者:
胡光印
作者简介:胡光印(E-mail: guangyinhu@snnu.edu.cn)基金资助:
Na Gao(), Guangyin Hu(), Zhibao Dong
Received:2024-09-29
Revised:2024-11-07
Online:2025-01-20
Published:2025-01-13
Contact:
Guangyin Hu
摘要:
沙地空间分布格局是沙物质经流水作用汇聚后,受到风力长期侵蚀、搬运、堆积的结果。为了采用定量化的方式度量沙地空间分布格局并分析其变化特征,本研究选取青藏高原东北部的共和盆地作为研究区,基于1980—2020年土地利用数据,采用地理重心模型,并提出了迁移度模型,计算沙地重心和迁移度,分析了共和盆地的沙地空间分布格局变化特征。结果表明:共和盆地的沙地迁移距离自西北向东南递减,其中沙珠玉河流域最大,为43.43 km;沙珠玉河流域与龙羊峡西侧流域组成的区域次之,为39.93 km;沙珠玉河流域、龙羊峡西侧流域与龙羊峡东侧流域组成的区域略小,为31.88 km;龙羊峡东侧流域最小,为5.74 km。整个盆地沙地迁移方向主要为东南向(99.46°~126.80°)。迁移度在盆地内呈现出西北向东南递减的趋势,沙珠玉河流域为0.83,沙珠玉河流域与龙羊峡西侧流域组成的区域为0.61,沙珠玉河流域、龙羊峡西侧流域与龙羊峡东侧流域组成的区域为0.30,龙羊峡东侧流域为0.15。共和盆地沙地空间分布格局随时间的变化趋势不明显,沙地空间分布格局作为区域环境因素长期作用的结果具有一定的稳定性。
中图分类号:
高娜, 胡光印, 董治宝. 共和盆地沙地空间分布格局变化特征[J]. 中国沙漠, 2025, 45(1): 204-214.
Na Gao, Guangyin Hu, Zhibao Dong. Change characteristics of spatial distribution pattern of sandy land in Gonghe Basin[J]. Journal of Desert Research, 2025, 45(1): 204-214.
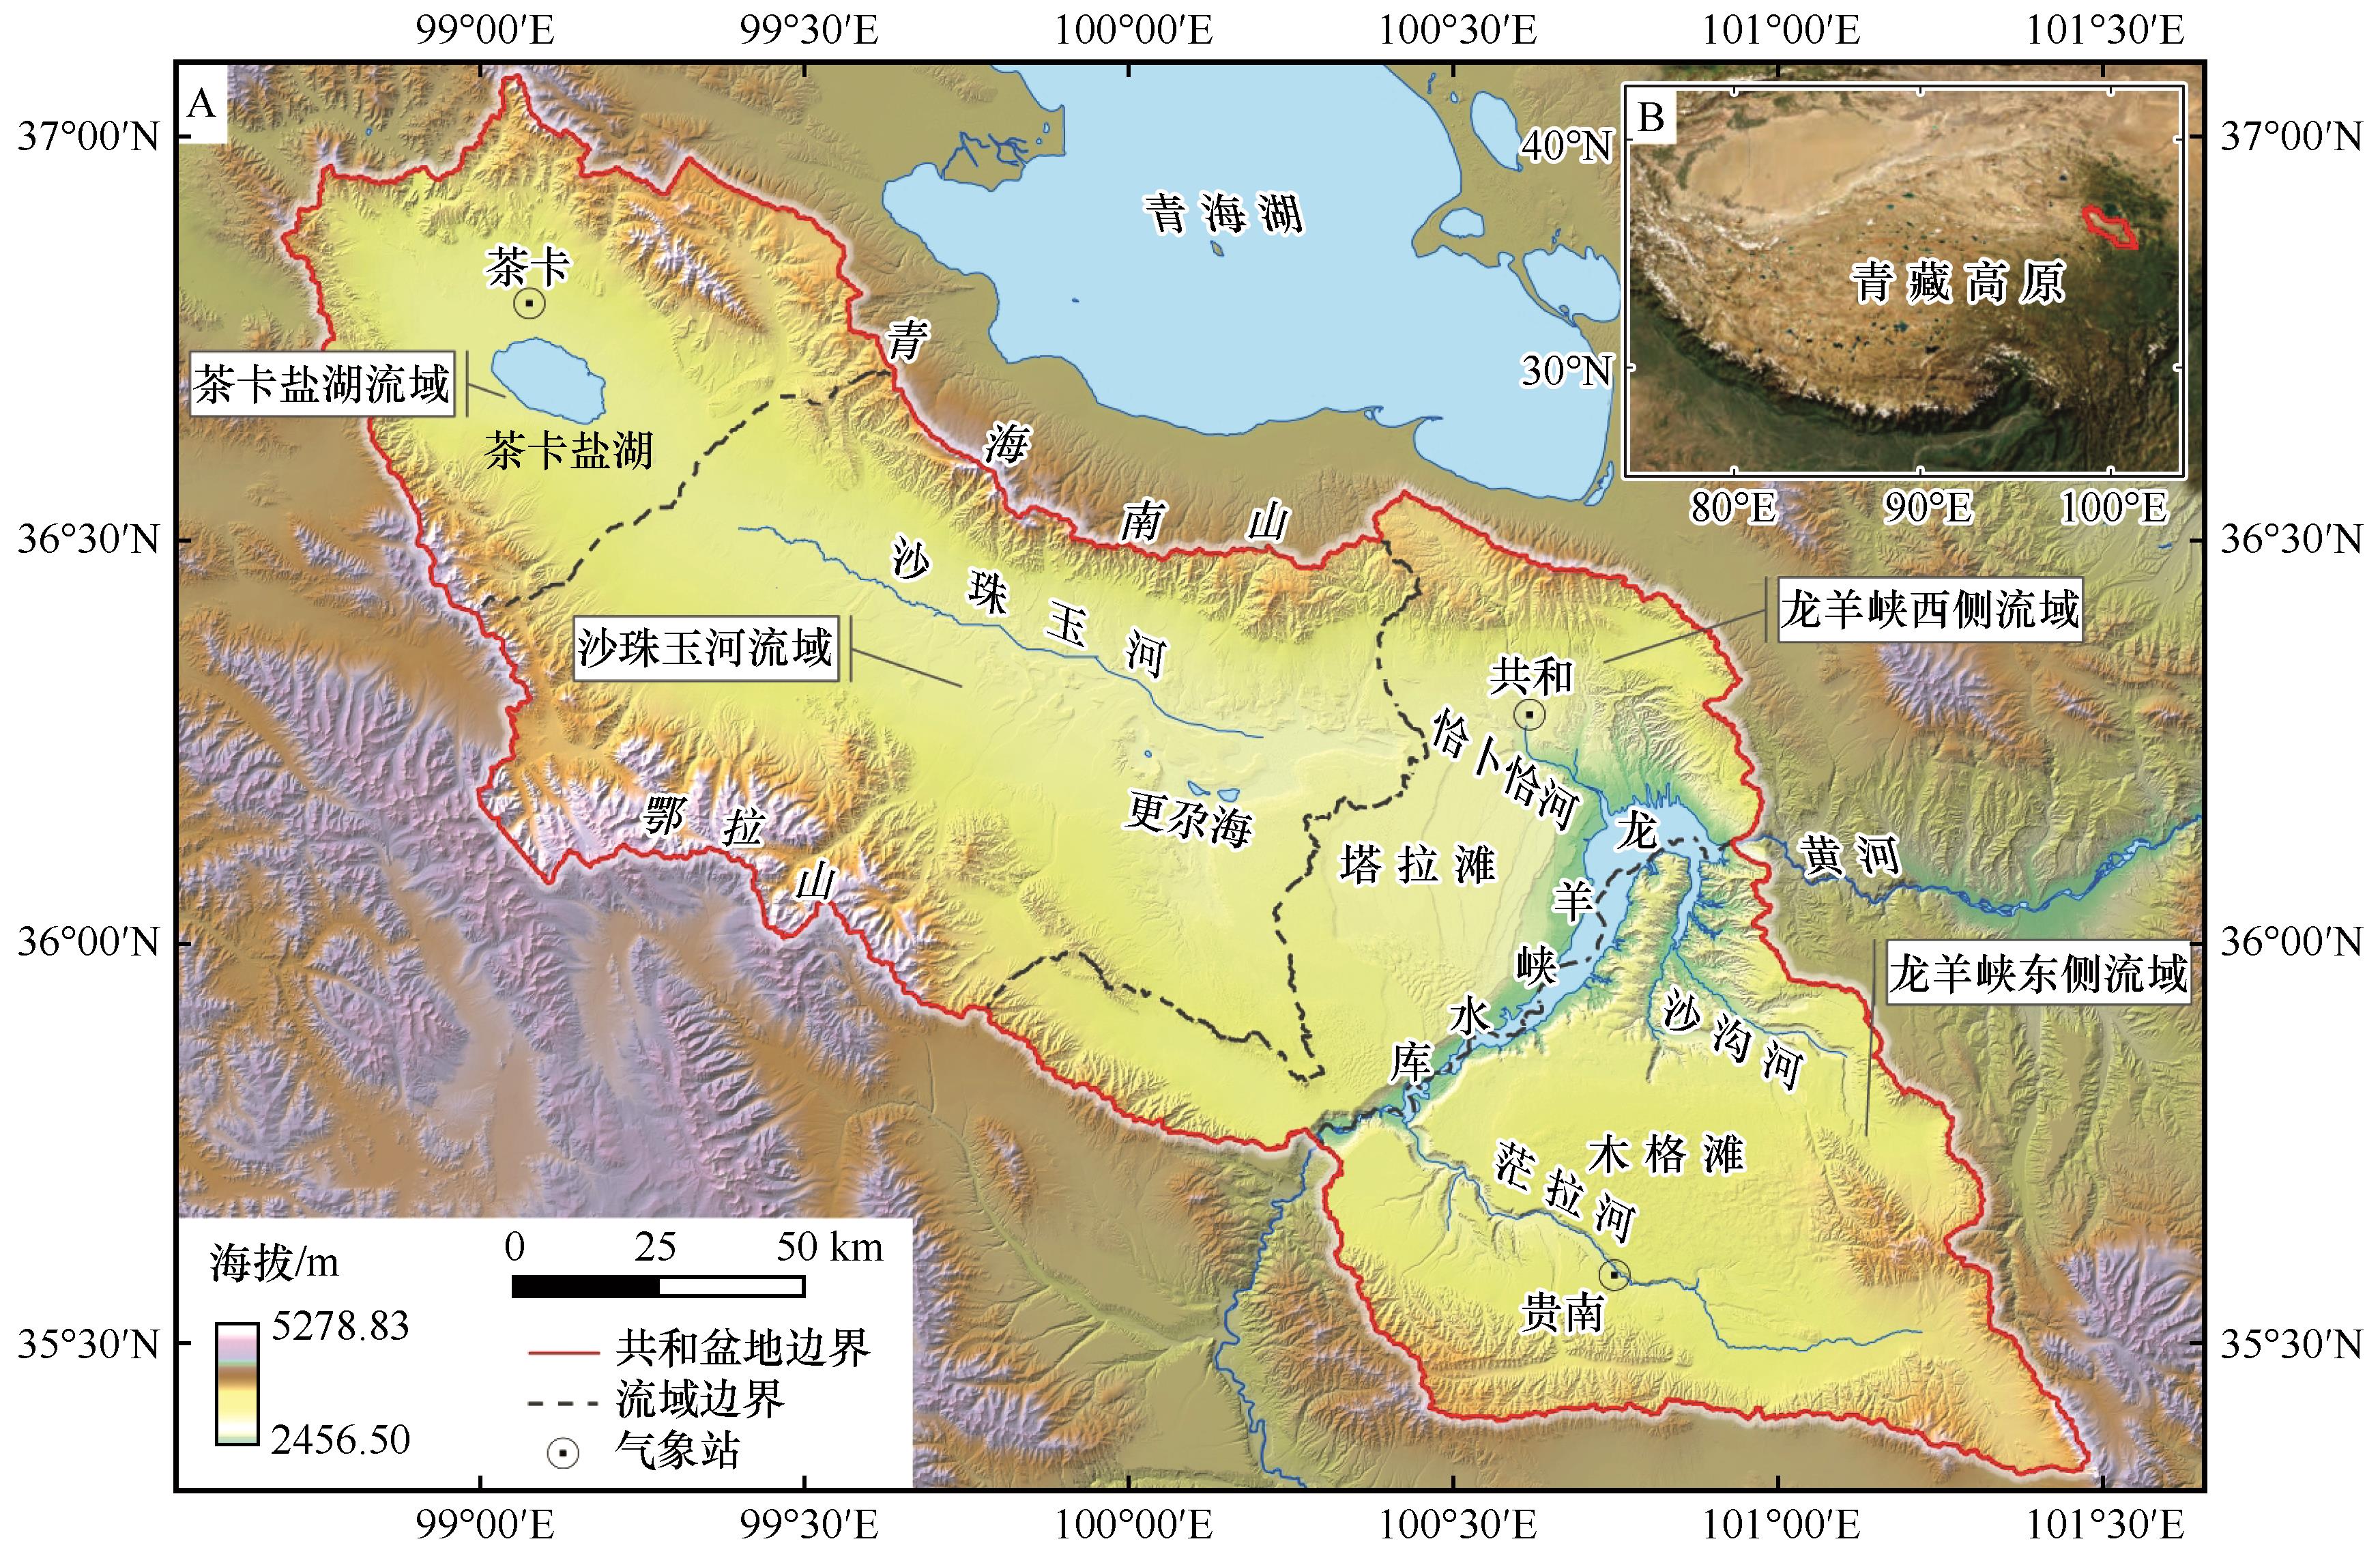
图1 研究区范围
Fig.1 Scope of the study area
| 数据类型 | 数据格式 | 分辨率 | 数据来源 |
|---|---|---|---|
| 土地利用 | 栅格 | 30 m×30 m | http://www.resdc.cn |
| Copernicus数字高程模型 | 栅格 | 30 m×30 m | https://panda.copernicus.eu |
| Landsat遥感影像 | 栅格 | 30 m×30 m | https://earthexplorer.usgs.gov |
表1 数据类型及来源
Table 1 Data types and sources
| 数据类型 | 数据格式 | 分辨率 | 数据来源 |
|---|---|---|---|
| 土地利用 | 栅格 | 30 m×30 m | http://www.resdc.cn |
| Copernicus数字高程模型 | 栅格 | 30 m×30 m | https://panda.copernicus.eu |
| Landsat遥感影像 | 栅格 | 30 m×30 m | https://earthexplorer.usgs.gov |
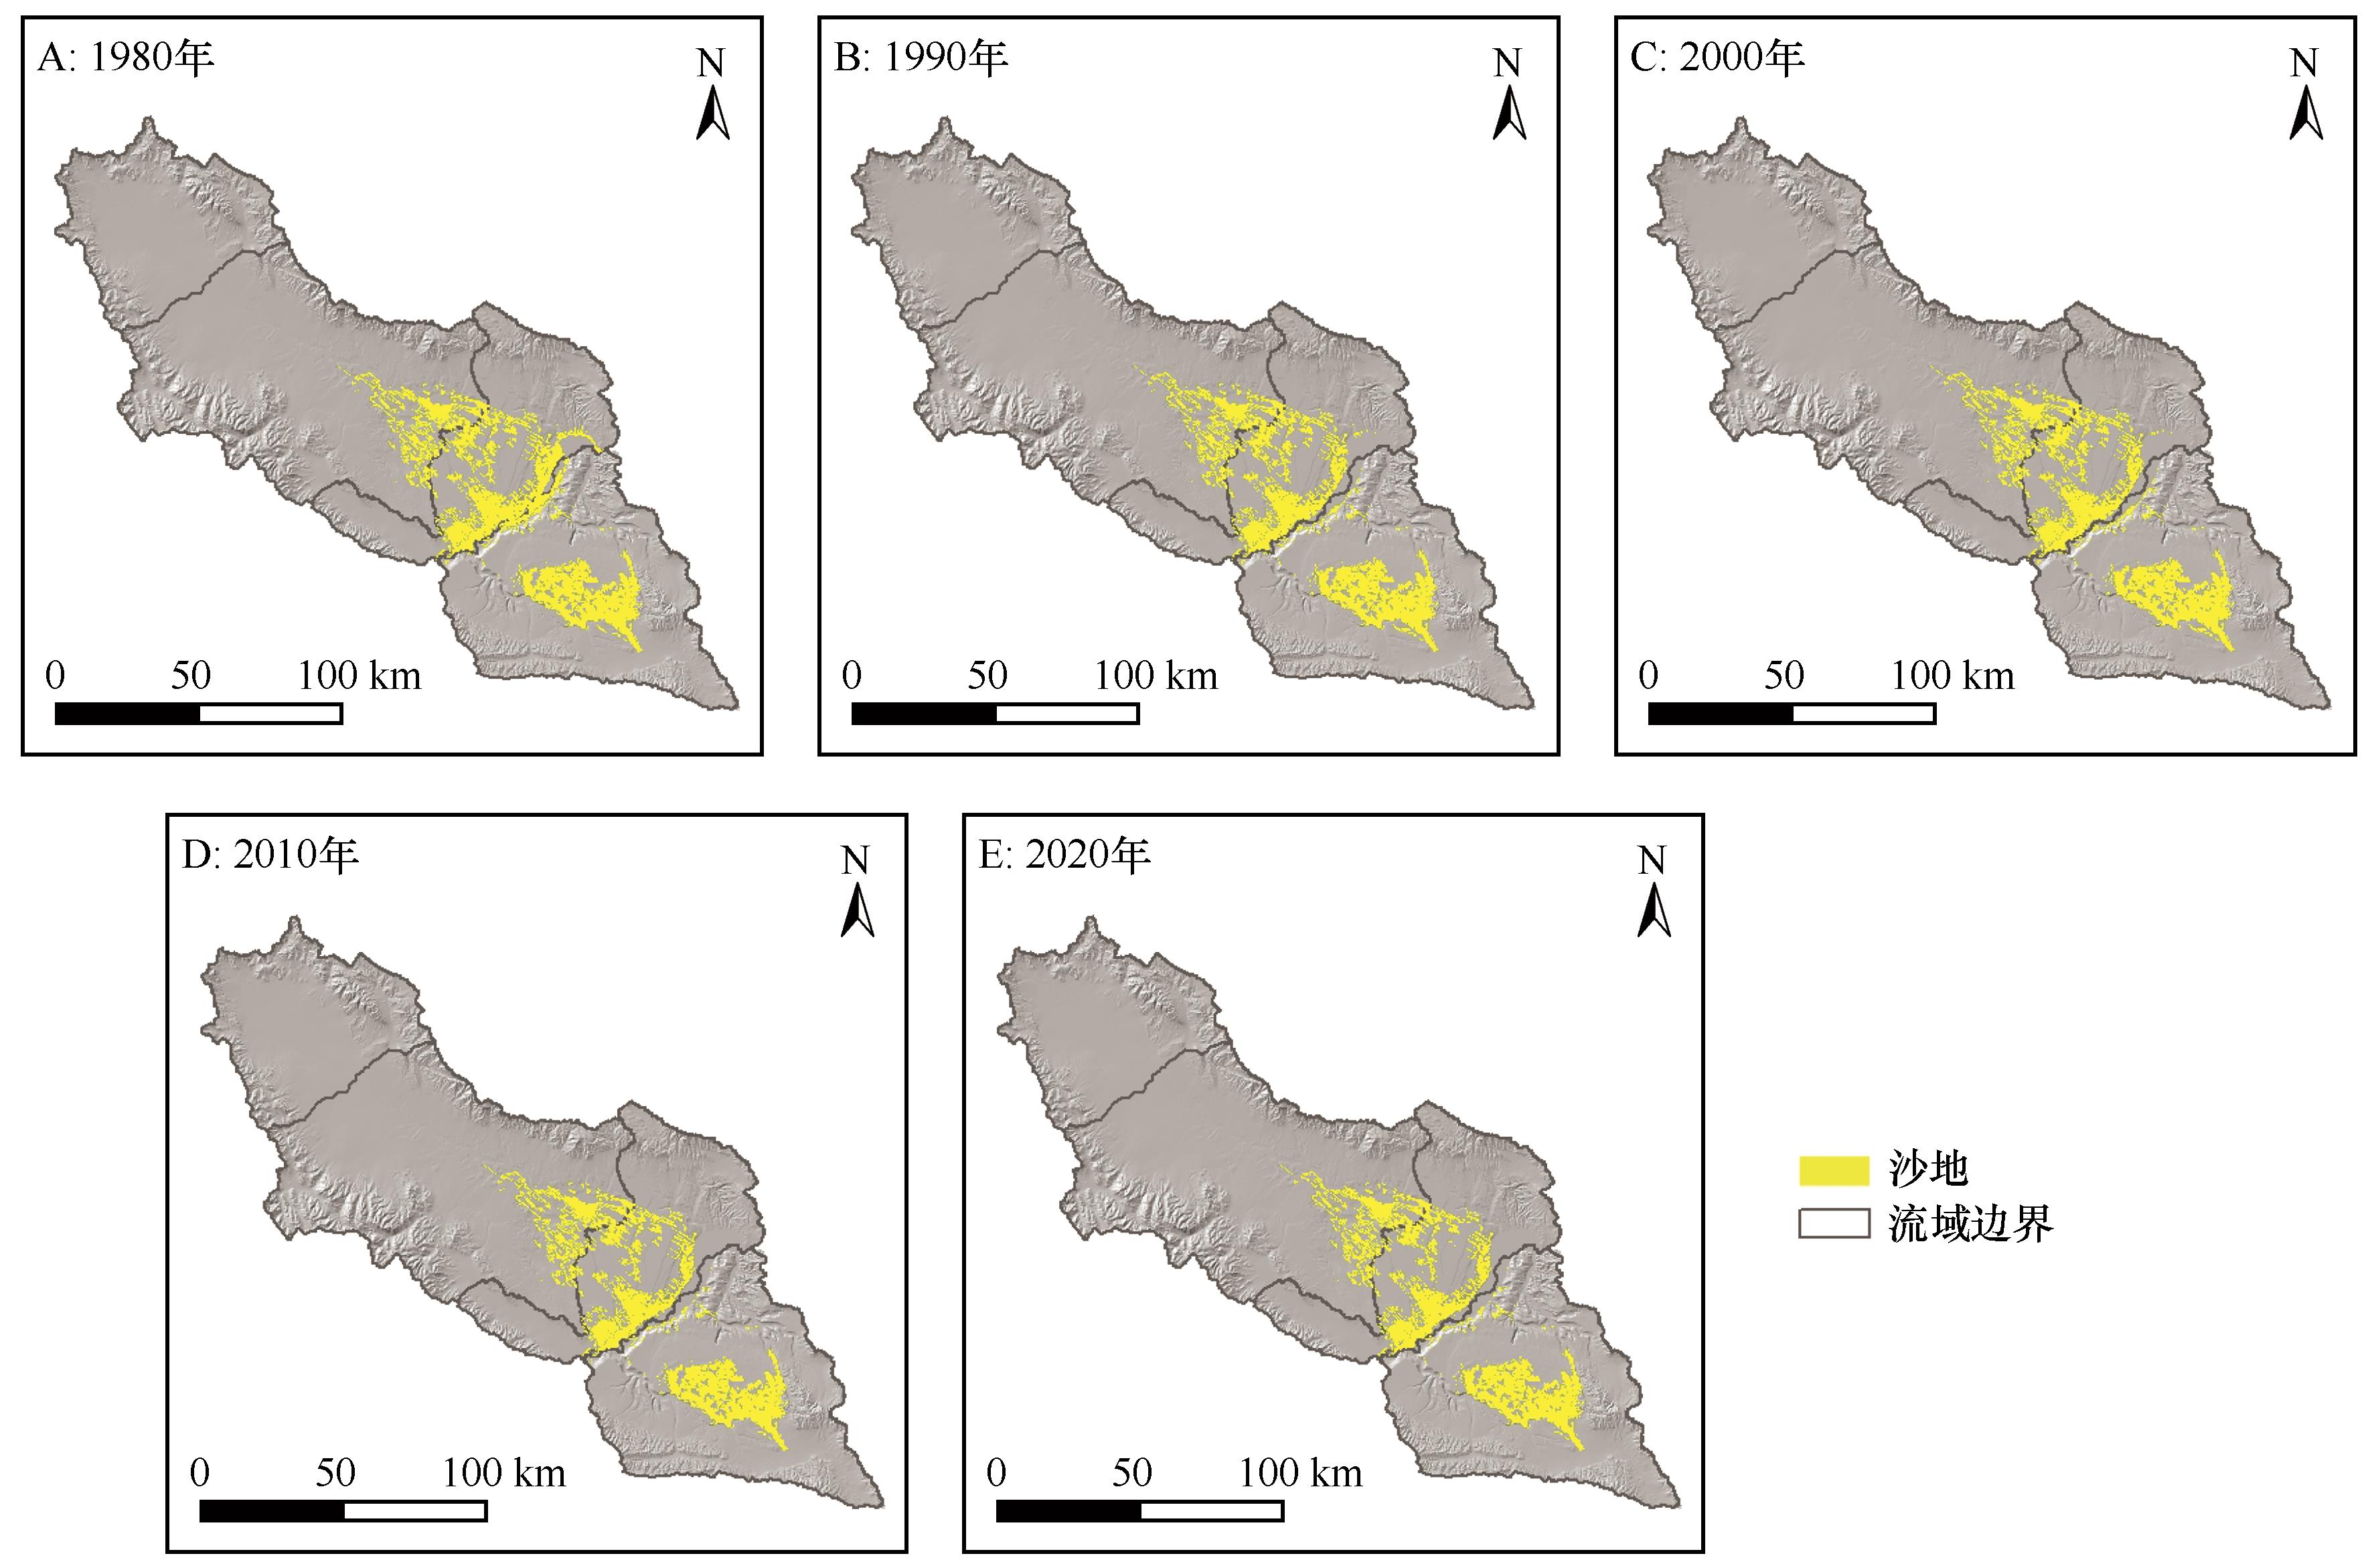
图2 1980—2020年共和盆地沙地分布范围
Fig.2 Distribution of sandy land in Gonghe Basin from 1980 to 2020
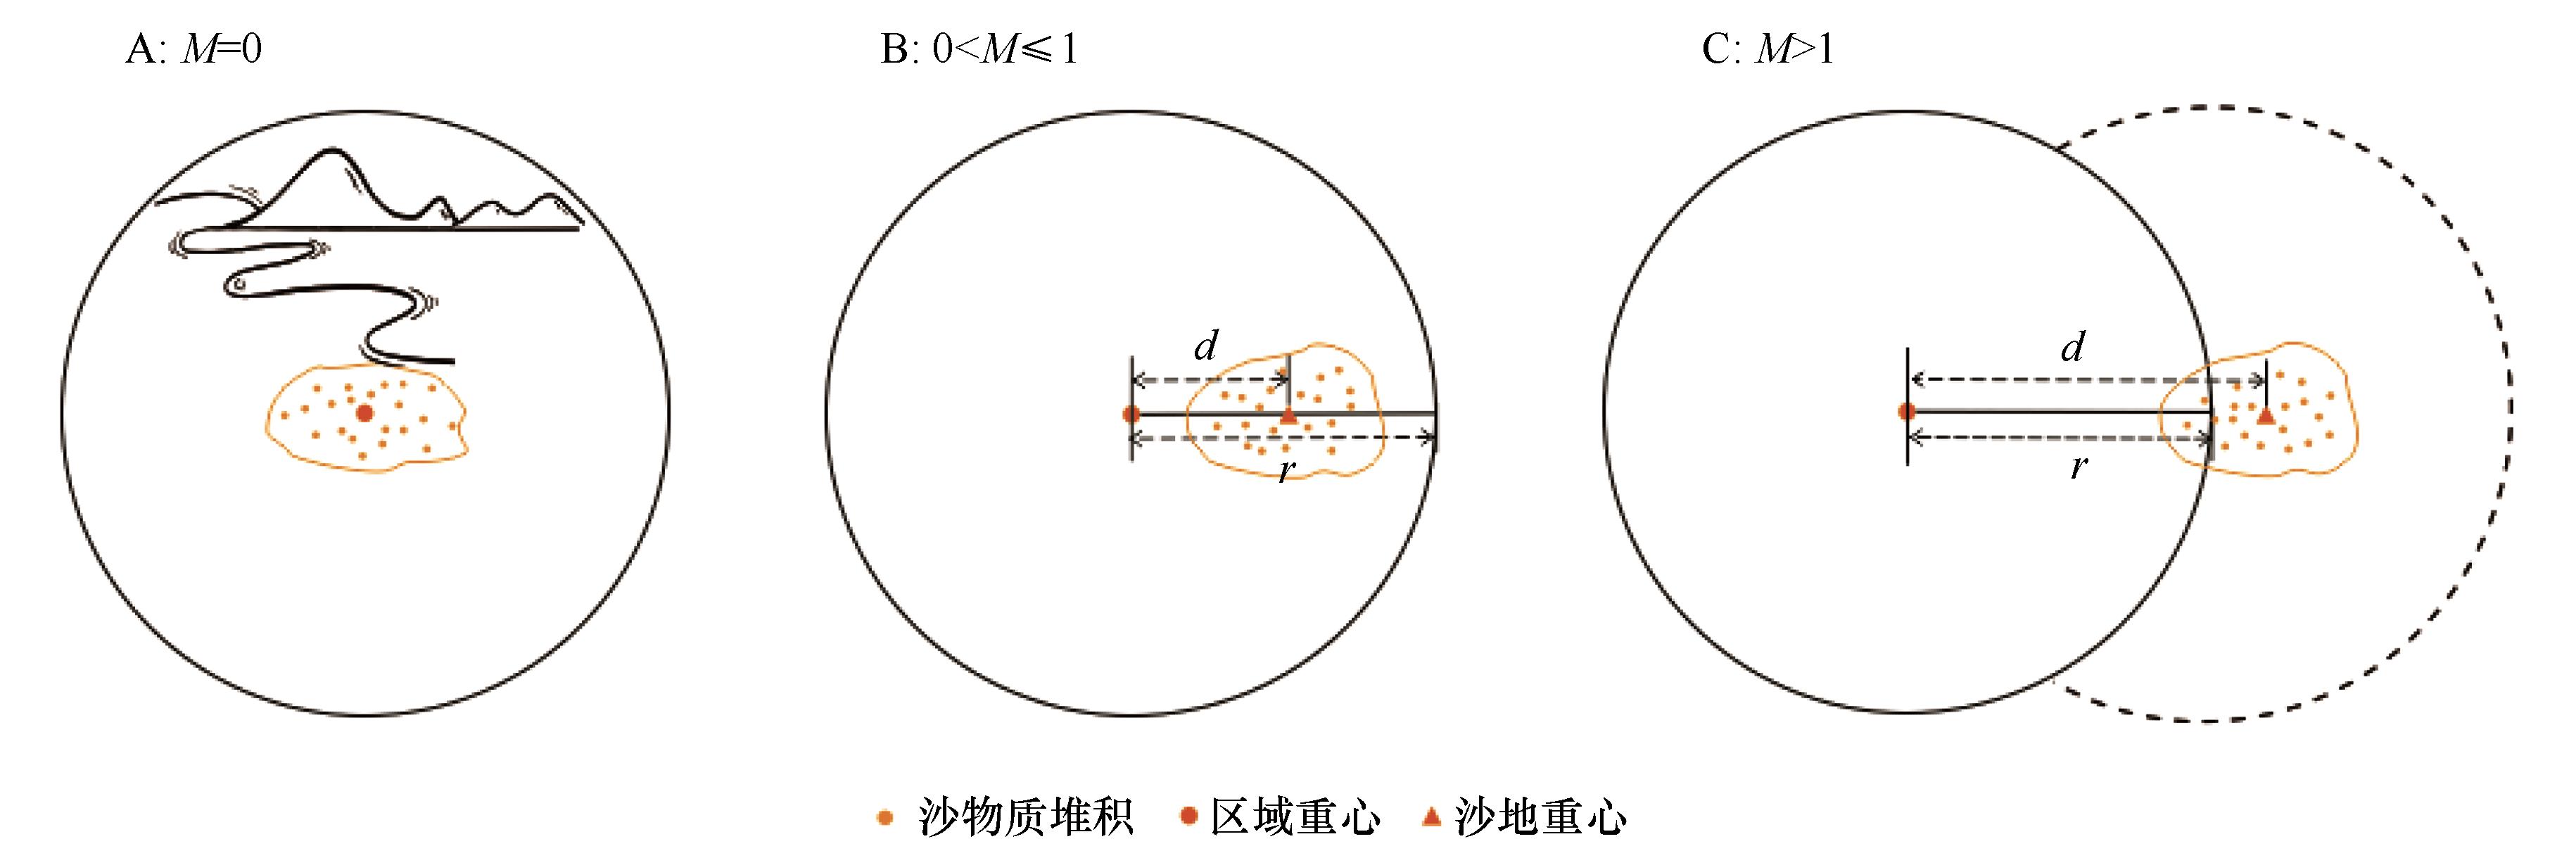
图3 迁移度概念模型示意图
Fig.3 Conceptual model diagram of Migration Intensity
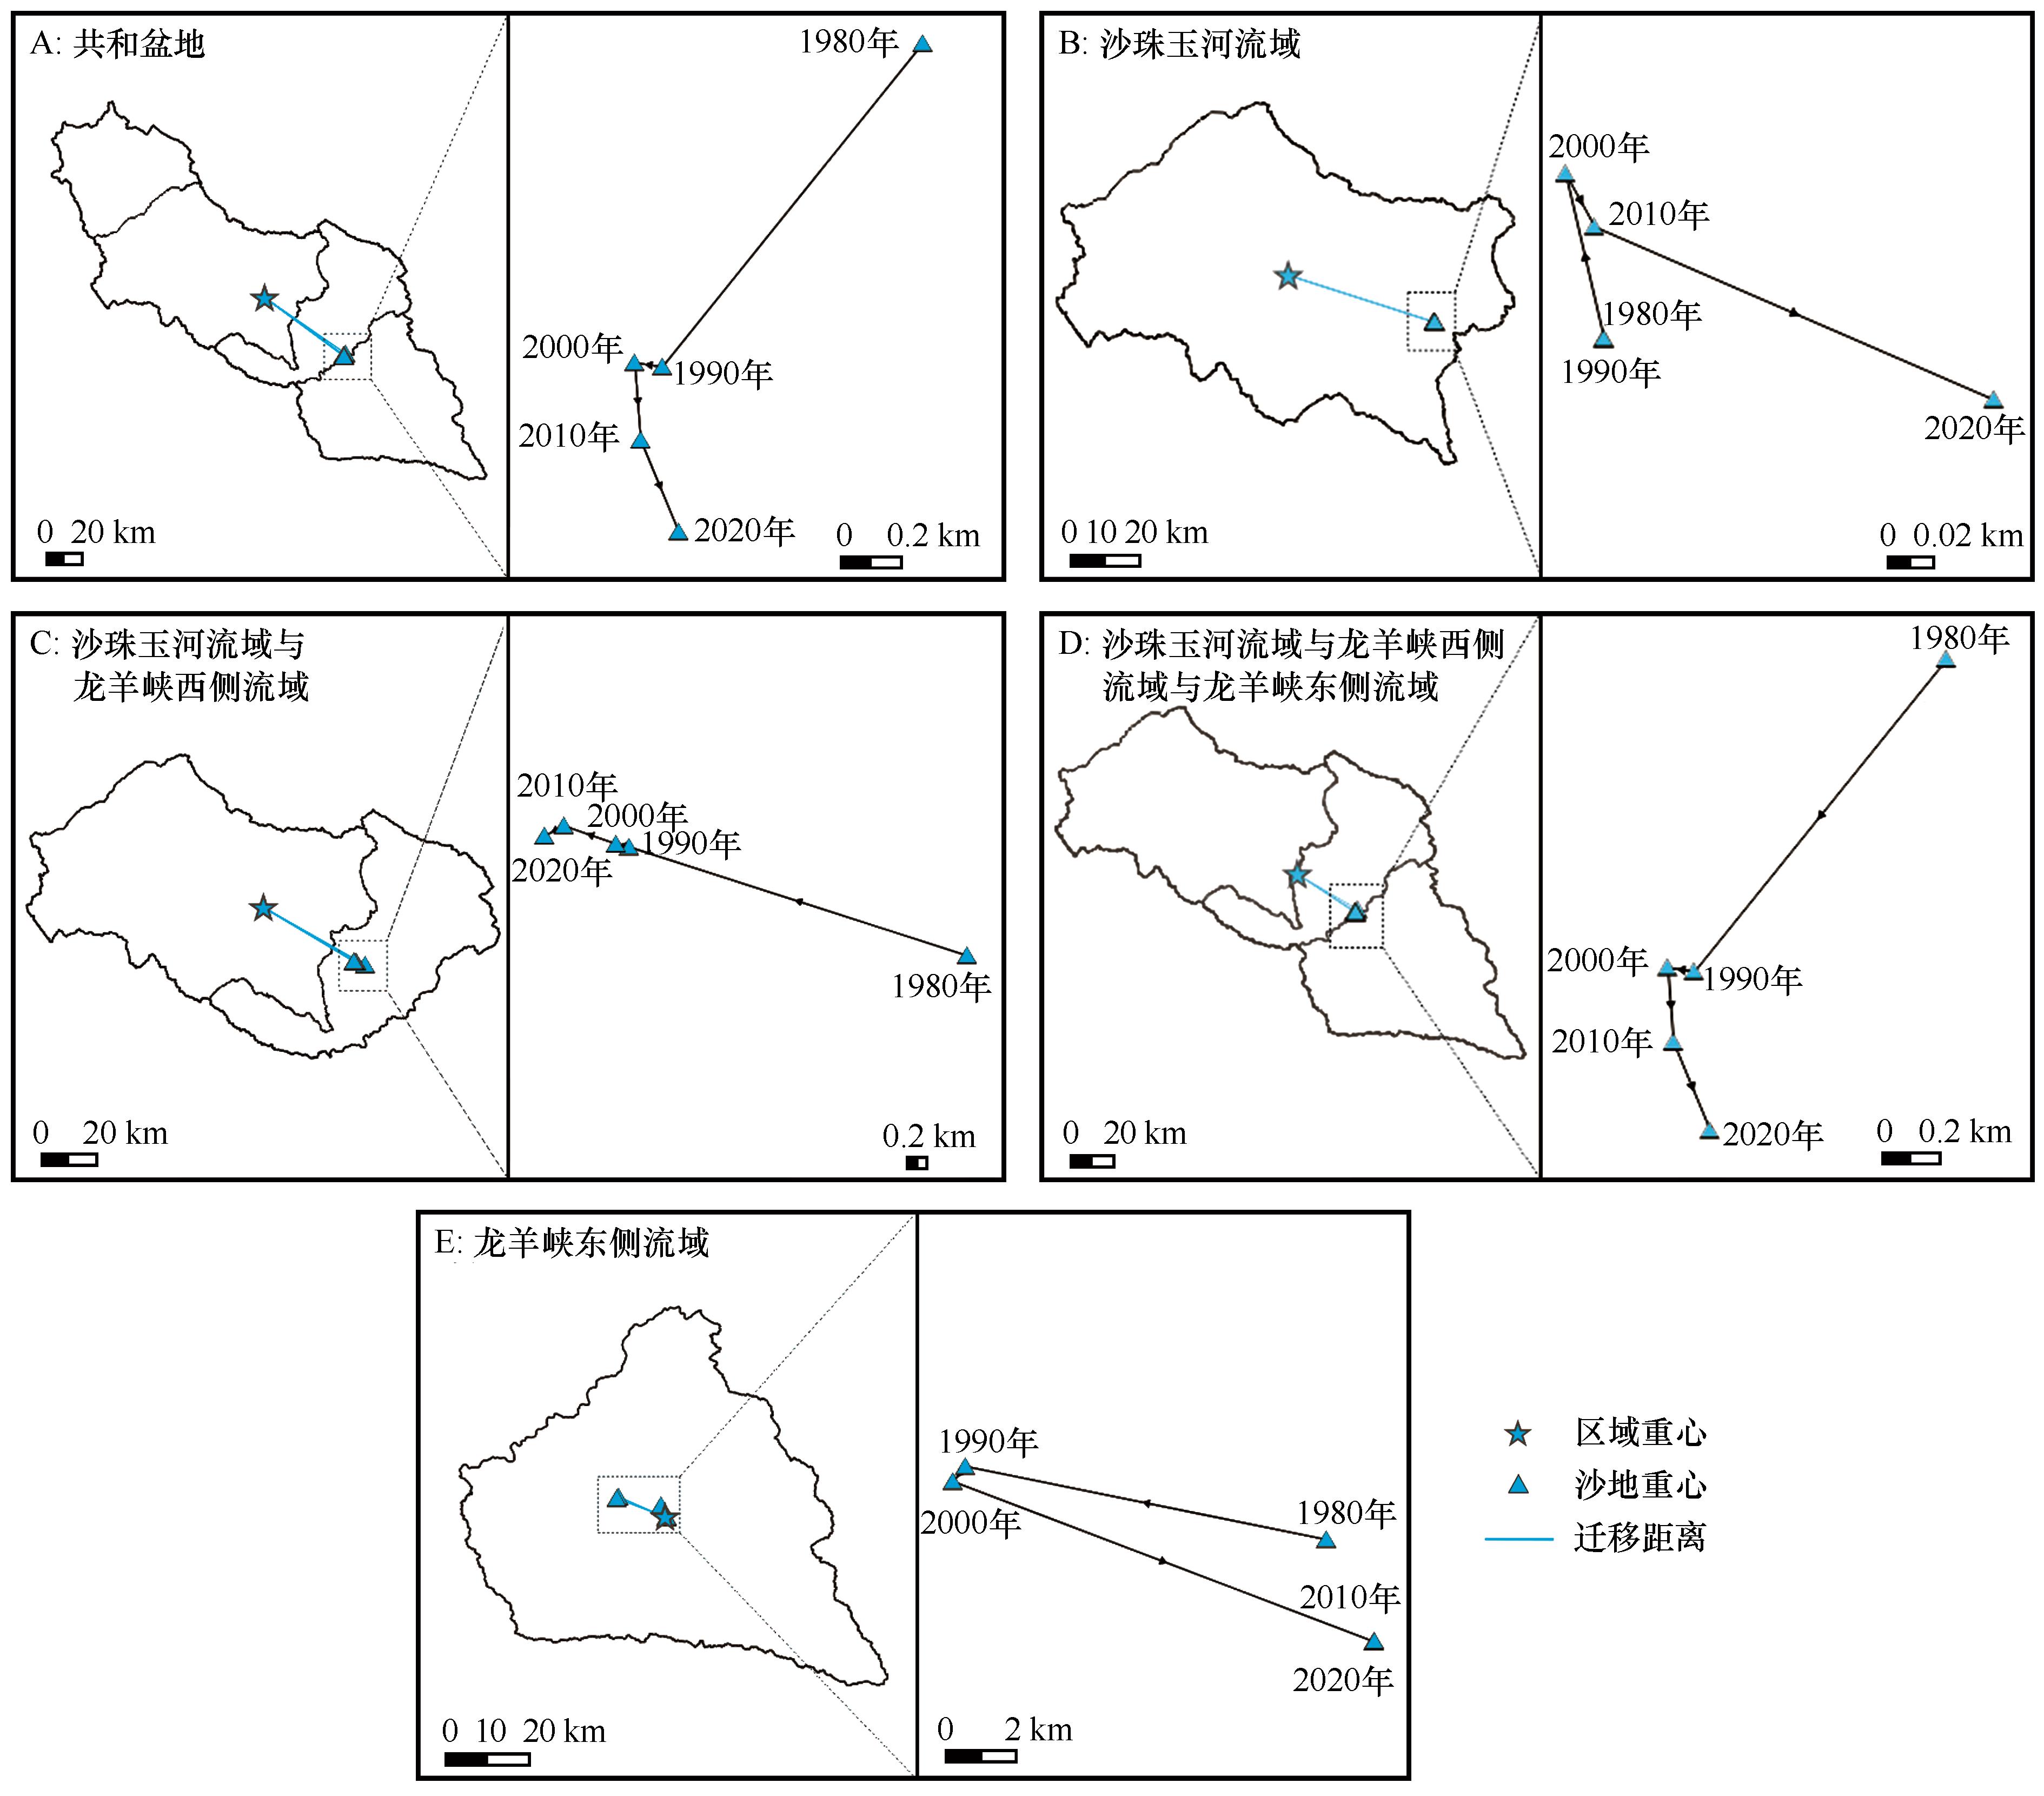
图4 1980—2020年共和盆地各区域沙地重心分布及其变化
Fig.4 Distribution and changes of sandy land barycenters in Gonghe Basin from 1980 to 2020
| 区域 | 年份 | 沙地重心 | 迁移距离 /km | 迁移方向 /(°) | 迁移度 | 时段 | 沙地重心移动 | ||
|---|---|---|---|---|---|---|---|---|---|
| 经度(E) | 纬度(N) | 距离/km | 角度/(°) | ||||||
| A | 1980 | 100°35′15.544″ | 35°55′05.621″ | 53.13 | 124.86 | 0.41 | \ | \ | \ |
| 1990 | 100°34′42.110″ | 35°54′29.922″ | 53.05 | 126.36 | 0.38 | 1980—1990 | 1.39 | 218.84 | |
| 2000 | 100°34′38.335″ | 35°54′30.232″ | 52.97 | 126.41 | 0.38 | 1990—2000 | 0.09 | 278.53 | |
| 2010 | 100°34′39.637″ | 35°54′22.017″ | 53.14 | 126.62 | 0.38 | 2000—2010 | 0.26 | 175.62 | |
| 2020 | 100°34′45.359″ | 35°54′12.440″ | 53.42 | 126.80 | 0.38 | 2010—2020 | 0.33 | 157.44 | |
| 平均值 | \ | \ | 53.14 | 126.21 | 0.39 | 1980—2020 | 1.83 | 206.56 | |
| B | 1980 | 100°12′35.614″ | 36° 10′55.253″ | 43.41 | 107.87 | 0.83 | \ | \ | \ |
| 1990 | 100°12′35.617″ | 36° 10′55.250″ | 43.41 | 107.87 | 0.83 | 1980—1990 | 0.00 | 141.59 | |
| 2000 | 100°12′34.797″ | 36° 10′57.503″ | 43.37 | 107.79 | 0.82 | 1990—2000 | 0.07 | 346.89 | |
| 2010 | 100°12′35.358″ | 36° 10′56.791″ | 43.39 | 107.81 | 0.83 | 2000—2010 | 0.03 | 151.22 | |
| 2020 | 100°12′42.548″ | 36° 10′54.671″ | 43.58 | 107.83 | 0.83 | 2010—2020 | 0.19 | 113.44 | |
| 平均值 | \ | \ | 43.43 | 107.83 | 0.83 | 1980—2020 | 0.17 | 98.90 | |
| C | 1980 | 100°25′20.430″ | 36°03′16.092″ | 42.92 | 119.56 | 0.65 | \ | \ | \ |
| 1990 | 100°23′05.287″ | 36°03′44.740″ | 39.56 | 120.58 | 0.60 | 1980—1990 | 3.44 | 287.81 | |
| 2000 | 100°23′00.077″ | 36°03′45.477″ | 39.44 | 120.63 | 0.60 | 1990—2000 | 0.13 | 282.90 | |
| 2010 | 100°22′39.249″ | 36°03′50.351″ | 38.91 | 120.79 | 0.59 | 2000—2010 | 0.53 | 289.15 | |
| 2020 | 100°22′31.685″ | 36°03′46.971″ | 38.80 | 121.06 | 0.59 | 2010—2020 | 0.21 | 243.25 | |
| 平均值 | \ | \ | 39.93 | 120.52 | 0.61 | 1980—2020 | 4.26 | 285.82 | |
| D | 1980 | 100°35′15.544″ | 35°55′05.621″ | 31.94 | 120.72 | 0.32 | \ | \ | \ |
| 1990 | 100°34′42.110″ | 35°54′29.922″ | 31.77 | 123.20 | 0.29 | 1980—1990 | 1.39 | 218.84 | |
| 2000 | 100°34′38.335″ | 35°54′30.232″ | 31.69 | 123.27 | 0.29 | 1990—2000 | 0.09 | 278.53 | |
| 2010 | 100°34′39.637″ | 35°54′22.017″ | 31.85 | 123.64 | 0.29 | 2000—2010 | 0.26 | 175.62 | |
| 2020 | 100°34′45.359″ | 35°54′12.440″ | 32.12 | 123.97 | 0.29 | 2010—2020 | 0.33 | 157.44 | |
| 平均值 | \ | \ | 31.88 | 122.96 | 0.30 | 1980—2020 | 1.83 | 206.56 | |
| E | 1980 | 100°50′44.911″ | 35° 42′18.233″ | 3.03 | 340.10 | 0.08 | \ | \ | \ |
| 1990 | 100°43′43.003″ | 35° 43′10.946″ | 12.39 | 293.52 | 0.31 | 1980—1990 | 10.54 | 281.46 | |
| 2000 | 100°43′29.202″ | 35° 42′56.722″ | 12.56 | 291.06 | 0.32 | 1990—2000 | 0.56 | 219.81 | |
| 2010 | 100°51′44.998″ | 35° 40′47.043″ | 0.34 | 102.14 | 0.01 | 2000—2010 | 12.90 | 110.82 | |
| 2020 | 100°51′45.530″ | 35° 40′47.499″ | 0.35 | 99.46 | 0.01 | 2010—2020 | 0.02 | 44.94 | |
| 平均值 | \ | \ | 5.74 | 225.26 | 0.15 | 1980—2020 | 3.22 | 154.67 | |
表2 1980—2020年各区域沙地重心和沙地重心迁移
Table 2 Sandy land barycenters and migration data from 1980 to 2020
| 区域 | 年份 | 沙地重心 | 迁移距离 /km | 迁移方向 /(°) | 迁移度 | 时段 | 沙地重心移动 | ||
|---|---|---|---|---|---|---|---|---|---|
| 经度(E) | 纬度(N) | 距离/km | 角度/(°) | ||||||
| A | 1980 | 100°35′15.544″ | 35°55′05.621″ | 53.13 | 124.86 | 0.41 | \ | \ | \ |
| 1990 | 100°34′42.110″ | 35°54′29.922″ | 53.05 | 126.36 | 0.38 | 1980—1990 | 1.39 | 218.84 | |
| 2000 | 100°34′38.335″ | 35°54′30.232″ | 52.97 | 126.41 | 0.38 | 1990—2000 | 0.09 | 278.53 | |
| 2010 | 100°34′39.637″ | 35°54′22.017″ | 53.14 | 126.62 | 0.38 | 2000—2010 | 0.26 | 175.62 | |
| 2020 | 100°34′45.359″ | 35°54′12.440″ | 53.42 | 126.80 | 0.38 | 2010—2020 | 0.33 | 157.44 | |
| 平均值 | \ | \ | 53.14 | 126.21 | 0.39 | 1980—2020 | 1.83 | 206.56 | |
| B | 1980 | 100°12′35.614″ | 36° 10′55.253″ | 43.41 | 107.87 | 0.83 | \ | \ | \ |
| 1990 | 100°12′35.617″ | 36° 10′55.250″ | 43.41 | 107.87 | 0.83 | 1980—1990 | 0.00 | 141.59 | |
| 2000 | 100°12′34.797″ | 36° 10′57.503″ | 43.37 | 107.79 | 0.82 | 1990—2000 | 0.07 | 346.89 | |
| 2010 | 100°12′35.358″ | 36° 10′56.791″ | 43.39 | 107.81 | 0.83 | 2000—2010 | 0.03 | 151.22 | |
| 2020 | 100°12′42.548″ | 36° 10′54.671″ | 43.58 | 107.83 | 0.83 | 2010—2020 | 0.19 | 113.44 | |
| 平均值 | \ | \ | 43.43 | 107.83 | 0.83 | 1980—2020 | 0.17 | 98.90 | |
| C | 1980 | 100°25′20.430″ | 36°03′16.092″ | 42.92 | 119.56 | 0.65 | \ | \ | \ |
| 1990 | 100°23′05.287″ | 36°03′44.740″ | 39.56 | 120.58 | 0.60 | 1980—1990 | 3.44 | 287.81 | |
| 2000 | 100°23′00.077″ | 36°03′45.477″ | 39.44 | 120.63 | 0.60 | 1990—2000 | 0.13 | 282.90 | |
| 2010 | 100°22′39.249″ | 36°03′50.351″ | 38.91 | 120.79 | 0.59 | 2000—2010 | 0.53 | 289.15 | |
| 2020 | 100°22′31.685″ | 36°03′46.971″ | 38.80 | 121.06 | 0.59 | 2010—2020 | 0.21 | 243.25 | |
| 平均值 | \ | \ | 39.93 | 120.52 | 0.61 | 1980—2020 | 4.26 | 285.82 | |
| D | 1980 | 100°35′15.544″ | 35°55′05.621″ | 31.94 | 120.72 | 0.32 | \ | \ | \ |
| 1990 | 100°34′42.110″ | 35°54′29.922″ | 31.77 | 123.20 | 0.29 | 1980—1990 | 1.39 | 218.84 | |
| 2000 | 100°34′38.335″ | 35°54′30.232″ | 31.69 | 123.27 | 0.29 | 1990—2000 | 0.09 | 278.53 | |
| 2010 | 100°34′39.637″ | 35°54′22.017″ | 31.85 | 123.64 | 0.29 | 2000—2010 | 0.26 | 175.62 | |
| 2020 | 100°34′45.359″ | 35°54′12.440″ | 32.12 | 123.97 | 0.29 | 2010—2020 | 0.33 | 157.44 | |
| 平均值 | \ | \ | 31.88 | 122.96 | 0.30 | 1980—2020 | 1.83 | 206.56 | |
| E | 1980 | 100°50′44.911″ | 35° 42′18.233″ | 3.03 | 340.10 | 0.08 | \ | \ | \ |
| 1990 | 100°43′43.003″ | 35° 43′10.946″ | 12.39 | 293.52 | 0.31 | 1980—1990 | 10.54 | 281.46 | |
| 2000 | 100°43′29.202″ | 35° 42′56.722″ | 12.56 | 291.06 | 0.32 | 1990—2000 | 0.56 | 219.81 | |
| 2010 | 100°51′44.998″ | 35° 40′47.043″ | 0.34 | 102.14 | 0.01 | 2000—2010 | 12.90 | 110.82 | |
| 2020 | 100°51′45.530″ | 35° 40′47.499″ | 0.35 | 99.46 | 0.01 | 2010—2020 | 0.02 | 44.94 | |
| 平均值 | \ | \ | 5.74 | 225.26 | 0.15 | 1980—2020 | 3.22 | 154.67 | |
| 气象 站 | 平均风速 /(m?s-1) | 最大风速 /(m?s-1) | 起沙风 | ||
|---|---|---|---|---|---|
| 平均风速 /(m?s-1) | 频率 /% | 主风向 /(°) | |||
| 茶卡 | 3.1 | 24 | 9.4 | 16.0 | 270.0 |
| 共和 | 1.7 | 22 | 8.1 | 5.3 | 270.0 |
| 贵南 | 1.8 | 19 | 7.2 | 2.5 | 292.5 |
表3 共和盆地各气象站风速[31]
Table 3 Wind speed data from meteorological stations in Gonghe Basin[31]
| 气象 站 | 平均风速 /(m?s-1) | 最大风速 /(m?s-1) | 起沙风 | ||
|---|---|---|---|---|---|
| 平均风速 /(m?s-1) | 频率 /% | 主风向 /(°) | |||
| 茶卡 | 3.1 | 24 | 9.4 | 16.0 | 270.0 |
| 共和 | 1.7 | 22 | 8.1 | 5.3 | 270.0 |
| 贵南 | 1.8 | 19 | 7.2 | 2.5 | 292.5 |

图5 沙珠玉河流域-龙羊峡西侧流域风沙活动联系
Fig.5 Aeolian-sand relation between the Shazhuyu River Basin & the Western Longyangxia Basin
| 1 | 杨强,李丽,王运动,等.1935-2010年中国人口分布空间格局及其演变特征[J].地理研究,2016,35(8):1547-1560. |
| 2 | 刘涛,齐元静,曹广忠.中国流动人口空间格局演变机制及城镇化效应:基于2000和2010年人口普查分县数据的分析[J].地理学报,2015,70(4):567-581. |
| 3 | Qiao L, Li Y, Liu Y,et al.The spatio‐temporal change of China's net floating population at county scale from 2000 to 2010[J].Asia Pacific Viewpoint,2016,57(3):365-378. |
| 4 | 王思远,张增祥,周全斌,等.近10年中国土地利用格局及其演变[J].地理学报,2002,57(5):523-530. |
| 5 | 刘纪远,刘明亮,庄大方,等.中国近期土地利用变化的空间格局分析[J].中国科学(D辑:地球科学),2002(12):1031-1040,1058-1060. |
| 6 | 朱弘,洪凌涛,任典挺,等.浙江省三门县古树资源特征和空间分布格局分析[J].林业与环境科学,2024,40(4):27-34. |
| 7 | 刘大均,胡静,陈君子,等.中国传统村落的空间分布格局研究[J].中国人口·资源与环境,2014,24(4):157-162. |
| 8 | Chen W, Yang L, Wu J,et al.Spatio‐temporal characteristics and influencing factors of traditional villages in the Yangtze River Basin:a Geodetector model[J].Heritage Science,2023,11(1):111. |
| 9 | Linderson M.Spatial distribution of meso‐scale precipitation in scania,southern sweden[J].Geografiska Annaler:Series A,Physical Geography,2003,85(2):183-196. |
| 10 | Condit R, Ashton P S, Baker P,et al.Spatial patterns in the distribution of tropical tree species[J].Science,2000,288(5470):1414-1418. |
| 11 | 闫海冰,韩有志,杨秀清,等.华北山地典型天然次生林群落的树种空间分布格局及其关联性[J].生态学报,2010,30(9):2311-2321. |
| 12 | 禹朴家,徐海量,乔木,等.玛纳斯河流域土壤类型空间分布格局分析[J].土壤学报,2010,47(6):1050-1059. |
| 13 | Behera S K, Shukla A K.Spatial distribution of surface soil acidity,electrical conductivity,soil organic carbon content and exchangeable potassium,calcium and magnesium in some cropped acid soils of India[J].Land Degradation & Development,2015,26(1):71-79. |
| 14 | Zhu L, Zhang L, Wang J,et al.Combining finite mixture distribution,receptor model,and geostatistical simulation to evaluate heavy metals pollution in soils:source and spatial pattern[J].Land Degradation & Development,2021,32(6):2105-2115. |
| 15 | 徐春霞.末次盛冰期以来共和盆地沙地特征时段空间格局演变研究[D].西宁:青海师范大学,2022. |
| 16 | 冯晗,鹿化煜,弋双文,等.末次盛冰期和全新世大暖期中国季风区西北缘沙漠空间格局重建初探[J].第四纪研究,2013,33(2):252-259. |
| 17 | 赵媛,杨足膺,郝丽莎,等.中国石油资源流动源-汇系统空间格局特征[J].地理学报,2012,67(4):455-466. |
| 18 | 靳诚,陆玉麒.基于县域单元的江苏省经济空间格局演化[J].地理学报,2009,64(6):713-724. |
| 19 | Tobler W R.A computer movie simulating urban growth in the Detroit region[J].Economic Geography,1970,46:234-240. |
| 20 | 董光荣.中国沙漠形成演化气候变化与沙漠化研究[M].北京:海洋出版社,2002. |
| 21 | 徐志伟,鹿化煜.毛乌素沙地风沙环境变化研究的理论和新认识[J].地理学报,2021,76(9):2203-2223. |
| 22 | Abell J T, Pullen A, Lebo Z J,et al.A wind‐albedo‐wind feedback driven by landscape evolution[J].Nature Communications,2020,11(1):96. |
| 23 | 周亚利,鹿化煜,张小艳,等.末次盛冰期和全新世大暖期浑善达克沙地边界的变化[J].第四纪研究,2013,33(2):228-242. |
| 24 | Wang Z.Long‐term dynamics of sandy vegetation and land in North China[J].Remote Sensing,2023,15(19):4803. |
| 25 | Dong X, Chen Z, Wu M,et al.Long time series of remote sensing to monitor the transformation research of Kubuqi Desert in China[J].Earth Science Informatics,2020,13(3):795-809. |
| 26 | 董治宝.青藏高原风沙地貌图集[M].西安:西安地图出版社,2017. |
| 27 | 董光荣,高尚玉,金炯,等.青海共和盆地土地沙漠化与防治途径[M].北京:科学出版社,1993. |
| 28 | 徐叔鹰,徐德馥,石生仁.青海共和盆地的风沙堆积[J].中国沙漠,1982,2(3):5-12. |
| 29 | 徐叔鹰,徐德馥,石生仁.共和盆地地貌发育与环境演化探讨[J].兰州大学学报(自然科学版),1984(1):146-157. |
| 30 | 赵希涛,杨艳,贾丽云,等.论晚期共和古湖时代、演化过程及其与地壳运动和黄河发育的关系[J].地球学报,2021,42(4):451-471. |
| 31 | 陈宗颜,董治宝,汪青春.青海共和盆地风况及风沙地貌[J].中国沙漠,2018,38(3):492-499. |
| 32 | 高尚玉,王贵勇,哈斯,等.末次冰期以来中国季风区西北边缘沙漠演化研究[J].第四纪研究,2001,21(1):66-71. |
| 33 | 刘冰,靳鹤龄,孙忠,等.全新世共和盆地沙地时空演化及其驱动机制[J].中国沙漠,2014,34(4):982-991. |
| 34 | Dörwald L, Lehmkuhl F, Walk J,et al.Dune movement under climatic changes on the north‐eastern Tibetan Plateau as recorded by long‐term satellite observation versus ERA‐5 reanalysis[J].Earth Surface Processes and Landforms,2023,48(13):2613-2629. |
| 35 | 闫蓉,安光辉.共和盆地近60年来气候变化特征分析[J].农业灾害研究,2021,11(1):117-120. |
| 36 | Shao M, Luo W, Che X,et al.UAV‐SfM‐based field quantification of barchan dune celerity and morphodynamics in Gonghe Basin[J].Earth Surface Processes and Landforms,2024,49(8):2380-2404. |
| 37 | 曾永年,冯兆东,曹广超.基于GIS的黄河上游龙羊峡库区生态环境遥感监测研究[J].山地学报,2003(2):140-148. |
| 38 | 王吉玉,张兴鲁.青海省共和盆地的第四纪地层[J].地质论评,1979(2):15-20. |
| 39 | 王劲峰.区域社会-经济空间结构与行为分析的重心方法及实验研究[J].遥感信息,1993(2):11-14. |
| 40 | 高志强,刘纪远,庄大方.我国耕地面积重心及耕地生态背景质量的动态变化[J].自然资源学报,1998(1):92-96. |
| 41 | Riao D, Zhu X, Tong Z,et al.Study on land use/cover change and ecosystem services in Harbin,China[J].Sustainability,2020,12(15):6076. |
| 42 | Janus J.Measuring land fragmentation considering the shape of transportation network:a method to increase the accuracy of modeling the spatial structure of agriculture with case study in Poland[J].Computers and Electronics in Agriculture,2018,148:259-271. |
| 43 | Xie J, Lu Z, Xiao S,et al.The latest desertification process and its driving force in Alxa League from 2000 to 2020[J].Remote Sensing,2023,15(19):4867. |
| 44 | 陈宗颜,董治宝,鄂崇毅,等.1971-2015年共和盆地风况特征及变化趋势[J].兰州大学学报(自然科学版),2020,56(2):224-230. |
| 45 | Luo W, Wang Z, Shao M,et al.Historical evolution and controls on mega‐blowouts in northeastern Qinghai‐Tibetan Plateau,China[J].Geomorphology,2019,329:17-31. |
| 46 | 高宏智,邹桂香.龙羊峡水库周围风沙流的观测、计算及对库区的影响[J].干旱区资源与环境,1989(1):59-69. |
| 47 | Kocurek G, Lancaster N.Aeolian system sediment state:theory and Mojave Desert Kelso dune field example[J].Sedimentology,1999,46(3):505-515. |
| 48 | 董治宝,苏志珠,钱广强,等.库姆塔格沙漠风沙地貌[M].北京:科学出版社,2011. |
| 49 | Jiang Q, Li Z, Hao Q.Modern sand supply of the Tengger Desert and temporal variations in sand provenance driven by northern Hemisphere glaciation[J].Catena,2022,214:106278. |
| 50 | Lancaster N, Baas A.Influence of vegetation cover on sand transport by wind:field studies at Owens Lake,California[J].Earth Surface Processes and Landforms,1998,23(1):69-82. |
| 51 | Kuriyama Y, Mochizuki N, Nakashima T.Influence of vegetation on aeolian sand transport rate from a backshore to a foredune at Hasaki,Japan[J].Sedimentology,2005,52(5):1123-1132. |
| 52 | 苏万峰,汉光昭,叶得力,等.共和盆地生态环境遥感评价及驱动力分析[J].中国沙漠,2023,43(5):74-84. |
| 53 | 邵梅,罗万银,车雪华,等.基于COSI-Corr技术的龙羊峡库区1987-2019年风沙输移特征及潜在入库量估算[J].中国沙漠,2021,41(6):249-261. |
| 54 | Gillette D A, Chen W.Particle production and aeolian transport from a “supply-limited” source area in the Chihuahuan desert,New Mexico,United States[J].Journal of Geophysical Research:Atmospheres,2001,106(D6):5267-5278. |
| 55 | 胡光印,董治宝,杨林海,等.共和盆地土地利用/覆盖变化(LUCC)及其驱动因素[J/OL].地球环境学报,1-20[2024-11-04].. |
| [1] | 贾虹, 刘连友, 刘吉夫. 共和盆地土地荒漠化敏感性评估[J]. 中国沙漠, 2025, 45(1): 1-9. |
| [2] | 谢佳容, 温小浩, 欧先交, 牛东风, 王双双, 邱明昆. 萨拉乌苏河流域现代沙丘沙钾长石单颗粒释光测年[J]. 中国沙漠, 2024, 44(6): 135-145. |
| [3] | 娄俊鹏, 蔡迪文, 马文勇, 焦琳琳. 浑善达克沙地风蚀物粒度和元素分异特征[J]. 中国沙漠, 2024, 44(5): 143-154. |
| [4] | 张晶, 左小安, 吕朋. 生长季降水格局变化对科尔沁沙地典型生境植物群落结构、功能和地上生物量的影响[J]. 中国沙漠, 2024, 44(4): 1-13. |
| [5] | 段翰晨, 黄背英. 基于AHP与改进型MEDALUS模型耦合的科尔沁沙地土地沙漠化敏感性综合评价[J]. 中国沙漠, 2024, 44(4): 137-148. |
| [6] | 王帅, 马登科, 何志斌, 孙玮皓, 杜军, 李睿, 王文, 杨淑萍, 赵书玄. 宁夏河东沙地植被多样性与土壤的关系[J]. 中国沙漠, 2024, 44(4): 202-211. |
| [7] | 卢建男, 李玉强, 赵学勇, 李宝成, 王旭洋, 张蕊. 半干旱区典型沙地生态环境演变特征及沙漠化防治建议[J]. 中国沙漠, 2024, 44(4): 284-292. |
| [8] | 李玉强, 王旭洋, 郑成卓, 连杰, 刘新平, 龚相文, 段育龙, 牟晓明, 王立龙. 科尔沁沙地防沙治沙实践与生态可持续修复浅议[J]. 中国沙漠, 2024, 44(4): 302-314. |
| [9] | 向宇, 李玉强, 郑成卓, 袁梦琪, 刘伟媛. 生物炭在沙质土壤修复中的应用研究进展[J]. 中国沙漠, 2024, 44(4): 315-326. |
| [10] | 刘二燕, 赵媛媛, 周蝶, 武海岩, 高广磊, 丁国栋. 科尔沁-浑善达克沙地2000—2020年土地沙化时空变化格局[J]. 中国沙漠, 2024, 44(4): 46-56. |
| [11] | 花丛, 曹云, 王继康, 徐冉. 2000—2023年浑善达克沙地春季沙尘天气分布特征及其与植被盖度、风况的关系[J]. 中国沙漠, 2024, 44(4): 71-80. |
| [12] | 韩晓雨, 迟云平, 谢远云, 康春国, 吴鹏, 汪烨辉, 孙磊, 魏振宇. 科尔沁沙地风成细沙的物质组成特征及其对物源的指示[J]. 中国沙漠, 2024, 44(3): 231-246. |
| [13] | 王佳琪, 李小妹, 刘小槺, 董苗. 毛乌素沙地无定河上游河岸沙丘地貌格局及风水交互作用[J]. 中国沙漠, 2024, 44(3): 31-41. |
| [14] | 蔡明玉, 贾飚, 常学礼. 景观格局因子交互作用对科尔沁沙地沙漠化的影响[J]. 中国沙漠, 2024, 44(2): 99-108. |
| [15] | 冯佳新, 吴月茹, 乔硕, 刘茜雅, 王海兵. 毛乌素沙地沙漠化逆转过程中土壤组分及微量元素含量变化特征[J]. 中国沙漠, 2024, 44(1): 218-227. |
| 阅读次数 | ||||||
|
全文 |
|
|||||
|
摘要 |
|
|||||
©2018中国沙漠 编辑部
地址: 兰州市天水中路8号 (730000)
电话:0931-8267545
Email:caiedit@lzb.ac.cn;desert@lzb.ac.cn

 甘公网安备 62010202000688号