
- CN 62-1070/P
- ISSN 1000-694X
- Bimonthly 1981
Journal of Desert Research ›› 2025, Vol. 45 ›› Issue (1): 266-276.DOI: 10.7522/j.issn.1000-694X.2024.00180
Li Li1( ), Shun Xiao1(), Zhibao Dong1, Ping Lv1, Na Wang2, Jiayin Zhang3, Jing Han4, Zhuangzhuang Zhang5, Na Mi5, Suixin Liu6, Jianbao Liu7
Received:2024-11-08
Revised:2024-12-11
Online:2025-01-20
Published:2025-01-13
Contact:
Shun Xiao
CLC Number:
Li Li, Shun Xiao, Zhibao Dong, Ping Lv, Na Wang, Jiayin Zhang, Jing Han, Zhuangzhuang Zhang, Na Mi, Suixin Liu, Jianbao Liu. Influence and source analysis of Spring dust storm on ambient air quality in Xi'an, China[J]. Journal of Desert Research, 2025, 45(1): 266-276.
Add to citation manager EndNote|Ris|BibTeX
URL: http://www.desert.ac.cn/EN/10.7522/j.issn.1000-694X.2024.00180
| 沙尘时次 | 开始时间 | 结束时间 | 影响时长/h | PM10峰值/(μg·m-3) | 沙尘级别 |
|---|---|---|---|---|---|
| 3月11日 | 3月11日10:00 | 3月11日18:00 | 8 | 563 | 浮尘 |
| 3月12—14日 | 3月12日05:00 | 3月14日14:00 | 57 | 247 | 浮尘 |
| 3月14—15日 | 3月14日23:00 | 3月15日03:00 | 4 | 260 | 浮尘 |
| 3月22日 | 3月22日01:00 | 3月22日23:00 | 2 | 263 | 浮尘 |
| 3月23—25日 | 3月23日17:00 | 3月25日14:00 | 45 | 372 | 浮尘 |
| 4月5—9日 | 4月5日17:00 | 4月9日14:00 | 93 | 449 | 浮尘 |
| 4月10—14日 | 4月10日22:00 | 4月14日05:00 | 79 | 709 | 浮尘 |
| 4月20—21日 | 4月20日02:00 | 4月21日06:00 | 28 | 1 769 | 扬沙 |
| 4月28—29日 | 4月28日12:00 | 4月29日19:00 | 31 | 879 | 浮尘 |
Table 1 Identification results of dust weather process in Xi'an in Spring of 2023
| 沙尘时次 | 开始时间 | 结束时间 | 影响时长/h | PM10峰值/(μg·m-3) | 沙尘级别 |
|---|---|---|---|---|---|
| 3月11日 | 3月11日10:00 | 3月11日18:00 | 8 | 563 | 浮尘 |
| 3月12—14日 | 3月12日05:00 | 3月14日14:00 | 57 | 247 | 浮尘 |
| 3月14—15日 | 3月14日23:00 | 3月15日03:00 | 4 | 260 | 浮尘 |
| 3月22日 | 3月22日01:00 | 3月22日23:00 | 2 | 263 | 浮尘 |
| 3月23—25日 | 3月23日17:00 | 3月25日14:00 | 45 | 372 | 浮尘 |
| 4月5—9日 | 4月5日17:00 | 4月9日14:00 | 93 | 449 | 浮尘 |
| 4月10—14日 | 4月10日22:00 | 4月14日05:00 | 79 | 709 | 浮尘 |
| 4月20—21日 | 4月20日02:00 | 4月21日06:00 | 28 | 1 769 | 扬沙 |
| 4月28—29日 | 4月28日12:00 | 4月29日19:00 | 31 | 879 | 浮尘 |
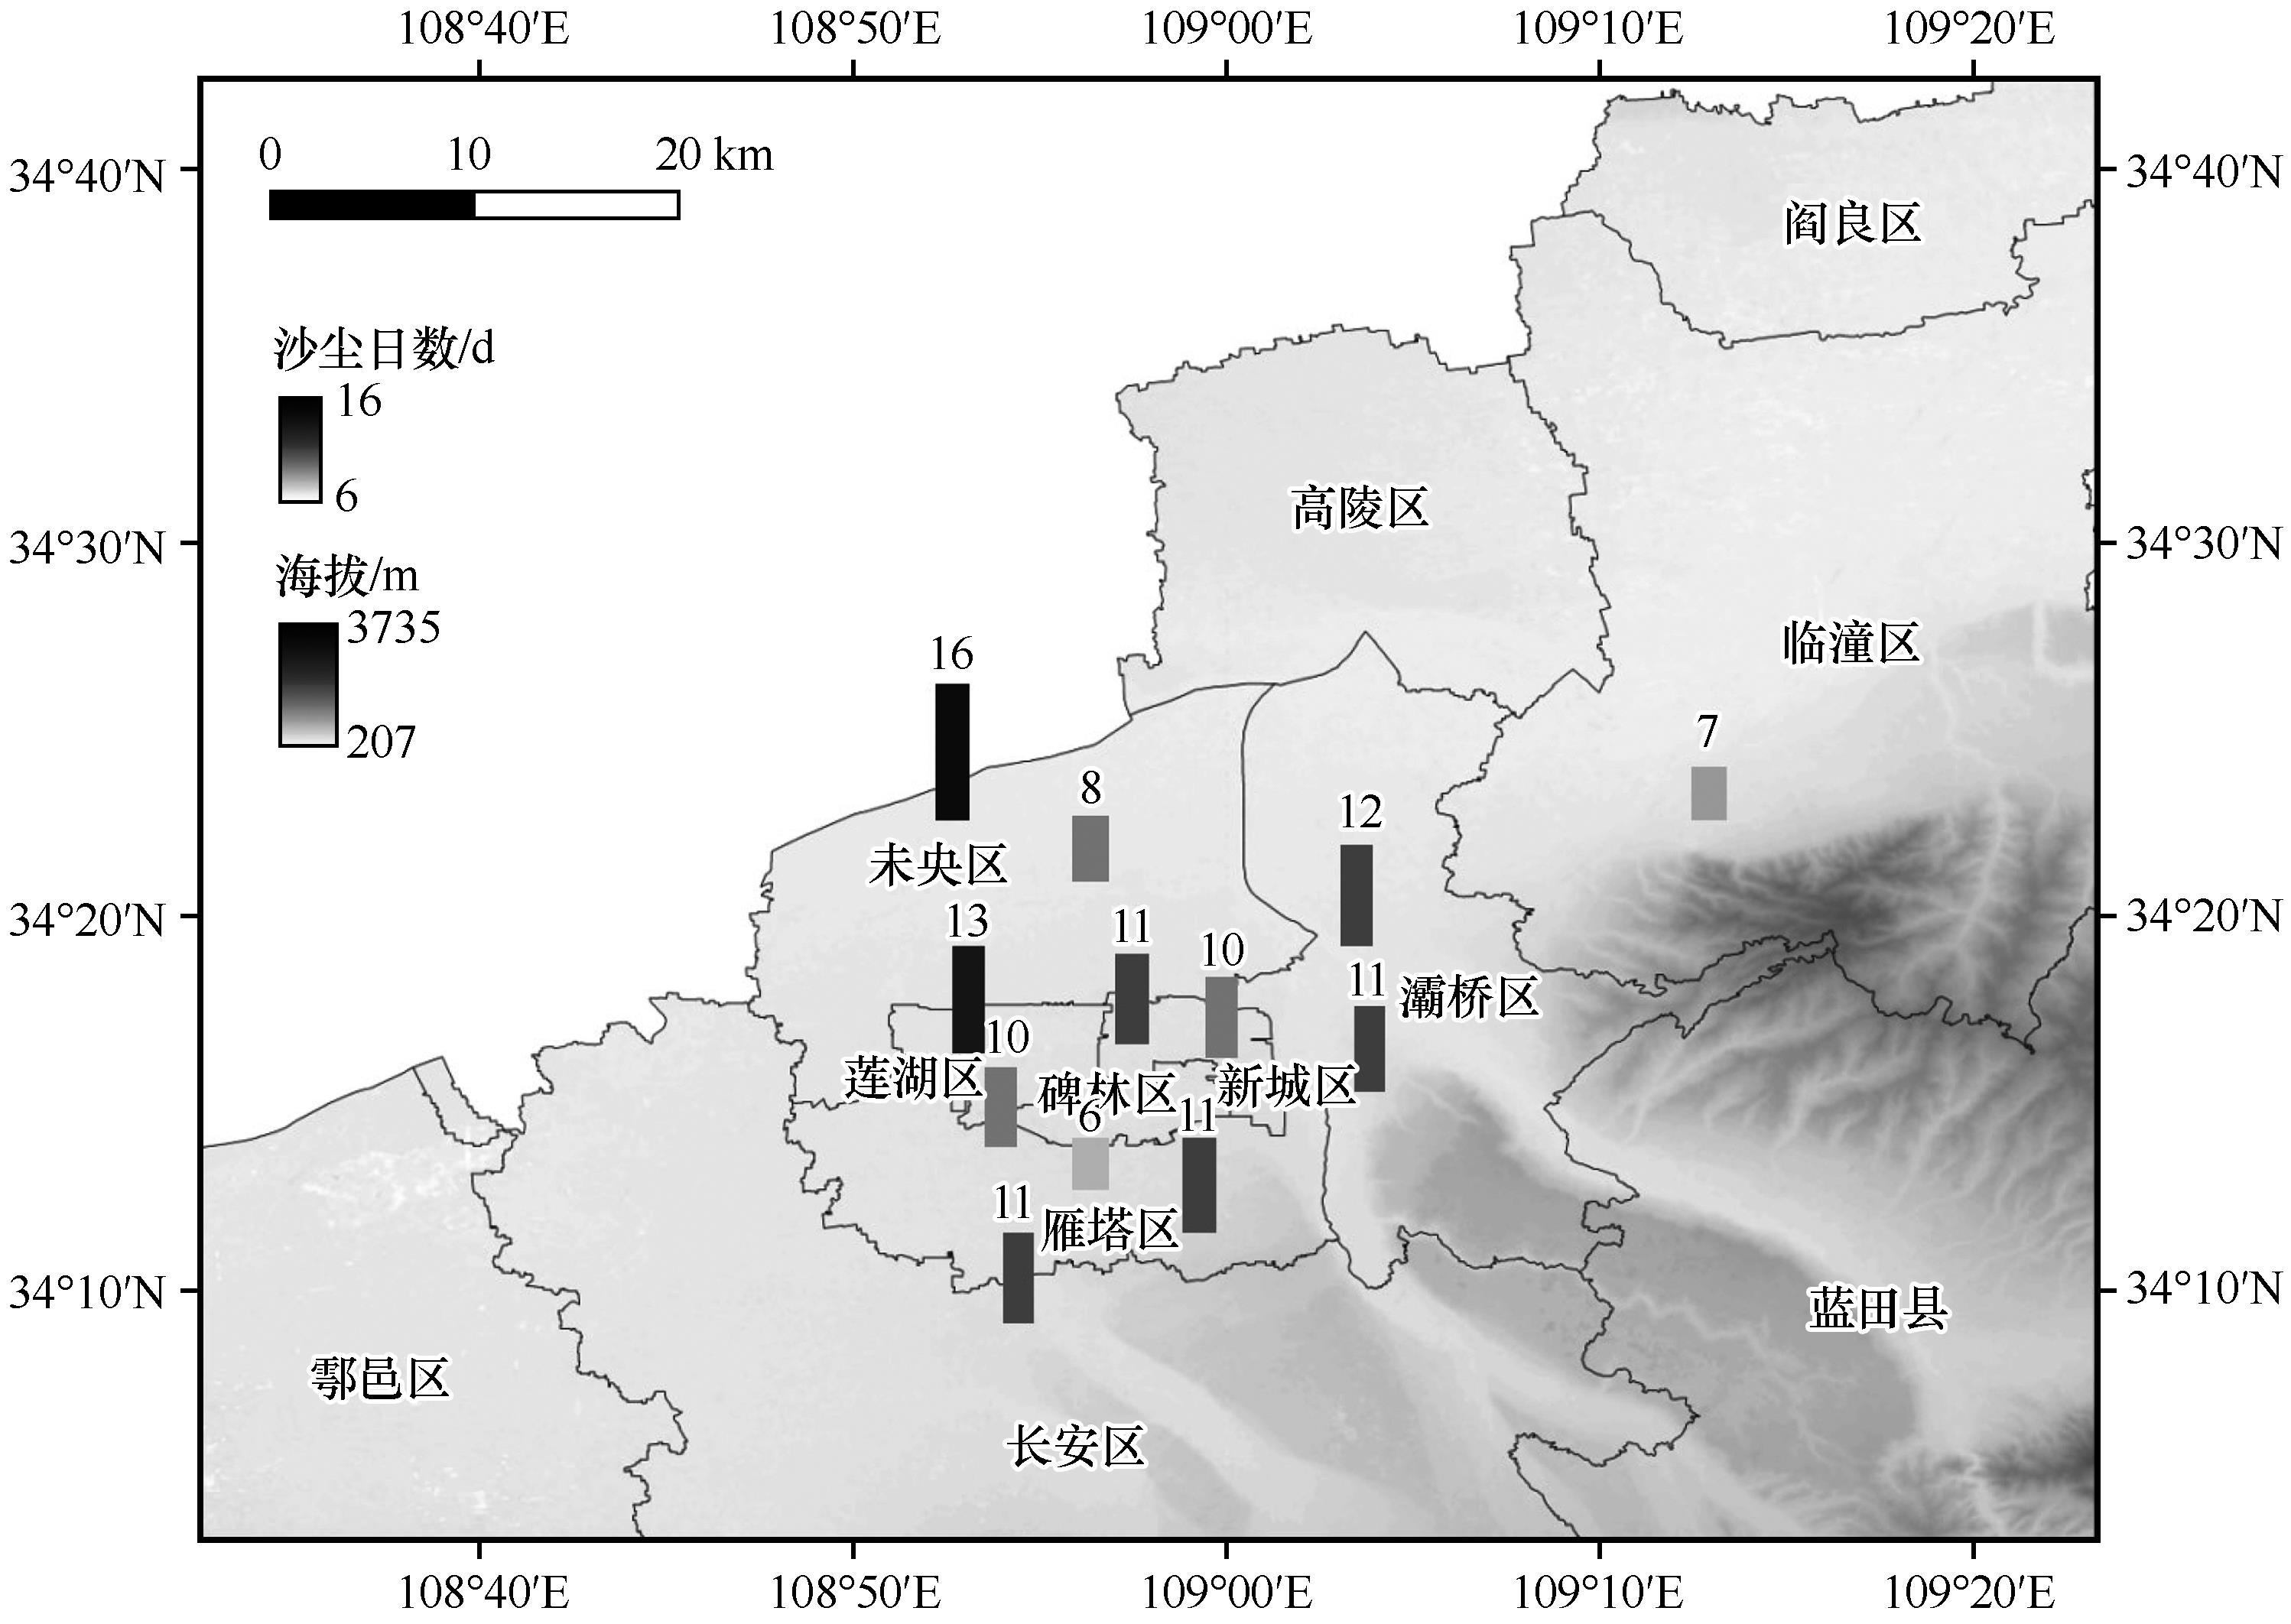
Fig.1 The number of days with sand and dust occurrence at each station in Xi'an in Spring of 2023
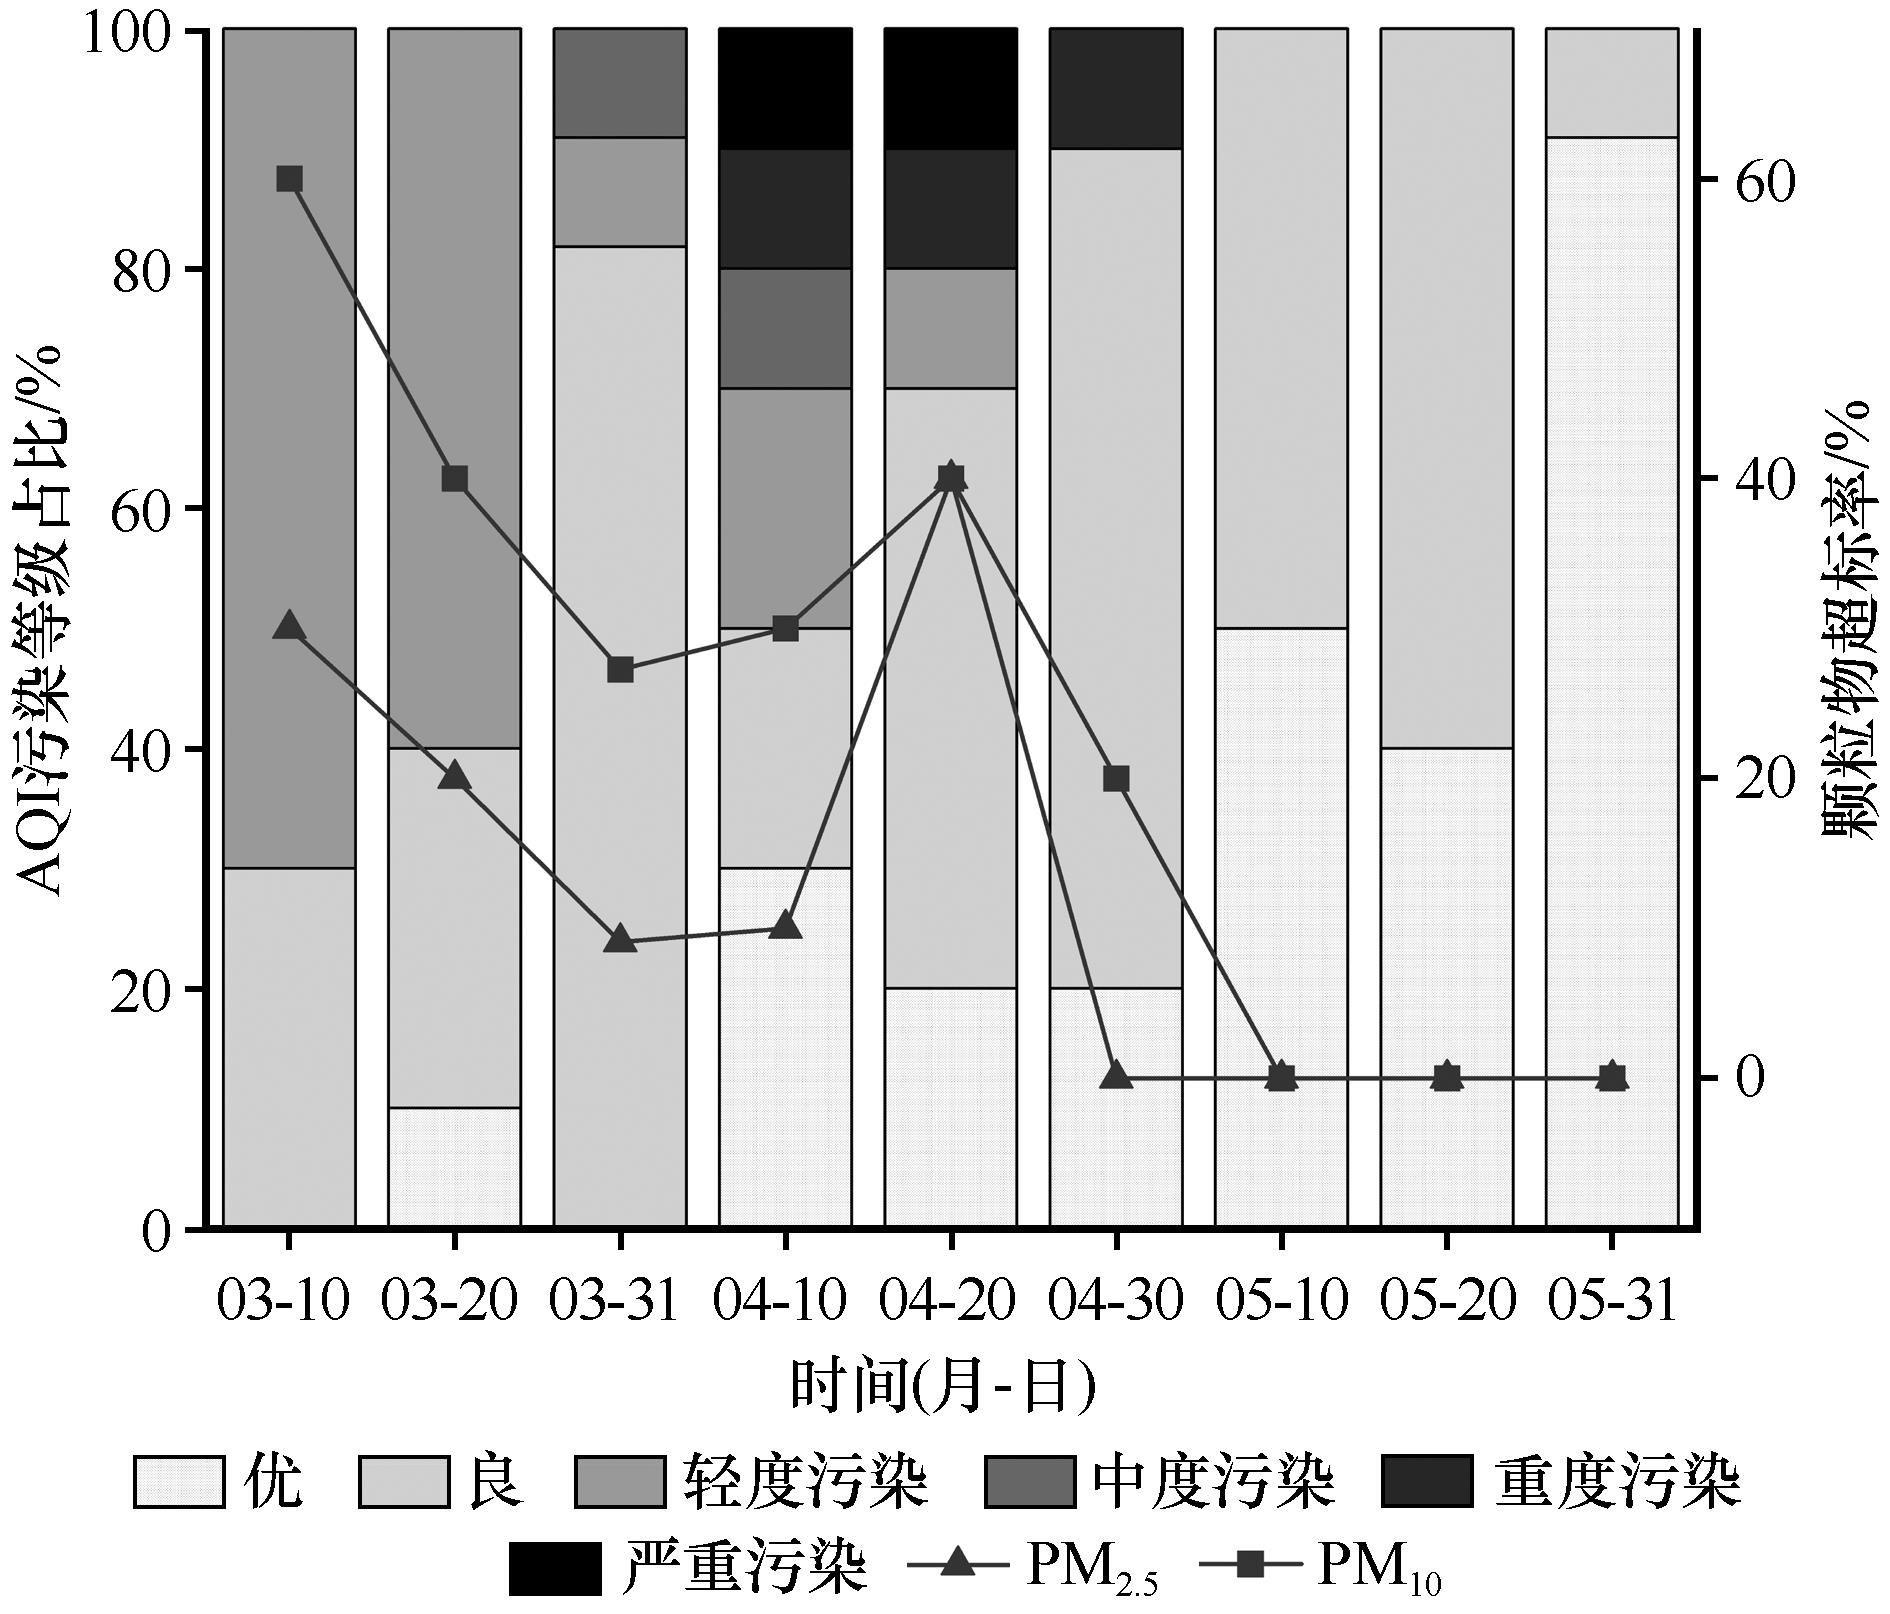
Fig.2 The pollution level of AQI in Xi'an in Spring of 2023
| 指标 | 监测站点 | 日 均 值 | ||||||||||||
|---|---|---|---|---|---|---|---|---|---|---|---|---|---|---|
高压 开关厂 | 兴庆 小区 | 纺织城 | 小寨 | 市体育场 | 高新西区 | 经开区 | 长安区 | 临潼区 | 草滩 | 曲江集团 | 广运潭 | |||
PM10浓度 /(μg·m-3) | 沙尘期 | 255 | 233 | 241 | 223 | 249 | 231 | 243 | 253 | 230 | 224 | 252 | 241 | 240 |
| 非沙尘期 | 87 | 69 | 80 | 75 | 75 | 74 | 76 | 81 | 73 | 80 | 79 | 74 | 77 | |
| 沙尘期高于非沙尘期/% | 193 | 237 | 202 | 196 | 231 | 212 | 218 | 212 | 218 | 181 | 217 | 225 | 211 | |
Table 2 Comparison of PM10 concentration between dust and non-dust storm periods in Xi'an in Spring of 2023
| 指标 | 监测站点 | 日 均 值 | ||||||||||||
|---|---|---|---|---|---|---|---|---|---|---|---|---|---|---|
高压 开关厂 | 兴庆 小区 | 纺织城 | 小寨 | 市体育场 | 高新西区 | 经开区 | 长安区 | 临潼区 | 草滩 | 曲江集团 | 广运潭 | |||
PM10浓度 /(μg·m-3) | 沙尘期 | 255 | 233 | 241 | 223 | 249 | 231 | 243 | 253 | 230 | 224 | 252 | 241 | 240 |
| 非沙尘期 | 87 | 69 | 80 | 75 | 75 | 74 | 76 | 81 | 73 | 80 | 79 | 74 | 77 | |
| 沙尘期高于非沙尘期/% | 193 | 237 | 202 | 196 | 231 | 212 | 218 | 212 | 218 | 181 | 217 | 225 | 211 | |
| 指标 | 监测站点 | 日 均 值 | ||||||||||||
|---|---|---|---|---|---|---|---|---|---|---|---|---|---|---|
高压 开关厂 | 兴庆 小区 | 纺织城 | 小寨 | 市体育场 | 高新西区 | 经开区 | 长安区 | 临潼区 | 草滩 | 曲江集团 | 广运潭 | |||
PM2.5浓度 /(μg·m-3) | 沙尘期 | 68 | 66 | 63 | 69 | 68 | 68 | 73 | 64 | 75 | 51 | 65 | 65 | 66 |
| 非沙尘期 | 40 | 32 | 35 | 33 | 37 | 38 | 37 | 35 | 34 | 31 | 34 | 35 | 35 | |
| 沙尘期高于非沙尘期/% | 72 | 105 | 79 | 110 | 85 | 79 | 95 | 85 | 119 | 63 | 91 | 87 | 89 | |
Table 3 Comparison of PM2.5 concentration between dust and non-dust storm periods in Xi'an in Spring of 2023
| 指标 | 监测站点 | 日 均 值 | ||||||||||||
|---|---|---|---|---|---|---|---|---|---|---|---|---|---|---|
高压 开关厂 | 兴庆 小区 | 纺织城 | 小寨 | 市体育场 | 高新西区 | 经开区 | 长安区 | 临潼区 | 草滩 | 曲江集团 | 广运潭 | |||
PM2.5浓度 /(μg·m-3) | 沙尘期 | 68 | 66 | 63 | 69 | 68 | 68 | 73 | 64 | 75 | 51 | 65 | 65 | 66 |
| 非沙尘期 | 40 | 32 | 35 | 33 | 37 | 38 | 37 | 35 | 34 | 31 | 34 | 35 | 35 | |
| 沙尘期高于非沙尘期/% | 72 | 105 | 79 | 110 | 85 | 79 | 95 | 85 | 119 | 63 | 91 | 87 | 89 | |
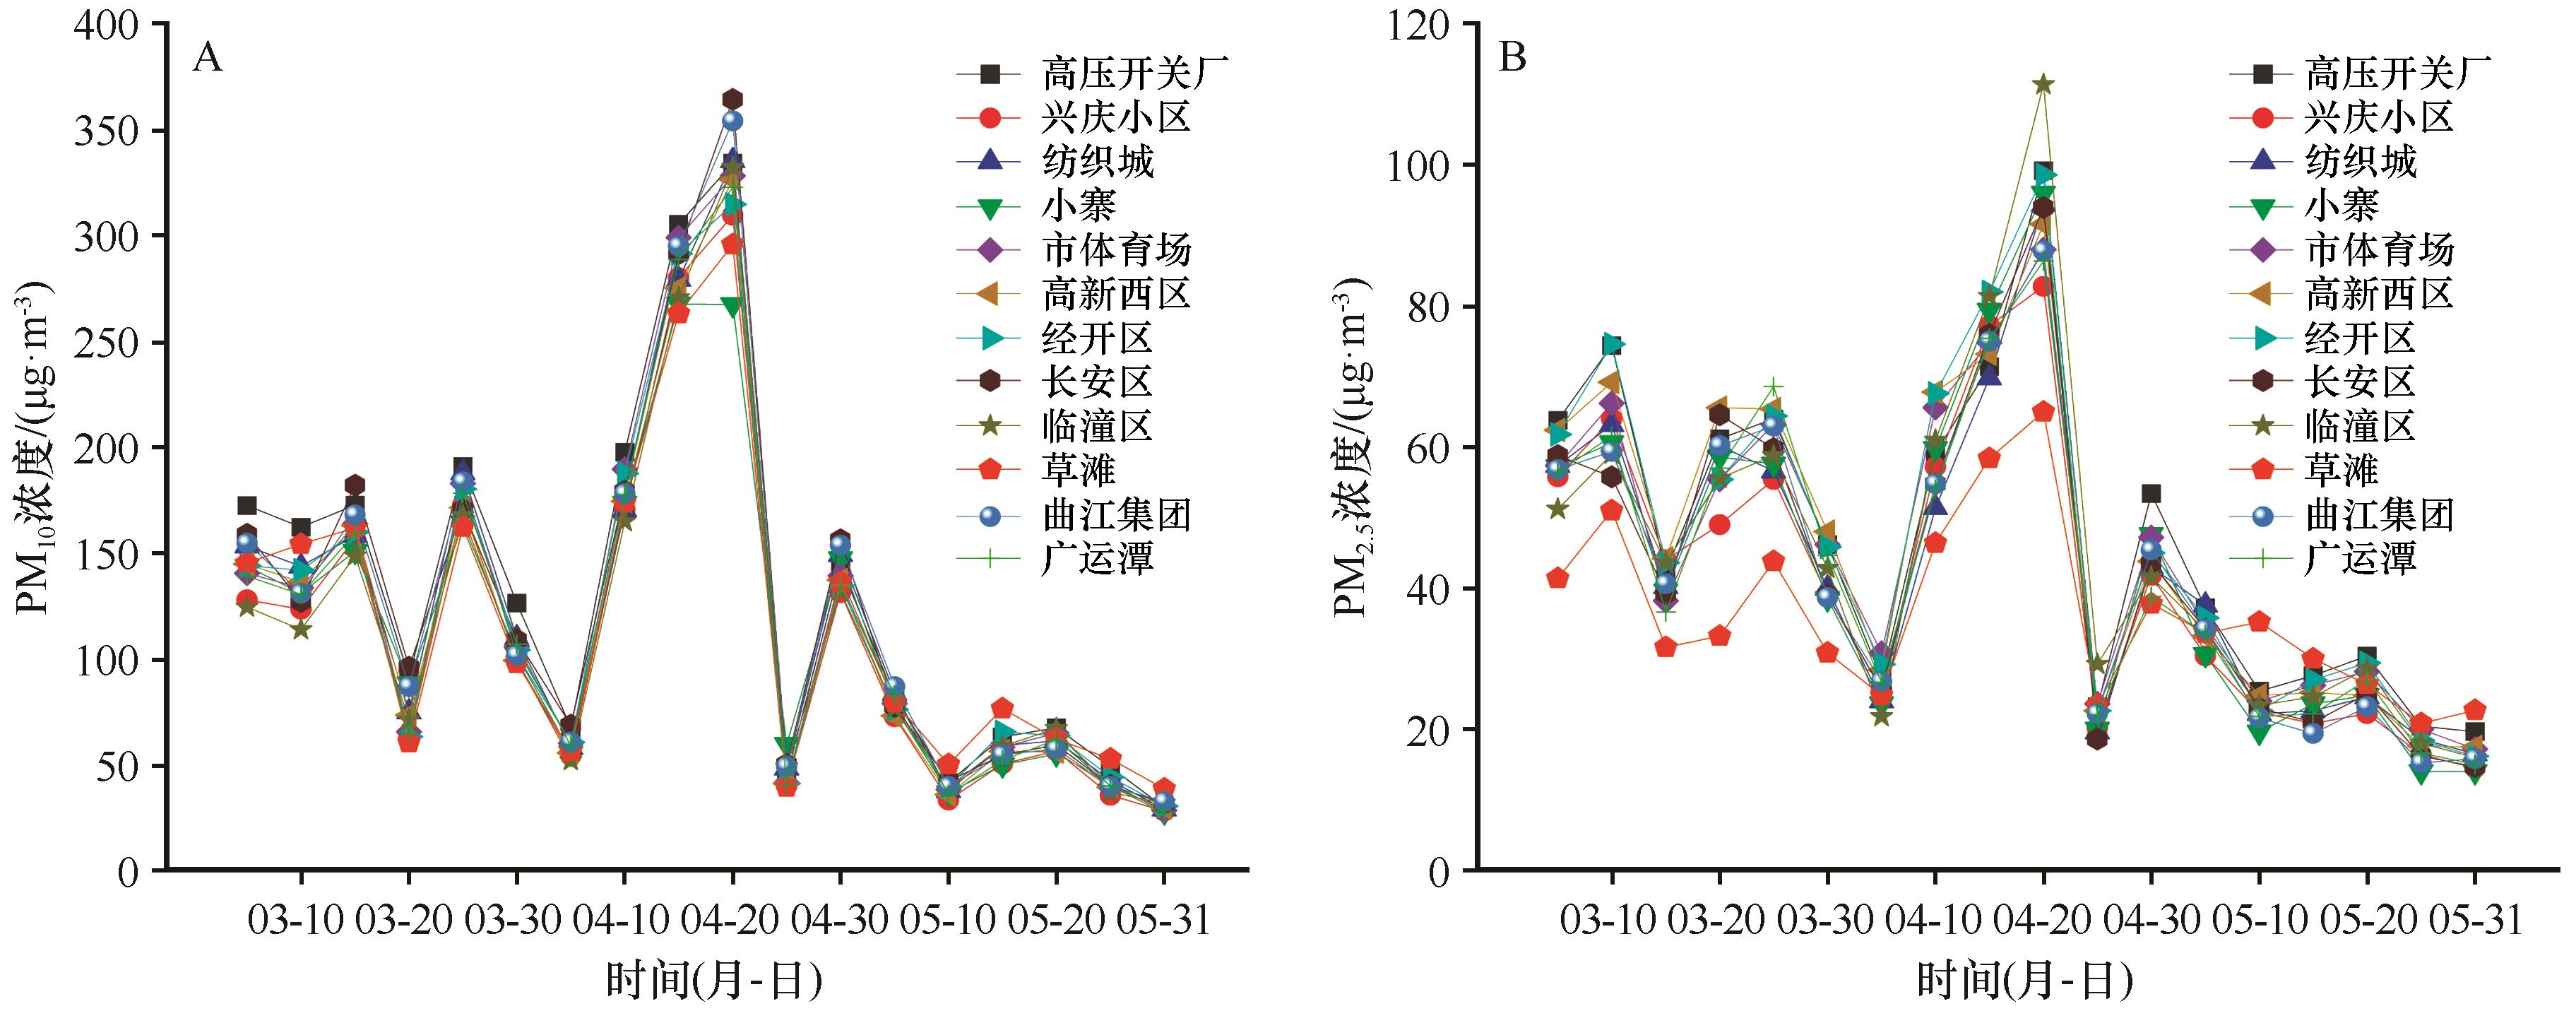
Fig.3 Variation of 5 d average PM2.5 andPM10 concentration at each station in Xi'an in Spring of 2023
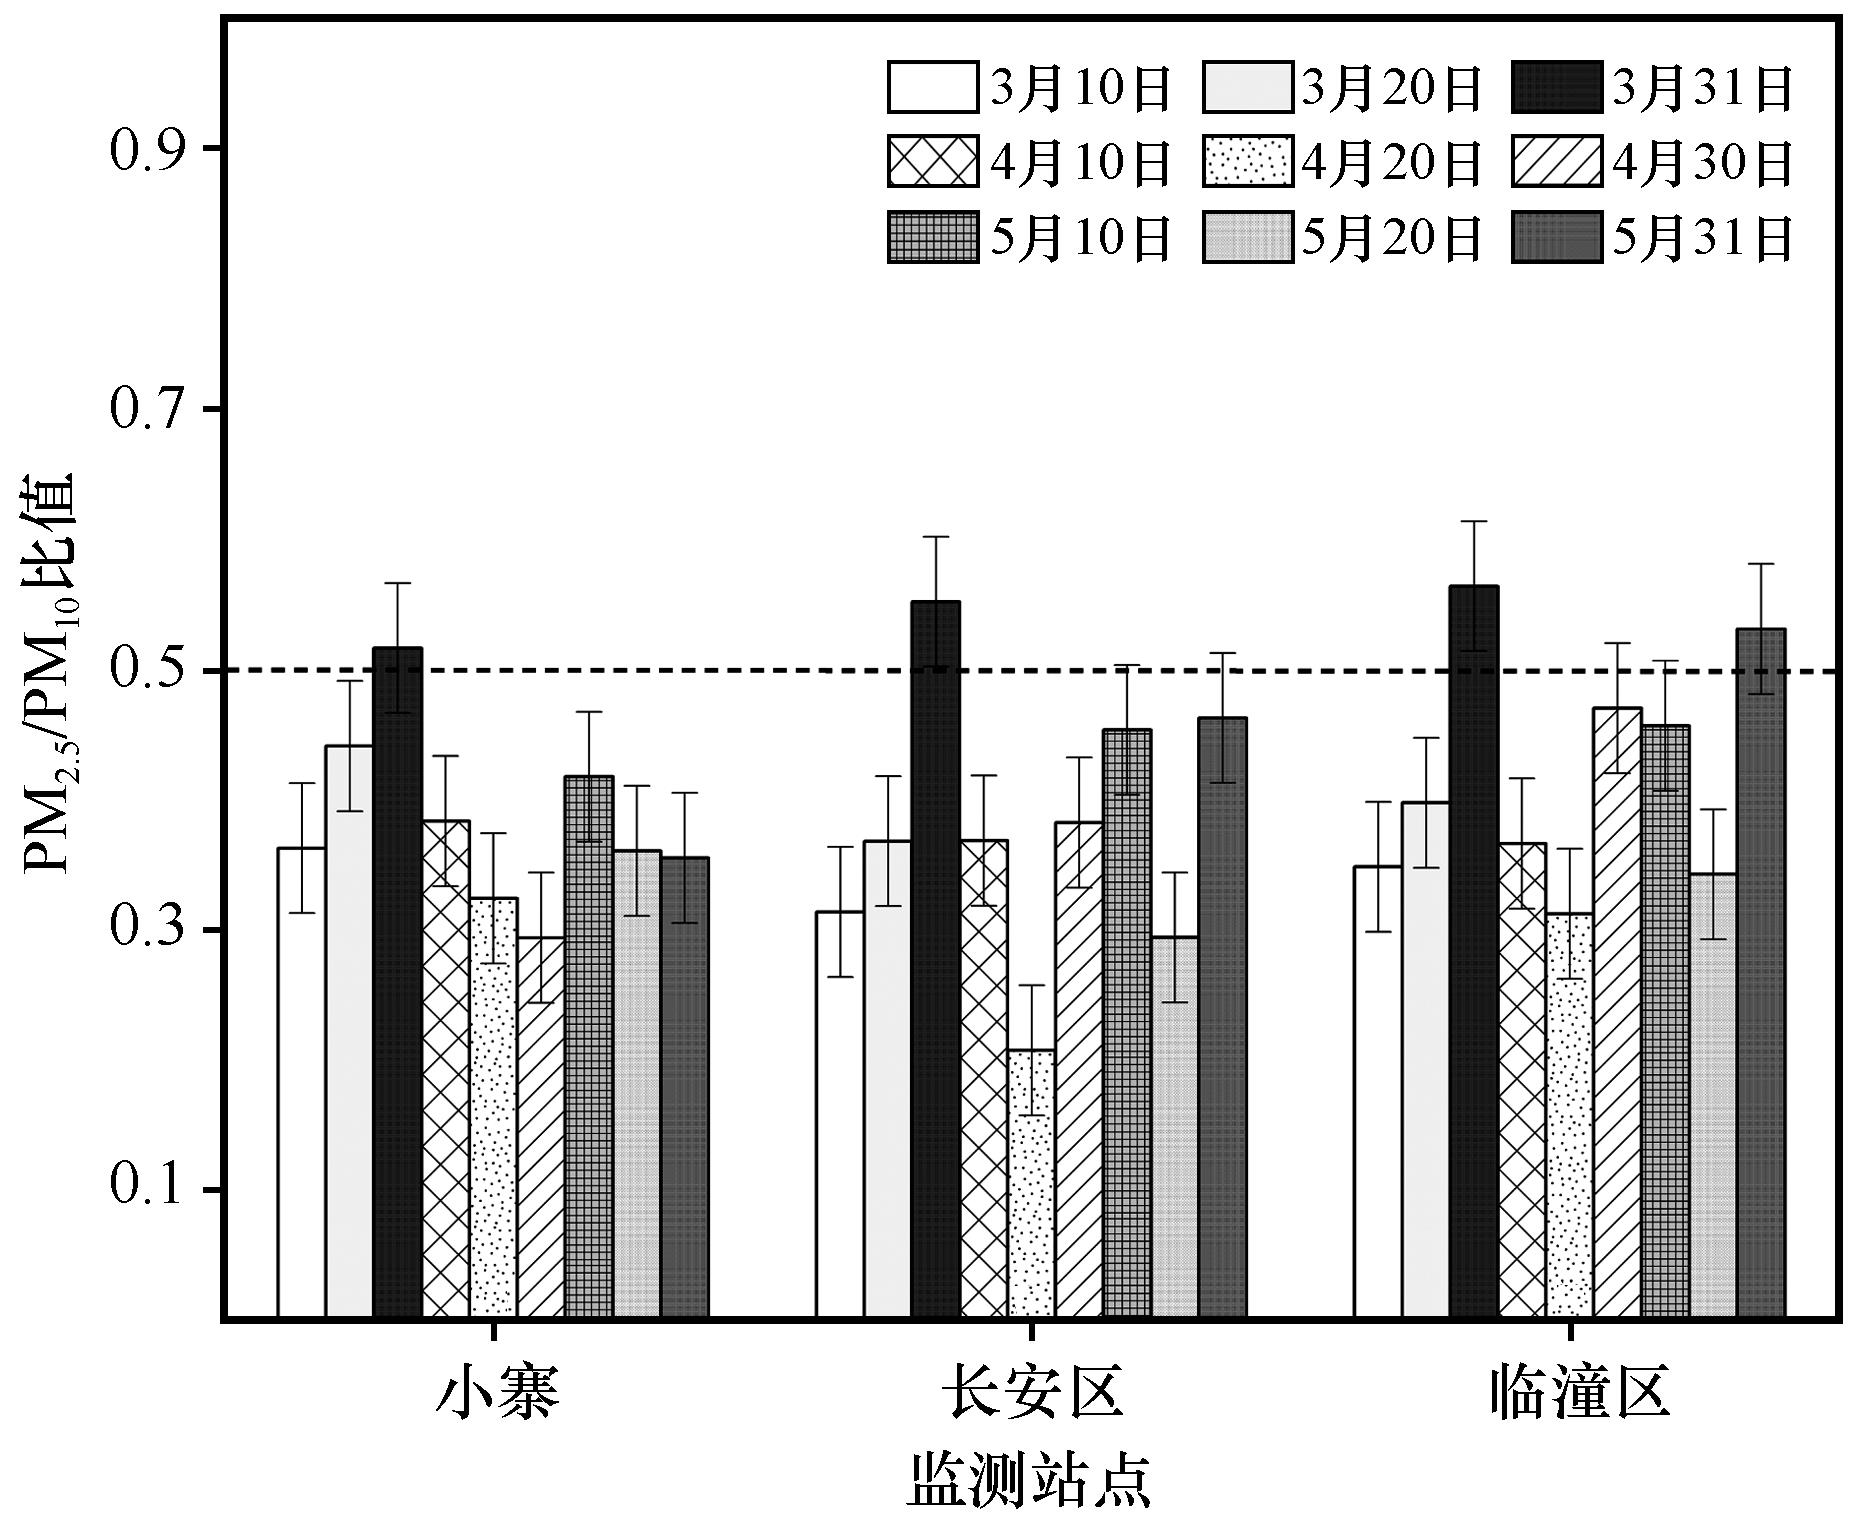
Fig.4 PM2.5/PM10 ratio of Xiaozhai, Chang'an and Lintong in different periods in Spring of 2023
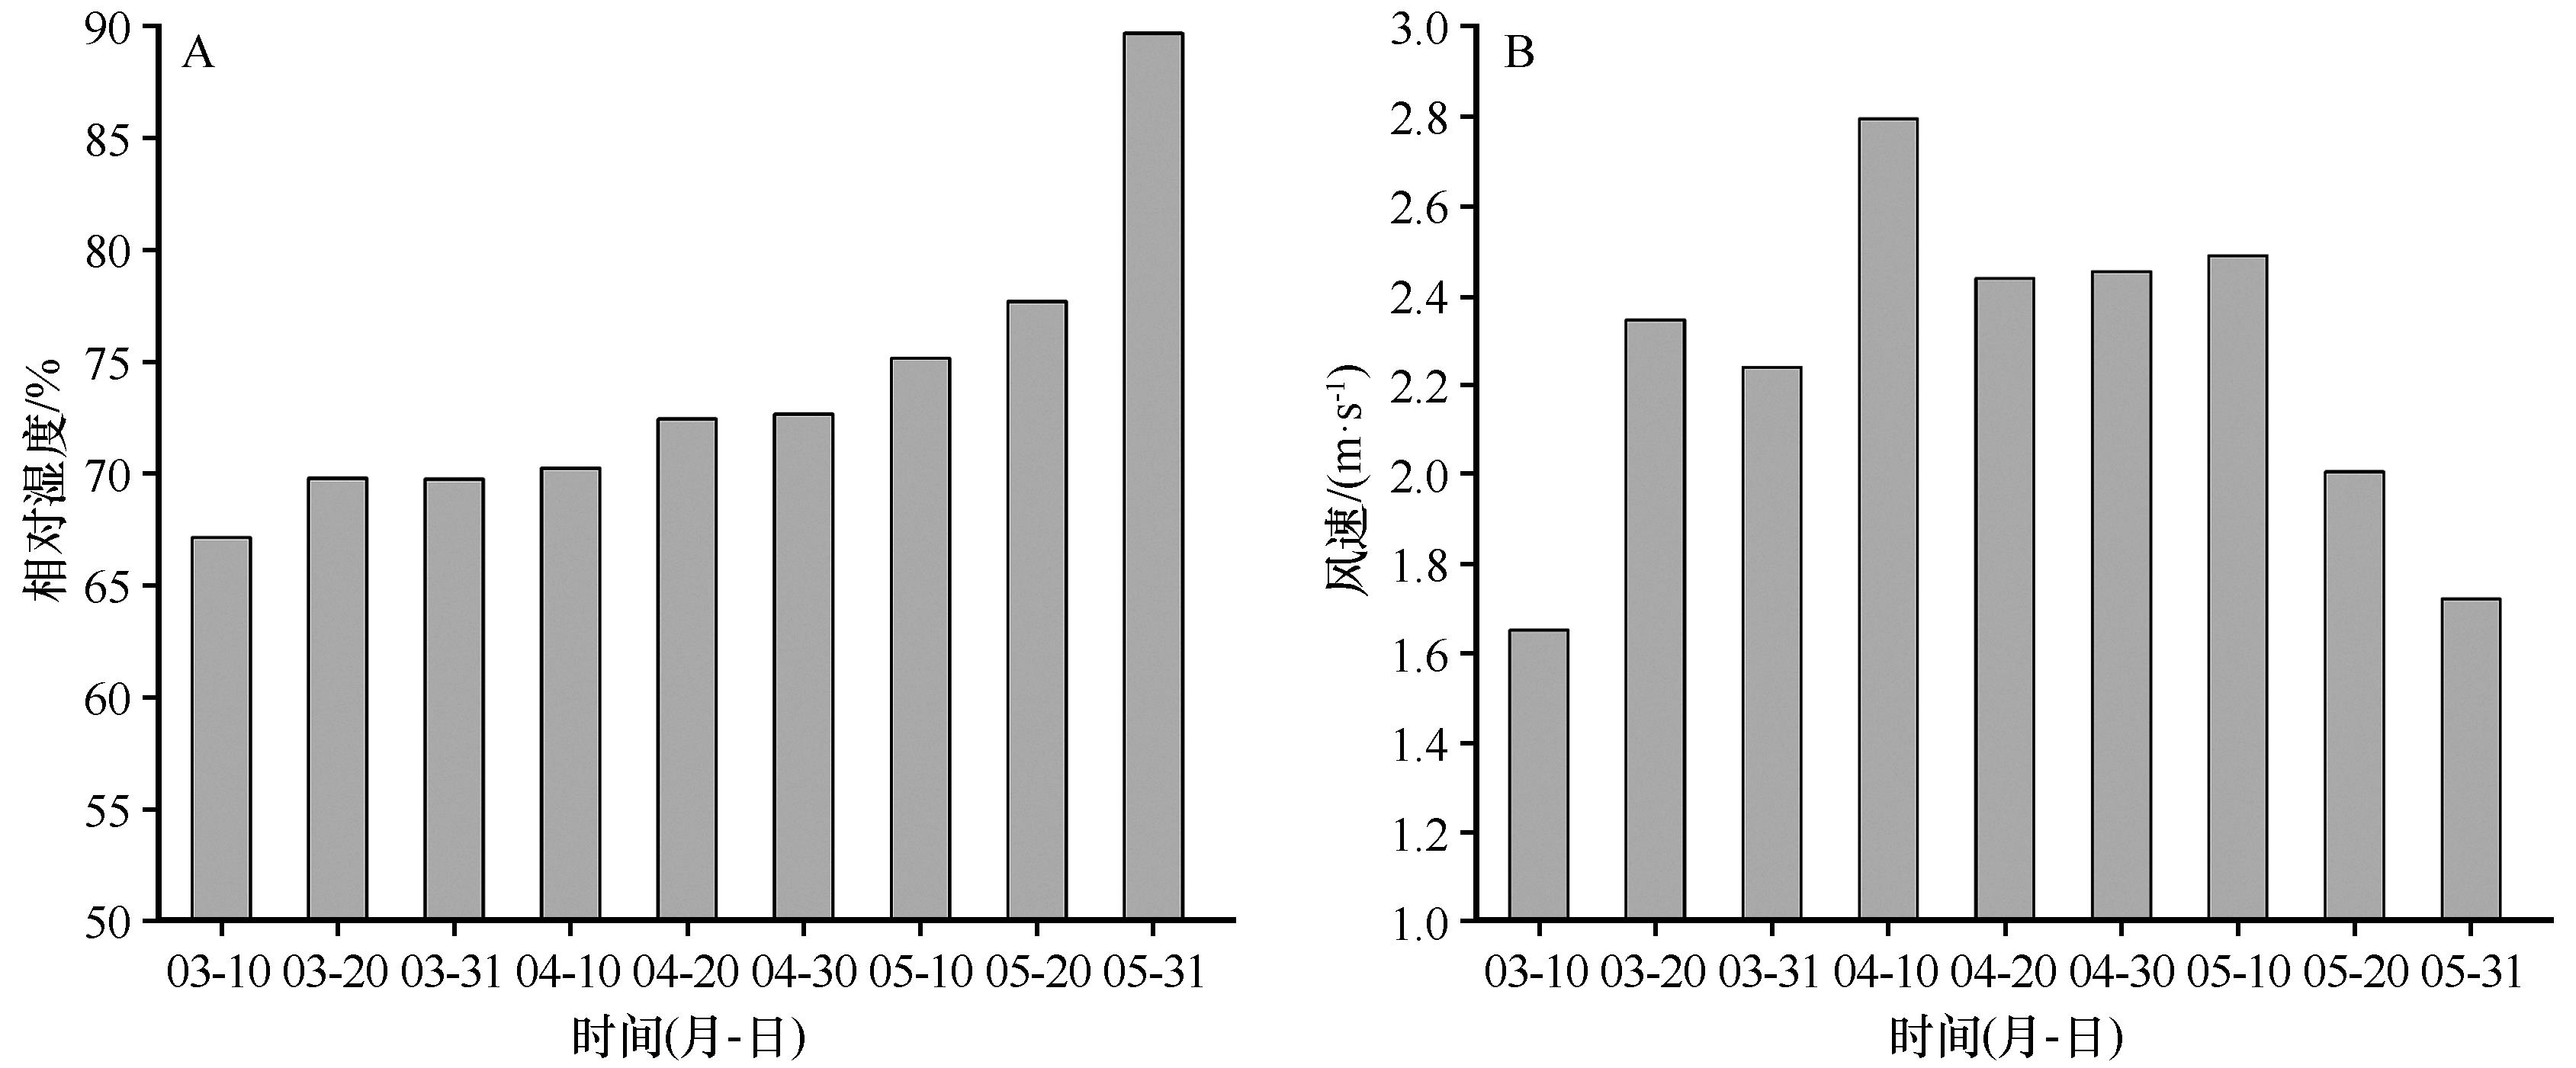
Fig.5 Changes of average wind speed and relative humidity in Xi'an in Spring of 2023
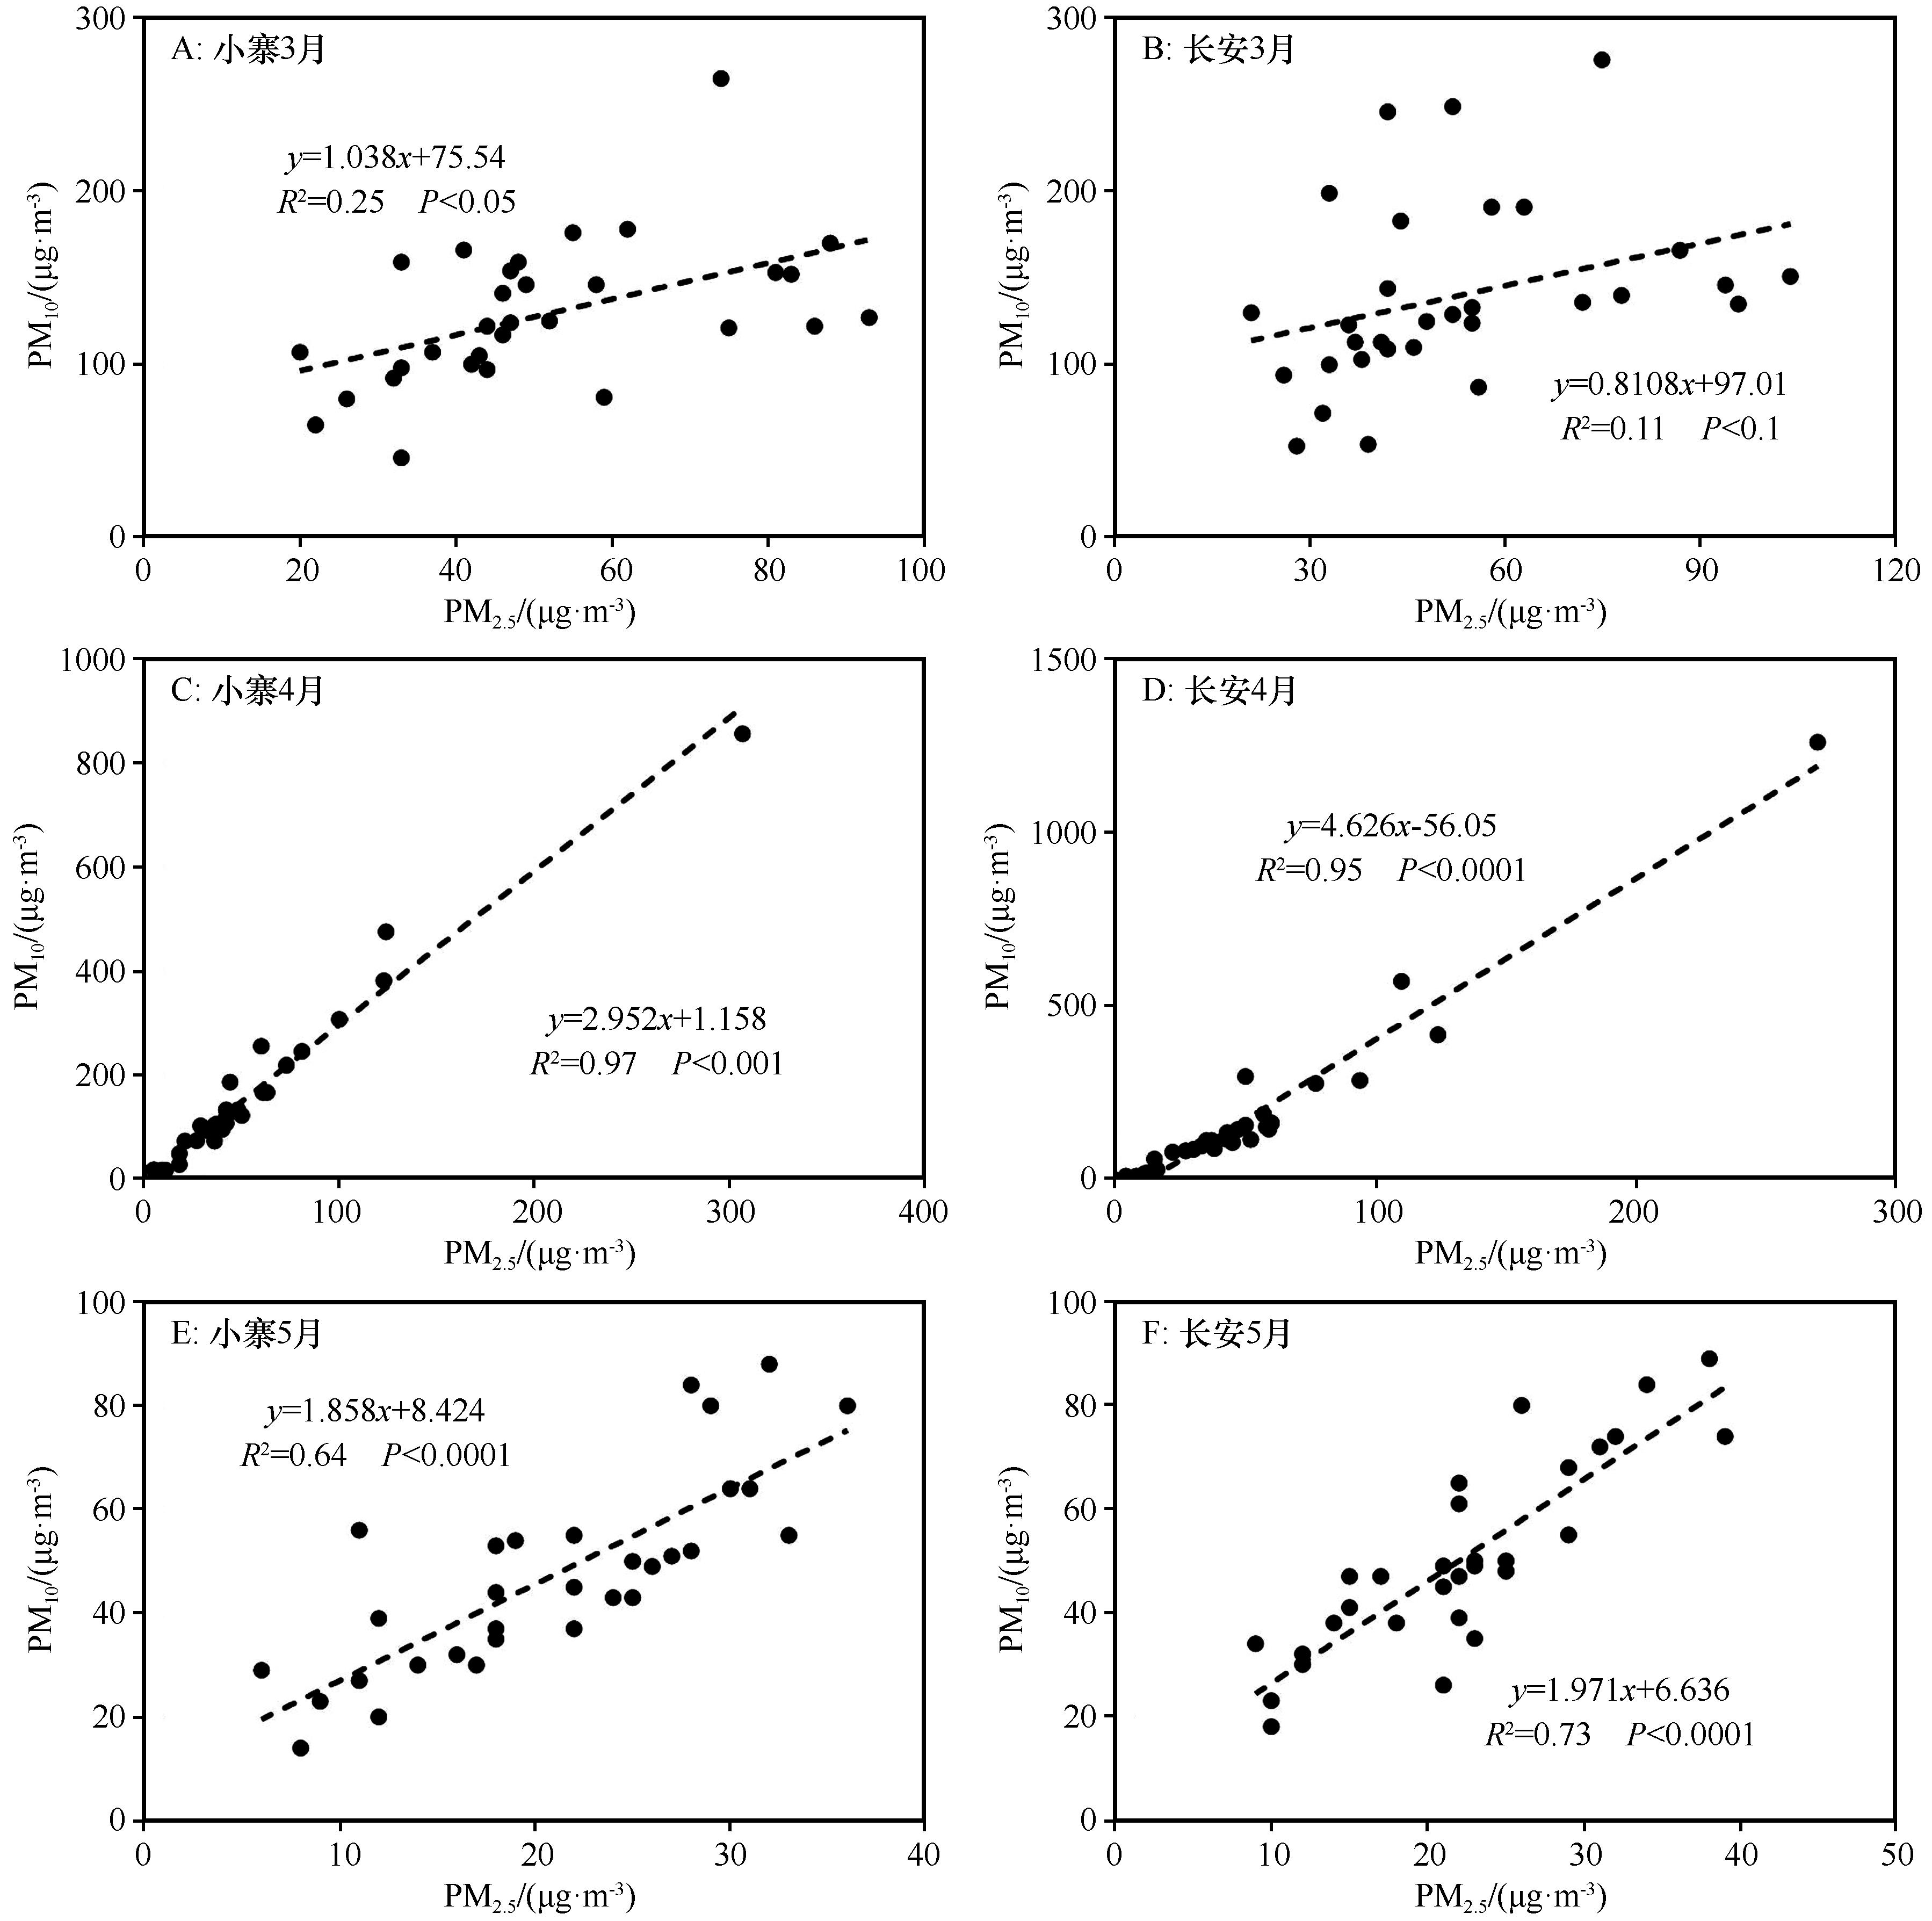
Fig.6 Correlation of PM10 and PM2.5 in Xiaozhai and Chang'an District in different months of Spring of 2023
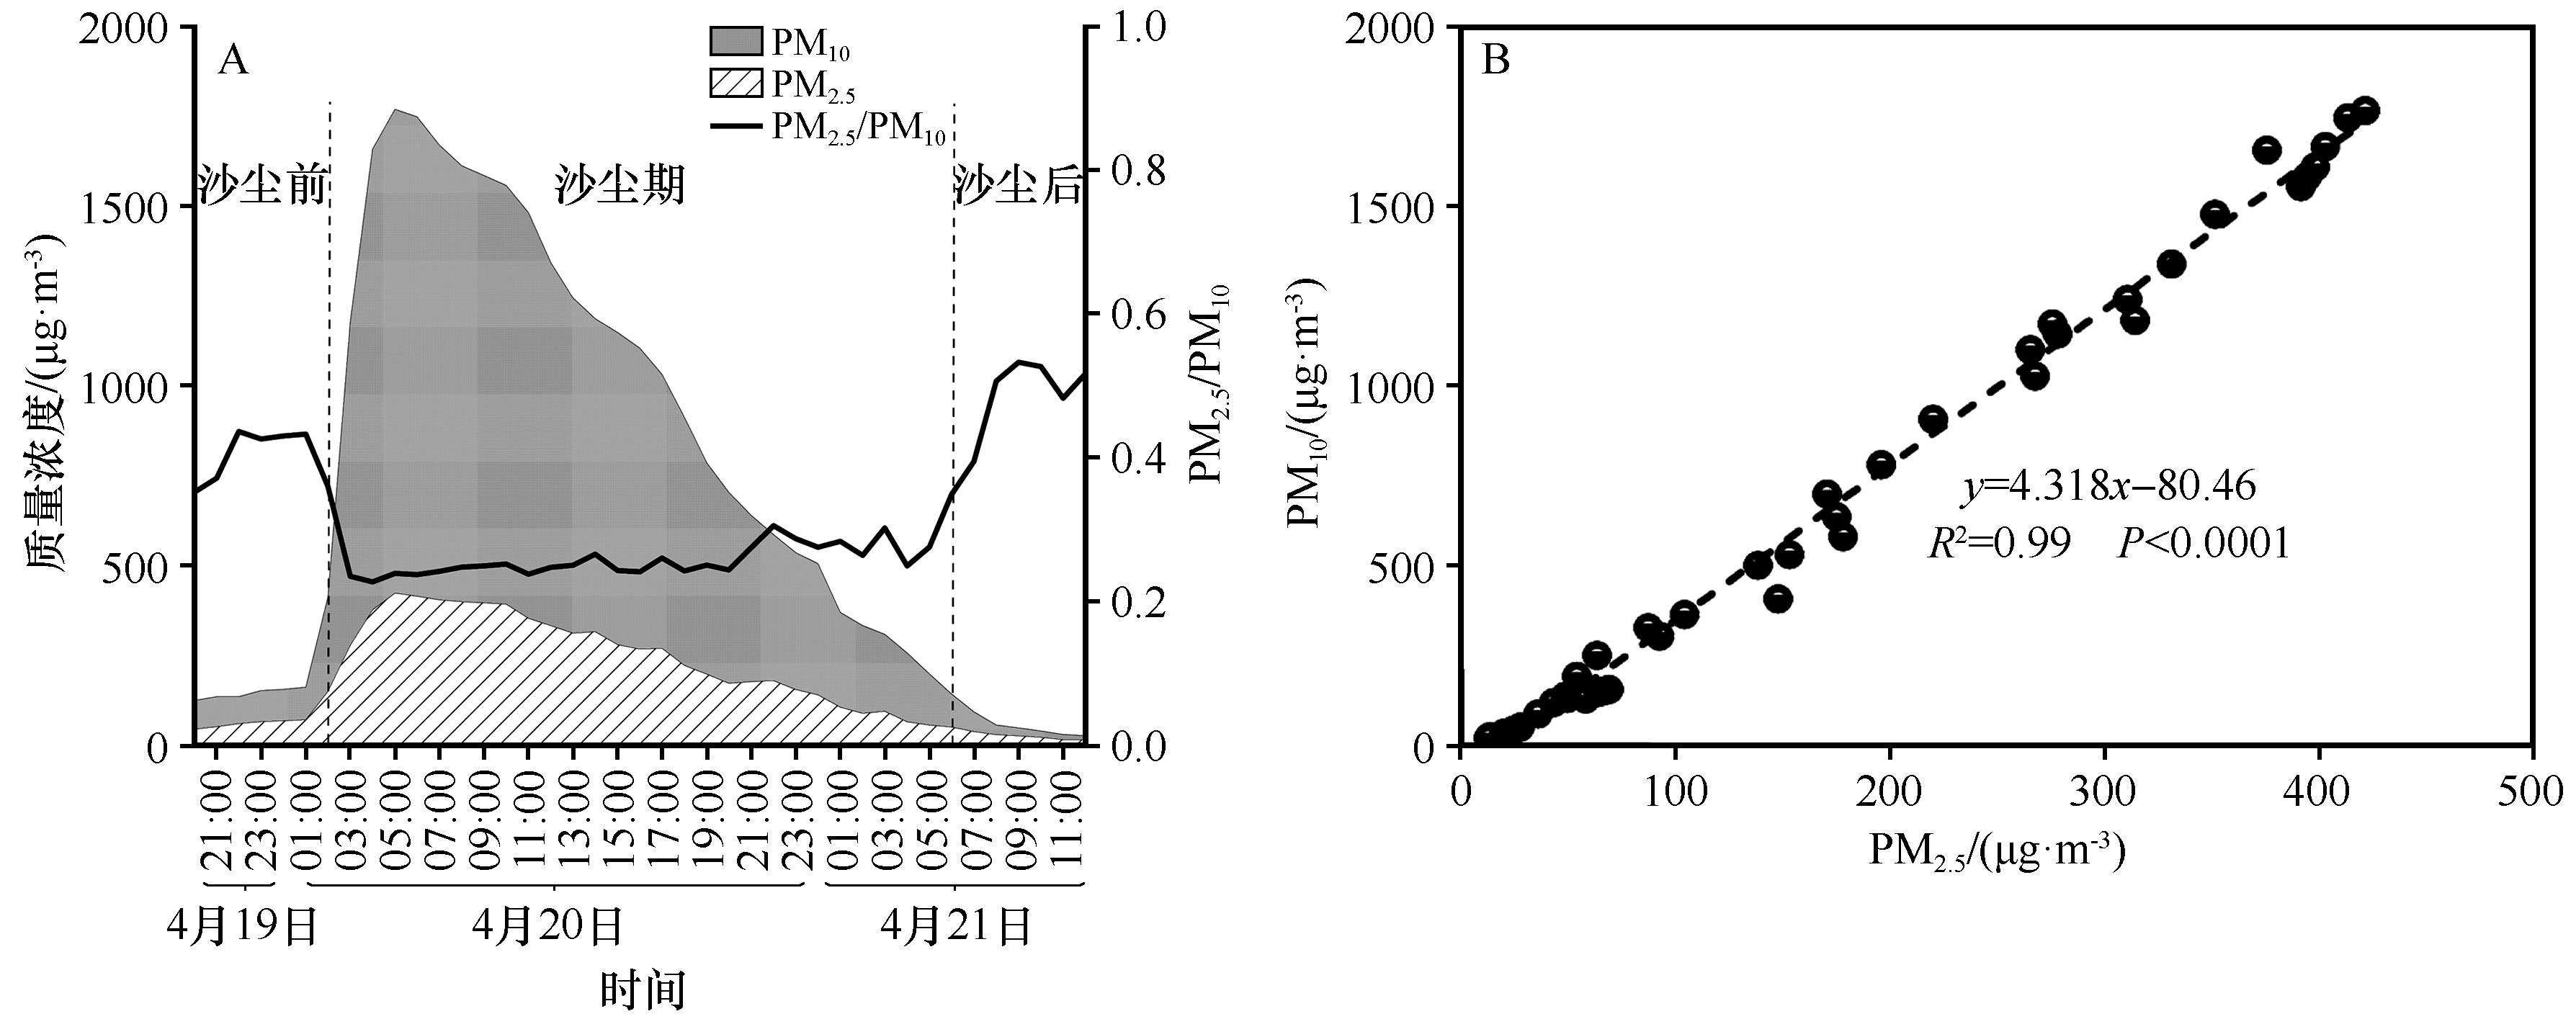
Fig.7 Hourly changes (A) and correlation (B) of PM10 and PM2.5 concentrations in Xi'an during the dust process on April 20-21, 2023
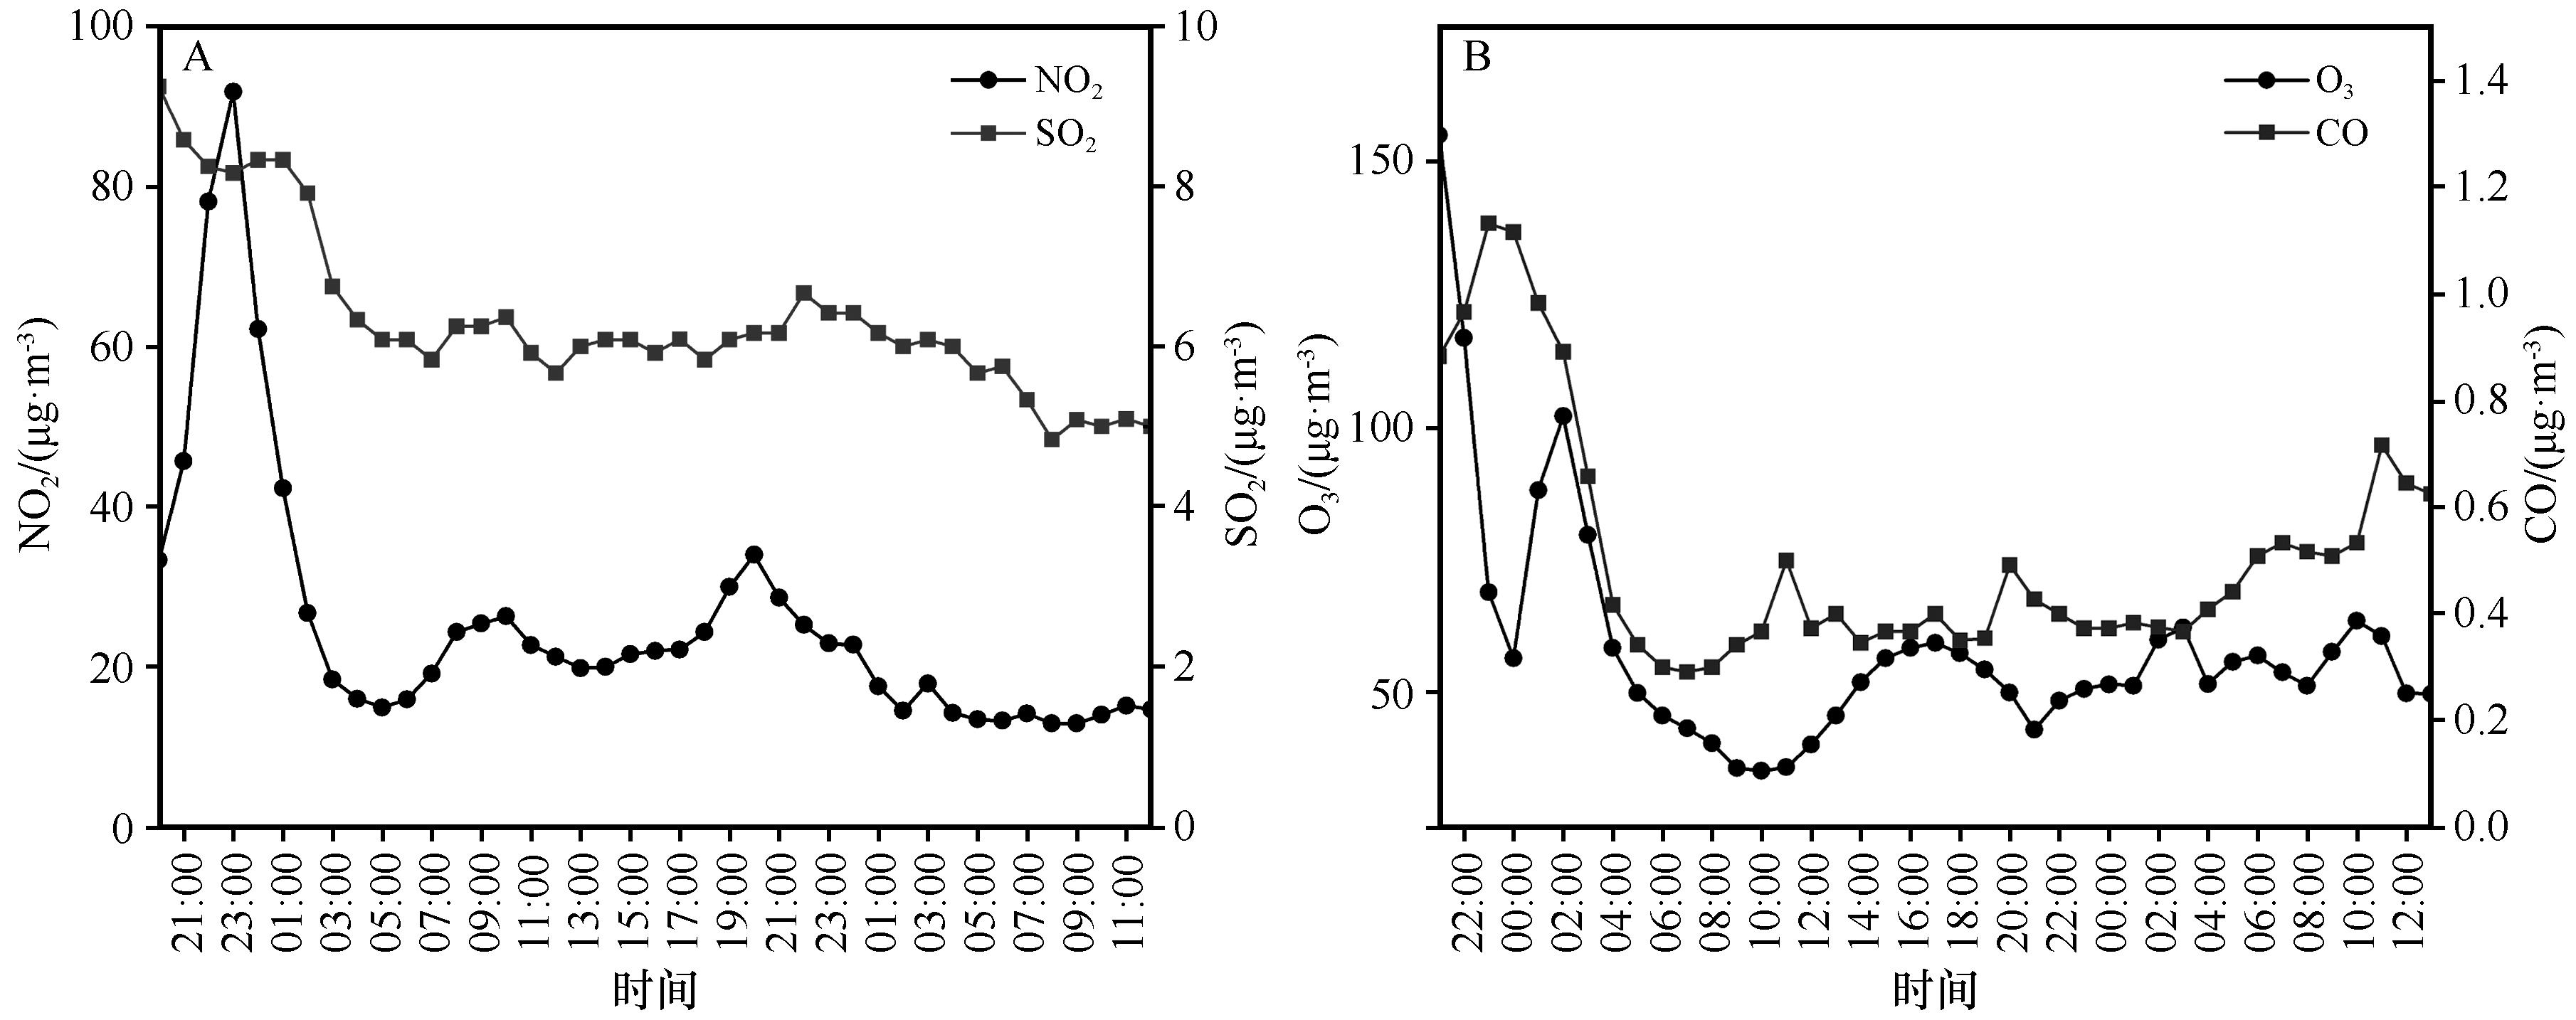
Fig.8 Change of hourly concentration of gaseous pollutants in Xi'an during the dust process on April 19-21, 2023
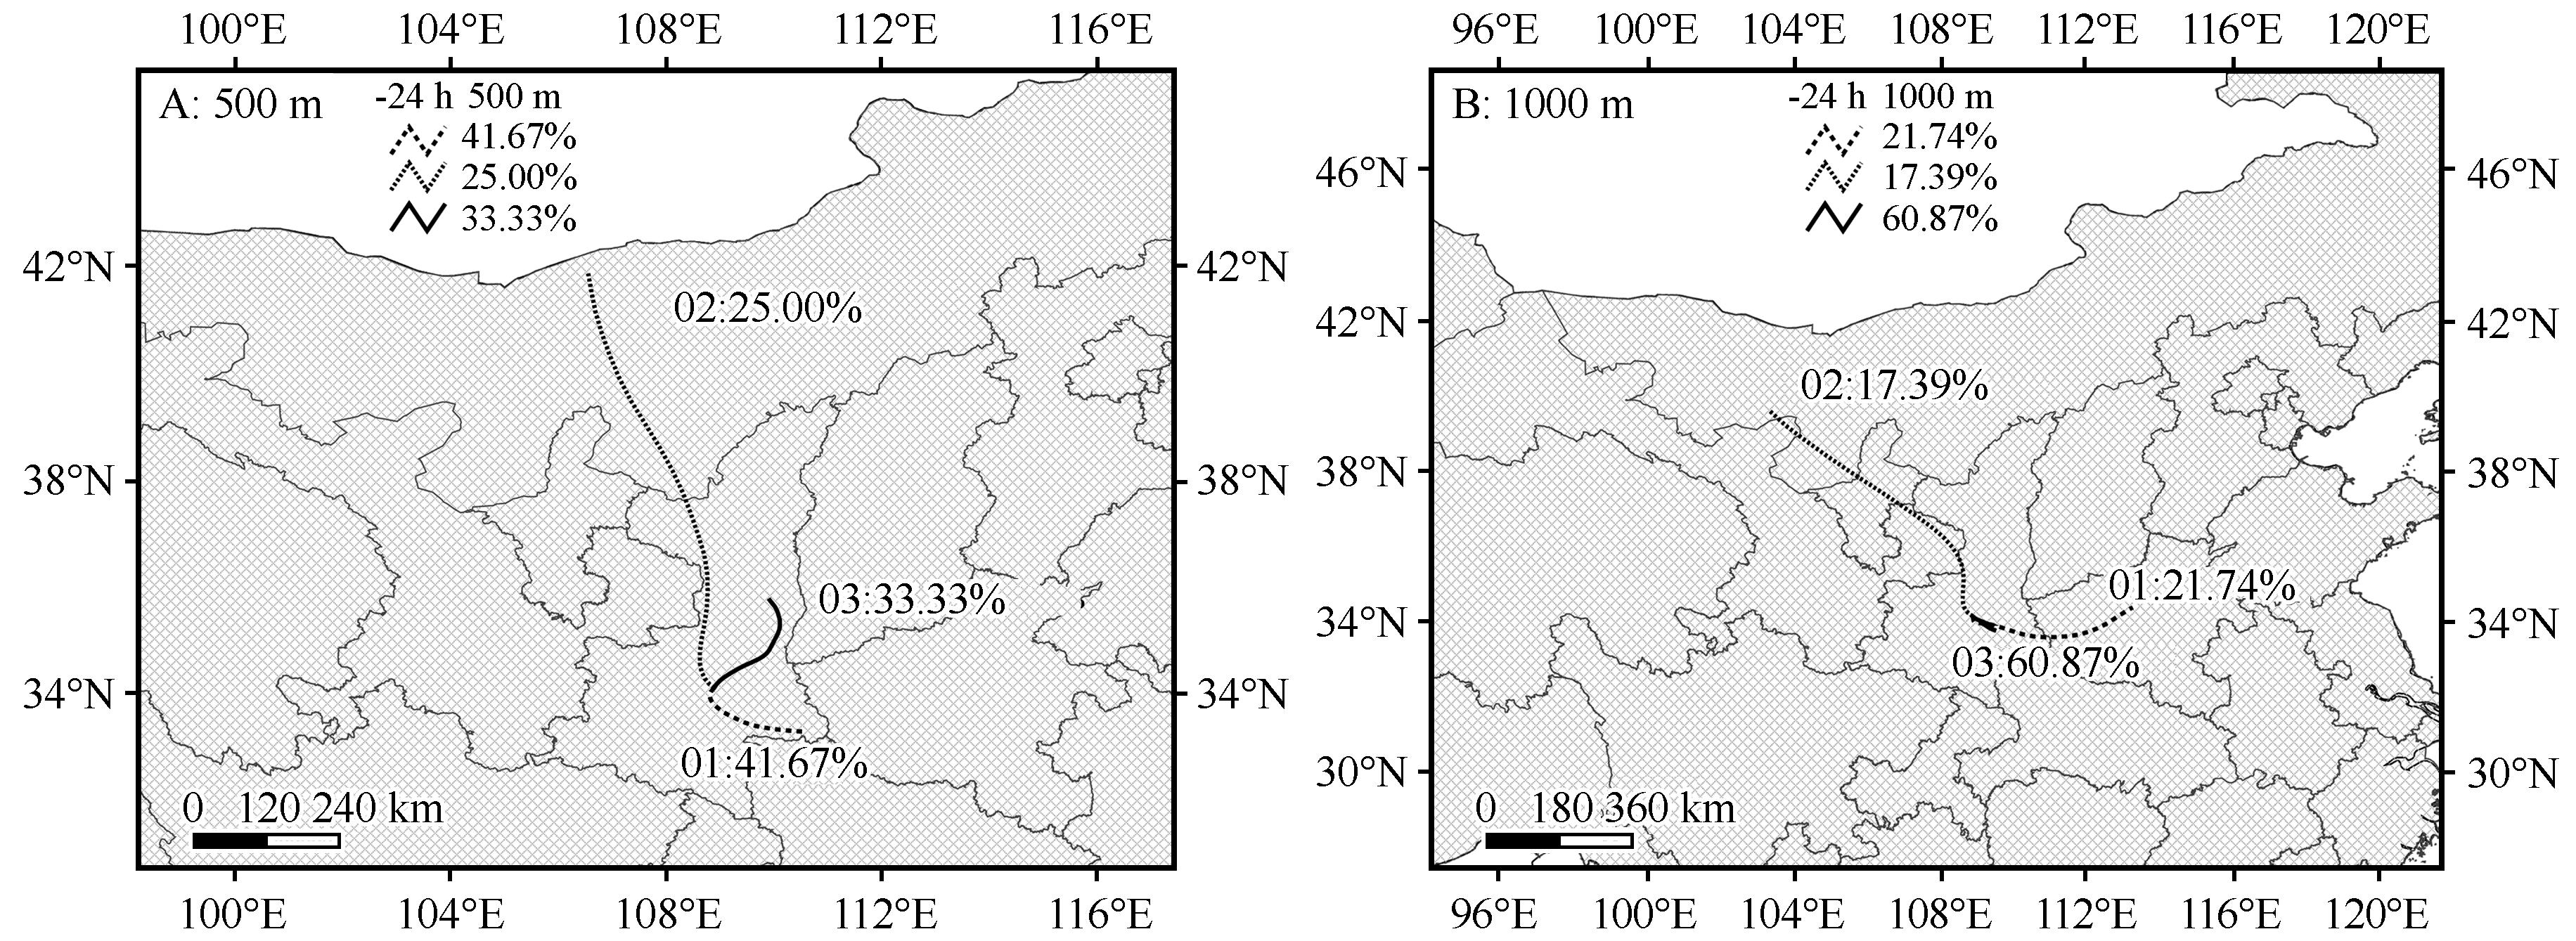
Fig.9 24-hour backward trajectory of PM10 particles in Xi'an on April 20-21, 2023
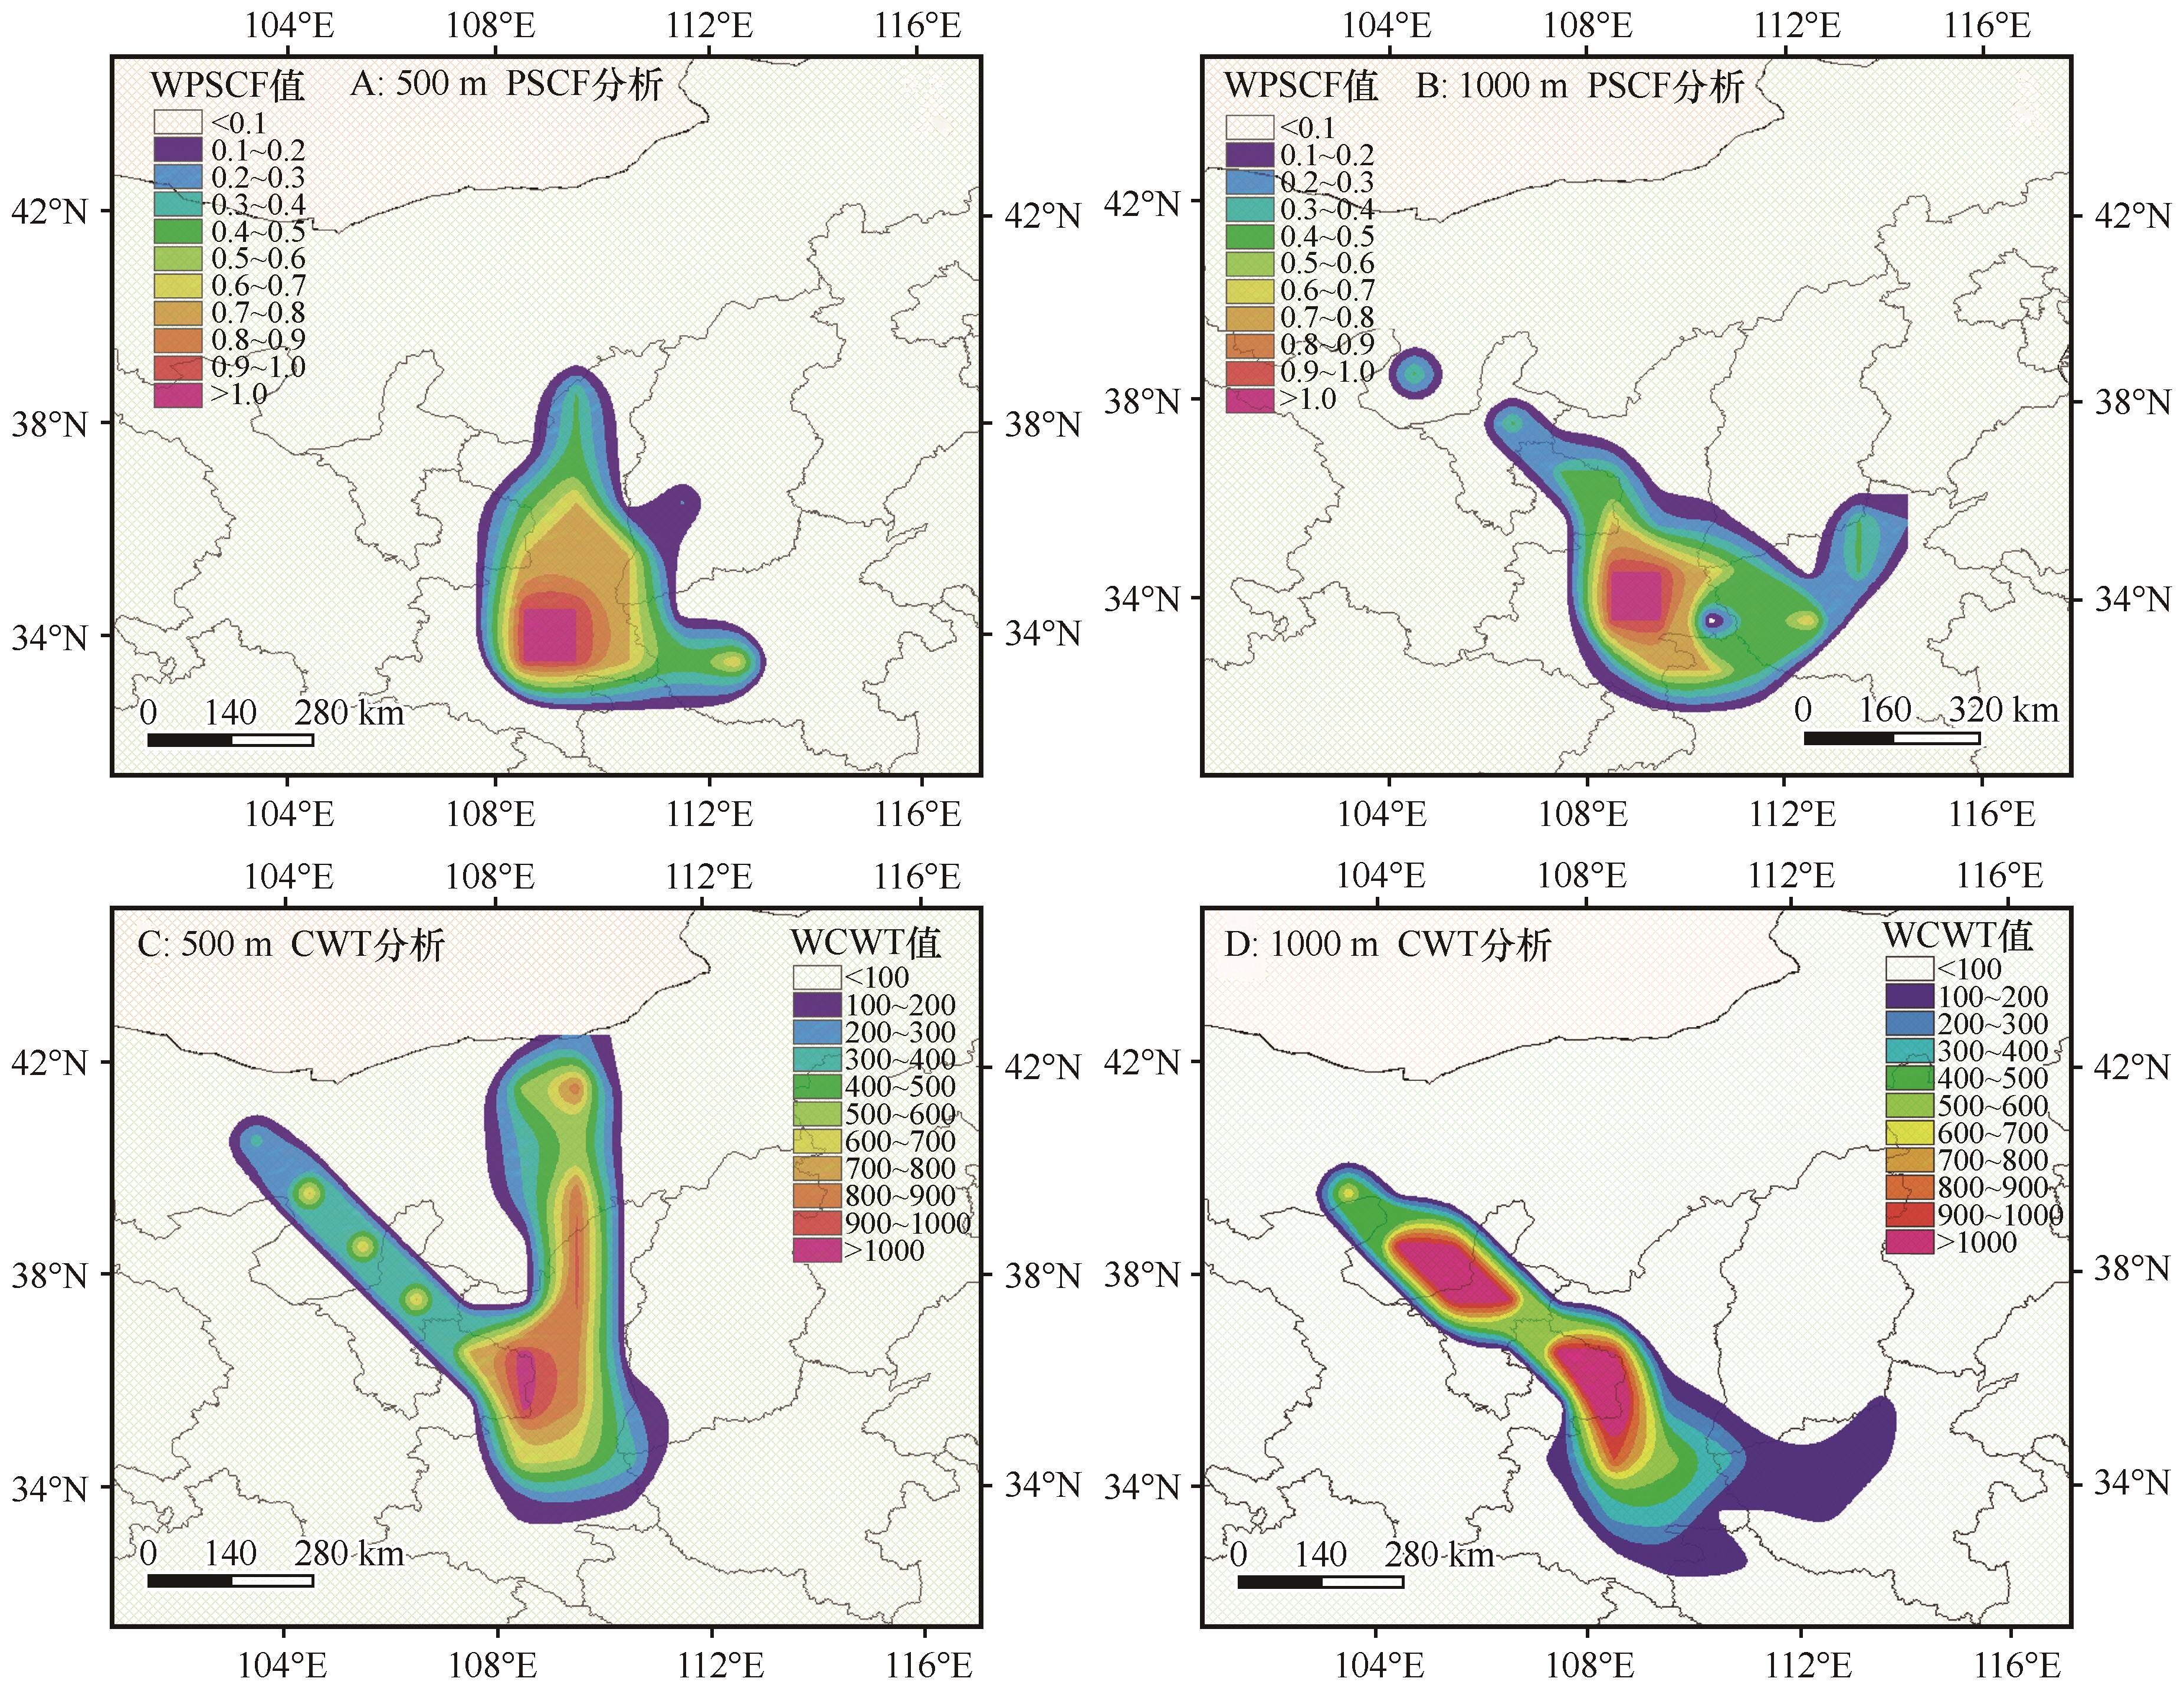
Fig.10 PSCF and CWT analysis of PM10 particles in Xi'an on April 20-21, 2023
| 1 | Chen S, Liu J, Ma S,et al.Holocene dust storm variations across northern monsoonal Asia and arid central Asia:contrasting impacts of climate change[J].Global and Planetary Change,2024,240:104524. |
| 2 | Kang H, Zhu B, De Leeuw G,et al.Source contributions to two super dust storms over Northern China in March 2021 and the impact of soil moisture[J].Science of The Total Environment,2024,950:175289. |
| 3 | Pouri N, Karimi B, Kolivand A,et al.Ambient dust pollution with all-cause,cardiovascular and respiratory mortality:a systematic review and meta-analysis[J].Science of The Total Environment,2024,912:168945. |
| 4 | Gholizadeh H, Zoghipour M H, Torshizi M,et al.Gone with the wind:impact of soil-dust storms on farm income[J].Ecological Economics,2021,188:107133. |
| 5 | 昝金波,方小敏,宁文晓,等.中亚黄土粉尘与冰冻圈演化、太平洋生产力和全球变化的联系[J].科学通报 2024,69:4704-4715. |
| 6 | 吴兑,吴晟,李菲,等.粗粒子气溶胶远距离输送造成华南严重空气污染的分析[J].中国环境科学,2011,31(4):540-545. |
| 7 | 张嘉月,康娜,于学普,等.呼和浩特市大气污染特征及气象条件影响分析[J].科学技术与工程,2024,24(3):1292-1300. |
| 8 | 刘新春,钟玉婷,何清,等.塔克拉玛干沙漠腹地沙尘气溶胶质量浓度的观测研究[J].中国环境科学,2011,31(10):1609-1617. |
| 9 | 李国翠,王建国,连志鸾,等.2006年春季石家庄市沙尘天气与PM10污染[J].中国环境监测,2007(6):57-60. |
| 10 | Karagulian F, Temimi M, Ghebreyesus D,et al.Analysis of a severe dust storm and its impact on air quality conditions using WRF-Chem modeling,satellite imagery,and ground observations[J].Air Quality,Atmosphere & Health,2019,12:453-470. |
| 11 | 王式功,董光荣,陈惠忠,等.沙尘暴研究的进展[J].中国沙漠,2000,20(4):5-12. |
| 12 | Chen S, Zhao D, Huang J,et al.Mongolia contributed more than 42% of the dust concentrations in Northern China in March and April 2023[J].Advances in Atmospheric Sciences,2023,40(9):1549-1557. |
| 13 | 吴芷瑜,辛智鸣,姜群鸥,等.基于HYSPLIT模式的西北干旱区典型沙尘事件沙源地及沙尘传输路径探析[J].光谱学与光谱分析,2023,43(6):1862-1868. |
| 14 | 王蕾,杨震,刘笑,等.关中地区沙尘输送路径及潜在源区分析[J].干旱区资源与环境,2023,37(10):109-117. |
| 15 | 王建鹏,王式功,孟小绒,等.沙尘天气等对西安市空气污染影响的研究[J ].中国沙漠,2004,24(5):558-563. |
| 16 | 张佳音,郭云飞,肖舜,等.陕西区域环境空气质量时空特征[J].中国沙漠,2023,43(3):36-46. |
| 17 | Shen Z X, Cao J J, Arimoto R,et al.Ionic composition of TSPand PM2.5 during dust storms and air pollution episodes at Xi'an,China[J].Atmospheric Environment,2009,43(18):2911-2918. |
| 18 | Li X X, Cao J J, Chow J,et al.Chemical characteristics of car-bonaceous aerosols during dust storms over Xi'an in China[J].Advances in Atmospheric Sciences,2008,25:847-855. |
| 19 | Yan Y, Sun Y, Ma L,et al.A multidisciplinary approach to trace Asian dust storms from source to sink[J].Atmospheric Environment, 2015,105:43-52. |
| 20 | 胡元洁,蒋楠.沙尘天气对西安市环境空气质量的影响[J].中国沙漠,2020,40(6):53-60. |
| 21 | 中华人民共和国环境保护部.受沙尘天气过程影响城市空气质量评价补充规定[Z].北京,2017. |
| 22 | 环境保护部,国家质量监督检验检疫总局. 沙尘暴天气等级: [S].北京:中国气象局,2006. |
| 23 | 环境保护部,国家质量监督检验检疫总局. 环境空气质量标准: [S].北京:中国环境科学出版社,2012. |
| 24 | 黄丽坤,王广智,王琨.哈尔滨市沙尘期大气颗粒物物化特征及传输途径分析[J].中国环境科学,2014,34(8):1920-1926. |
| 25 | 杨静宜,李亚菲,罗忠伟,等.武汉市典型颗粒物污染过程演变特征及来源研究[J].环境科学学报,2024,44(5):310-323. |
| 26 | 孙韧,陈冠益,董海燕.天津市春季颗粒物污染特征及典型沙尘过程分析[J].环境科学与技术,2018,41(6):8-14. |
| [1] | Chaoxin Han, Yongxiang Han, Jiaxin Li. Contribution of dust emission from gust to total dust aerosol under weak wind conditions [J]. Journal of Desert Research, 2025, 45(1): 259-265. |
| [2] | Guangqin Li, Wenqi Niu, Jiangjiao Wang. Characteristics evolution and regional differences of agricultural non-point source pollution in the Yellow River Basin [J]. Journal of Desert Research, 2024, 44(6): 146-154. |
| [3] | Yanyan Dai, Yiting Jiang, Pengfei Zhang, Geng Liu, Lei Zhang. Coupling coordination and driving factors between water resources and planting structure in Shanxi, China [J]. Journal of Desert Research, 2024, 44(6): 37-47. |
| [4] | Zhigang Wang, Ruochen Jia, Fengmin Luo, Minghu Liu, Fang Liu, Chaoqun Ba, Zhimin Liu. Thermal dynamic mechanism of dust and dust suppression mechanism of farmland shelterbelts [J]. Journal of Desert Research, 2024, 44(5): 116-122. |
| [5] | Xiaoyu Han, Yunping Chi, Yuanyun Xie, Chunguo Kang, Peng Wu, Yehui Wang, Lei Sun, Zhengyu Wei. Material composition characteristics of fine particles of eolian sand in Horqin Sandy Land and its indication to provenance [J]. Journal of Desert Research, 2024, 44(3): 231-246. |
| [6] | Huicong Meng, Guangyin Hu, Zhibao Dong, Weige Nan, Haokun Mo, Jingjing Hu. Characteristics of grain size variation of dunes surface sediments before and after wandering dune control in Zoige Basin, China [J]. Journal of Desert Research, 2024, 44(3): 96-107. |
| [7] | Yimeng Wang, Yaqiu Fan, Chuan Long, Benli Liu. Historical dust event sequence reconstruction in Dunhuang based on history records [J]. Journal of Desert Research, 2024, 44(2): 162-171. |
| [8] | Chengxin Tang, Yongde Kang, Hongna Chen, Xintian Du, Minzhong Wang, Qing He, Tao Liu, Xinchun Liu. Characterization and traceability of black carbon aerosol mass concentration on the Pamir Plateau [J]. Journal of Desert Research, 2024, 44(2): 66-77. |
| [9] | Xiaoying Liu, Zongjie Li, Mengqing Liu, Bin Xu, Juan Gui, Qiao Cui, Jian Xue, Ran Duan. Quantitative analysis of plant water sources in the Yangtze River source area [J]. Journal of Desert Research, 2024, 44(1): 102-110. |
| [10] | Yayun Li, Wei Cheng, Ning Wang, Xin Li, Rui Gao. Comparative study on the characteristic of spring sandstorms and the related meteorological factors of the Taklimakan Desert and Gobi Desert [J]. Journal of Desert Research, 2023, 43(4): 1-9. |
| [11] | Kader Mavlan, Lu Zhang, Xinhua Liu, Tunyaz Nurbiye, Muming Gulnafar, Shaobo Gao. Comparative analysis of two dust weather processes in Tarim Basin, China [J]. Journal of Desert Research, 2023, 43(4): 76-88. |
| [12] | Enyue Zhang, Yingqing Su, Yunfeng Zhang, Yuzhen Li, Kexuan Li, Geng Liu. Coupling coordination pattern and driving factors of soil and water resources in Fenhe River Basin of China [J]. Journal of Desert Research, 2023, 43(3): 169-177. |
| [13] | Jiayin Zhang, Yunfei Guo, Shun Xiao, Tao Du, Hao Zheng, Huanwu Liu, Lei Wang, Yanxin He. The temporal and spatial characteristics of ambient air quality in Shaanxi [J]. Journal of Desert Research, 2023, 43(3): 36-46. |
| [14] | Zhengcai Zhang, Kaijia Pan, Yan Zhang, Lanying Han. Sand transport characteristics above gobi surface during a dust storm in northern China [J]. Journal of Desert Research, 2023, 43(2): 130-138. |
| [15] | Xuying Bai, Yujie Wang, Yunqi Wang, Wenbin Yang, Tao Wang, Yiben Cheng. Changes and driving factors of water body area in Mu Us Sandy Land [J]. Journal of Desert Research, 2023, 43(2): 65-73. |
| Viewed | ||||||
|
Full text |
|
|||||
|
Abstract |
|
|||||
©2018Journal of Desert Research
Tel:0931-8267545
Email:caiedit@lzb.ac.cn;desert@lzb.ac.cn
Support:Magtech