


0 引言
因此,究竟是下垫面植被覆盖增加导致目前沙尘天气的减少,还是风速降低导致沙尘天气的减少,还没有定论。因此,有必要开展模拟研究,揭示大风和植被覆盖影响沙尘天气的程度。
1 数据
沙尘数据来源于内蒙古自治区119个国家观测站(图1),数据时间1991—2020年,沙尘包括浮尘、扬沙、沙尘暴(包括沙尘暴、强沙尘暴、特强沙尘暴)。将浮尘、扬沙和沙尘暴站日数的总和定义为总沙尘天气频数,其中霍林郭勒站2006年建站并具有沙尘记录,考虑数据统计的一致性,对其进行了剔除处理。文中所用底图均是从内蒙古自治区标准地图服务网站下载的审图号为蒙s(2019)33的标准地图。
图1
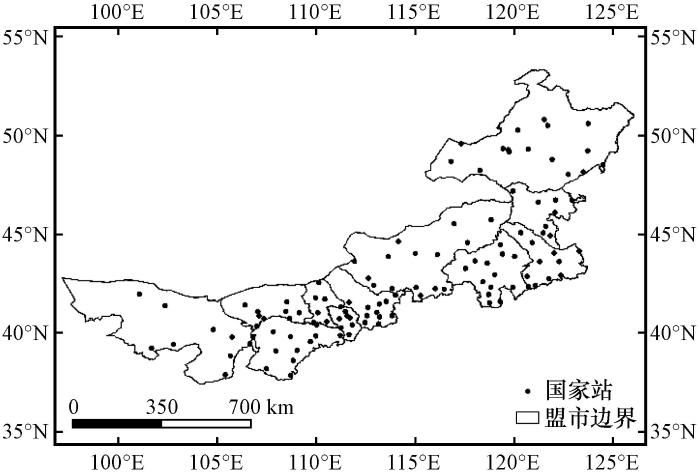
图1
内蒙古118个国家观测站的空间分布
Fig.1
The spatial distribution of 118 national observation stations in Inner Mongolia
中国全球大气再分析产品(CRA40, CMA's global atmospheric Re-Analysis,
采用的模拟时间(2019年5月14日00:00至2019年5月17日00:00)、初始场(FNL再分析数据)、边界条件、模拟区域[220(东西)×120(南北)]、空间分辨率(30 km)、模式参数化方案均与文献[24]一致,模拟结果经过卫星和地面观测站大气粒子监测仪检验,发现模式能较好地再现实际沙尘输送过程,故本文不再重复检验模式的模拟效果。起沙通量、沙尘粒径数据主要使用模式模拟结果。
2 内蒙古地区1991—2020年沙尘天气频数时空分布
2.1 沙尘天气频数空间分布
内蒙古地区1991—2020年沙尘天气频数的空间分布呈西多东少,这与地理环境、下垫面条件和气象条件密切相关(图2)。内蒙古西部阿拉善高原年平均降水量不足200 mm,分布着巴丹吉林沙漠、腾格里沙漠和乌兰布和沙漠;西部的鄂尔多斯高原分布着库布齐沙漠和毛乌素沙地。沙尘天气频数的高值区位于内蒙古西部的巴丹吉林沙漠腹地和乌兰布和沙漠腹地,平均年沙尘天气频数分别为44.6 d和39.5 d,最大年沙尘天气频数为61.8 d和68.7 d。次高值中心位于巴丹吉林沙漠东端和毛乌素沙地,平均年沙尘天气频数分别为39.8 d和28.2 d。内蒙古中部沙尘天气频数高值区位于包头市北部和锡林郭勒盟西北部,平均年沙尘天气频数14.9 d,最大年沙尘天气频数位于朱日和地区(19.3 d)。内蒙古东部年沙尘天气频数高值区位于通辽市南部科尔沁沙地,最大年沙尘天气频数12.9 d。
图2
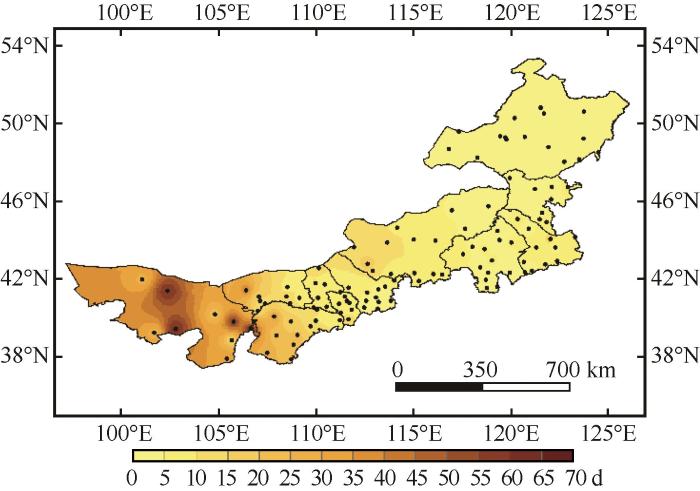
图2
1991—2020年平均沙尘天气频数空间分布
Fig.2
The spatial distribution of the average frequency of dust weather in Inner Mongolia from 1991 to 2020
2.2 总沙尘天气频数时间变化
图3
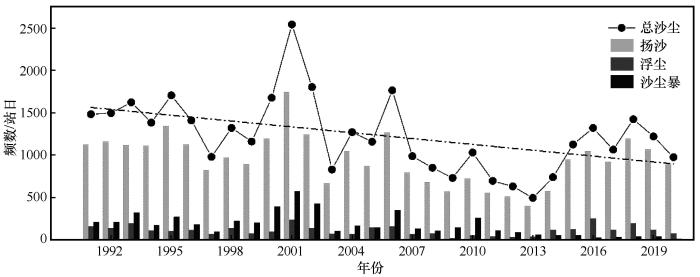
图3
内蒙古地区1991—2020年扬沙、浮尘、沙尘暴及总沙尘天气频数的时间变化(点划线为总沙尘天气频数的趋势线)
Fig.3
The time changes of frequency of sand lifting, dust floating, sandstorms and total dust weather in Inner Mongolia from 1991 to 2020, and the dotted line represents the trend of total dust weather frequency
综上所述,内蒙古1991—2020年沙尘天气总频数呈减小趋势,西部是沙尘天气的高发区,平均年沙尘日24.7 d,中部和东部平均年沙尘日分别为7.72 d和 3.68 d,均以扬沙天气为主。2001年是20世纪90年代以来最多的一年,频繁的冷空气活动带来的大风是2001年沙尘天气频次增高的主要原因,同时沙化面积的扩大也是一个原因[26],由此可见植被和风速的变化均会影响沙尘天气频数。
3 风速的空间分布和气候态变率
图4
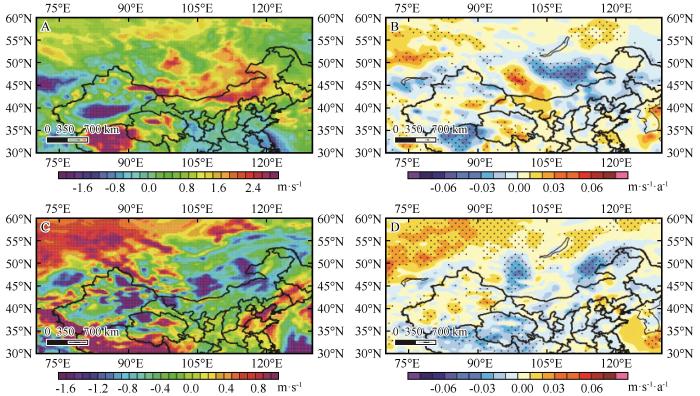
图4
1991—2020年内蒙古及周边地区春季平均纬向(A)和经向(C)10 m高度风速(单位:m·s-1)及纬向(B)和经向(D)气候态变率(单位:m·s-1·a-1)的空间分布(打点区域通过90%的信度检验)
Fig.4
Spatial distribution of zonal (A) and meridional (C) average wind speed at 10 m height and zonal (B) and meridional (D) climatic variability in spring in Inner Mongolia and surrounding areas from 1991 to 2020. The dotted area passed the 90% reliability test
4 植被的空间分布和气候态变率
内蒙古大部分地区1991—2020年植被覆盖率呈增加的趋势,且在内蒙古中部偏北、东部地区显著增加;内蒙古西部地区增加不显著,且在巴丹吉林沙漠的南端及乌兰布和沙漠局地出现了植被覆盖率减小的趋势。蒙古国南部、内蒙古春季植被覆盖率的空间分布与总沙尘天气频数的空间分布相反,内蒙古西部是沙尘的高发区,分布着多个沙漠,春季植被覆盖率≤4%;内蒙古中部沙尘高值区位于包头市北部和锡林郭勒盟西北部,春季植被覆盖率≤12%;内蒙古东部沙尘高值区位于科尔沁沙地,春季植被覆盖率≤16%(图5)。
图5
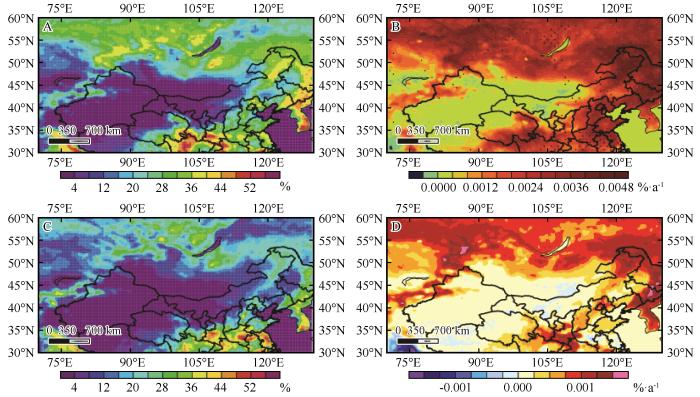
图5
1991—2020年内蒙古及周边地区年(A)、春季(C)平均植被覆盖率(%)及年(B)、春季(D)气候态变率(单位:%·a-1;打点区域通过90%的信度检验)
Fig.5
Spatial distribution of average vegetation coverage (unit: %) in year (A) and spring (C) and climatic variability (unit: %·a-1) in year (B) and spring (D) in Inner Mongolia and surrounding areas from 1991 to 2020. The dotted area passed the 90% reliability test
综上所述,内蒙古1991—2020年植被覆盖率增加,纬向(经向)风在内蒙古沙尘多发区显著减小。
5 风场和植被对沙尘时空分布的影响
5.1 敏感性实验设计
图6
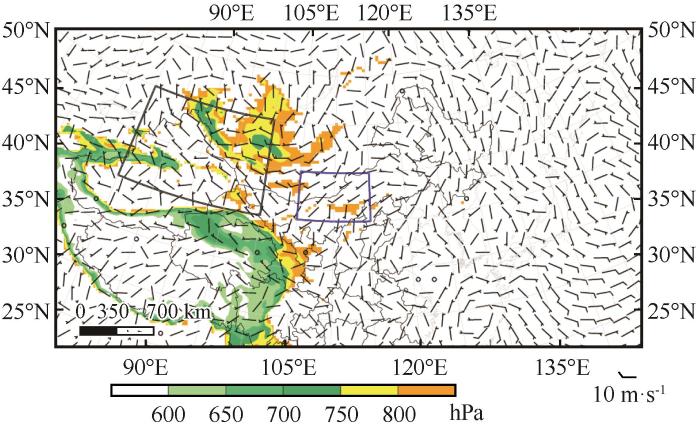
图6
模式初始时刻海平面气压场(单位:hPa)与地面风场(单位:m·s-1)。黑色矩形框为模拟试验修改风速的区域,蓝色矩形框为模拟试验修改植被覆盖率的区域
Fig.6
The sea level pressure field (unit: hPa) and wind field (unit: m·s-1) at the initial moment of the model. The black rectangular box area represents the windy area which was modified in sensitivity experiments, and the blue recta-ngular box area represents the vegetation cover was modified by the simulation experiment
表1 敏感性试验分组
Table 1
| 植被覆盖率敏感性 试验分组 | 植被覆盖率 变化方案 | 风速敏感性 试验分组 | 风速变化 方案 |
|---|---|---|---|
| casev1 | +5% | casew1 | -20% |
| casev2 | +10% | casew2 | -30% |
| casev3 | +15% | casew3 | -40% |
| casev4 | +20% | casew4 | -50% |
5.2 风速和植被对沙尘的影响
5.2.1 风速和植被对沙源地起沙的影响
5月15日04:00(UTC,下同)起沙区域主要位于蒙古国南部及内蒙古中北部(图7),最大起沙量7 427.61 μg·m-2。植被覆盖率增加5%,起沙区面积减小,最大起沙量减小到2 989.9 μg·m-2;植被覆盖率增加10%,沙源地只有局地起沙,最大起沙量910.7 μg·m-2;植被覆盖率增加≥15%,沙源地只有局地少量起沙或无起沙。风速减小对起沙的削减作用弱于植被增加:风速减小20%,起沙区面积与实际起沙区面积相当,最大起沙量4 137.2 μg·m-2;风速减小40%与减小30%的起沙区面积相当,均小于实际,最大起沙量分别为2 687.5 μg·m-2和3 118.5 μg·m-2;风速减小50%,起沙区面积进一步缩小,最大起沙量无明显变化。
图7
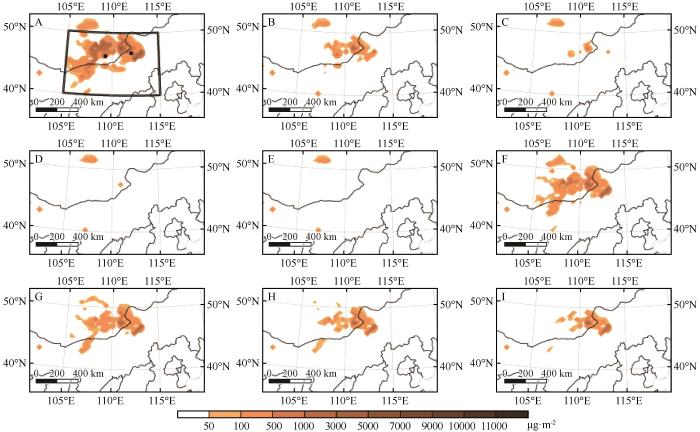
图7
2019年5月15日04:00实际(A)及casev1(B)、casev2(C)、casev3(D)、casev4(E)、casew1(F)、casew2(G)、casew3(H)、casew4(I)模拟起沙量(单位:μg·m-2)的空间分布。黑色矩形框为此次沙尘过程的沙源地,黑色圆点分别表示蒙古国南部站点(43.12°N,109.21°E)和二连浩特(43.39°N,112.00°E)
Fig.7
The spatial distribution of actual sand emission (A) and sand emission (unit: μg·m-2) simulated by casev1 (B), casev2 (C), casev3 (D), casev4 (E), casew1 (F), casew2 (G), casew3 (H), casew4 (I) at 04:00 on May 15, 2019. The black rectangular box area is sand source, and the black dots indicate the southern site of Mongolia (43.12°N,109.21°E) and Erenhot (43.39°N,112.00°E)
图8
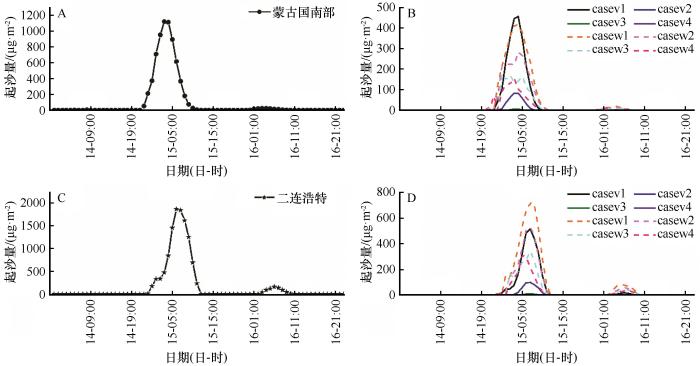
图8
蒙古国南部(A)、二连浩特(C)实际起沙量和模拟的不同植被、不同风速下蒙古国南部(B)、二连浩特(D)起沙量
Fig.8
The actual sand emission of southern Mongolia (A) and Erenhot (C), and the simulated sand emission of southern Mongolia (B) and Erenhot (D)
表2 蒙古国南部与二连浩特总起沙量和植被、风速对总起沙量的削减率
Table 2
| 分组 | 蒙古国南部 | 二连浩特(第一次) | 二连浩特(第二次) | |||||
|---|---|---|---|---|---|---|---|---|
| 总起沙量/(μg·m-2) | 削减率% | 总起沙量/(μg·m-2) | 削减率/% | 总起沙量/(μg·m-2) | 削减率/% | |||
| 实际 | 6 673.8 | — | 11 145.0 | — | 722.3 | — | ||
| casev1 | 2 362.8 | 64.6 | 2 634.8 | 76.4 | 63.4 | 91.2 | ||
| casev2 | 365.5 | 94.5 | 444.0 | 96.0 | 0.0 | 100.0 | ||
| casev3 | 13.9 | 99.8 | 38.6 | 99.7 | 0.0 | 100.0 | ||
| casev4 | 0.0 | 100.0 | 0.0 | 100 | 0.0 | 100.0 | ||
| casew1 | 2 918.7 | 56.3 | 4 419.1 | 60.3 | 417.9 | 42.1 | ||
| casew2 | 2 013.6 | 69.8 | 2 938.5 | 73.6 | 270.8 | 62.5 | ||
| casew3 | 1 199.2 | 82.0 | 1 869.8 | 83.2 | 199.1 | 72.4 | ||
| casew4 | 884.5 | 86.7 | 1 502.7 | 86.5 | 170.5 | 76.4 | ||
第一次沙尘过程,植被覆盖率增加5%与风速减小30%对起沙的削减率相当。植被覆盖率增加≥10%,起沙的削减率≥95%;植被覆盖率增加≥15%,相同天气系统影响下,沙源地不会起沙。风速减小≥40%,起沙的削减率≥82%。
第二次沙尘过程,植被覆盖率增加≥5%,起沙的削减率≥91%,风速减少≥50%,起沙的削减率<80%,且第二次沙尘过程风速对起沙的削减率均小于第一次。
模拟试验选用的起沙参数化方案(Shao_04)[24]根据土壤质地、植被类型、叶面积指数和土壤湿度数据计算临界摩擦速度,所以模式对植被覆盖率变化的响应是通过叶面积指数调整起沙的临界摩擦速度而影响沙源地起沙量和起沙时间。临界摩擦速度的空间分布见图9,实际沙源地的临界摩擦速度≤1.6 m·s-1,随着植被覆盖率的增加,临界摩擦速度增大,但修改初始场风速,对临界摩擦速度无影响。Shao_04方案将可蚀性土壤面积分为A、B、C类。 A类主要包括沙漠地区,临界摩擦速度0.4~0.5 m·s-1,沙尘天气出现频繁;B类主要包括沙漠附近的半干旱地区,临界摩擦速度0.7~0.8 m·s-1,仅在大风情况下出现风蚀起沙;C类临界摩擦速度大于1 m·s-1的零星地区,风蚀起沙很少出现。此次起沙区域主要位于蒙古国南部、内蒙古中北部,均为可蚀性土壤,临界摩擦速度以0.4~0.8 m·s-1为主,植被覆盖率增加≥10%,沙源地临界摩擦速度≥1 m·s-1,沙源地只有零星或无起沙。
图9
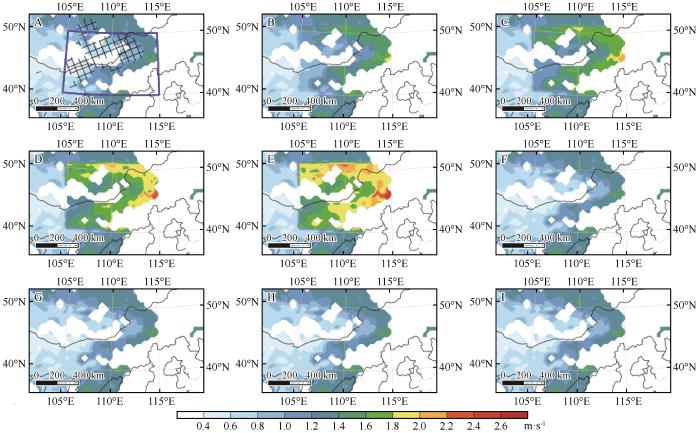
图9
5月15日04:00实际(A)及植被、风速敏感性试验中casev1(B)、casev2(C)、casev3(D)、casev4(E)、casew1(F)、casew2(G)、casew3(H)、casew4(I)对应的临界摩擦速度的空间分布。栅格表示该时刻沙尘的起沙量在50~3 000 μg·m-2,蓝色框表示此次过程的沙源地
Fig.9
The spatial distribution of actual critical friction velocity (A) and critical friction velocity simulated by casev1 (B), casev2 (C), casev3 (D), casev4 (E), casew1 (F), casew2 (G), casew3 (H), casew4 (I) at 04:00 on May 15. The black grid area indicates sand emission flux is 50-3 000 μg·m-2. The blue box area indicates the sand source of the process
综上所述,植被覆盖增加对沙尘天气的影响明显强于风速的减小。风速主要通过起沙的动力条件强弱影响起沙量,植被覆盖对起沙的影响有两方面:一是通过影响临界摩擦速度影响起沙,二是随着植被覆盖增加,下垫面能够提供的沙尘量会明显减少,也对起沙量有重要影响,所以风速对起沙的影响弱于植被。
5.2.2 风速和植被对沙尘粒径的影响
Shao_04方案中将沙尘粒子有效半径划分成5档,分别是0.5 μm(bin1)、1.4 μm(bin2)、2.4 μm(bin3)、4.5 μm(bin4)、8.0 μm(bin5),选取二连浩特(植被调整区)及白城(沙源地下游沙尘输送经过的站点)作为两个代表站点,分析植被和风速对沙源地及下游地区沙尘粒径分布的影响。二连浩特起沙总量的统计时段为5月14日23:00至15日11:00(图10),白城沙尘总量的统计时段为5月15日13:00至16日12:00(图11)。对沙源地起沙贡献率最大的是bin5(45.35%),其次是bin4(31.23%)>bin3(11.55%)>bin2(8.17%)>bin1(3.71%),表明沙源地起沙以大粒径沙尘为主。随着植被覆盖率的增加,bin5的贡献率逐渐增大,bin1~bin4对起沙的贡献率均减小,增加植被对小粒径沙尘的抑制作用更强。
图10
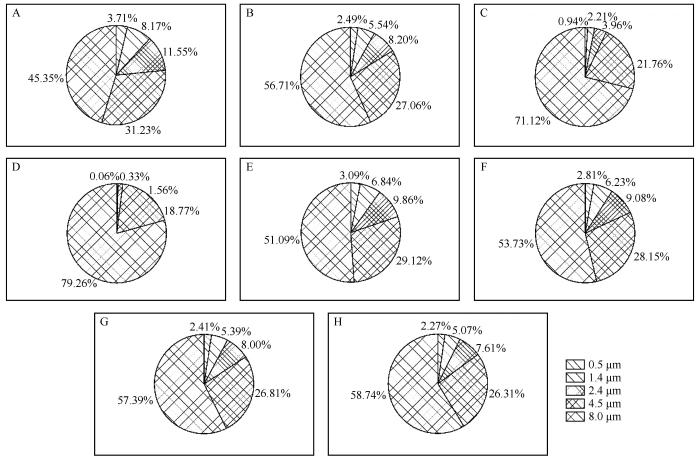
图10
沙源地二连浩特不同粒径对起沙量的实际贡献率(A)及植被、风速敏感性试验中casev1 (B)、casev2 (C)、casev3 (D)、casew1 (E)、casew2 (F)、casew3 (G)、casew4 (H)模拟的贡献率
Fig.10
The actual contribution rate (A) of different particle sizes to the sand emission in Erenhot and contribution rates simulated by casev1 (B), casev2 (C), casev3 (D), casew1 (E), casew2 (F), casew3 (G), casew4 (H)
图11
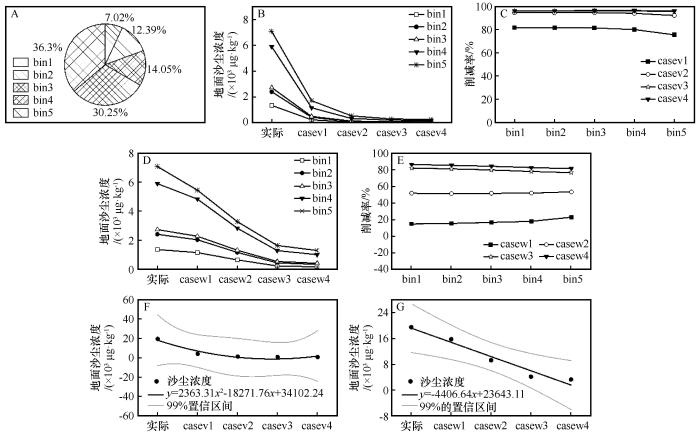
图11
沙源地下游白城站不同粒径沙粒对地面沙尘浓度的实际贡献率(A),植被覆盖率(B)和风速(D)敏感性试验中不同粒径的浓度,植被覆盖率(C)和风速(E)对不同粒径浓度的削减率及植被覆盖率(F)和风速(G)与地面沙尘浓度的拟合
Fig.11
The actual contribution rate of different sizes particle to the surface sand concentration (A) in Baicheng Station in downstream of the sand source, the concentration of different sizes particle in different vegetation coverage (B) and wind speed (D) sensitivity tests, the concentrations reduction rate of vegetation coverage (C) and wind speed (E) to different sizes particle, and fitting of surface sand concentrations in different vegetation coverage (F) and wind speed (G) sensitivity experiments
Shao[30]指出小沙粒间相互作用力大,不容易被吹起,所以随着风速减小,大粒径对起沙的贡献率增加,小粒径对起沙的贡献率减小。风速减小对不同粒径沙粒的削减小于植被,风速削减50%,bin1对起沙的贡献率2.27%,植被覆盖率增加20%,bin1对起沙的贡献率0.06%。
综上所述,植被和风速对沙源地小粒径沙尘的抑制作用更强。沙源地下游地区,风速削减≤30%,风速对大粒径的削减率大于小粒径,风速削减>30%,风速对大粒径削减率小于小粒径。
6 总结与展望
内蒙古1991—2020年总沙尘天气频数呈减小趋势,植被覆盖率增加,纬向(经向)风在内蒙古沙尘多发区显著减小。植被覆盖增加对沙尘天气的影响明显强于风速的减小:植被覆盖率增加5%与风速减小30%对沙源地起沙的削减率相当;植被覆盖率增加≥15%,沙源地只有局地少量起沙或无起沙;风速削减50%,沙源地仍存在成片的起沙区。植被和风速均对沙源地小粒径沙尘的抑制作用更强,且植被的影响强于风速。
WRF-Chem模式可以部分弥补观测资料的时空缺陷,同时可以量化沙尘的起沙、沉降,为WRF-Chem模式在内蒙古地区的预报服务应用积累相关经验。本文的结论只是内蒙古一次典型沙尘天气的模拟结果,后续将增加模拟个例,从而得到普适性的结论,为区域尺度的防沙治沙工作提供更有力的依据和指导。
参考文献
1961-2019 年柴达木盆地沙尘强度时空变化特征
[J].
中国北方沙尘过程及未来气候变化情景下起沙通量的数值模拟研究
[D].
2011年春季中国北方沙尘天气过程及其成因
[J].
Spatiotemporal variations and driving factors of dust storm events in northern China based on high-temporal-resolution analysis of meteorological data (1960-2007)
[J].
Influence of vegetations and snow cover on sand-dust events in the west of China
[J].
The influence of vegetation variation on Northeast Asian dust activity
[J].
The origin,evolution,and trajectory of large dust storms on Mars during Mars years 24-30 (1999-2011)
[J].
A simulated climatology of Asian dust aerosol and its trans-Pacific transport.Part II:interannual variability and climate connections
[J].
Long-range transport and vertical structure of Asian dust from CALIPSO and surface measurements during PACDEX
[J].
2001年沙尘暴天气气候特征和成因分析及预警服务
[C]//中国气象学会.
蒙古国沙尘暴对内蒙古沙尘暴的影响研究
[D].
Simplification of a dust emission scheme and comparison with data
[J].
科尔沁沙地起沙过程沙尘气溶胶粒径分布特征
[C]//中国颗粒学会气溶胶专业委员会.
Variability of water resource in the Yellow River basin of past 50 years,China
[J].
Effects of the precipitiation pattern and vegetation coverage variation on the surface runoff characteristics in the eastern Taihang Mountain
[J].
Regional temporal persistence of dried soil layer along south-north transect of the Loess Plateau,China
[J].
Estimation of soil water storage using temporal stability in four land uses over 10 years on the Loess Plateau,China
[J].
Spatiotemporal vegetation cover variations associated with climate change and ecological restoration in the Loess Plateau
[J].

 甘公网安备 62010202000688号