中国沙漠 ›› 2023, Vol. 43 ›› Issue (6): 29-39.DOI: 10.7522/j.issn.1000-694X.2023.00050
董祝雷1( ), 姜学恭2(), 衣娜娜3, 许志丽3, 杭月荷2, 于水燕3
收稿日期:2023-02-02
修回日期:2023-04-19
出版日期:2023-11-20
发布日期:2023-11-30
通讯作者:
姜学恭
作者简介:姜学恭(E-mail: jiangxuegong@aliyun.com)基金资助:
Zhulei Dong1(), Xuegong Jiang2(), Nana Yi3, Zhili Xu3, Yuehe Hang2, Shuiyan Yu3
Received:2023-02-02
Revised:2023-04-19
Online:2023-11-20
Published:2023-11-30
Contact:
Xuegong Jiang
摘要:
利用WRF-Chem模拟研究了植被覆盖率和风速对内蒙古地区一次沙尘过程起沙、输送及沙尘粒径分布的量化影响。同时基于内蒙古地区119个国家站1991—2020年沙尘日数据及中国全球大气再分析数据统计了内蒙古地区1991—2020年沙尘天气频数、风速及植被覆盖率时空分布。结果表明,内蒙古地区1991—2020年沙尘天气频数减小,植被覆盖增加,纬向(经向)风在内蒙古沙尘多发区显著减小。植被覆盖增加对沙尘的影响强于风速减小:植被覆盖率增加5%与风速减小30%对起沙的削减相当,且植被和风速均对沙源地小粒径沙尘的削减作用更强。因此植树造林可以选在细沙粒为主的半荒漠化地区优先开始,在保护原生植被和合理利用水资源的基础上,植树造林最终使植被覆盖率增加10%~15%即可。
中图分类号:
董祝雷, 姜学恭, 衣娜娜, 许志丽, 杭月荷, 于水燕. 风速和植被对内蒙古地区沙尘天气影响的数值模拟[J]. 中国沙漠, 2023, 43(6): 29-39.
Zhulei Dong, Xuegong Jiang, Nana Yi, Zhili Xu, Yuehe Hang, Shuiyan Yu. Numerical simulation of the influence of wind speed and vegetation on dust weather in Inner Mongolia, China[J]. Journal of Desert Research, 2023, 43(6): 29-39.
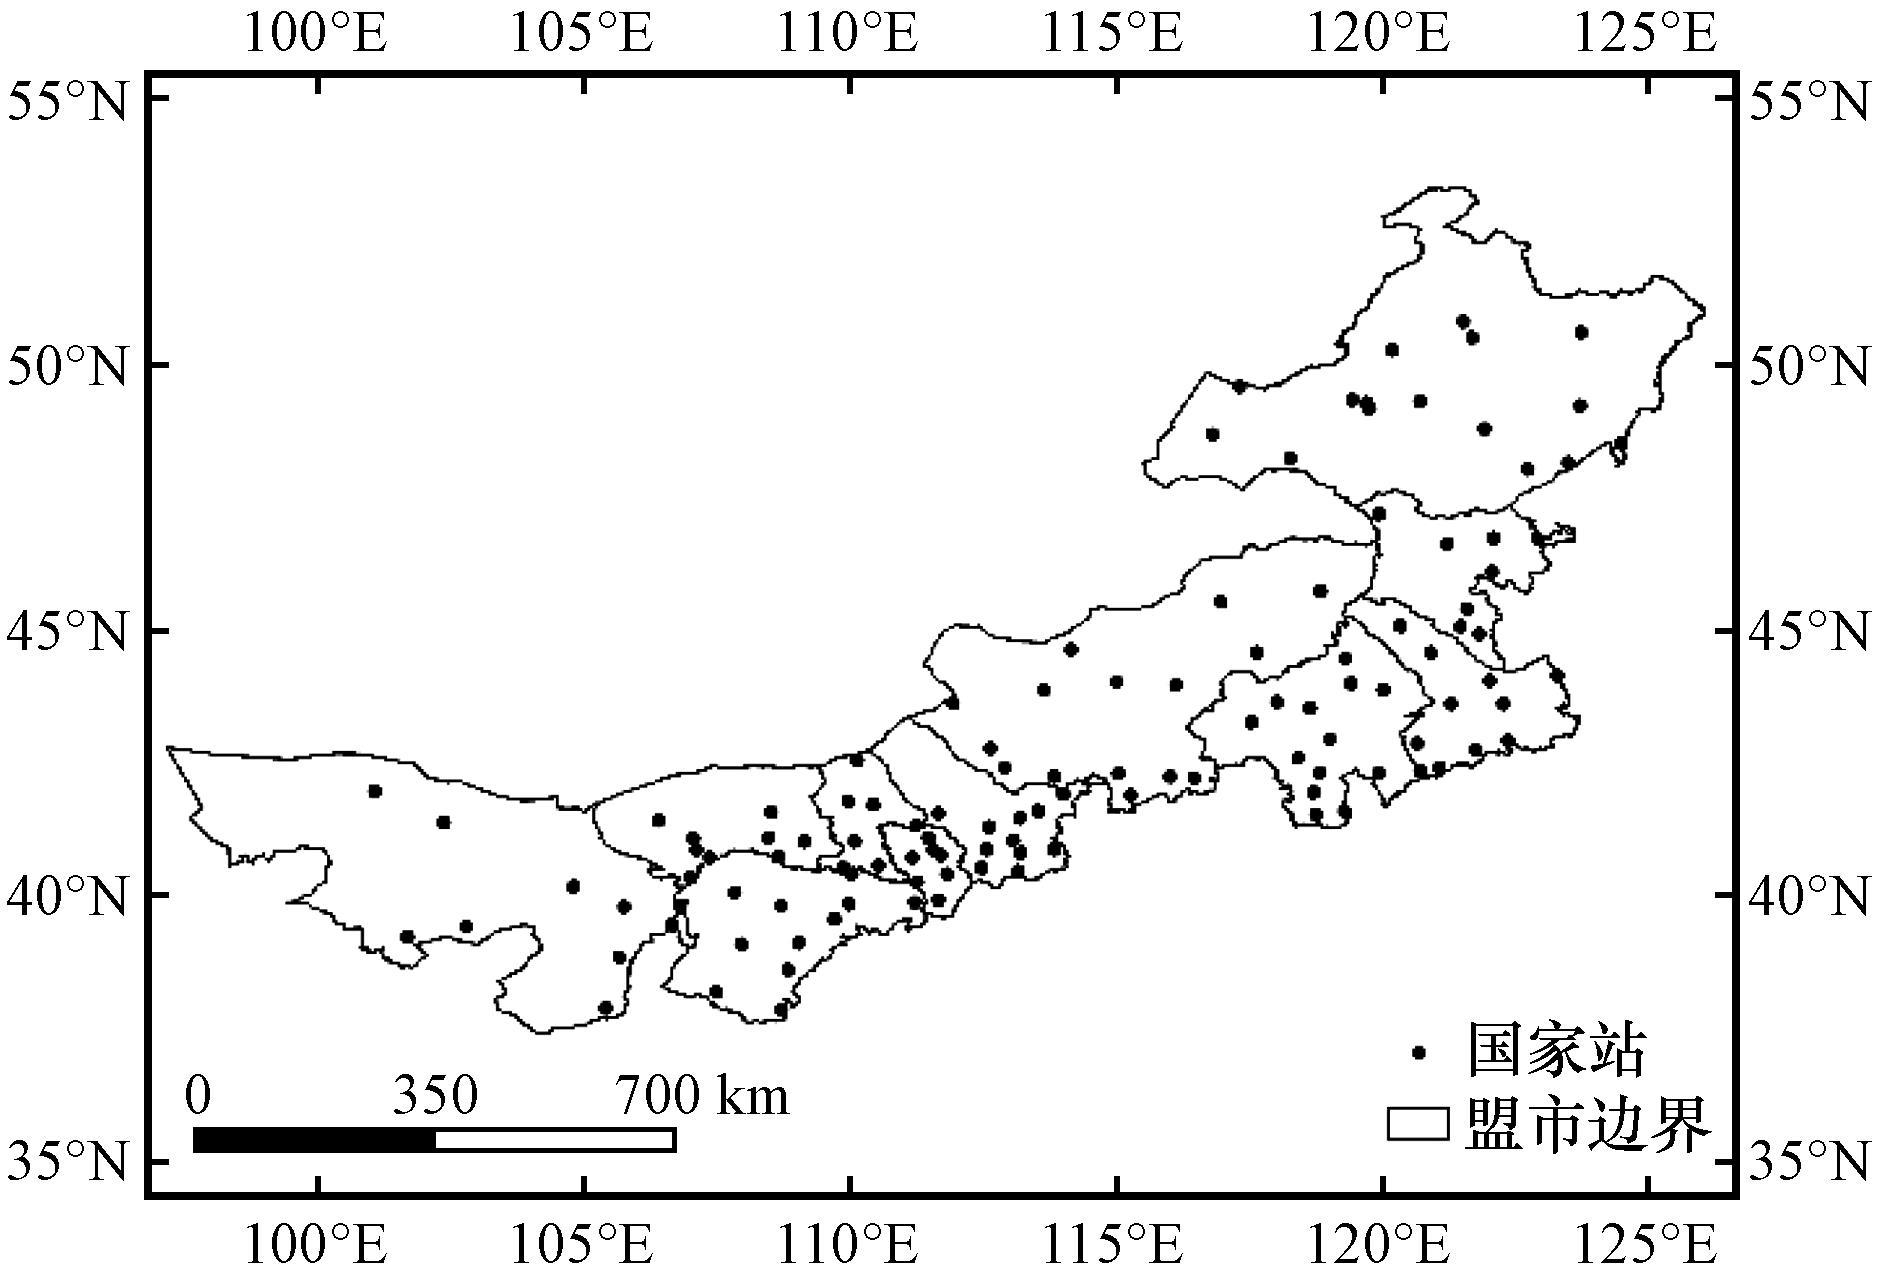
图1 内蒙古118个国家观测站的空间分布
Fig.1 The spatial distribution of 118 national observation stations in Inner Mongolia
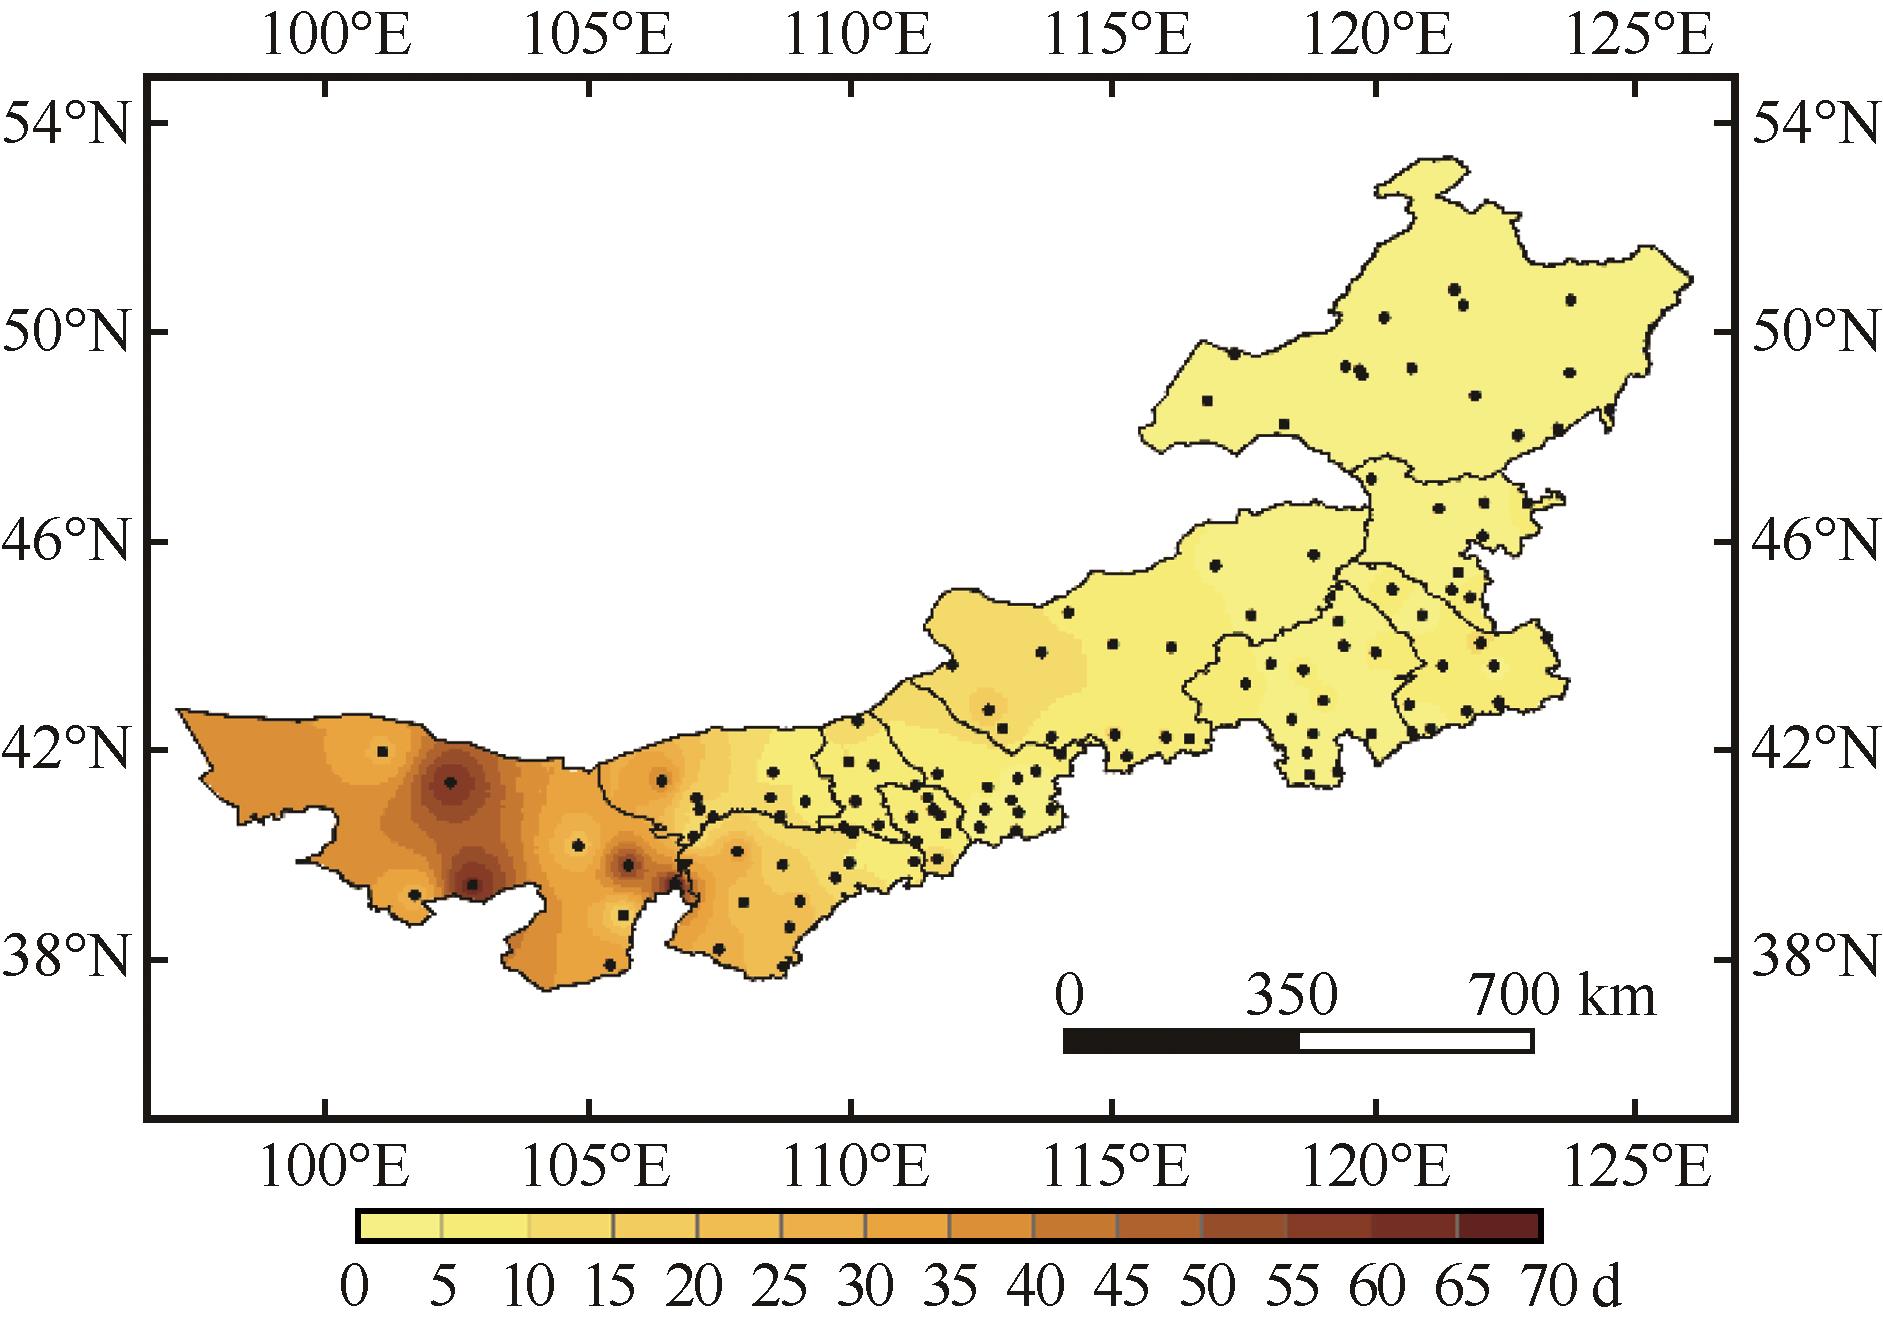
图2 1991—2020年平均沙尘天气频数空间分布
Fig.2 The spatial distribution of the average frequency of dust weather in Inner Mongolia from 1991 to 2020
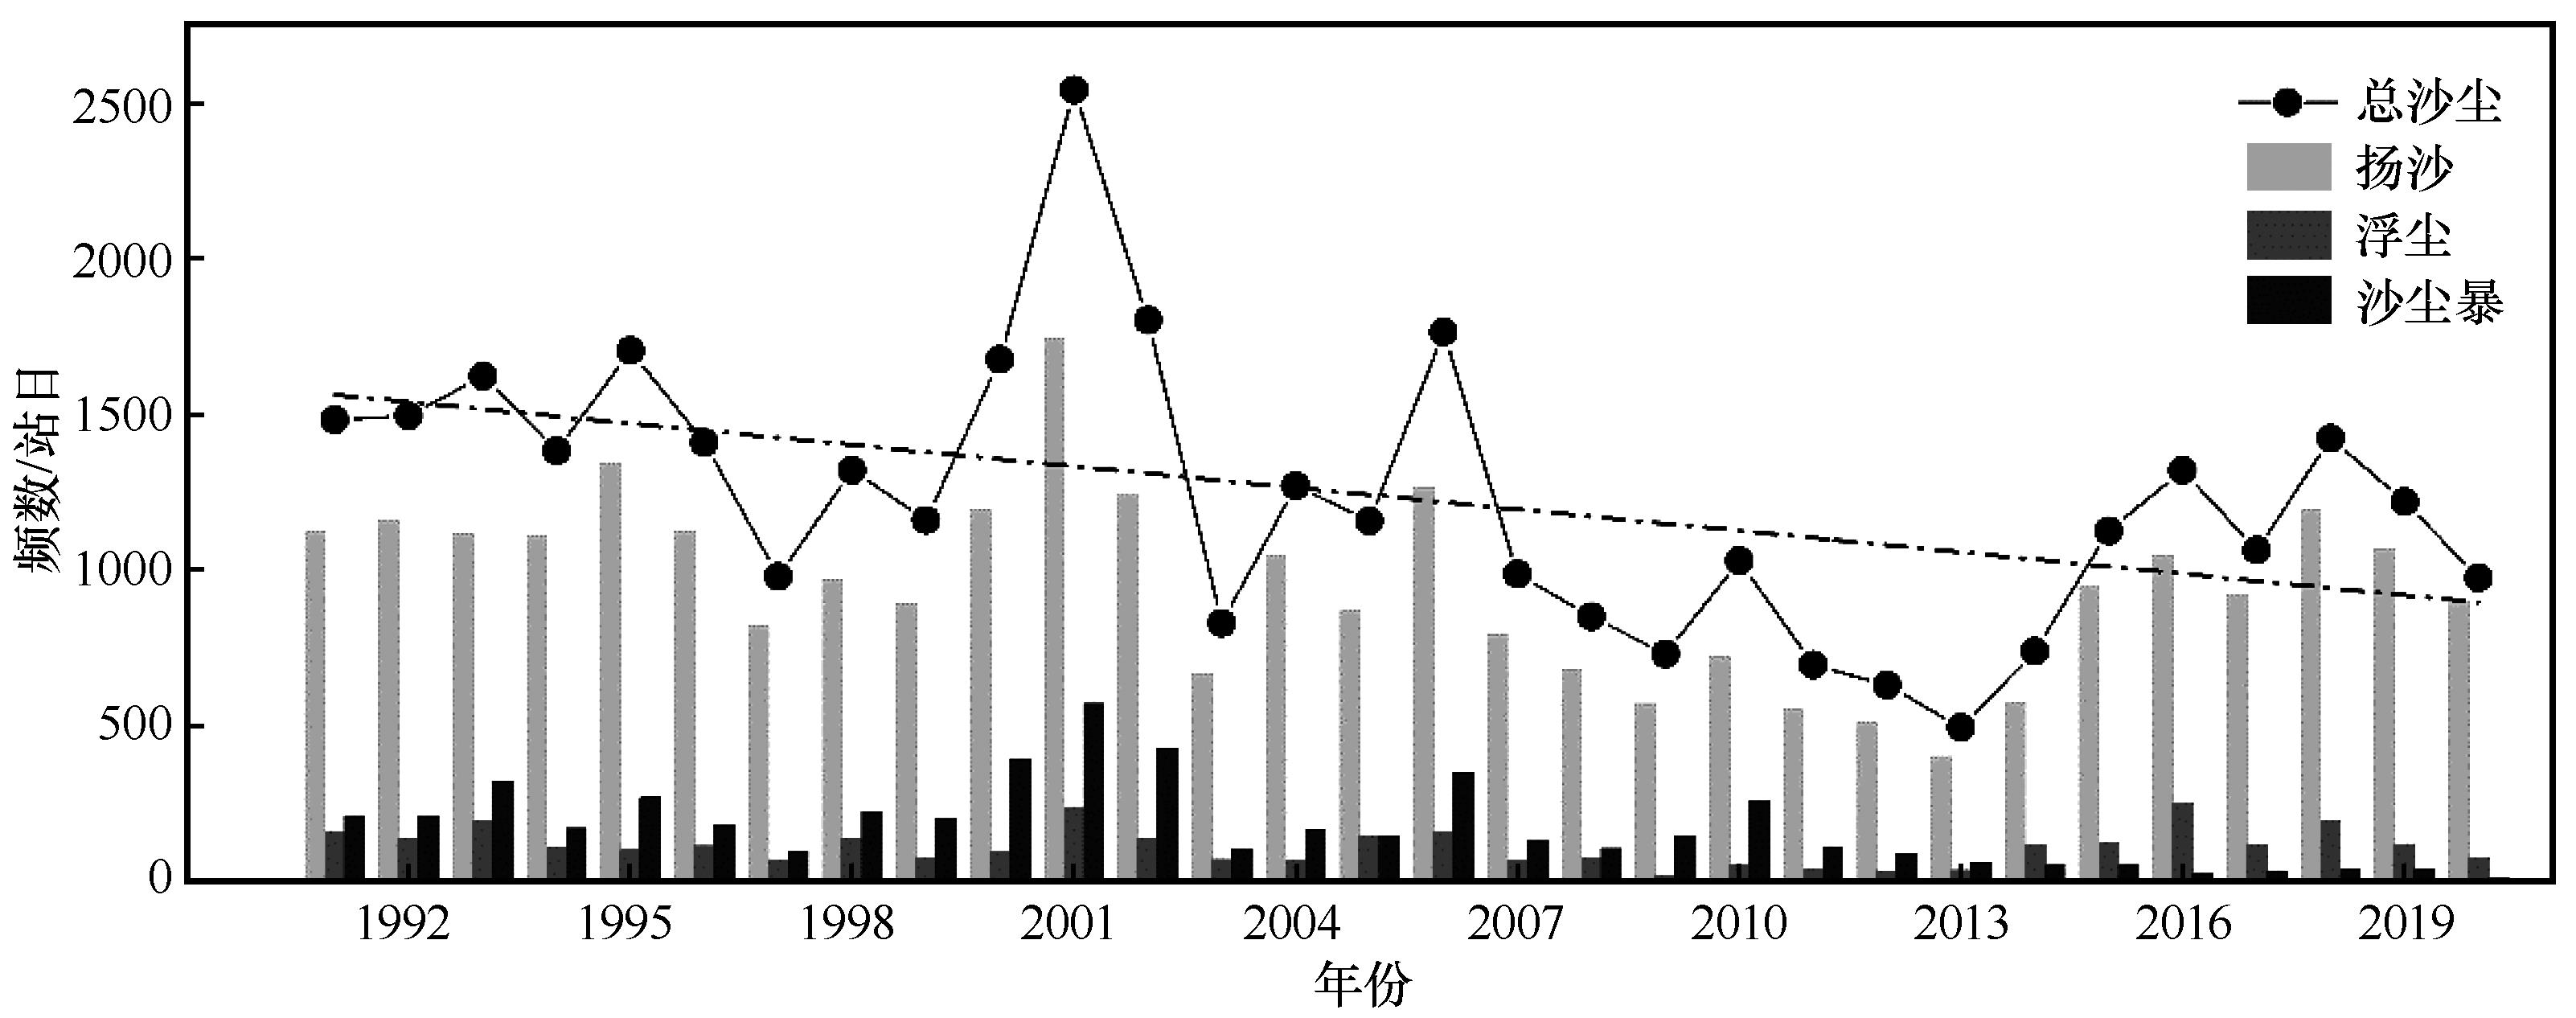
图3 内蒙古地区1991—2020年扬沙、浮尘、沙尘暴及总沙尘天气频数的时间变化(点划线为总沙尘天气频数的趋势线)
Fig.3 The time changes of frequency of sand lifting, dust floating, sandstorms and total dust weather in Inner Mongolia from 1991 to 2020, and the dotted line represents the trend of total dust weather frequency
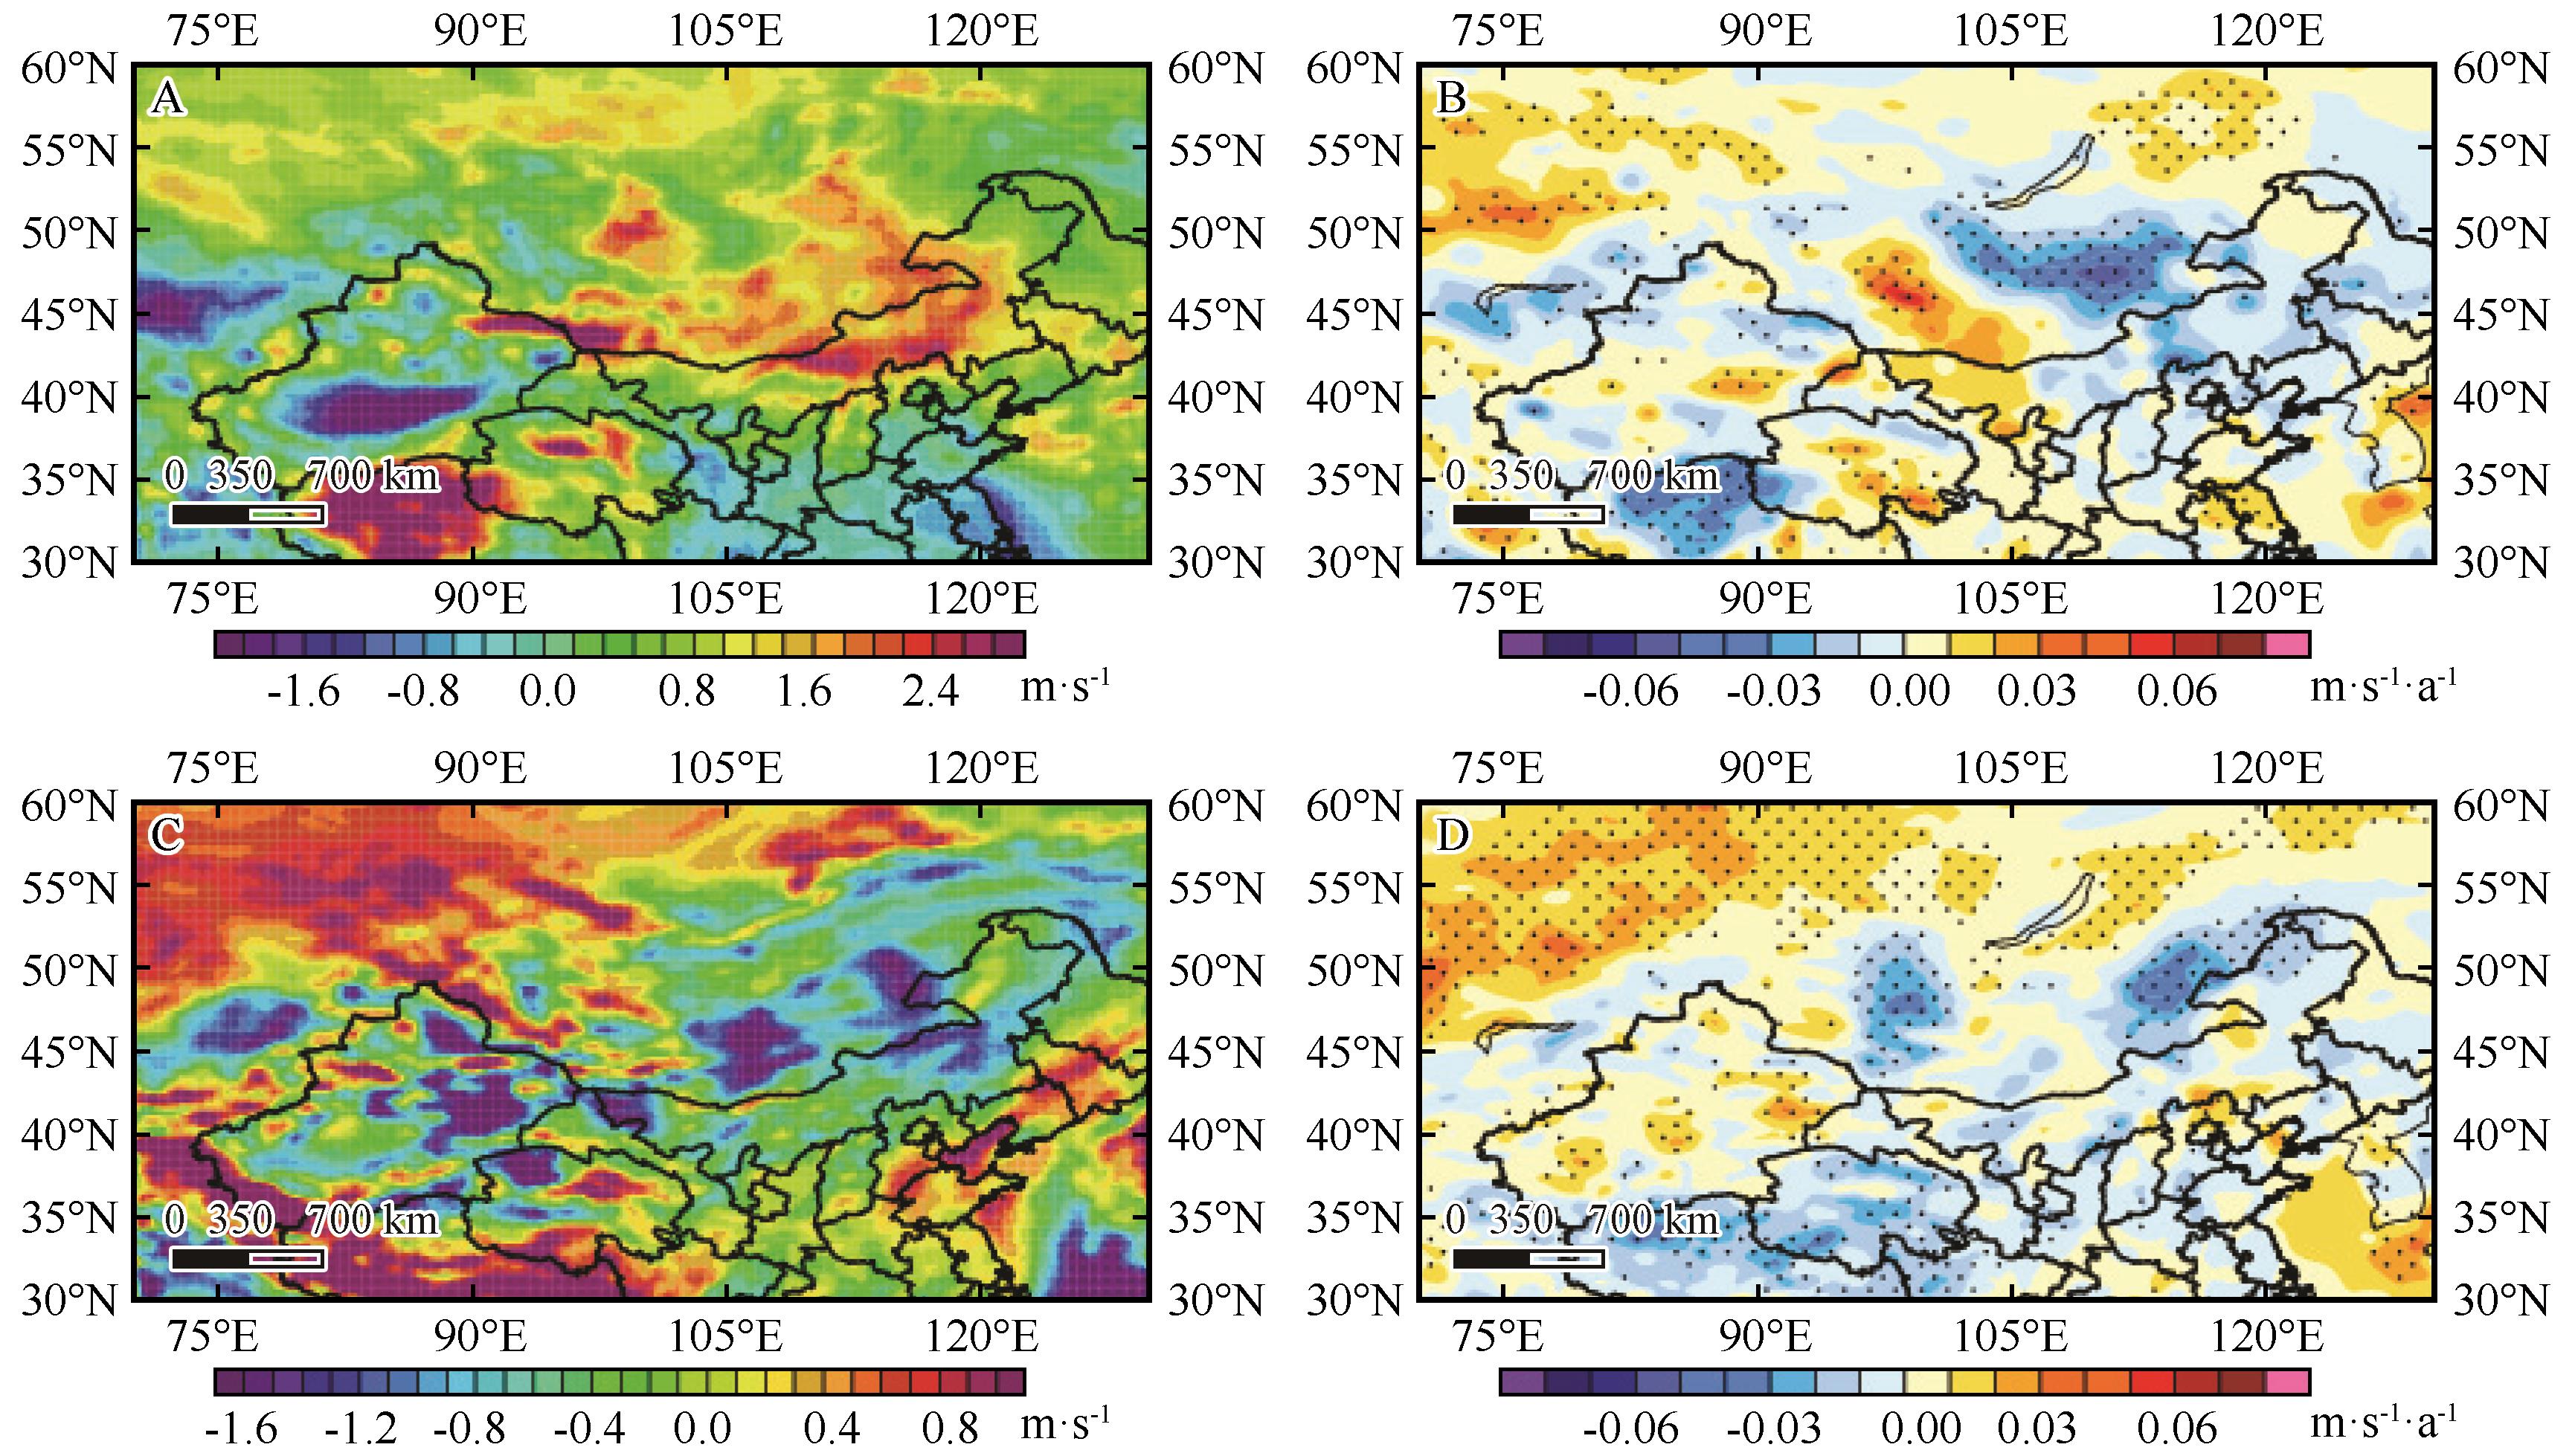
图4 1991—2020年内蒙古及周边地区春季平均纬向(A)和经向(C)10 m高度风速(单位:m·s-1)及纬向(B)和经向(D)气候态变率(单位:m·s-1·a-1)的空间分布(打点区域通过90%的信度检验)
Fig.4 Spatial distribution of zonal (A) and meridional (C) average wind speed at 10 m height and zonal (B) and meridional (D) climatic variability in spring in Inner Mongolia and surrounding areas from 1991 to 2020. The dotted area passed the 90% reliability test
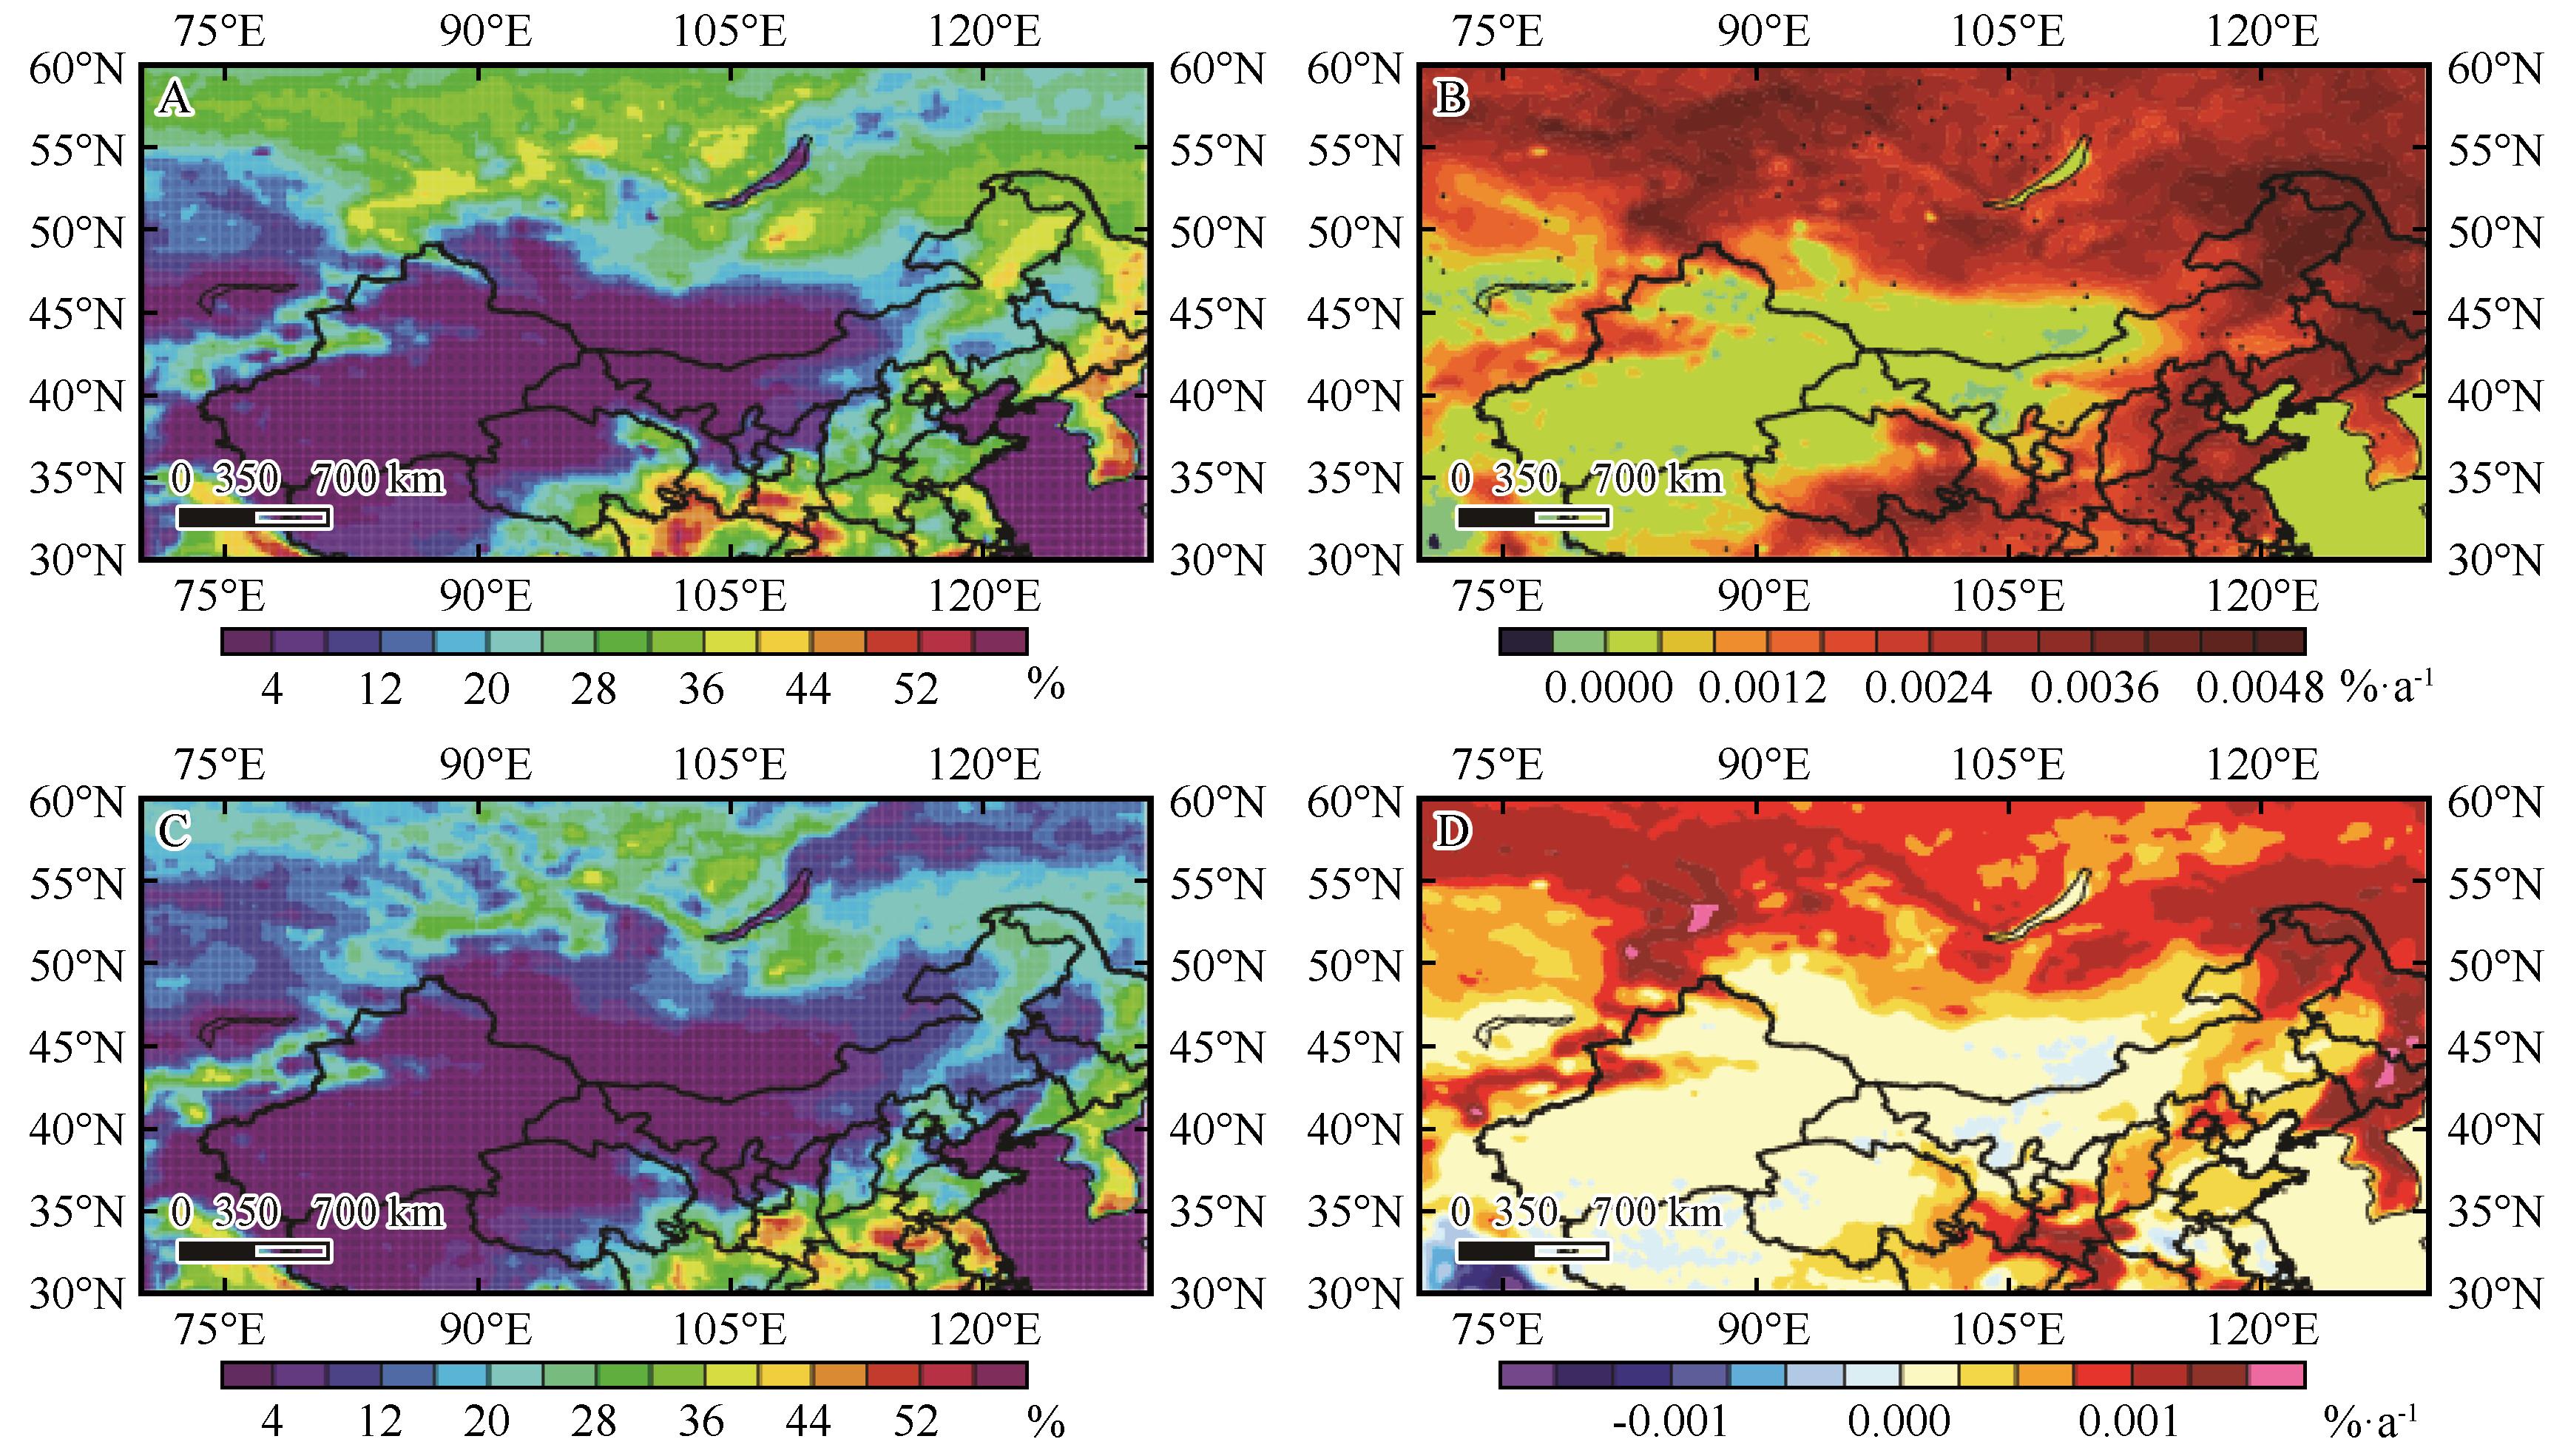
图5 1991—2020年内蒙古及周边地区年(A)、春季(C)平均植被覆盖率(%)及年(B)、春季(D)气候态变率(单位:%·a-1;打点区域通过90%的信度检验)
Fig.5 Spatial distribution of average vegetation coverage (unit: %) in year (A) and spring (C) and climatic variability (unit: %·a-1) in year (B) and spring (D) in Inner Mongolia and surrounding areas from 1991 to 2020. The dotted area passed the 90% reliability test
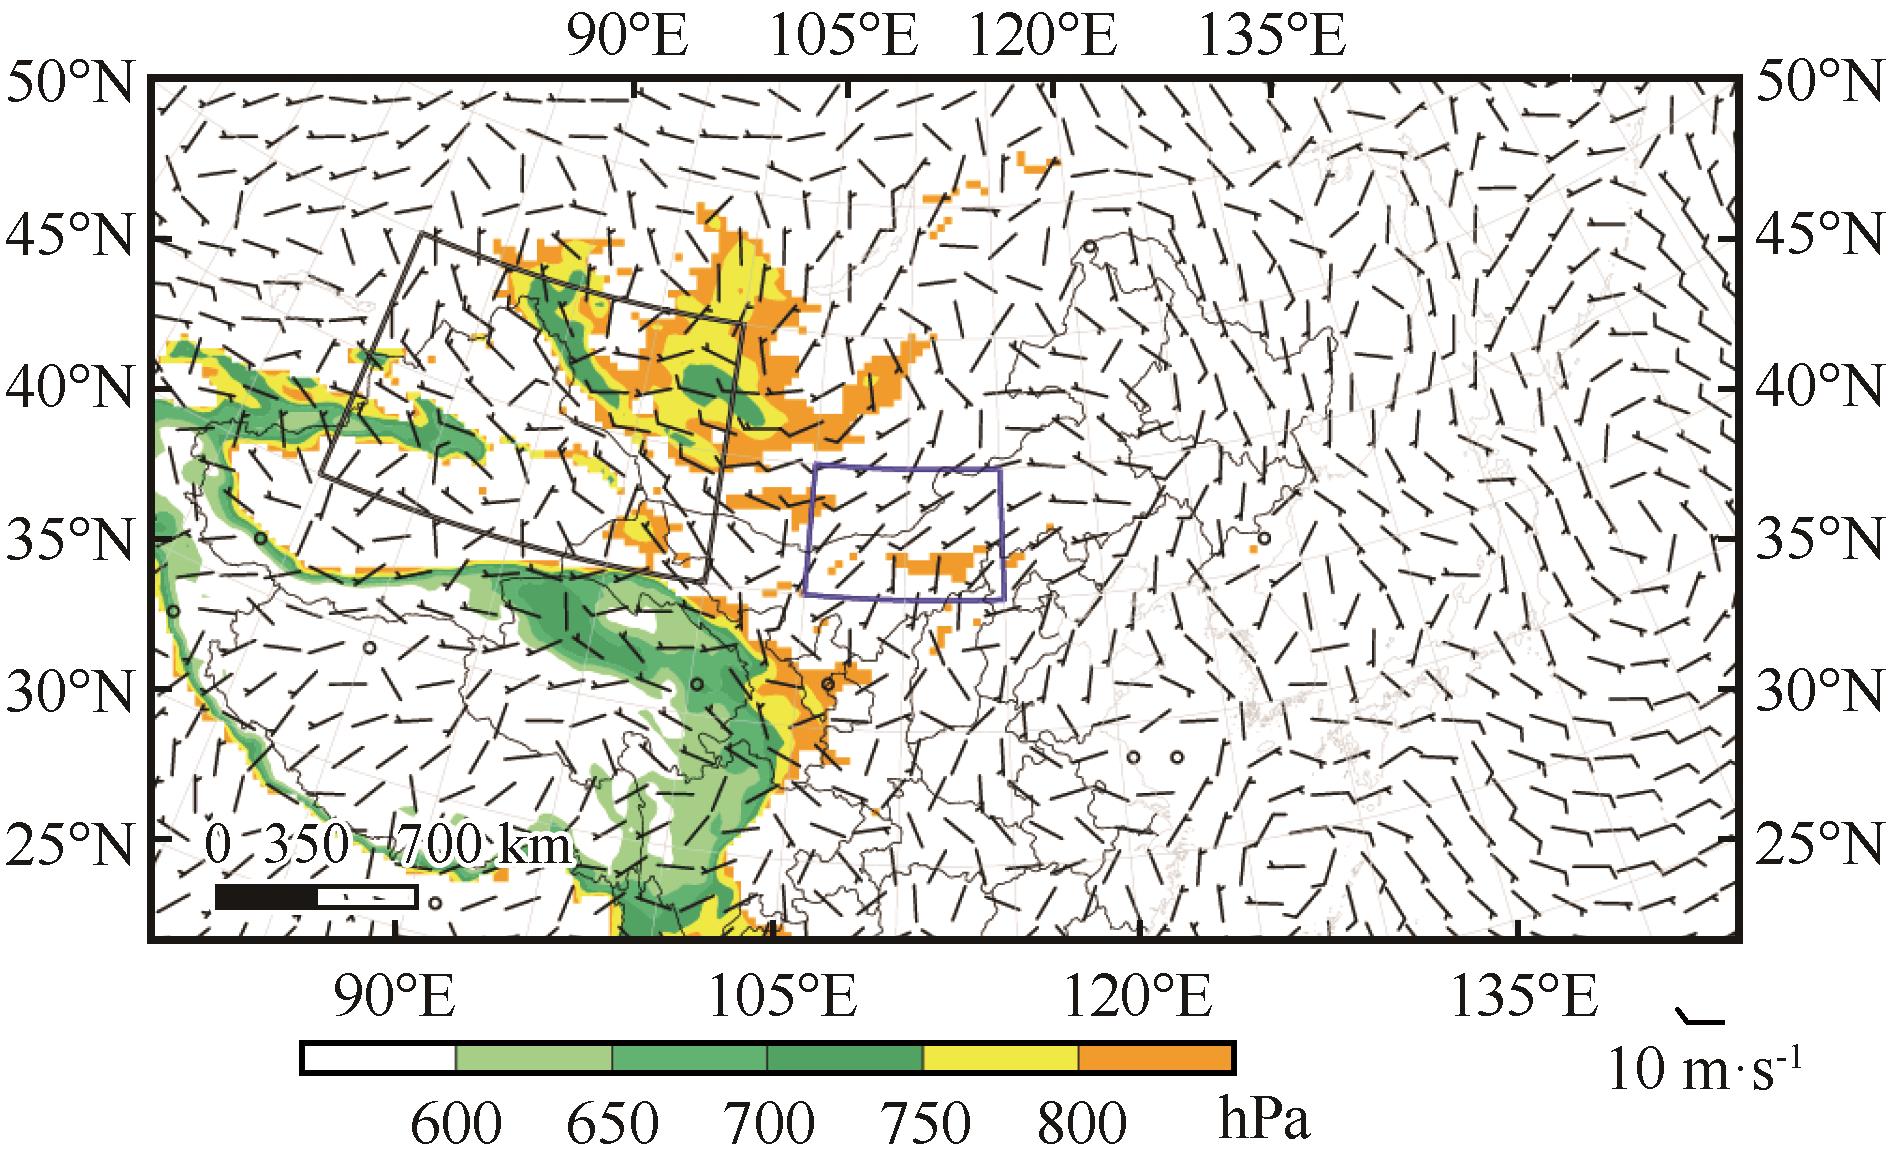
图6 模式初始时刻海平面气压场(单位:hPa)与地面风场(单位:m·s-1)。黑色矩形框为模拟试验修改风速的区域,蓝色矩形框为模拟试验修改植被覆盖率的区域
Fig.6 The sea level pressure field (unit: hPa) and wind field (unit: m·s-1) at the initial moment of the model. The black rectangular box area represents the windy area which was modified in sensitivity experiments, and the blue recta-ngular box area represents the vegetation cover was modified by the simulation experiment
| 植被覆盖率敏感性 试验分组 | 植被覆盖率 变化方案 | 风速敏感性 试验分组 | 风速变化 方案 |
|---|---|---|---|
| casev1 | +5% | casew1 | -20% |
| casev2 | +10% | casew2 | -30% |
| casev3 | +15% | casew3 | -40% |
| casev4 | +20% | casew4 | -50% |
表1 敏感性试验分组
Table 1 Subgroup of sensitivity experiments
| 植被覆盖率敏感性 试验分组 | 植被覆盖率 变化方案 | 风速敏感性 试验分组 | 风速变化 方案 |
|---|---|---|---|
| casev1 | +5% | casew1 | -20% |
| casev2 | +10% | casew2 | -30% |
| casev3 | +15% | casew3 | -40% |
| casev4 | +20% | casew4 | -50% |
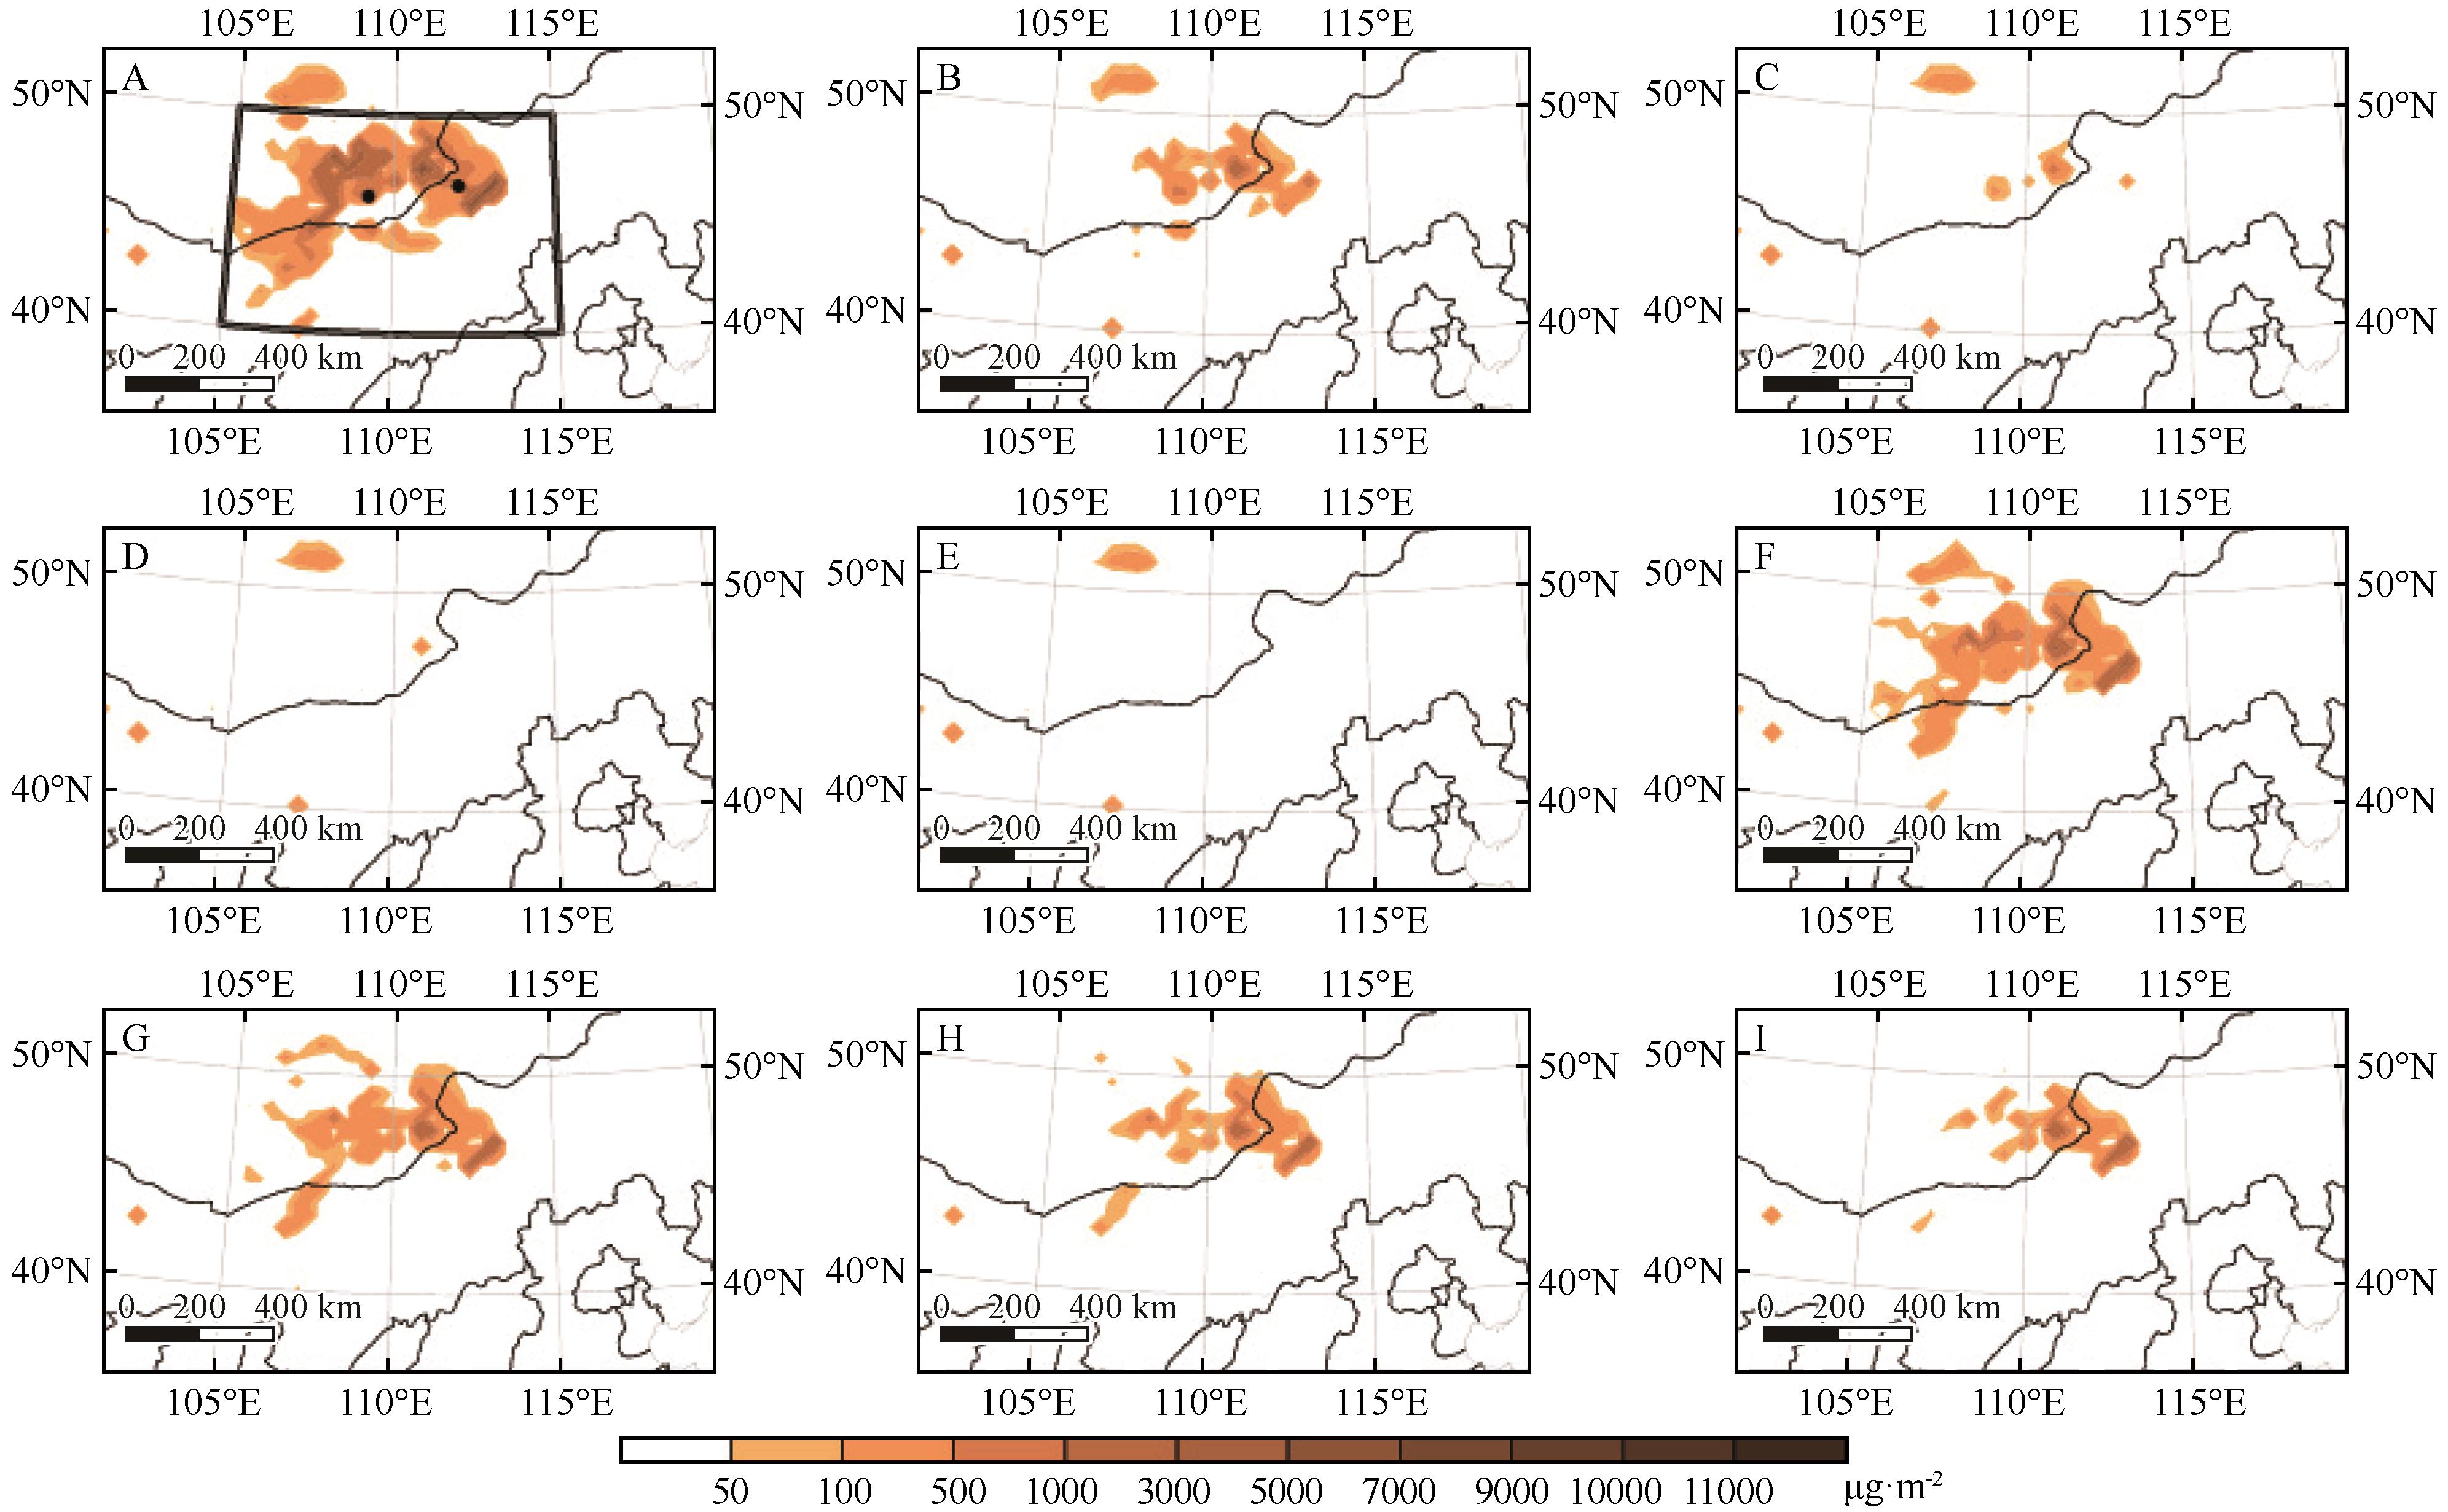
图7 2019年5月15日04:00实际(A)及casev1(B)、casev2(C)、casev3(D)、casev4(E)、casew1(F)、casew2(G)、casew3(H)、casew4(I)模拟起沙量(单位:μg·m-2)的空间分布。黑色矩形框为此次沙尘过程的沙源地,黑色圆点分别表示蒙古国南部站点(43.12°N,109.21°E)和二连浩特(43.39°N,112.00°E)
Fig.7 The spatial distribution of actual sand emission (A) and sand emission (unit: μg·m-2) simulated by casev1 (B), casev2 (C), casev3 (D), casev4 (E), casew1 (F), casew2 (G), casew3 (H), casew4 (I) at 04:00 on May 15, 2019. The black rectangular box area is sand source, and the black dots indicate the southern site of Mongolia (43.12°N,109.21°E) and Erenhot (43.39°N,112.00°E)
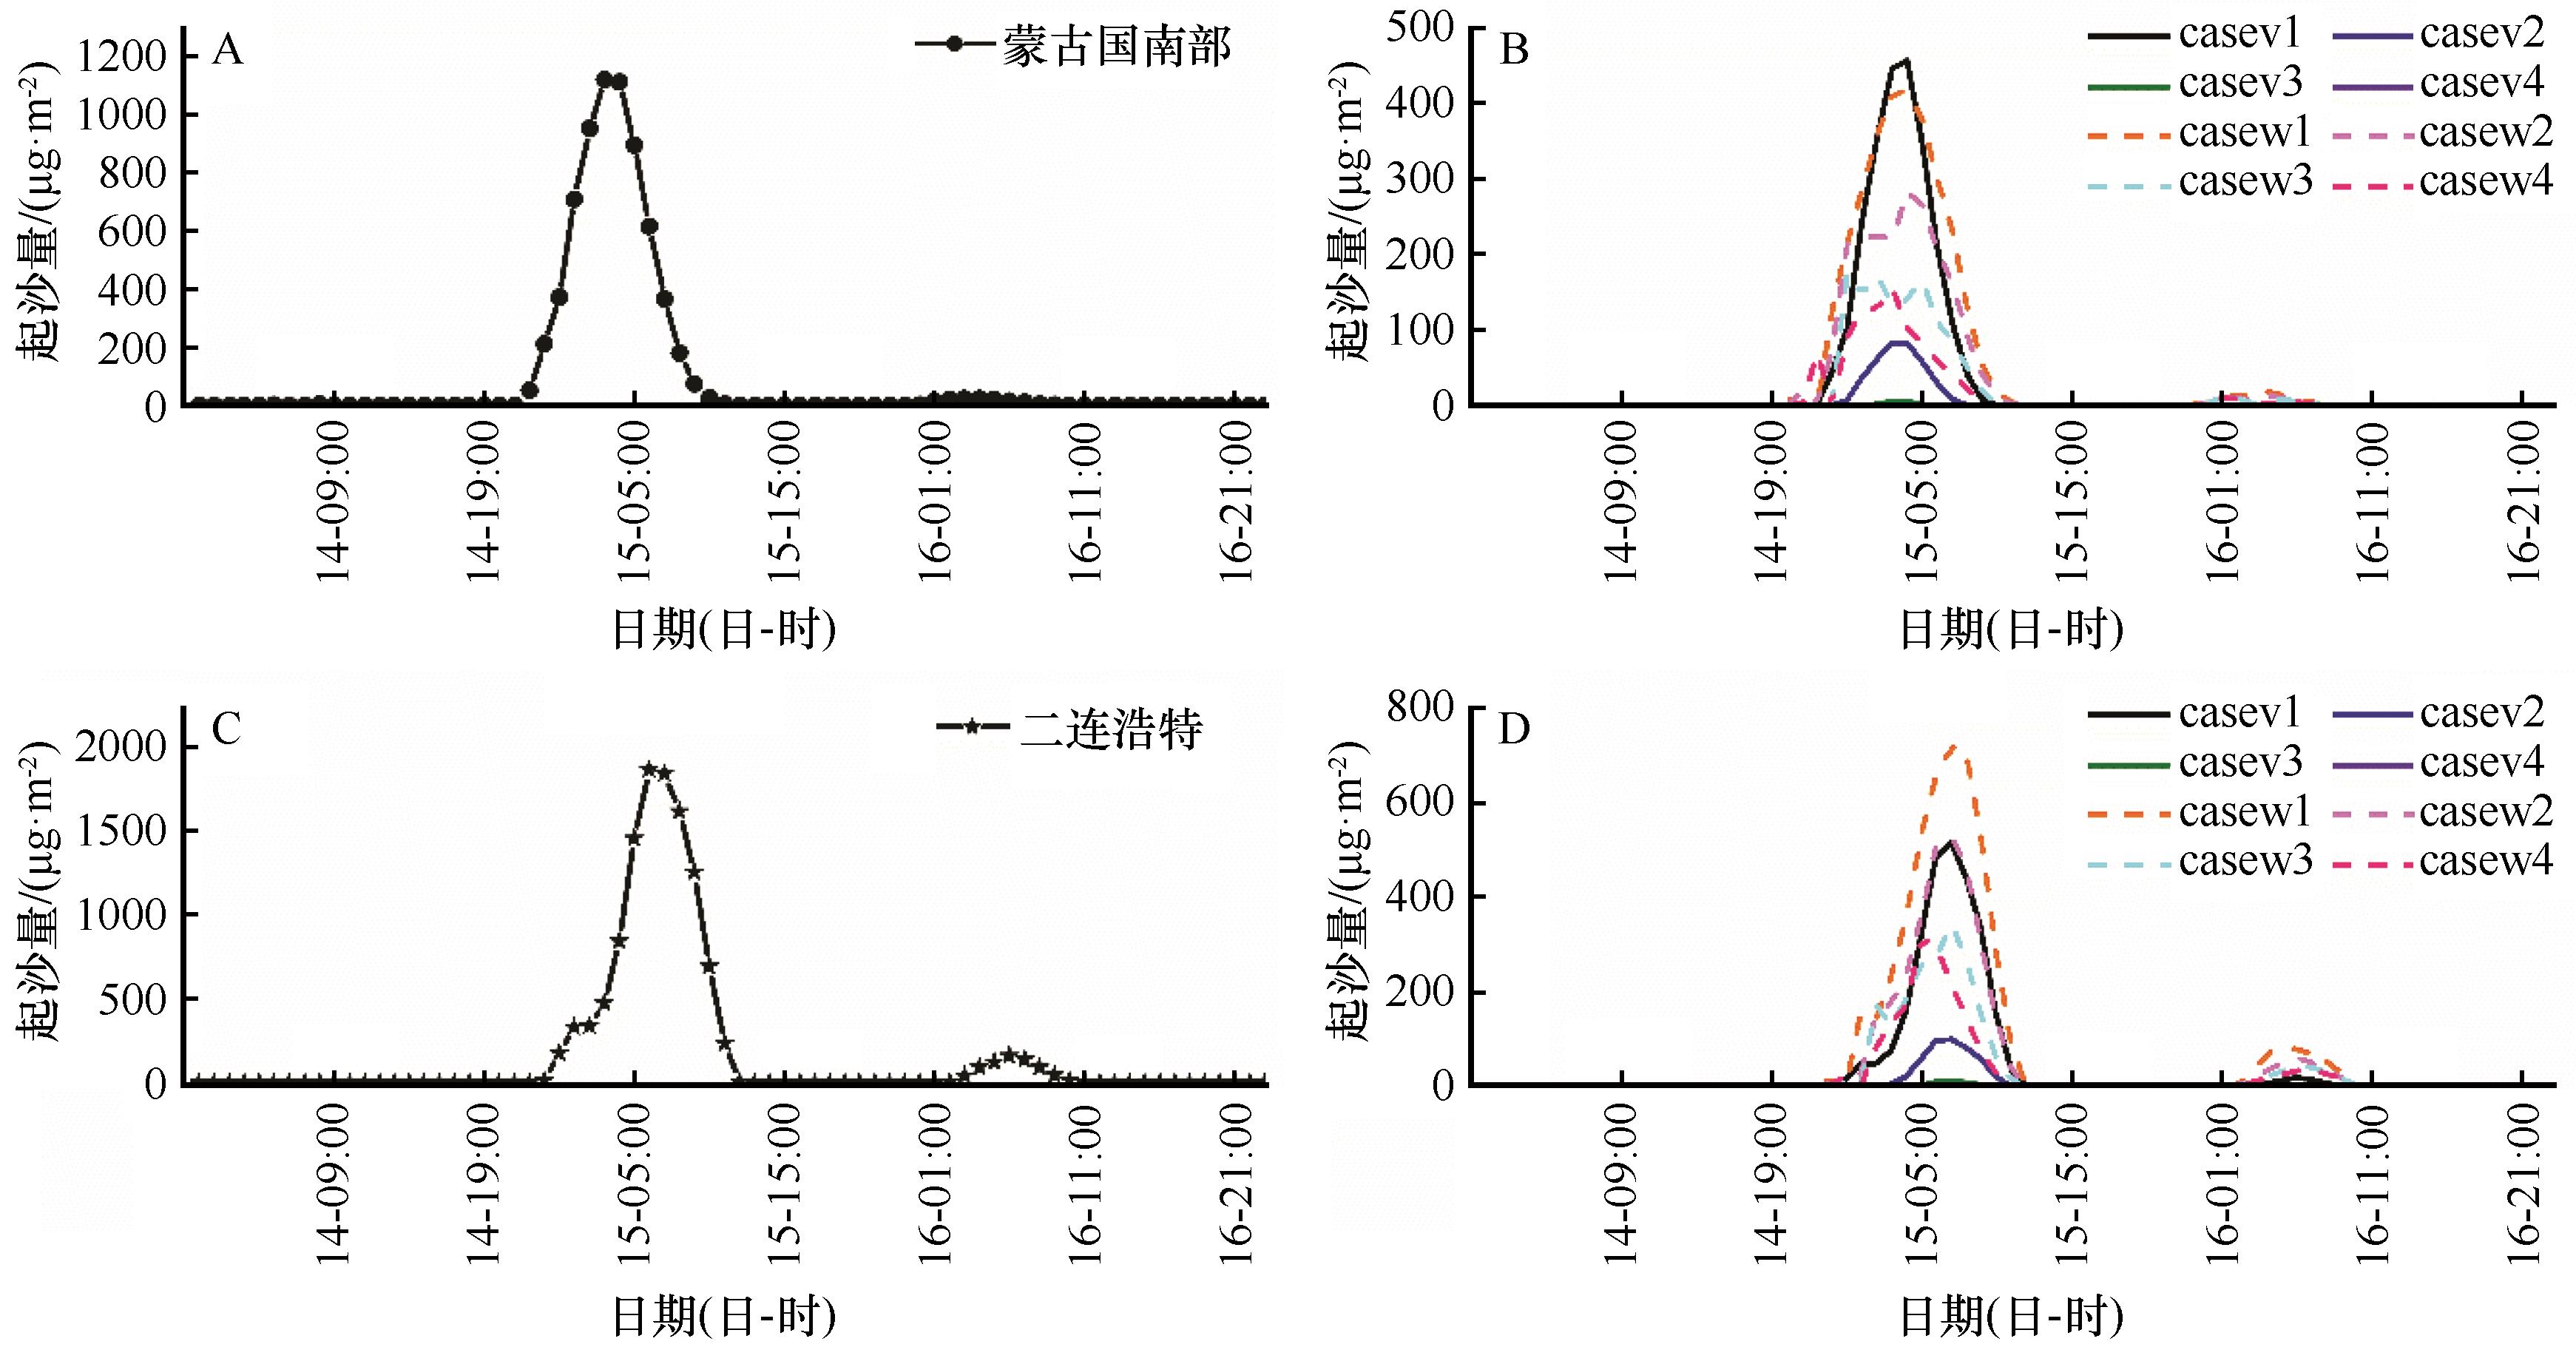
图8 蒙古国南部(A)、二连浩特(C)实际起沙量和模拟的不同植被、不同风速下蒙古国南部(B)、二连浩特(D)起沙量
Fig.8 The actual sand emission of southern Mongolia (A) and Erenhot (C), and the simulated sand emission of southern Mongolia (B) and Erenhot (D)
| 分组 | 蒙古国南部 | 二连浩特(第一次) | 二连浩特(第二次) | |||||
|---|---|---|---|---|---|---|---|---|
| 总起沙量/(μg·m-2) | 削减率% | 总起沙量/(μg·m-2) | 削减率/% | 总起沙量/(μg·m-2) | 削减率/% | |||
| 实际 | 6 673.8 | — | 11 145.0 | — | 722.3 | — | ||
| casev1 | 2 362.8 | 64.6 | 2 634.8 | 76.4 | 63.4 | 91.2 | ||
| casev2 | 365.5 | 94.5 | 444.0 | 96.0 | 0.0 | 100.0 | ||
| casev3 | 13.9 | 99.8 | 38.6 | 99.7 | 0.0 | 100.0 | ||
| casev4 | 0.0 | 100.0 | 0.0 | 100 | 0.0 | 100.0 | ||
| casew1 | 2 918.7 | 56.3 | 4 419.1 | 60.3 | 417.9 | 42.1 | ||
| casew2 | 2 013.6 | 69.8 | 2 938.5 | 73.6 | 270.8 | 62.5 | ||
| casew3 | 1 199.2 | 82.0 | 1 869.8 | 83.2 | 199.1 | 72.4 | ||
| casew4 | 884.5 | 86.7 | 1 502.7 | 86.5 | 170.5 | 76.4 | ||
表2 蒙古国南部与二连浩特总起沙量和植被、风速对总起沙量的削减率
Table 2 Total sand emission and the reduction of total sand emission by vegetation and wind in southern Mongolia and Erenhot in different sensitivity experiments
| 分组 | 蒙古国南部 | 二连浩特(第一次) | 二连浩特(第二次) | |||||
|---|---|---|---|---|---|---|---|---|
| 总起沙量/(μg·m-2) | 削减率% | 总起沙量/(μg·m-2) | 削减率/% | 总起沙量/(μg·m-2) | 削减率/% | |||
| 实际 | 6 673.8 | — | 11 145.0 | — | 722.3 | — | ||
| casev1 | 2 362.8 | 64.6 | 2 634.8 | 76.4 | 63.4 | 91.2 | ||
| casev2 | 365.5 | 94.5 | 444.0 | 96.0 | 0.0 | 100.0 | ||
| casev3 | 13.9 | 99.8 | 38.6 | 99.7 | 0.0 | 100.0 | ||
| casev4 | 0.0 | 100.0 | 0.0 | 100 | 0.0 | 100.0 | ||
| casew1 | 2 918.7 | 56.3 | 4 419.1 | 60.3 | 417.9 | 42.1 | ||
| casew2 | 2 013.6 | 69.8 | 2 938.5 | 73.6 | 270.8 | 62.5 | ||
| casew3 | 1 199.2 | 82.0 | 1 869.8 | 83.2 | 199.1 | 72.4 | ||
| casew4 | 884.5 | 86.7 | 1 502.7 | 86.5 | 170.5 | 76.4 | ||
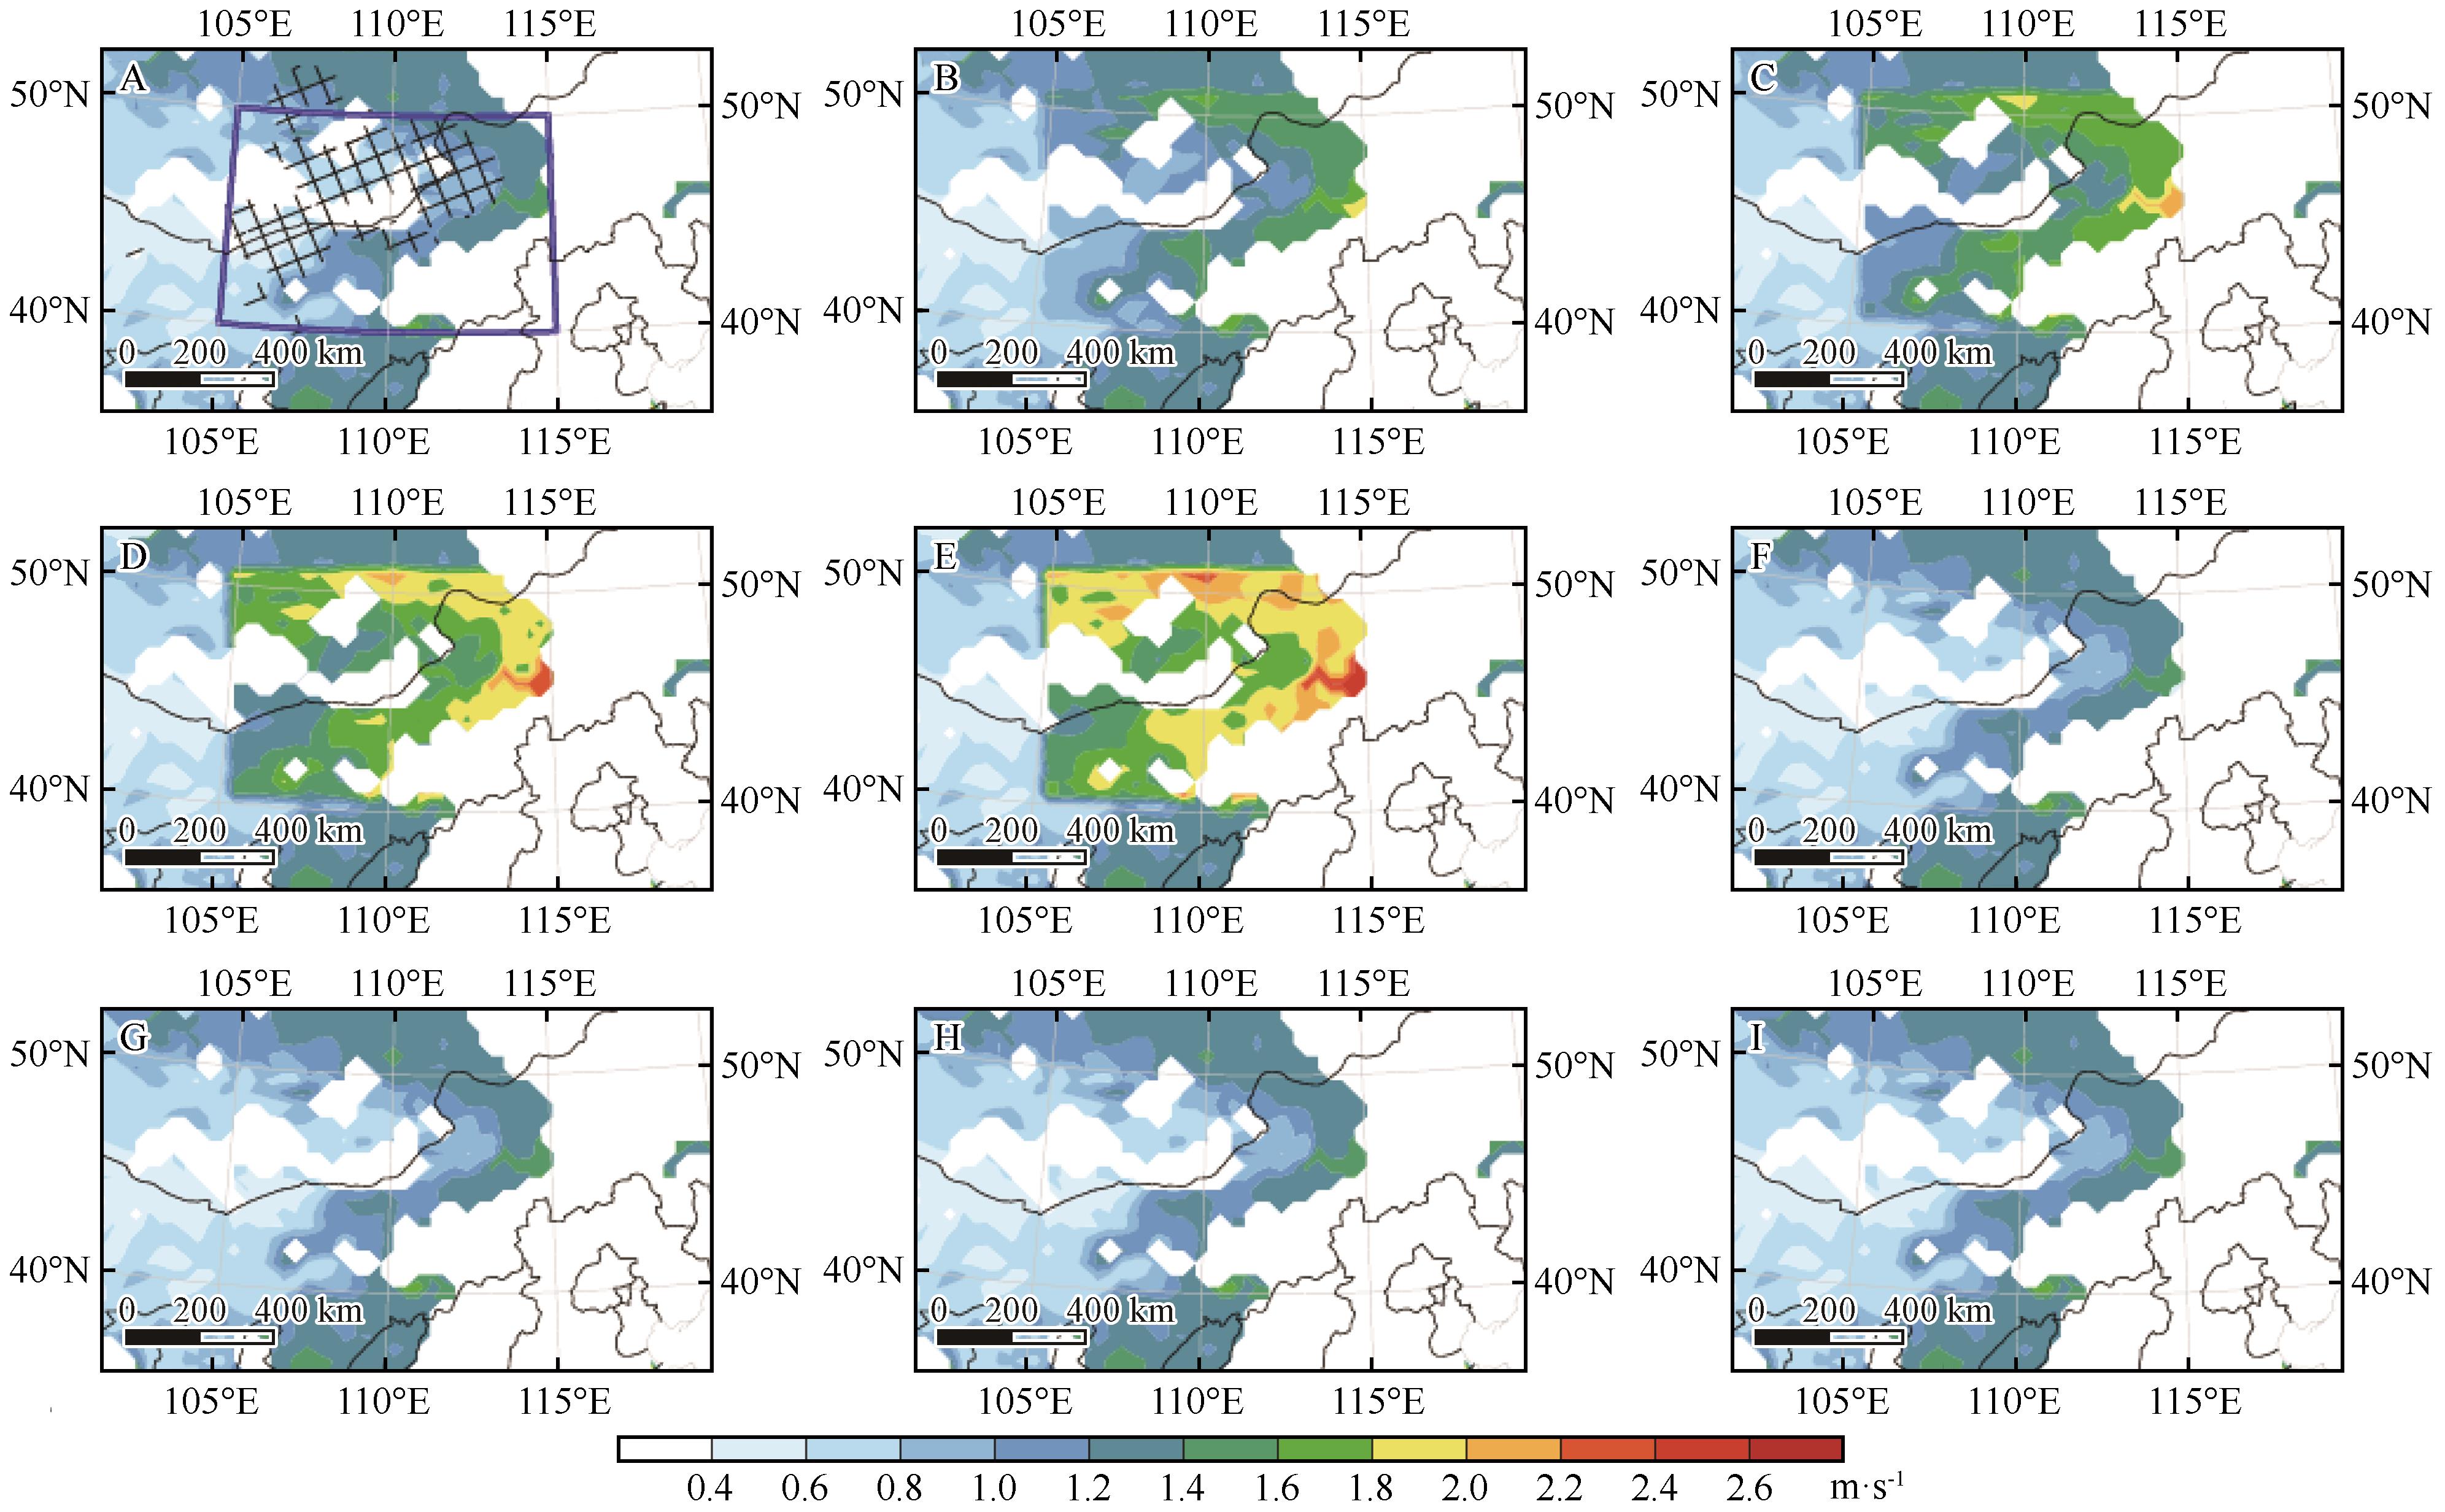
图9 5月15日04:00实际(A)及植被、风速敏感性试验中casev1(B)、casev2(C)、casev3(D)、casev4(E)、casew1(F)、casew2(G)、casew3(H)、casew4(I)对应的临界摩擦速度的空间分布。栅格表示该时刻沙尘的起沙量在50~3 000 μg·m-2,蓝色框表示此次过程的沙源地
Fig.9 The spatial distribution of actual critical friction velocity (A) and critical friction velocity simulated by casev1 (B), casev2 (C), casev3 (D), casev4 (E), casew1 (F), casew2 (G), casew3 (H), casew4 (I) at 04:00 on May 15. The black grid area indicates sand emission flux is 50-3 000 μg·m-2. The blue box area indicates the sand source of the process
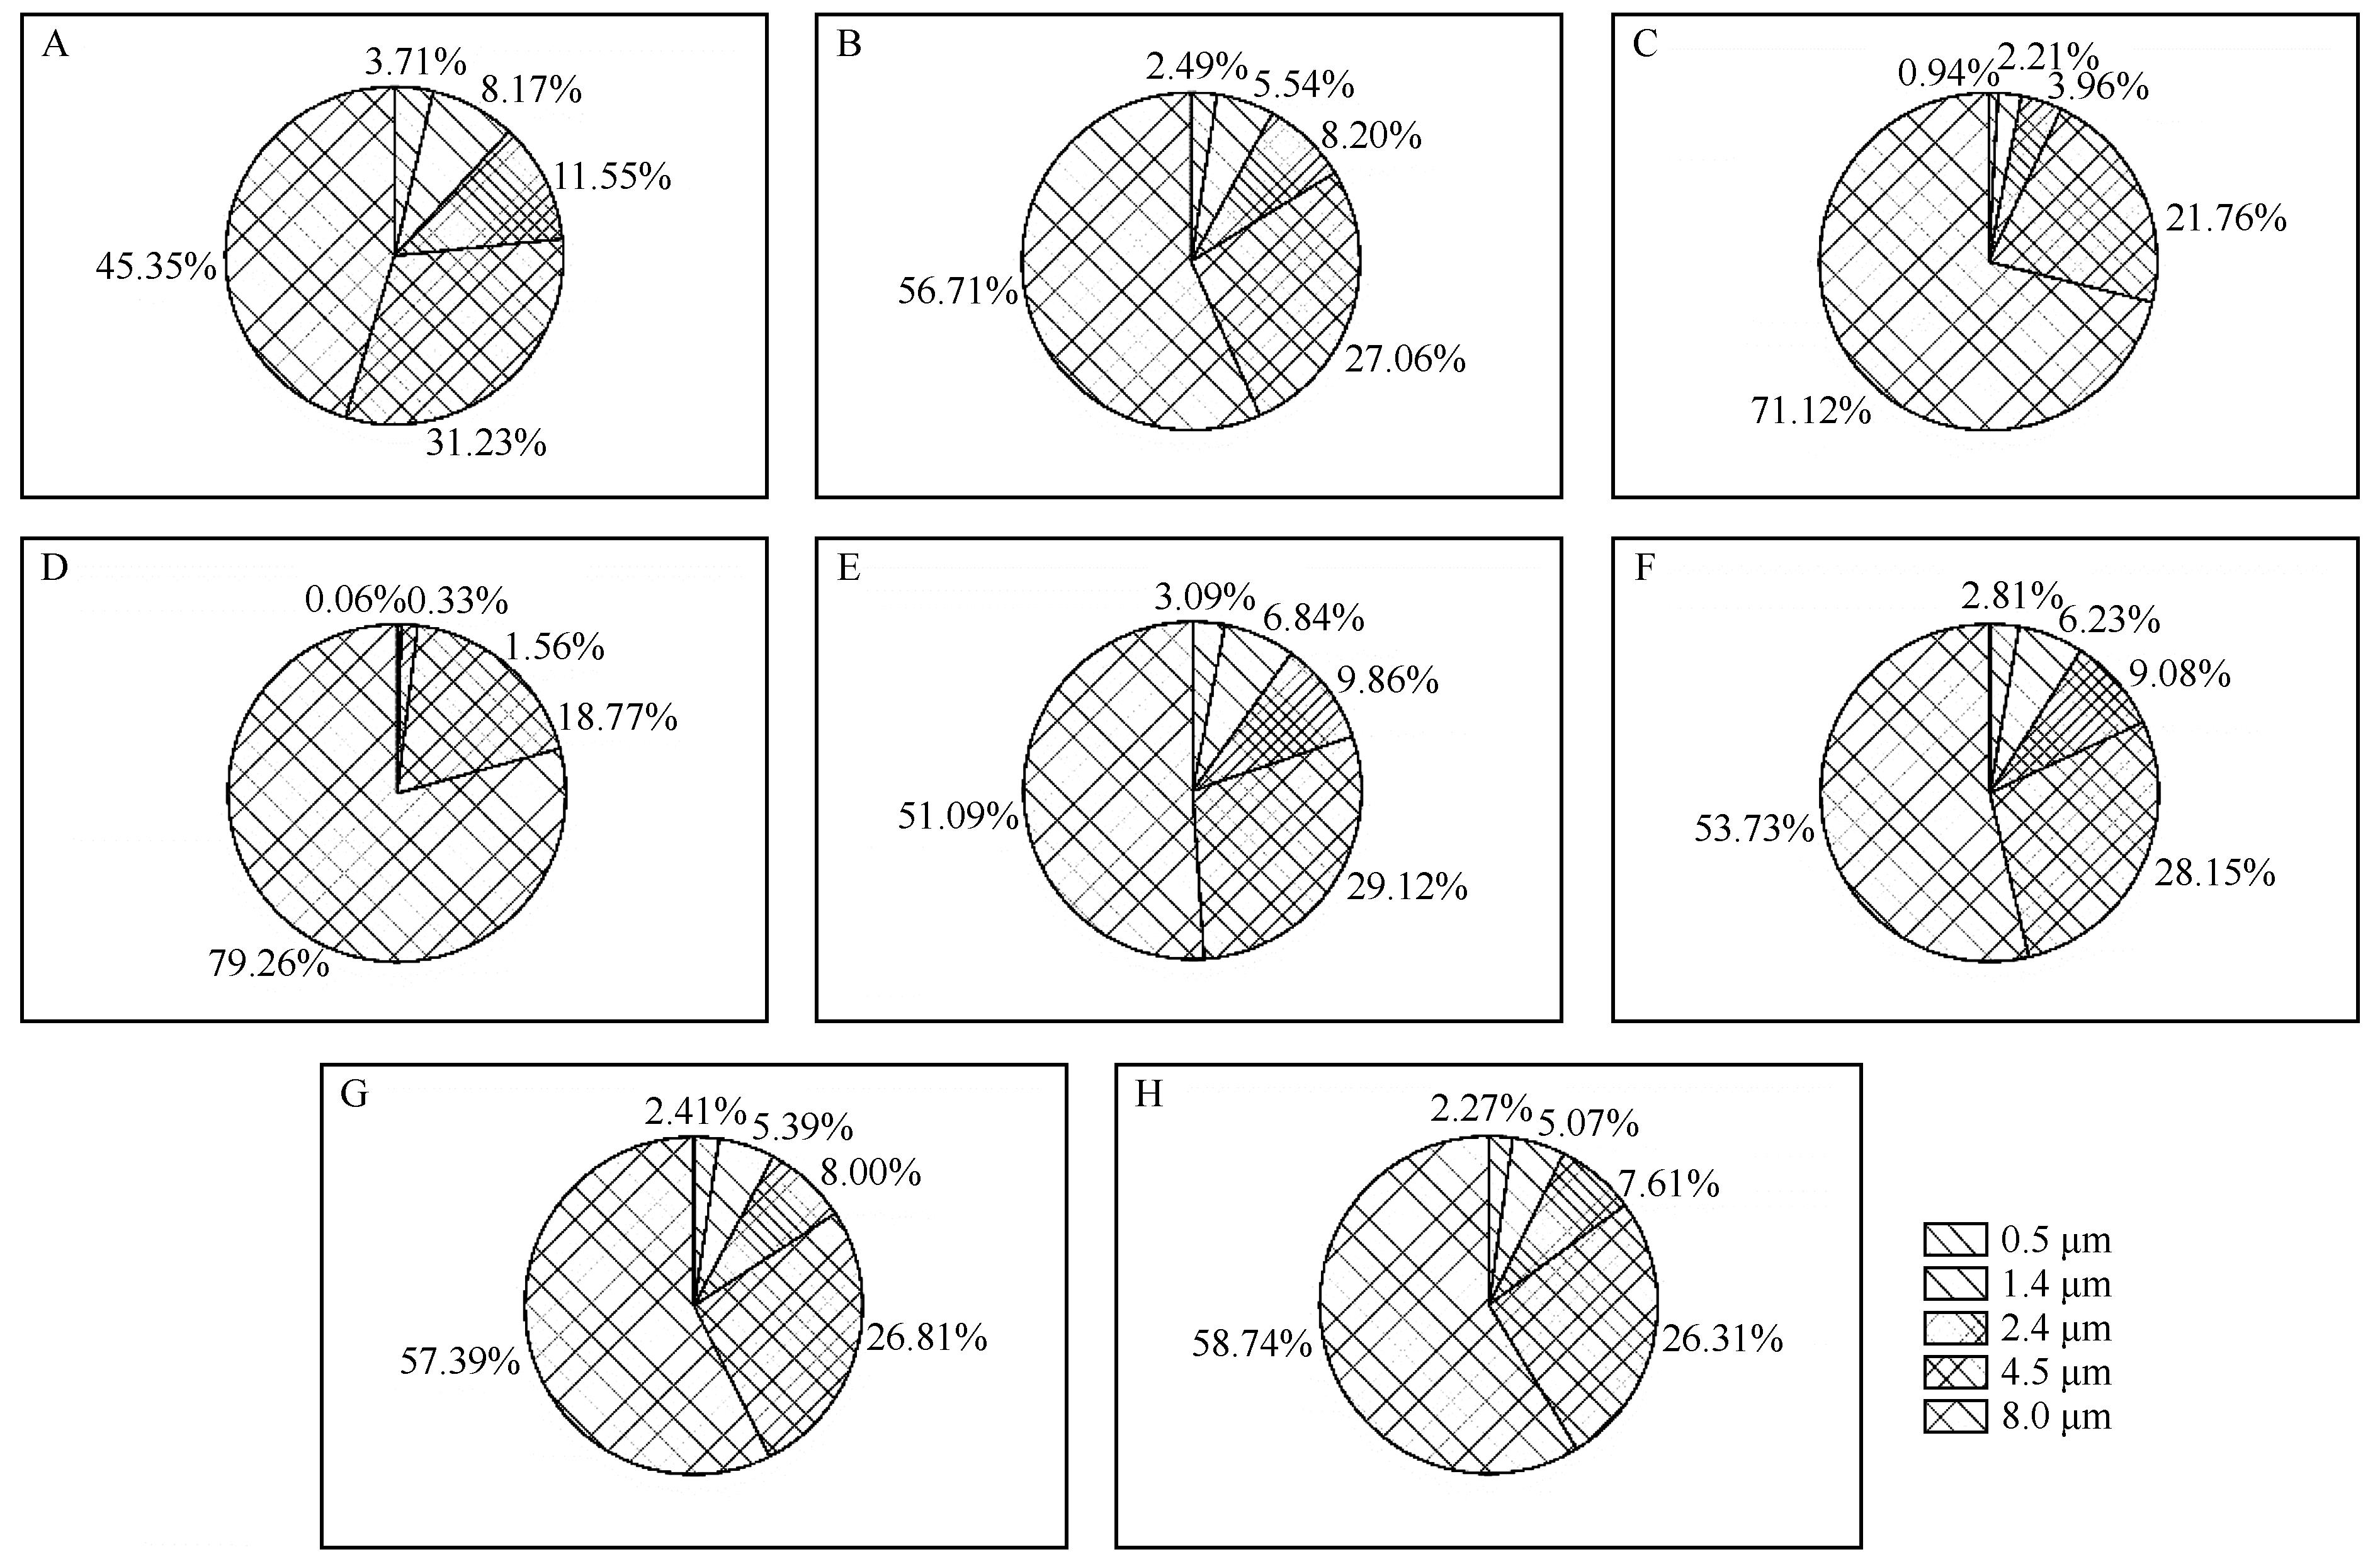
图10 沙源地二连浩特不同粒径对起沙量的实际贡献率(A)及植被、风速敏感性试验中casev1 (B)、casev2 (C)、casev3 (D)、casew1 (E)、casew2 (F)、casew3 (G)、casew4 (H)模拟的贡献率
Fig.10 The actual contribution rate (A) of different particle sizes to the sand emission in Erenhot and contribution rates simulated by casev1 (B), casev2 (C), casev3 (D), casew1 (E), casew2 (F), casew3 (G), casew4 (H)
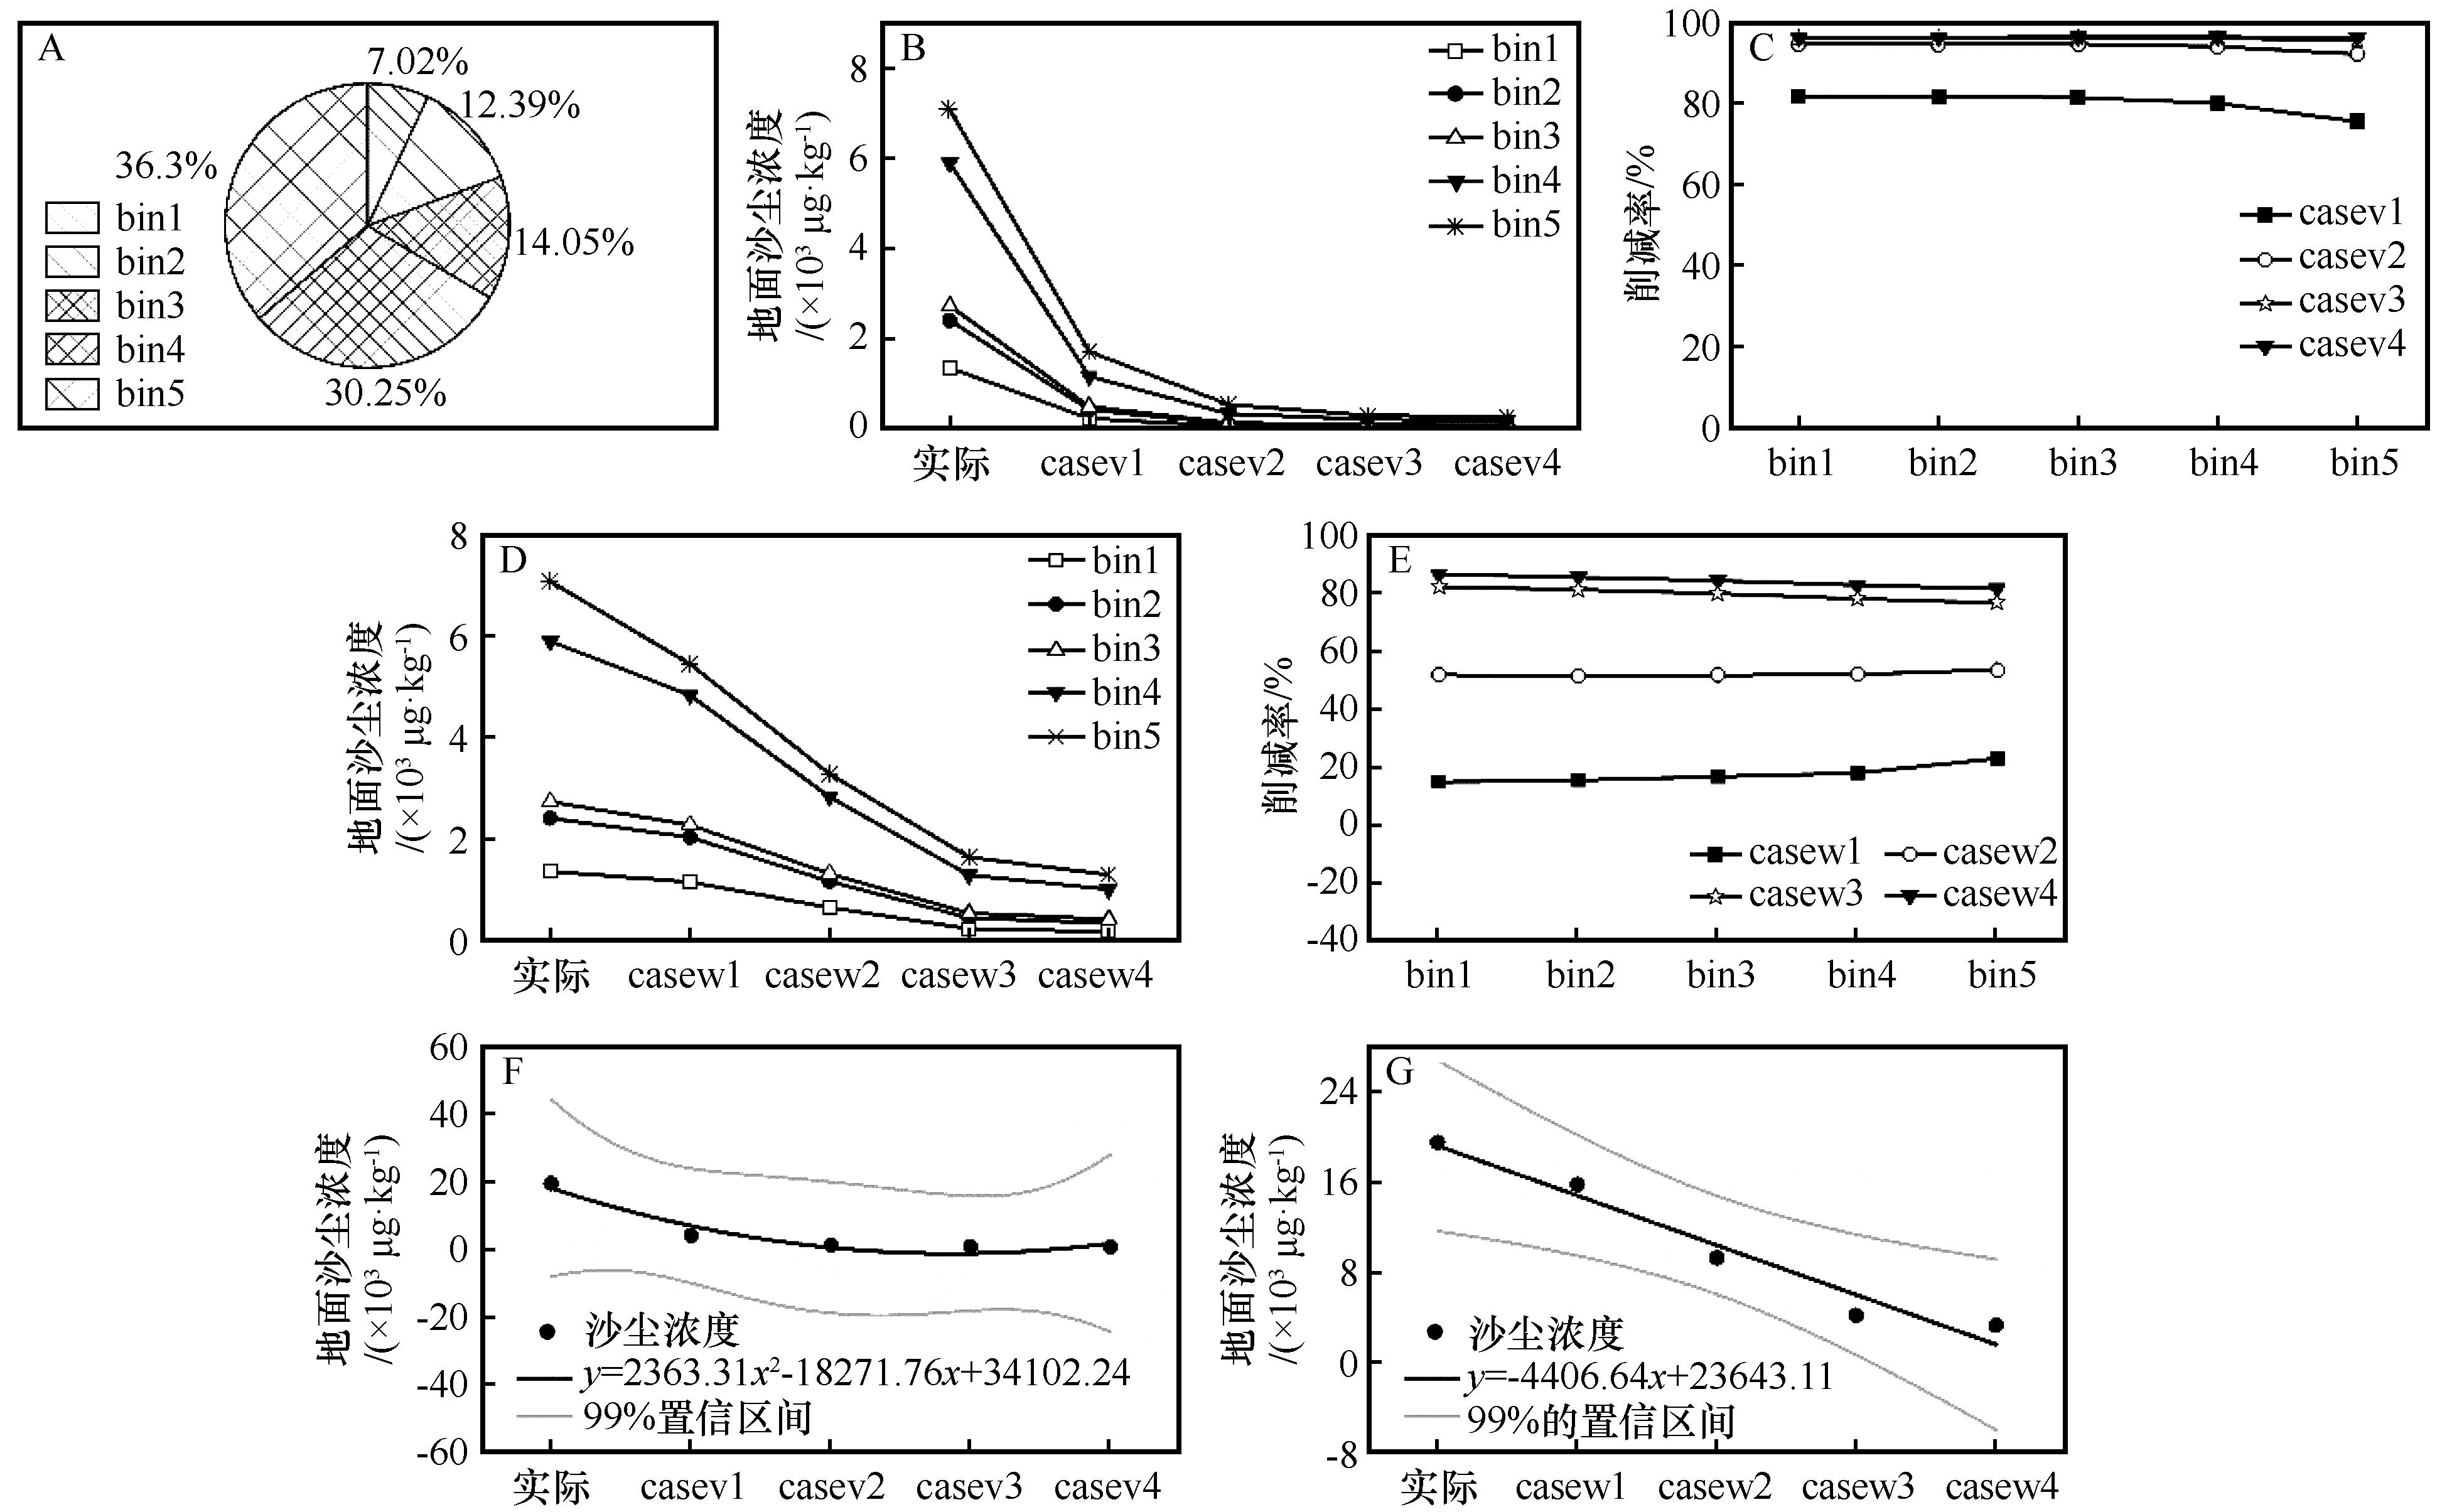
图11 沙源地下游白城站不同粒径沙粒对地面沙尘浓度的实际贡献率(A),植被覆盖率(B)和风速(D)敏感性试验中不同粒径的浓度,植被覆盖率(C)和风速(E)对不同粒径浓度的削减率及植被覆盖率(F)和风速(G)与地面沙尘浓度的拟合
Fig.11 The actual contribution rate of different sizes particle to the surface sand concentration (A) in Baicheng Station in downstream of the sand source, the concentration of different sizes particle in different vegetation coverage (B) and wind speed (D) sensitivity tests, the concentrations reduction rate of vegetation coverage (C) and wind speed (E) to different sizes particle, and fitting of surface sand concentrations in different vegetation coverage (F) and wind speed (G) sensitivity experiments
| 1 | 陈亿,尚可政,王式功,等.21世纪初中国北方沙尘天气特征及其与地面风速和植被的关系研究[J].中国沙漠,2012,32(6):1702-1709. |
| 2 | 钱正安,蔡英,刘景涛,等.中蒙地区沙尘暴研究的若干进展[J].地球物理学报,2006,49(1):83-92. |
| 3 | 李宽,熊鑫,王海兵,等.内蒙古西部高频沙尘活动空间分布及其成因[J].干旱区研究,2019,36(3):657-663. |
| 4 | 魏巍,张稳定,陈焕盛,等.库布齐沙漠治理对京津冀地区空气质量影响:2017年 5月3-6日沙尘天气模拟[J].中国沙漠,2020,40(1):77-87. |
| 5 | 王春学,秦宁生.中国北方春季沙尘暴周期变化特征及其对最大风速的响应[J].水土保持研究,2018,25(3):133-141. |
| 6 | 张莉,任国玉.中国北方沙尘暴频数演化及其气候成因分析[J].气象学报,2003,61(6):744-750. |
| 7 | 曹晓云,肖建设,乔斌,等.1961-2019 年柴达木盆地沙尘强度时空变化特征[J].干旱气象,2021,39(1):46-53. |
| 8 | 赵剑琦.中国北方沙尘过程及未来气候变化情景下起沙通量的数值模拟研究[D].南京:南京信息工程大学,2021. |
| 9 | 段海霞,赵建华,李耀辉.2011年春季中国北方沙尘天气过程及其成因[J].中国沙漠,2013,33(1):179-186. |
| 10 | 王学强,迎春,玉刚,等.气象因子与锡林郭勒盟地区沙尘天气的关系[J].农业灾害研究,2015,5(12):24-26. |
| 11 | Xu C, Guan Q, Lin J,et al.Spatiotemporal variations and driving factors of dust storm events in northern China based on high-temporal-resolution analysis of meteorological data (1960-2007)[J].Environmental Pollution,2020,260:114084. |
| 12 | 吴占华,任国玉,徐卫丽,等.我国北方沙尘天气的气候成因分析[J].干旱区地理,2011,34(3):429-435. |
| 13 | 吴成来.近20年沙尘暴为什么减弱了[J].科学大观园,2023,4:50-53. |
| 14 | Xu X K, Chen H.Influence of vegetations and snow cover on sand-dust events in the west of China[J].Chinese Science Bulletin,2006,51:331-340. |
| 15 | Mao R, Ho C H, Feng S,et al.The influence of vegetation variation on Northeast Asian dust activity[J].Asia-Pacific Journal of Atmospheric Sciences,2013,49:87-94. |
| 16 | 崔晓,赵媛媛,丁国栋,等.京津风沙源治理工程区植被对沙尘天气的时空影响[J].农业工程学报,2018,34(12):171-179. |
| 17 | 覃云斌,信忠保,易扬,等.京津风沙源治理工程区沙尘暴时空变化及其与植被恢复关系[J].农业工程学报,2012,28(24):196-204. |
| 18 | Wang H Q, Richdson M I.The origin,evolution,and trajectory of large dust storms on Mars during Mars years 24-30 (1999-2011)[J].Icarus,2015,251:112-127. |
| 19 | 陈楠,陈豫英,范小明,等.西北地区东部沙尘暴转型的环流演变及差异特征分析[J].干旱区地理,2010,33(5):676-683. |
| 20 | Gong S L, Zhang X Y, Zhao T L,et al.A simulated climatology of Asian dust aerosol and its trans-Pacific transport.Part II:interannual variability and climate connections[J].Journal of Climate,2016,19(1):104-122. |
| 21 | Huang J, Minnis P, Chen B,et al.Long-range transport and vertical structure of Asian dust from CALIPSO and surface measurements during PACDEX[J].Journal of Geophysical Research:Atmospheres,2008,113(D23):1-13. |
| 22 | 王彩霞,黄安宁,郑鹏,等.中国第一代全球陆面再分析(CRA40/Land)气温和降水产品在中国大陆的适用性评估[J].高原气象,2022,41(5):1325-1334. |
| 23 | 宋海清,朱仲元,李云鹏.陆面同化及再分析降水资料在内蒙古地区的适用性[J].干旱区研究,2021,38(6):1624-1636. |
| 24 | 衣娜娜,姜学恭,董祝雷,等.植被覆盖率对内蒙古沙尘天气影响的模拟研究[J].大气科学.doi:10.3878/j.issn.1006-9895.2204.22017 . |
| 25 | 袁国波.21世纪以来内蒙古沙尘暴特征及成因[J].中国沙漠,2017,37(6):1204-1209. |
| 26 | 李延香,周自江,高拴柱.2001年沙尘暴天气气候特征和成因分析及预警服务[C]//中国气象学会.中国科协2002年减轻自然灾害研讨会论文汇编之一.北京:中国气象学会,2002:15-25. |
| 27 | 张晔.中国北方沙区冬春季沙尘空间分布及尘源路径研究[D].呼和浩特:内蒙古农业大学,2020. |
| 28 | 特日格乐.蒙古国沙尘暴对内蒙古沙尘暴的影响研究[D].呼和浩特:内蒙古师范大学,2016. |
| 29 | 李彰俊,陈光明,刘景涛,等.内蒙古自治区天气预报手册[M].北京:气象出版社,2012. |
| 30 | Shao Y.Simplification of a dust emission scheme and comparison with data[J].Journal of Geophysical Research:Atmospheres,2004,109(D10202):1-6 |
| 31 | 赵建华,张强,袁铁,等.沙粒启动机制的理论分析[J].中国沙漠,2005,25(6):61-70. |
| 32 | 李晓岚,张宏升.科尔沁沙地起沙过程沙尘气溶胶粒径分布特征[C]//中国颗粒学会气溶胶专业委员会.第十二届全国气溶胶会议暨第十三届海峡两岸气溶胶技术研讨会论文集.重庆:中国颗粒学会气溶胶专业委员会,2015. |
| 33 | Zhang Q, Xu C Y, Yang T.Variability of water resource in the Yellow River basin of past 50 years,China[J].Water Resources Management,2009,23(6):1157-1170. |
| 34 | Yuan Z, Yan D H, Xu J J,et al.Effects of the precipitiation pattern and vegetation coverage variation on the surface runoff characteristics in the eastern Taihang Mountain[J].Applied Ecology and Environmental Research,2019,17(3):5753-5764. |
| 35 | Jia X, Shao M A, Zhang C,et al.Regional temporal persistence of dried soil layer along south-north transect of the Loess Plateau,China[J].Journal of Hydrology,2015,528:152-160. |
| 36 | Liu B, Shao M A.Estimation of soil water storage using temporal stability in four land uses over 10 years on the Loess Plateau,China[J].Journal of Hydrology,2014,517:974-984. |
| 37 | Sun W Y, Song X Y, Mu X M,et al.Spatiotemporal vegetation cover variations associated with climate change and ecological restoration in the Loess Plateau[J].Agricultural and Forest Meteorology,2015,209:87-99. |
| [1] | 刘婷, 贾晓鹏, 陈定梅, 益西拉姆, 张炎, 潘凯佳, 张正偲. 雅鲁藏布江中游平坦流沙地表空气动力学特征[J]. 中国沙漠, 2023, 43(5): 194-203. |
| [2] | 罗霖炎, 高鑫, 赵永成. 新月形沙丘表面流场特征[J]. 中国沙漠, 2023, 43(4): 41-54. |
| [3] | 赵嘉琪, 张春来, 魏国茹. 阿拉善右旗不同时间尺度的风速概率分布[J]. 中国沙漠, 2023, 43(2): 37-42. |
| [4] | 陈思宇, 贯雅雯, 赵丹, 娄高僮, 陈渔. 东亚沙尘气候效应对地面温度日较差影响的数值模拟[J]. 中国沙漠, 2022, 42(3): 127-138. |
| [5] | 张莉, 李继峰, 常春平, 郭中领, 刘珺, 王仁德, 李庆, 王旭洋. 风速分辨率对土壤风蚀模数计算结果的影响[J]. 中国沙漠, 2022, 42(3): 21-30. |
| [6] | 殷婕, 哈斯额尔敦null, 安晶, 周炎广, 胡日娜, 武子丰. 鄂尔多斯高原油蒿(Artemisia ordosica)灌丛沙堆风沙气流结构及其地貌学意义[J]. 中国沙漠, 2022, 42(1): 184-195. |
| [7] | 王仁德, 安晨宇, 苑依笑, 张春来, 李庆, 查慧敏, 常春平, 郭中领. 不同时间尺度下农田土壤风蚀可蚀性的变化[J]. 中国沙漠, 2021, 41(5): 202-209. |
| [8] | 潘凯佳, 张正偲, 梁爱民. 反向沙丘近地层气流变化及其对沙丘形态的影响[J]. 中国沙漠, 2021, 41(2): 1-8. |
| [9] | 曹立悦, 李玉霖, 詹瑾, 石丽娜. 开垦对科尔沁沙地土壤团聚体分布及稳定性的影响[J]. 中国沙漠, 2021, 41(2): 212-220. |
| [10] | 王同亮, 马绍休, 高扬, 宫毓来, 安志山. 小波包分解与多个机器学习模型耦合在风速预报中的对比[J]. 中国沙漠, 2021, 41(2): 38-50. |
| [11] | 王文帆, 刘任涛, 郭志霞, 冯永宏, 蒋嘉瑜. 腾格里沙漠东南缘固沙灌丛林土壤理化性质及分形维数[J]. 中国沙漠, 2021, 41(1): 209-218. |
| [12] | 韩庆杰, 郝才元, 屈建军, 张宏杰, 周福成. 临哈铁路典型路段风沙防治工程的三维气流场特征与防沙效率[J]. 中国沙漠, 2020, 40(6): 1-12. |
| [13] | 梅凡民, 王姗, 唐丽萱, 苏进. 一个基于粗糙元方向比率和空气动力学粗糙度的起动摩阻风速模式[J]. 中国沙漠, 2020, 40(6): 98-104. |
| [14] | 张慧, 张春来, 刘欣宇, 代豫杰, 岑松勃, 沈亚萍. 裸露农田近地表风速脉动特征[J]. 中国沙漠, 2020, 40(5): 57-64. |
| [15] | 胡菲, 张克存, 安志山, 鱼燕萍. 敦煌沙漠、绿洲和戈壁地表风动力环境特征同步对比[J]. 中国沙漠, 2020, 40(4): 113-119. |
| 阅读次数 | ||||||
|
全文 |
|
|||||
|
摘要 |
|
|||||
©2018中国沙漠 编辑部
地址: 兰州市天水中路8号 (730000)
电话:0931-8267545
Email:caiedit@lzb.ac.cn;desert@lzb.ac.cn

 甘公网安备 62010202000688号