img

官方微信

高级检索

中国沙漠 ›› 2023, Vol. 43 ›› Issue (4): 76-88.DOI: 10.7522/j.issn.1000-694X.2022.00160

• • 上一篇    下一篇

塔里木盆地两次沙尘天气过程对比分析

曼吾拉·卡德尔1,2(), 张璐3, 刘鑫华2(), 努尔比亚·吐尼牙孜4, 古丽乃帕尔·木明5, 高韶勃6   

  1. 1.新疆机场(集团)有限责任公司,新疆 乌鲁木齐 830000
    2.国家气象中心,北京 100081
    3.内蒙古自治区气象台,内蒙古 呼和浩特 010051
    4.喀什地区气象台,新疆 喀什 844000
    5.洛浦县气象局,新疆 洛浦 848200
    6.中国农业科学院草原研究所,内蒙古 呼和浩特 010010
  • 收稿日期:2022-09-09 修回日期:2022-12-01 出版日期:2023-07-20 发布日期:2023-08-14
  • 通讯作者: 刘鑫华
  • 作者简介:刘鑫华(E-mail: 59881052@qq.com
    曼吾拉·卡德尔(1988—),男,新疆哈密人,工程师,主要从事民航气象业务工作及研究。E-mail: 32812608@qq.com
  • 基金资助:
    工业和信息化部项目(MJ-2014-J-70);内蒙古自然科学基金博士基金项目(2020BS03046);中国农业科学院草原研究所基本科研业务费专项(1610332020015)

Comparative analysis of two dust weather processes in Tarim Basin, China

Kader Mavlan1,2(), Lu Zhang3, Xinhua Liu2(), Tunyaz Nurbiye4, Muming Gulnafar5, Shaobo Gao6   

  1. 1.Xinjiang Airport Group Co. ,Ltd,Urumqi 830000,China
    2.National Meteorological Center,Beijing 100081,China
    3.Inner Mongolia Meteorological Observatory,Hohhot 010051,China
    4.Kashi Meteorological Observatory,Kashi 844000,Xinjiang,China
    5.Lop Meteorological Administration,Lop 848200,Xinjiang,China
    6.Grassland Research Institute,Chinese Academy of Agricultural Sciences,Hohhot 010010,China
  • Received:2022-09-09 Revised:2022-12-01 Online:2023-07-20 Published:2023-08-14
  • Contact: Xinhua Liu

摘要:

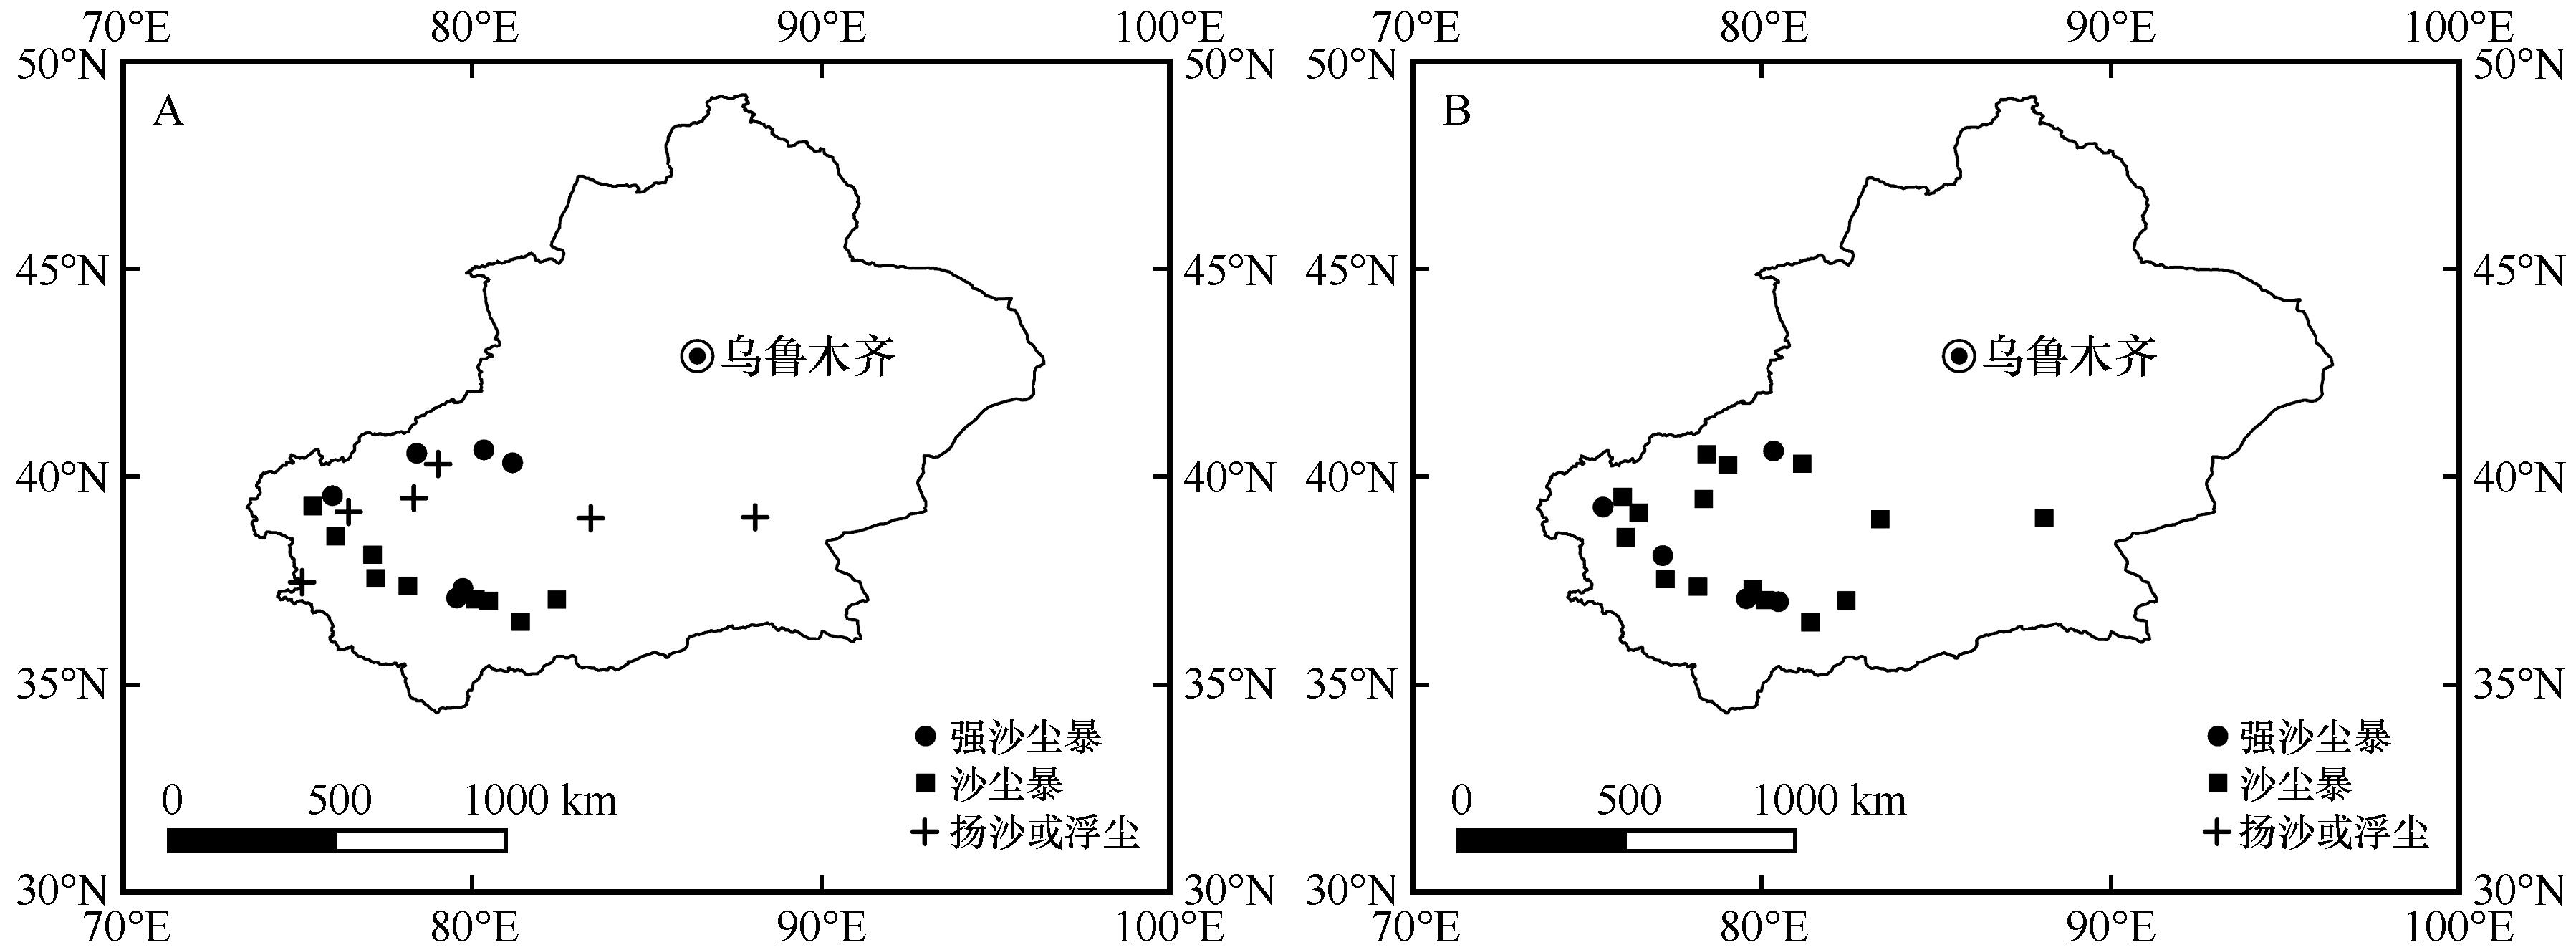
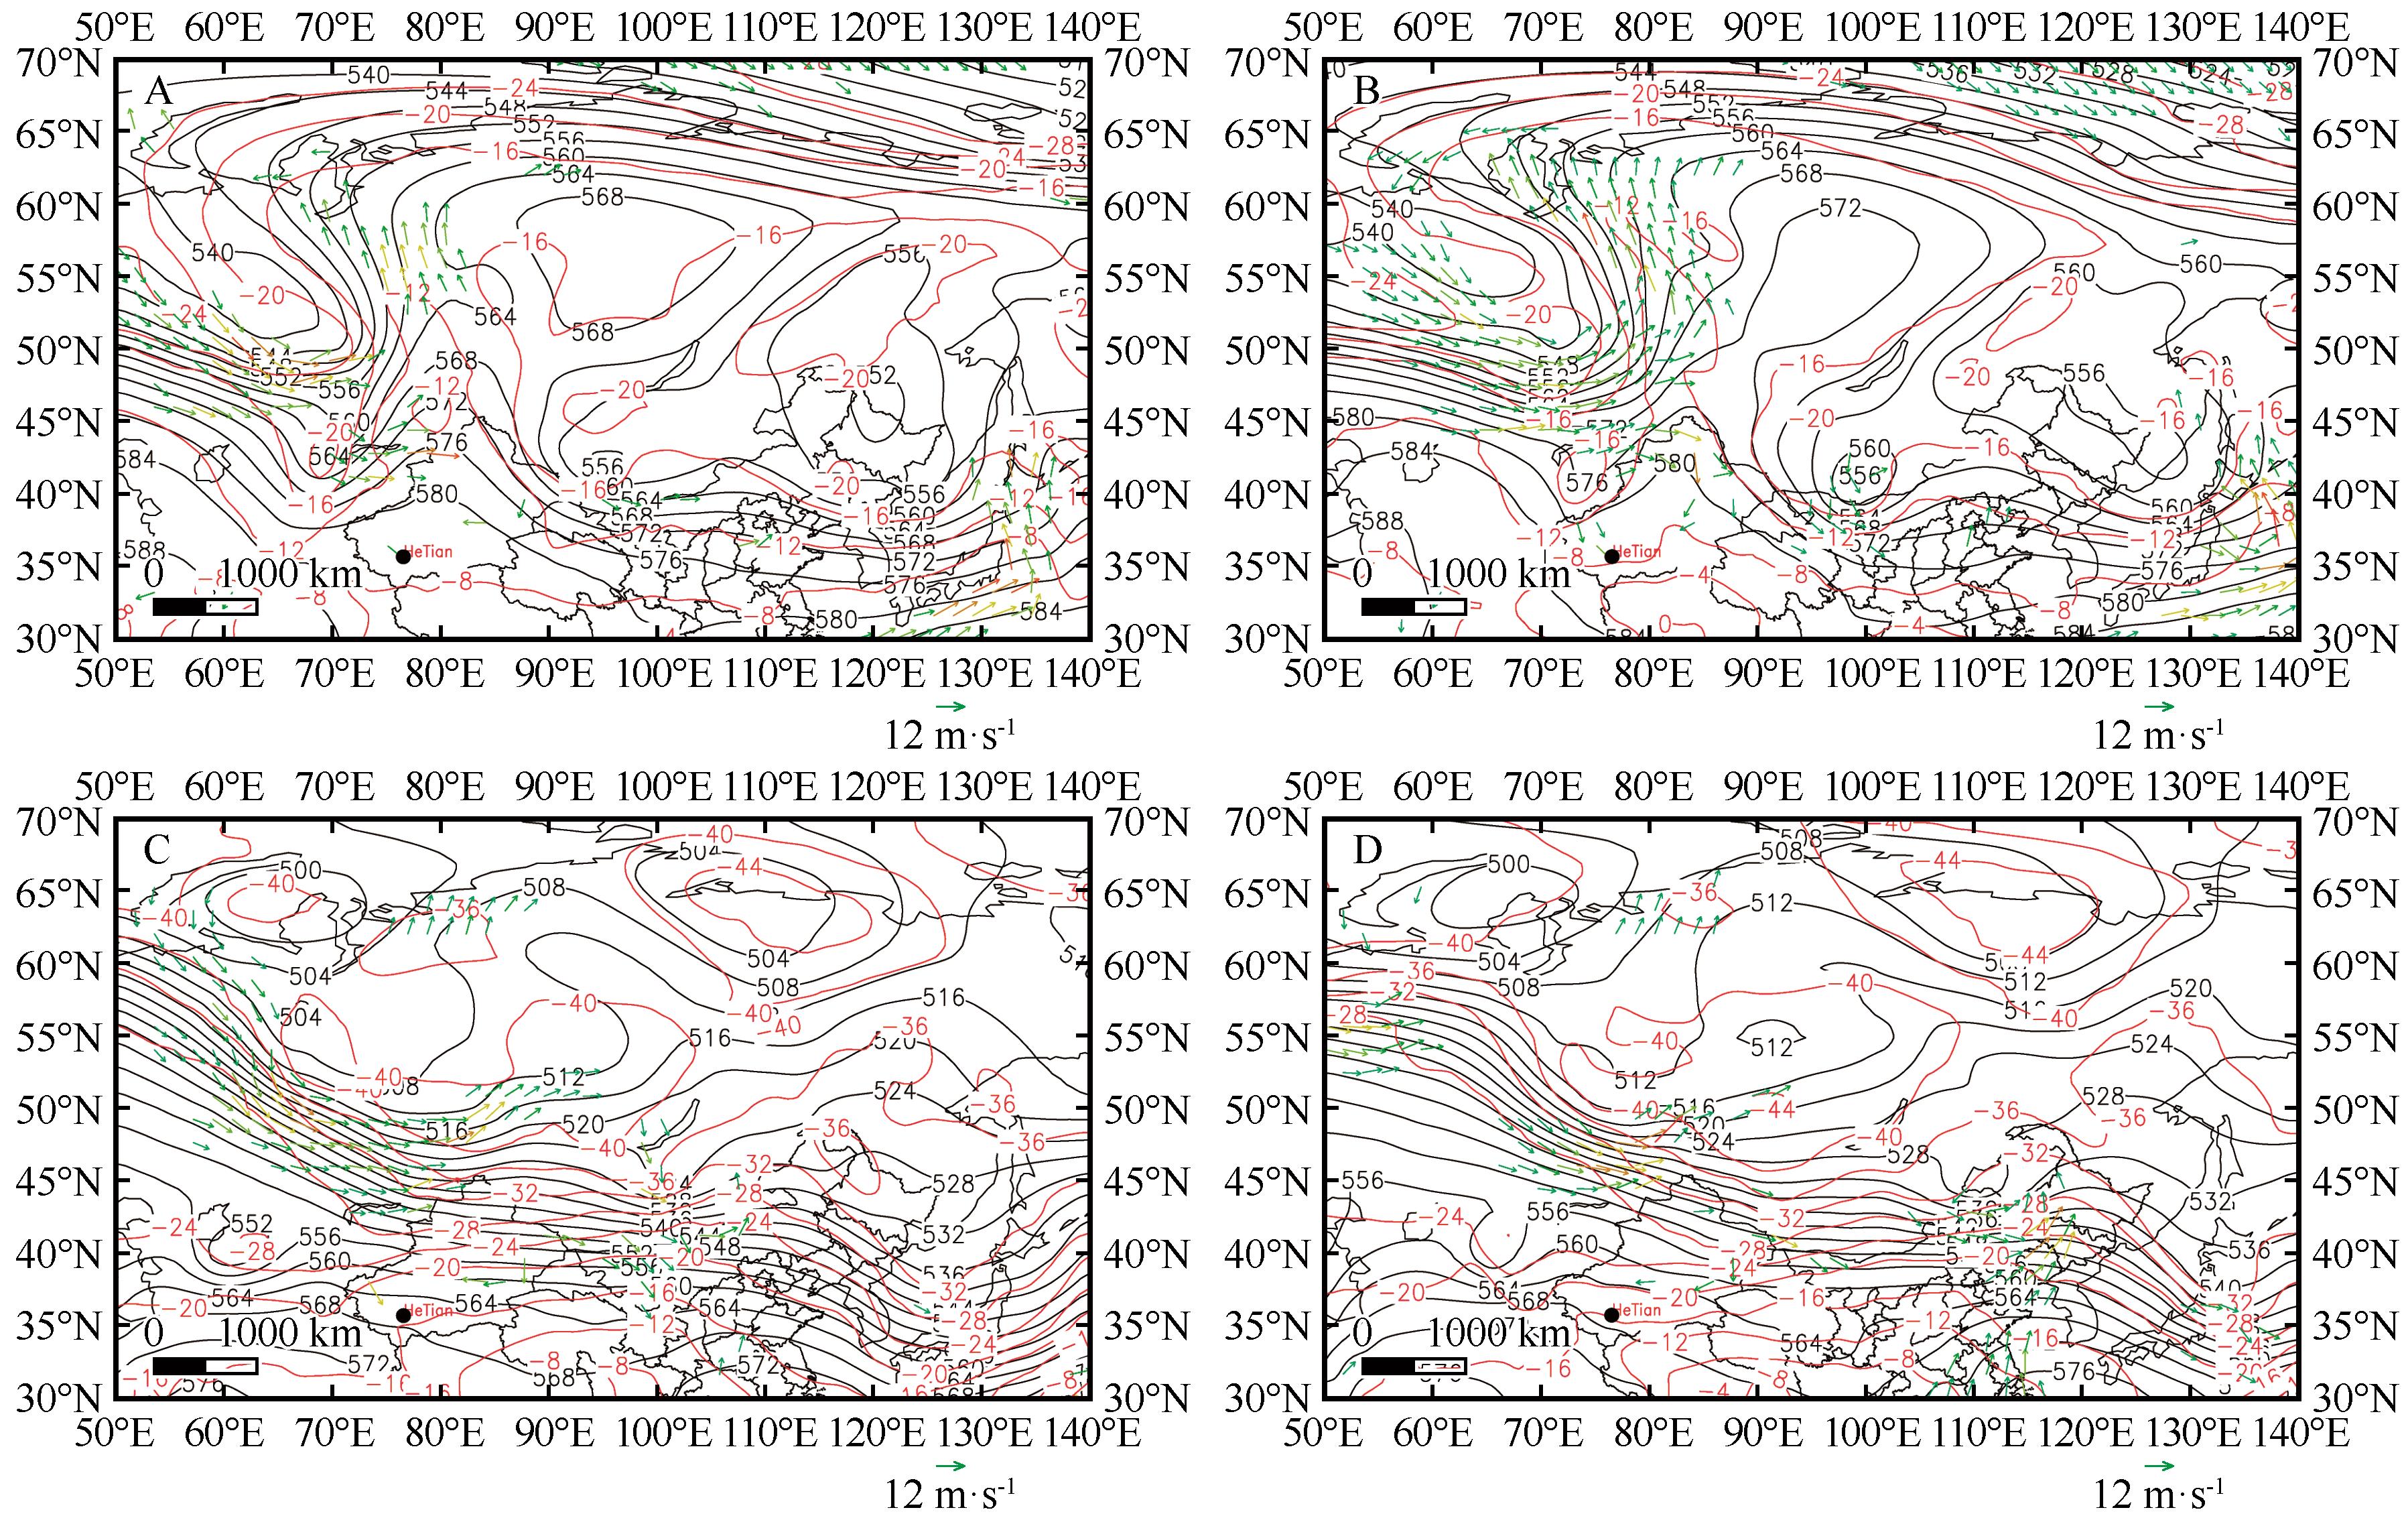
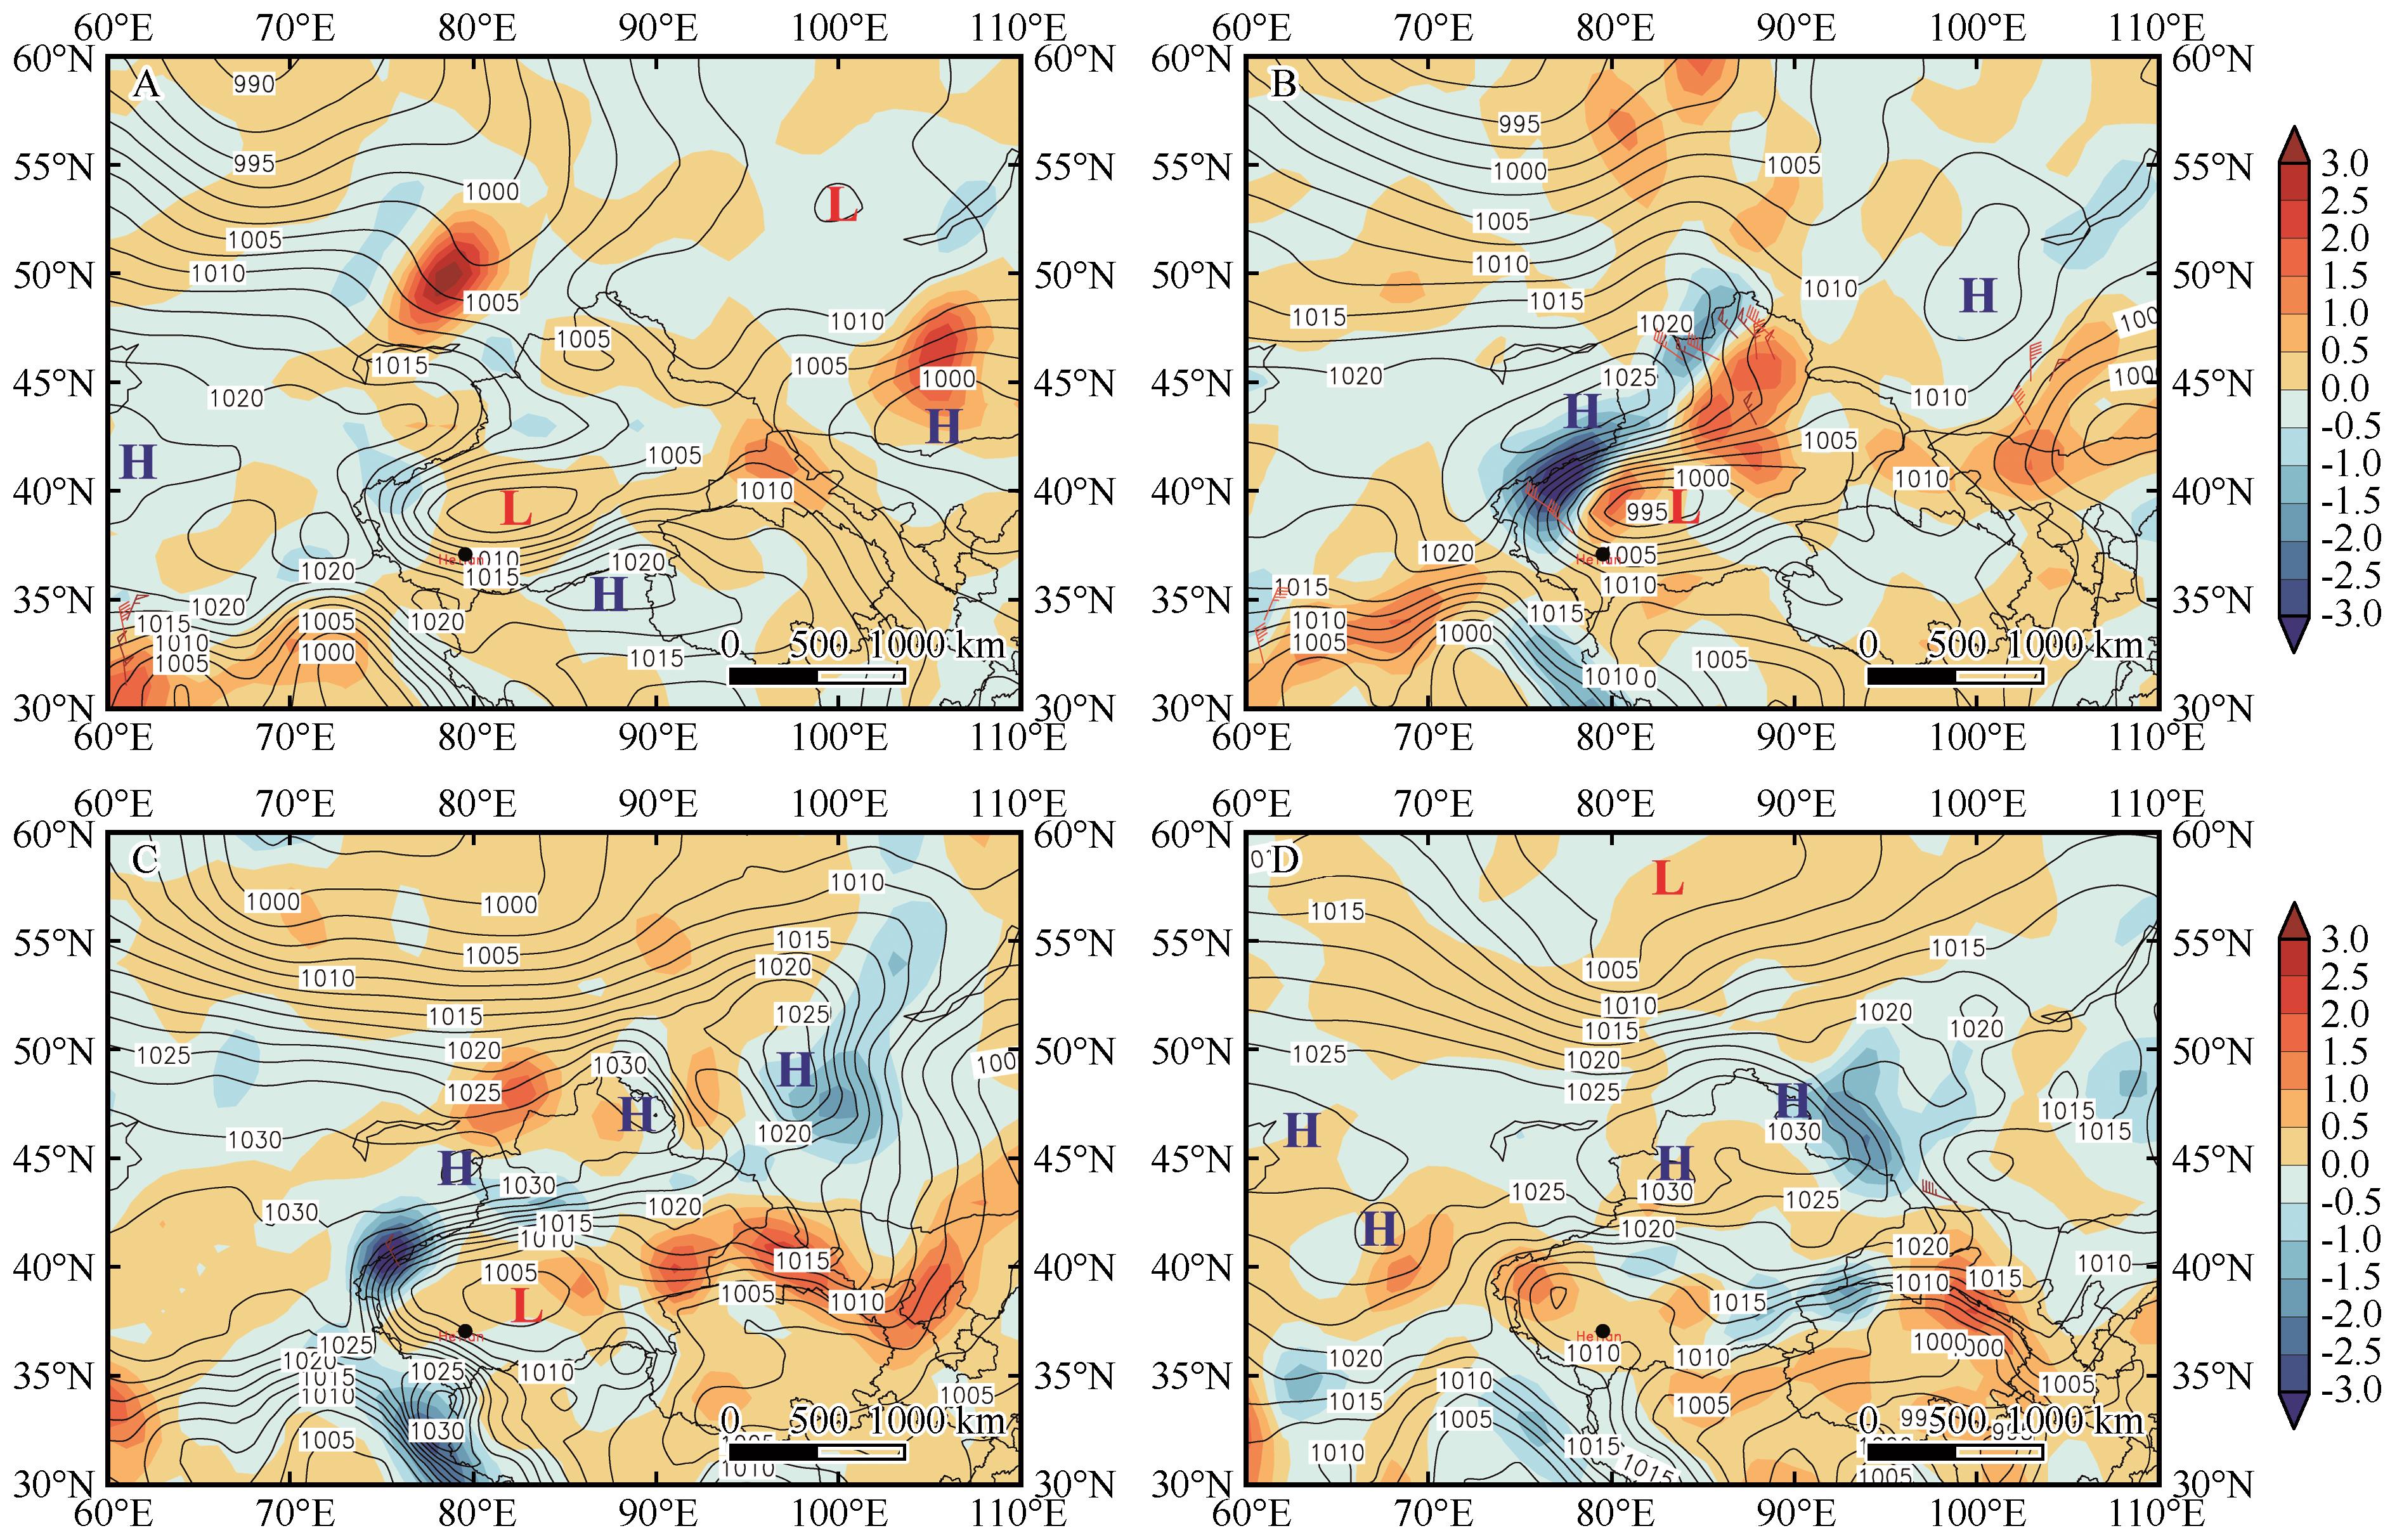
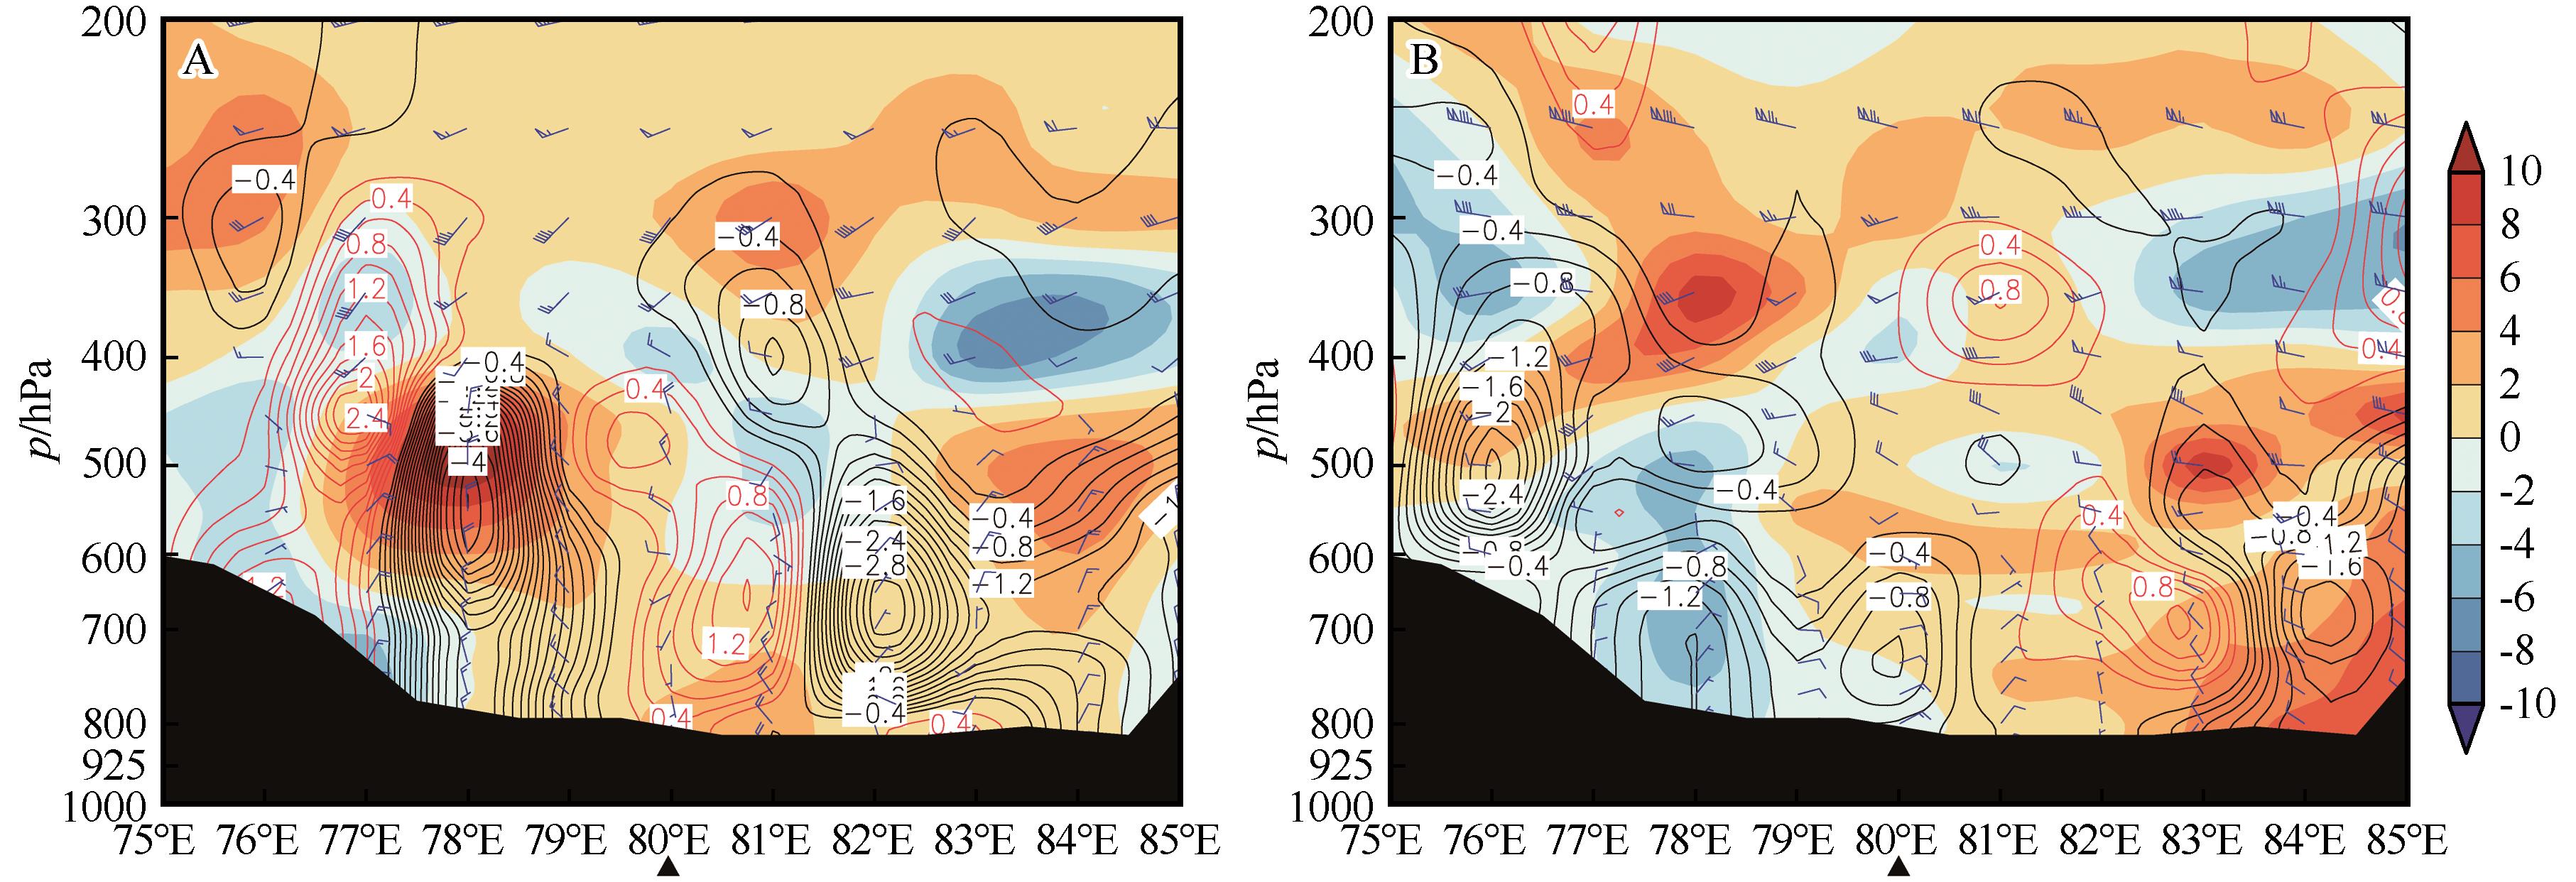
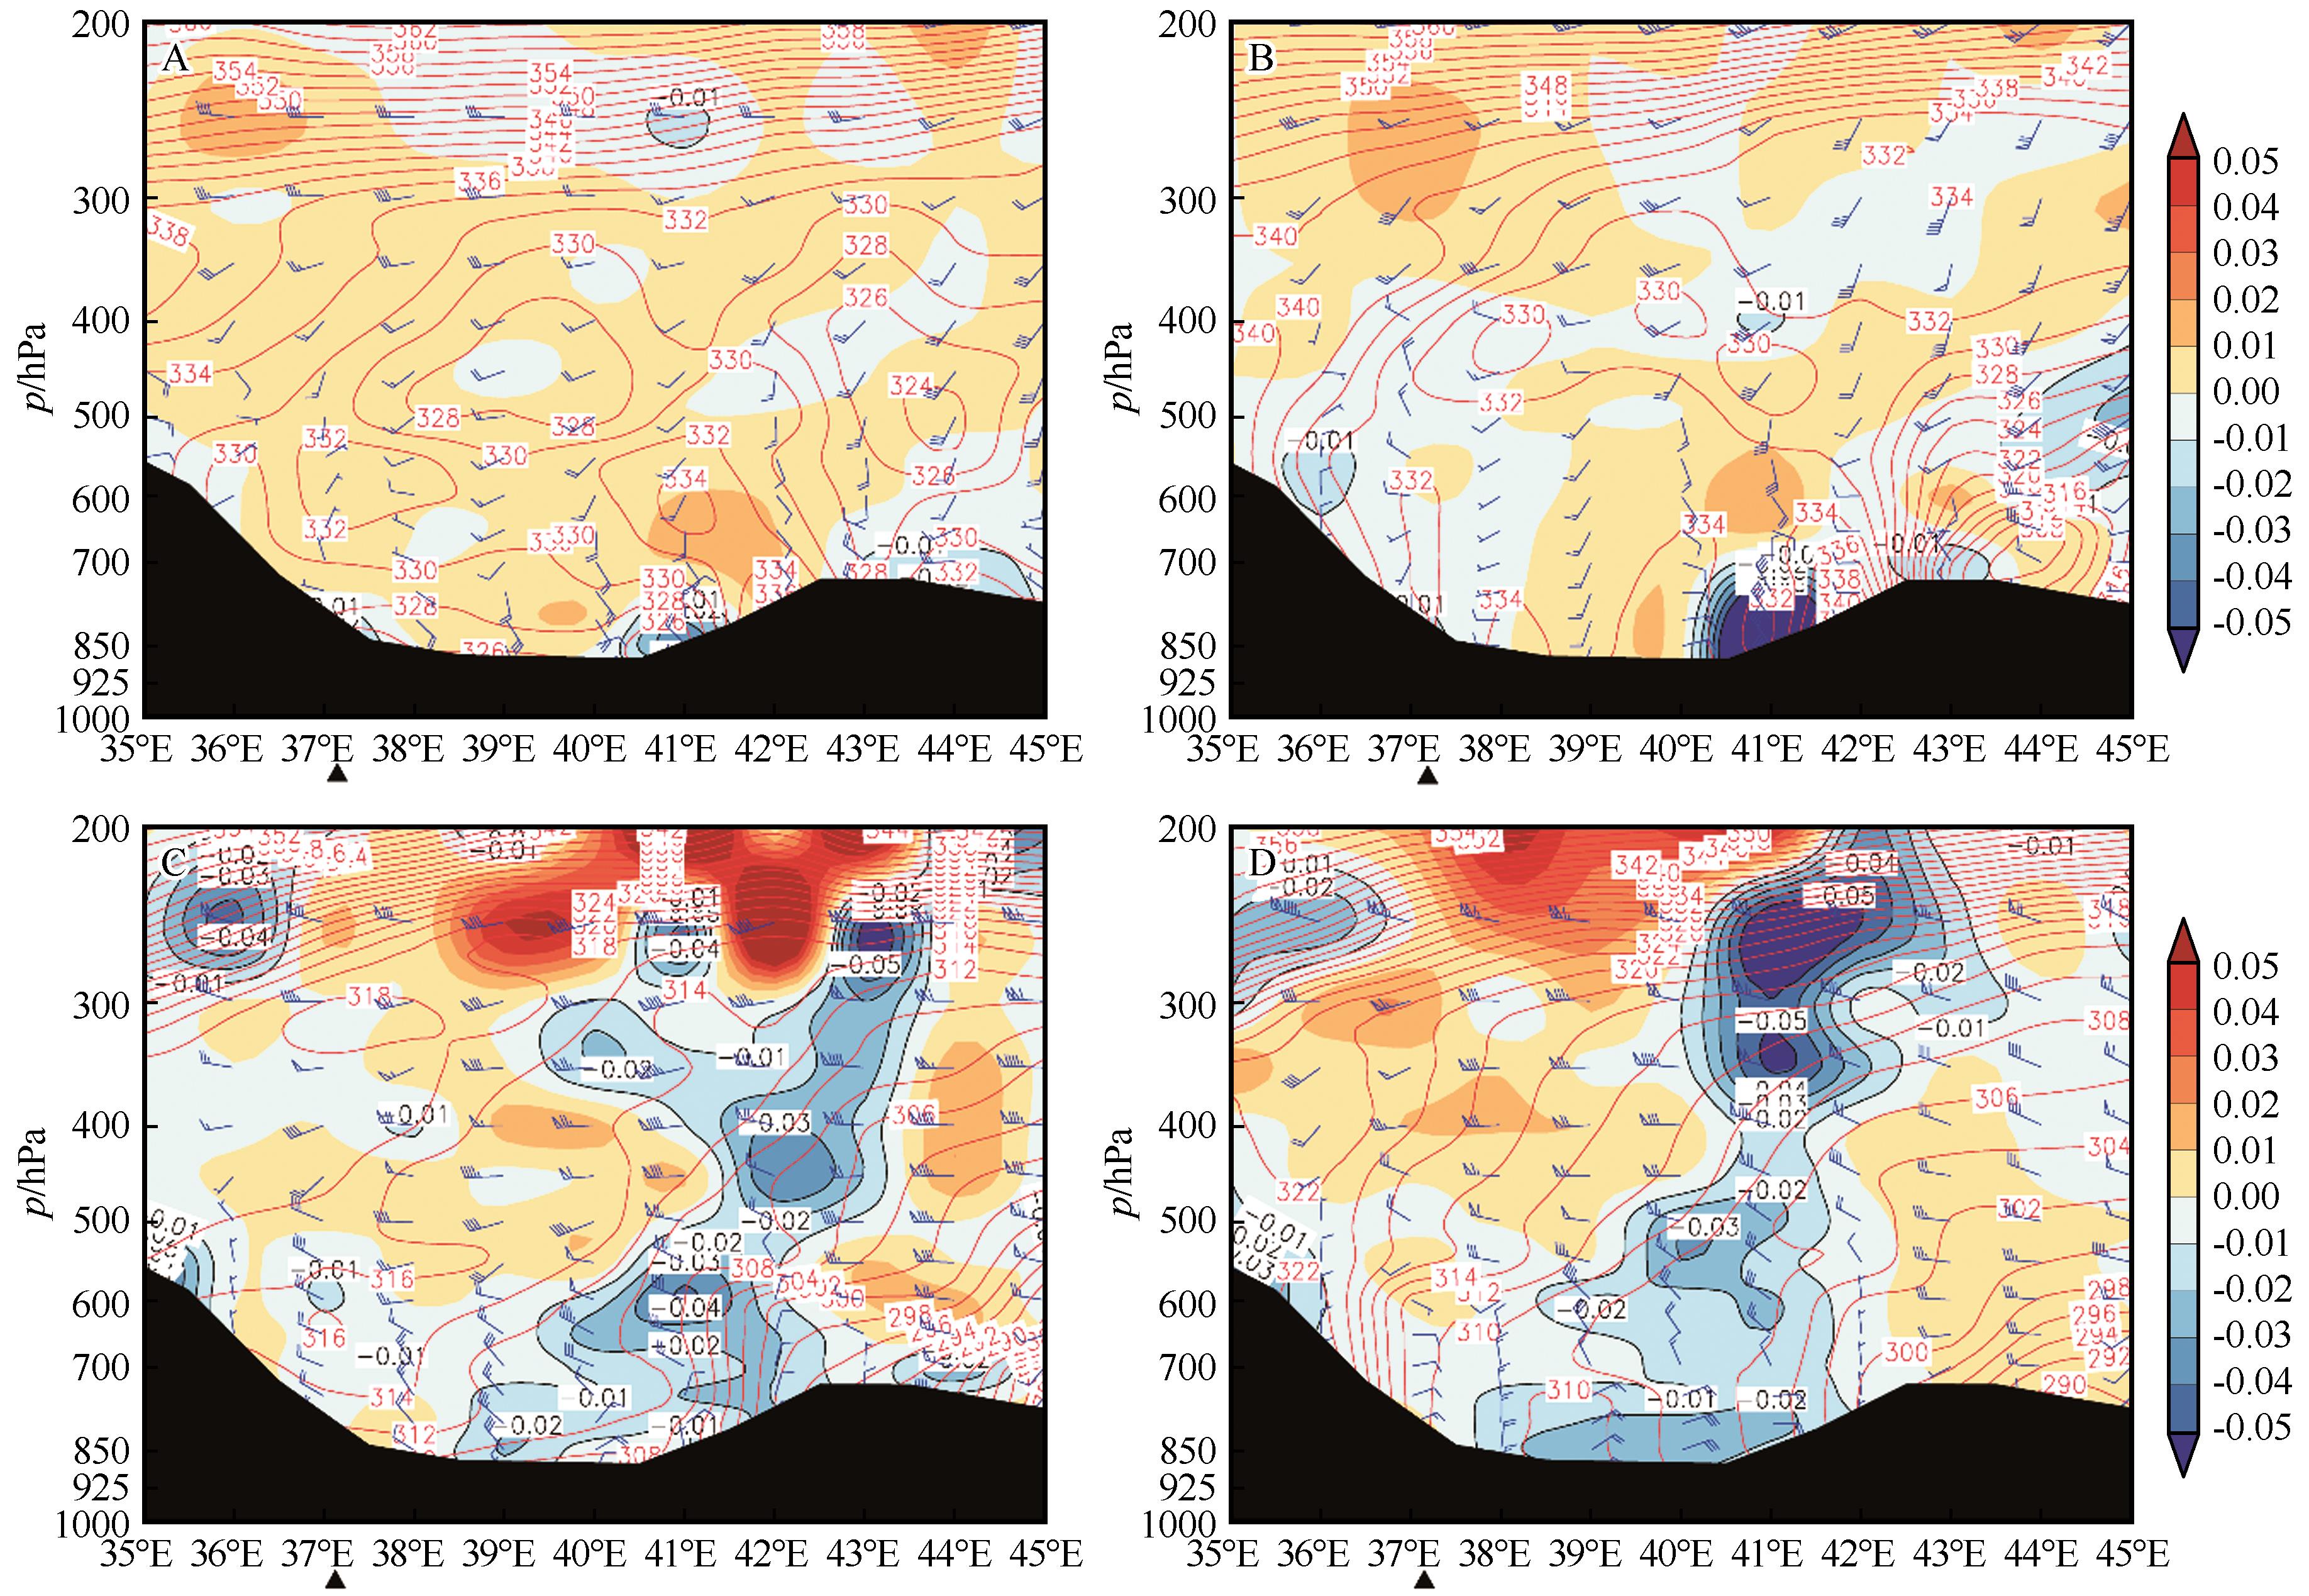
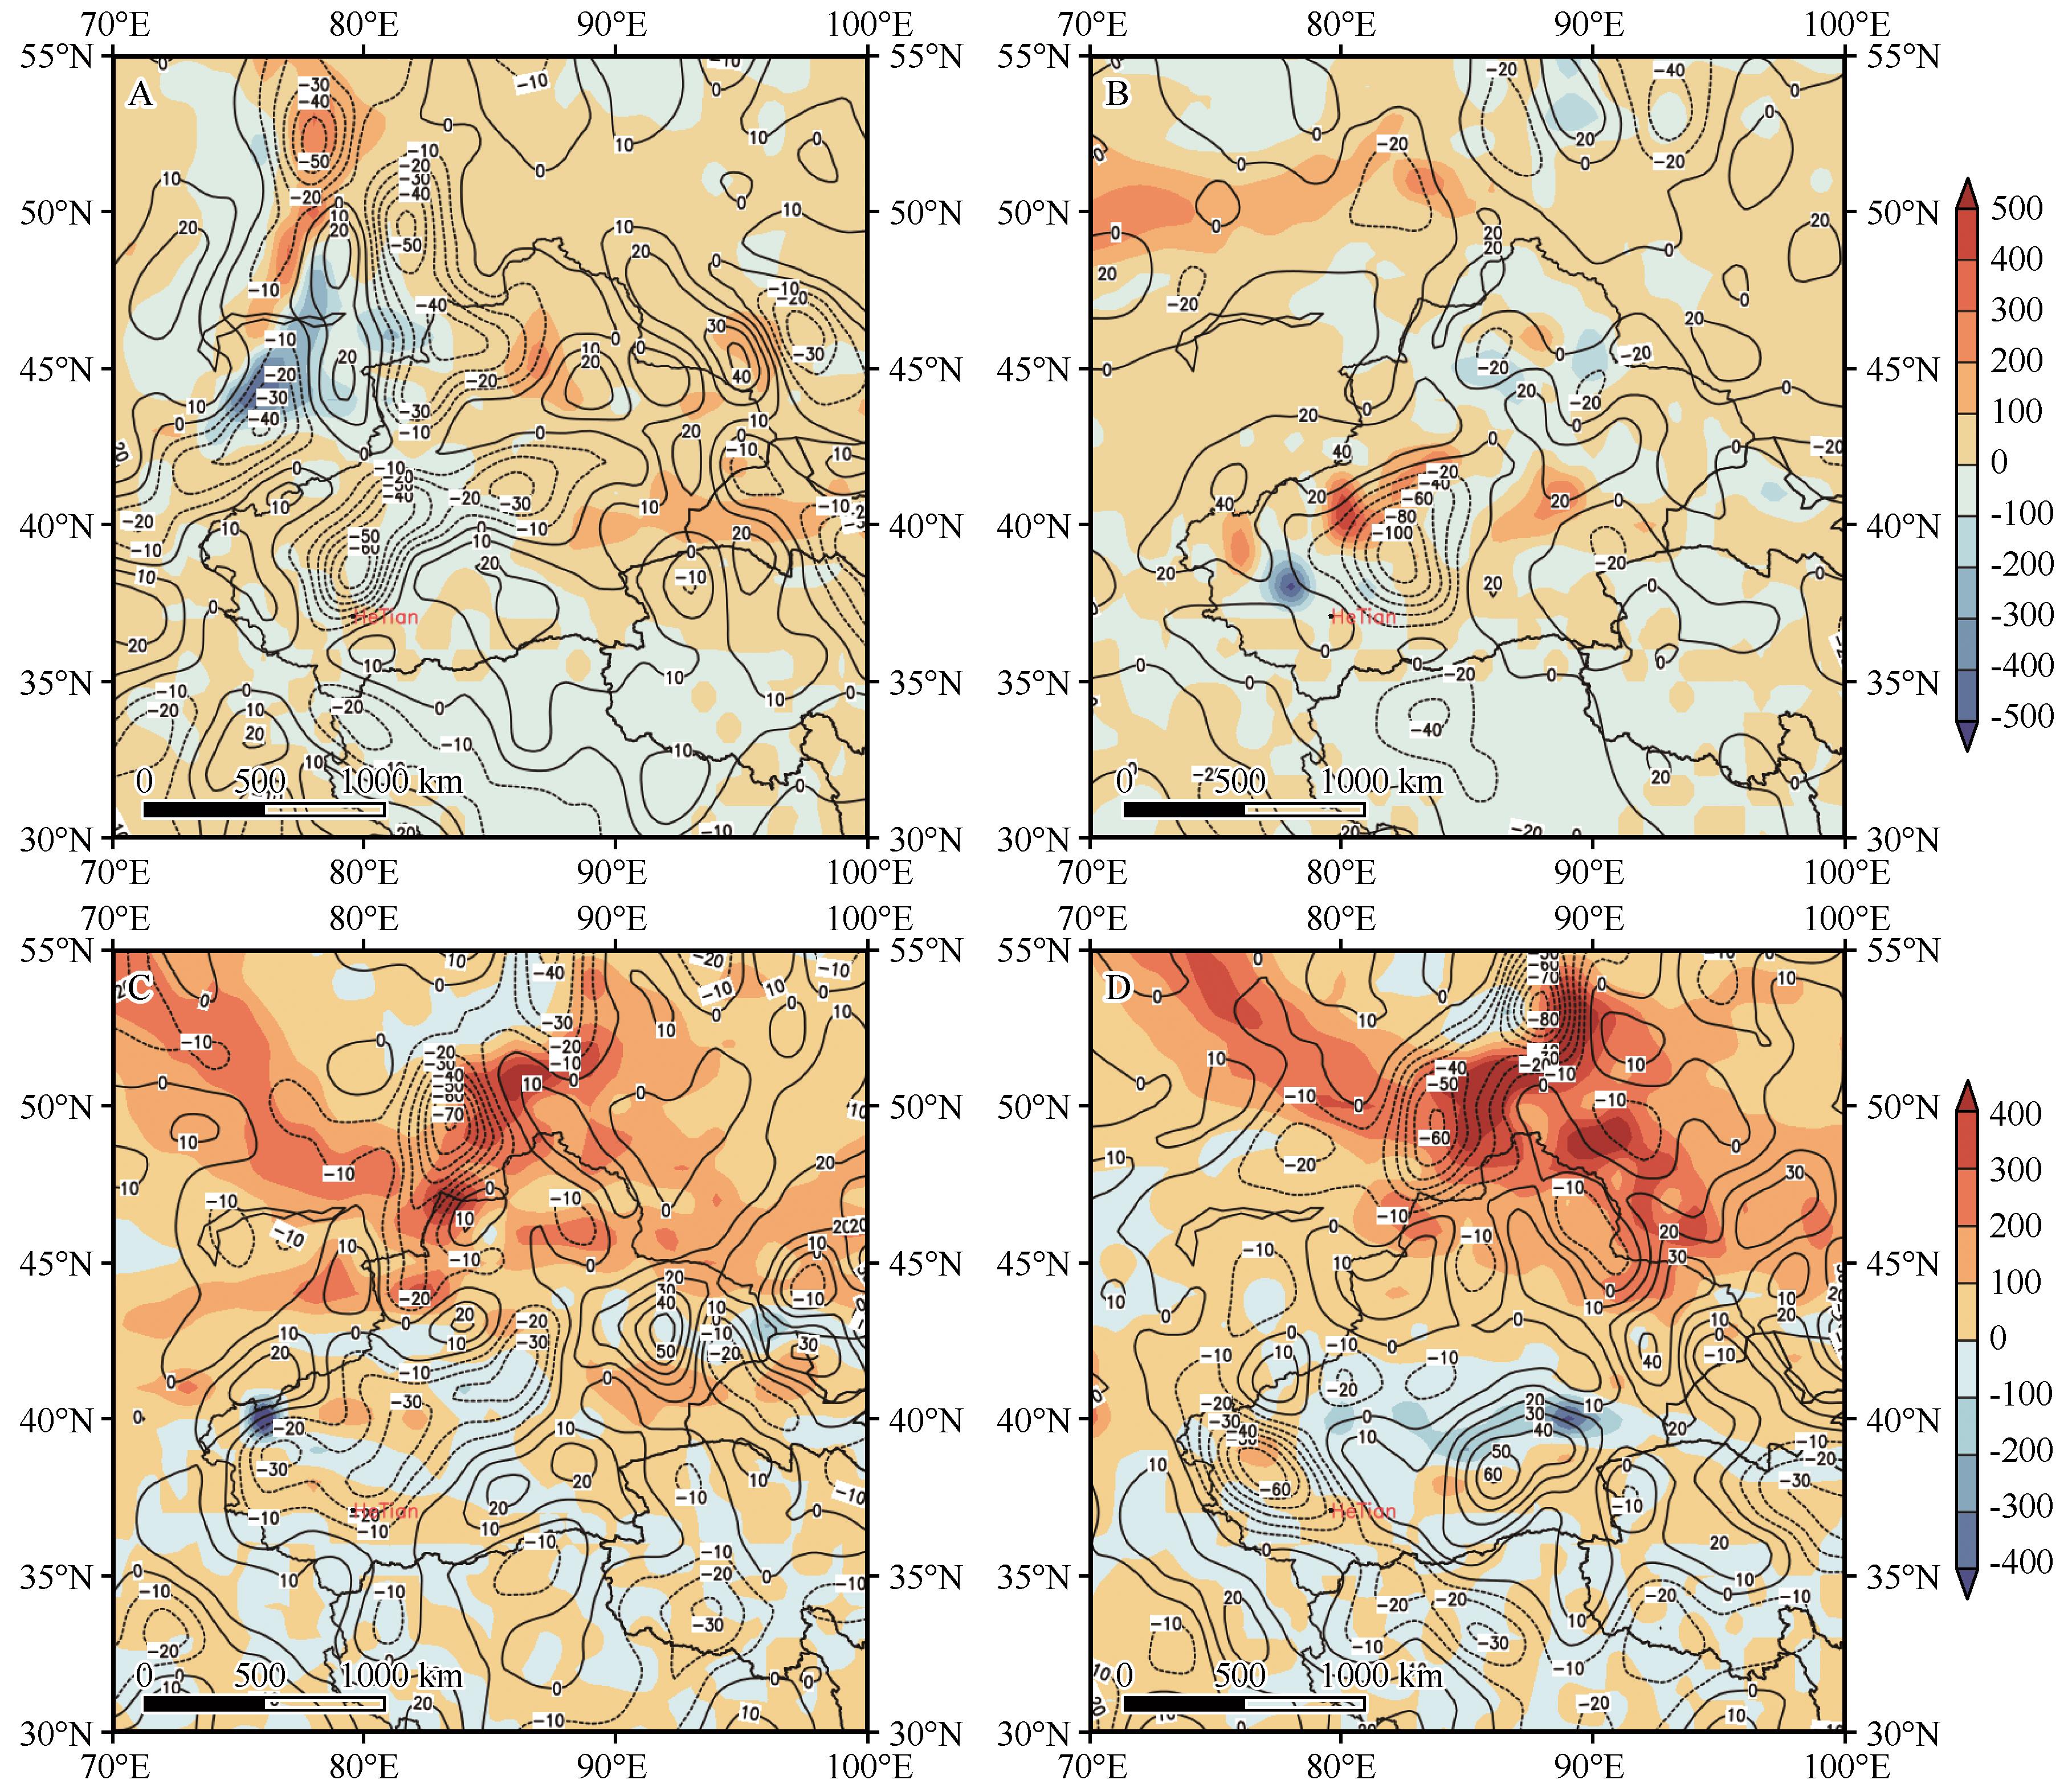
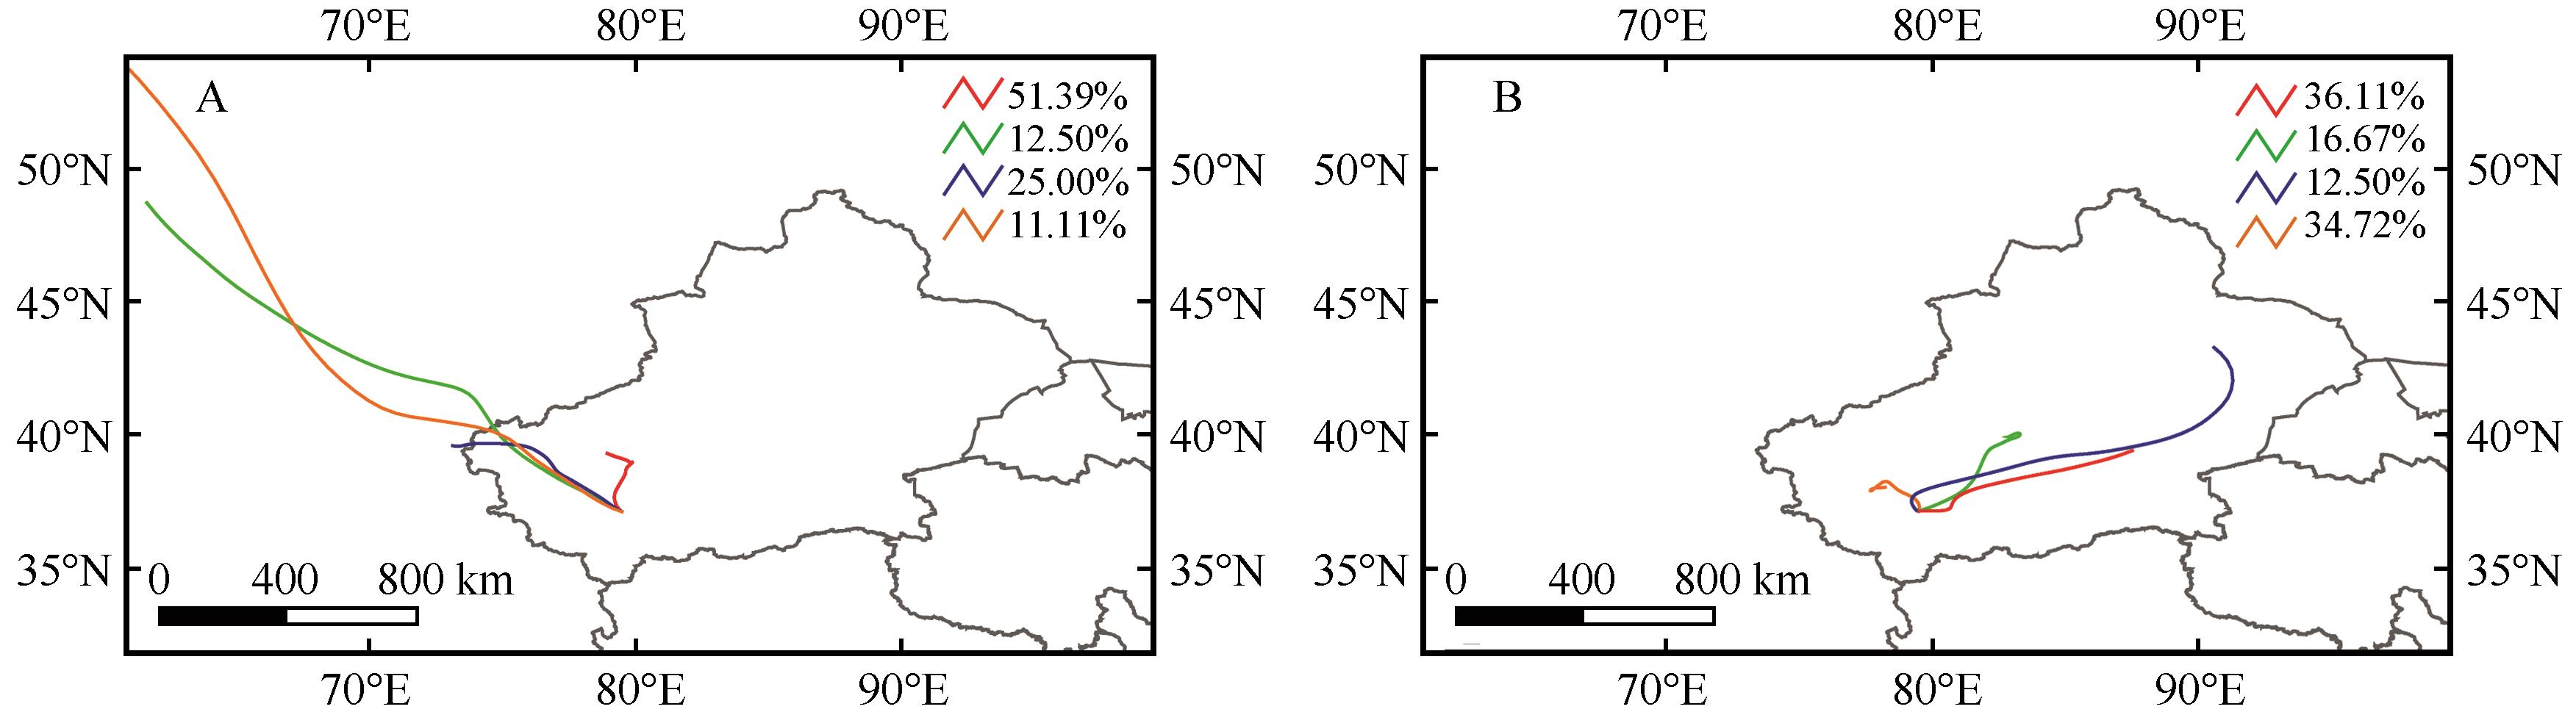
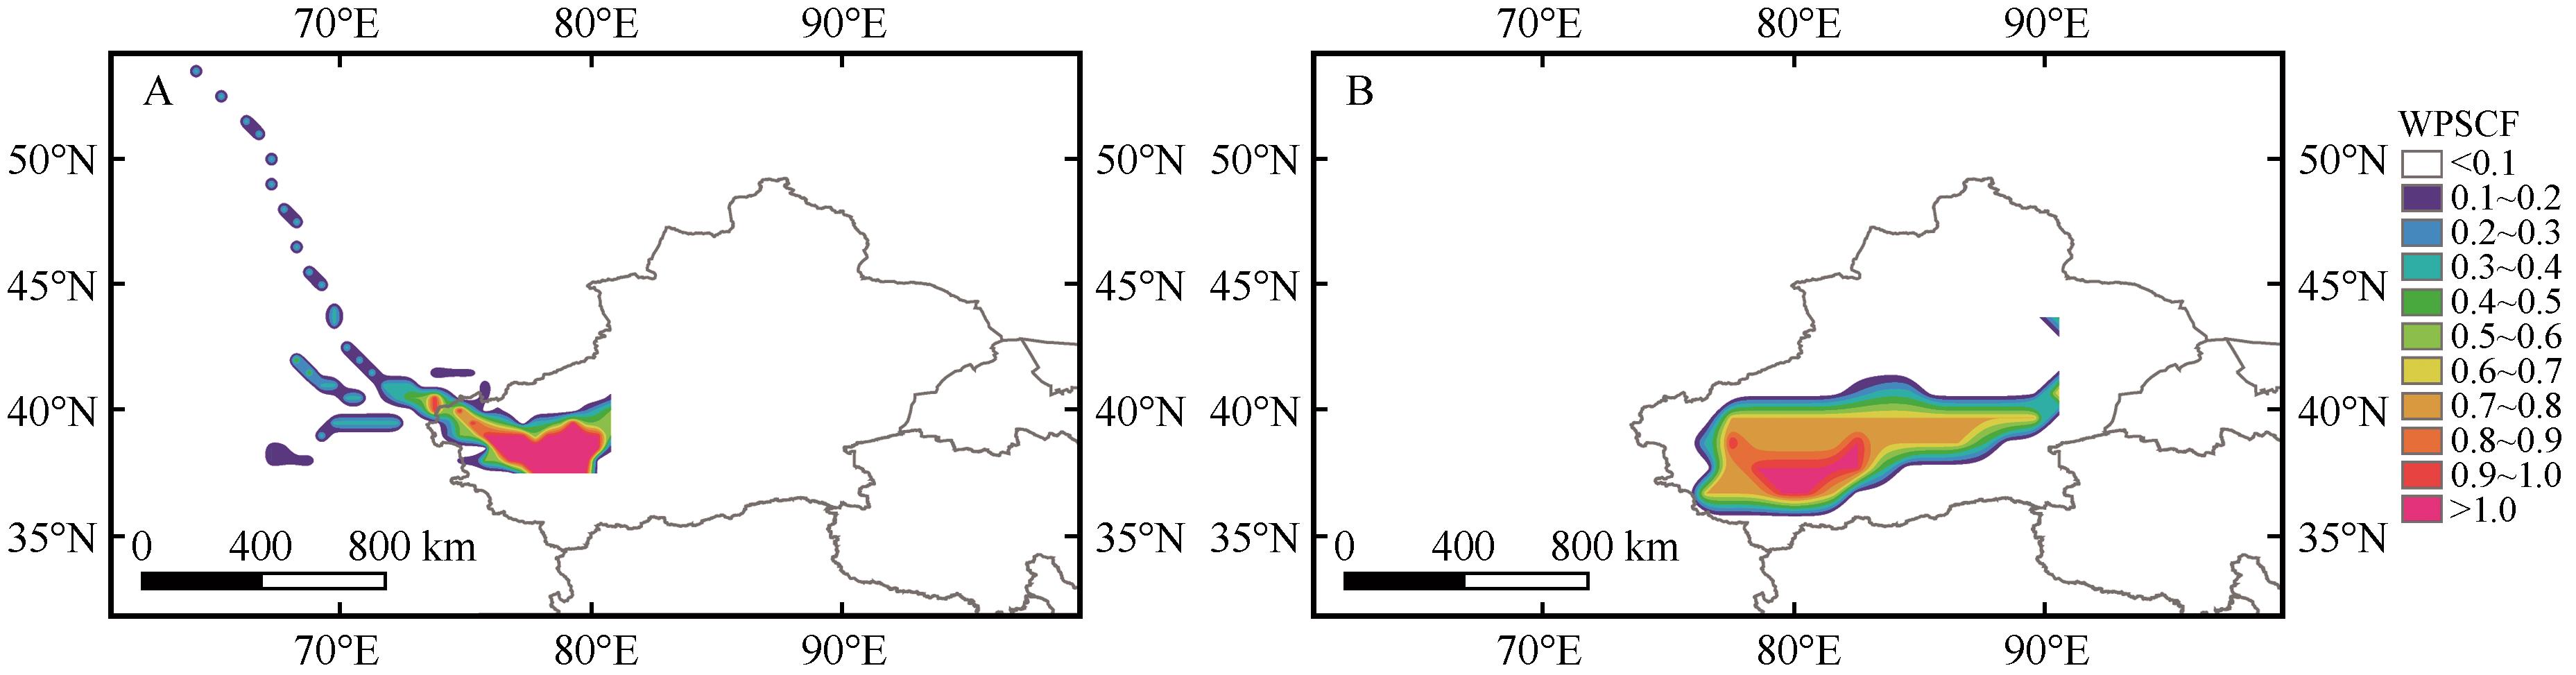
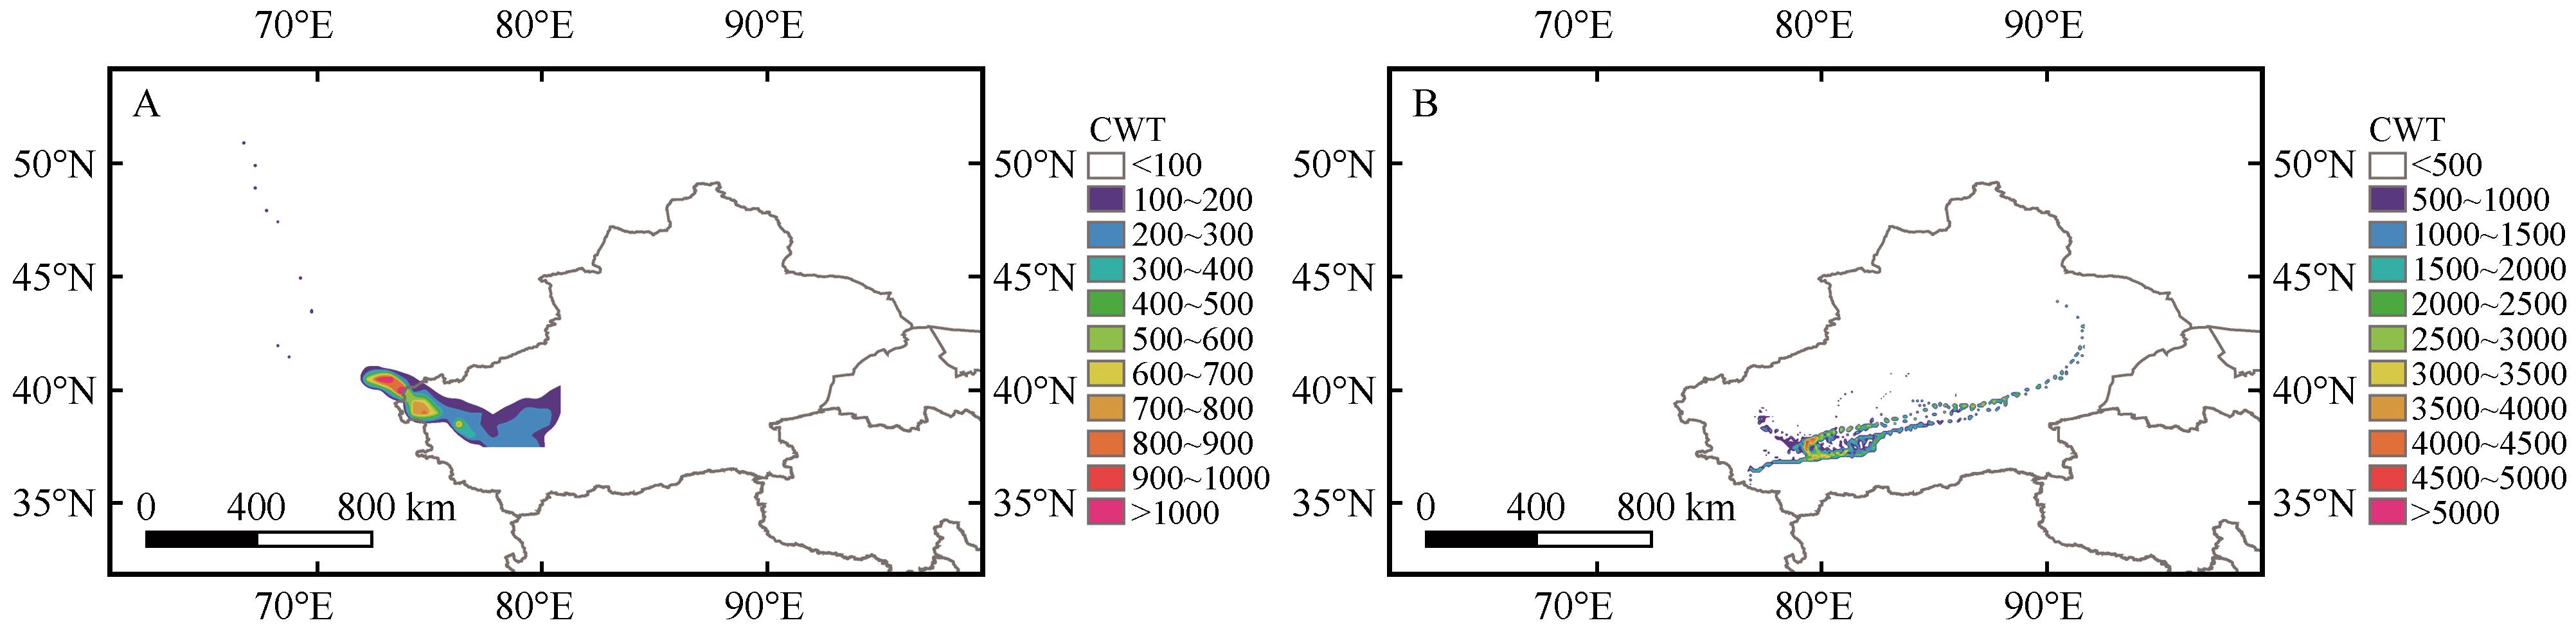
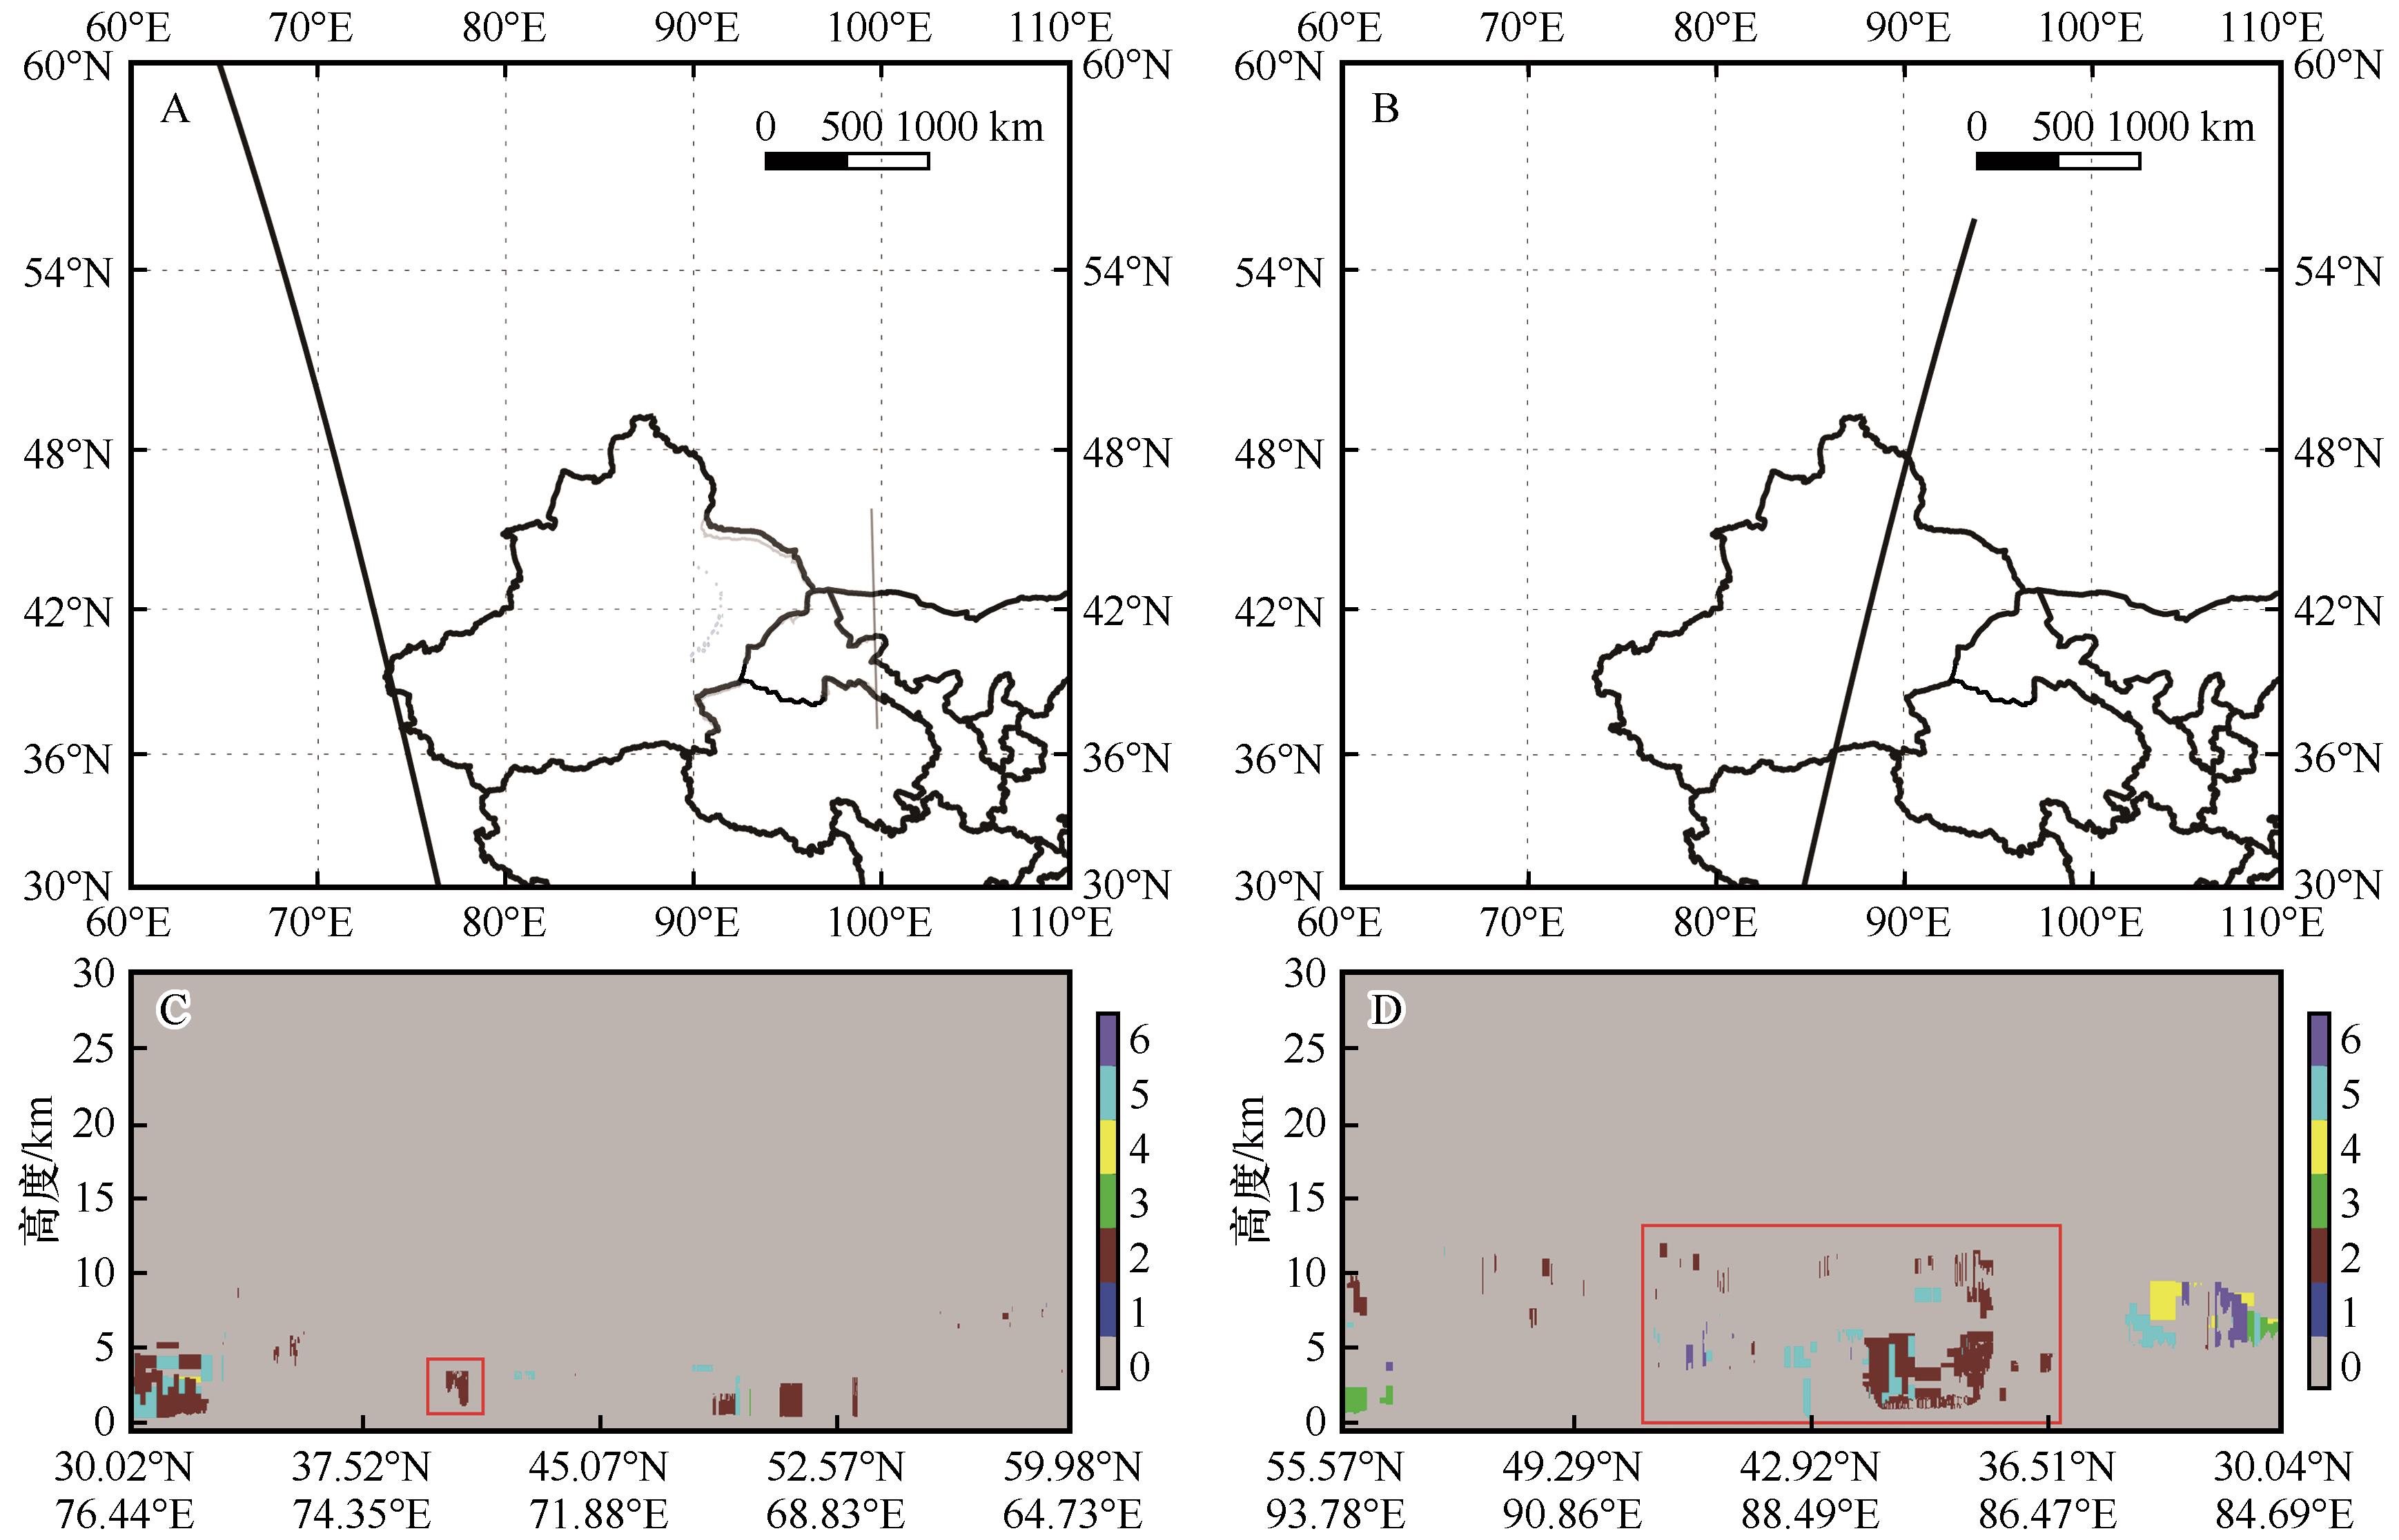
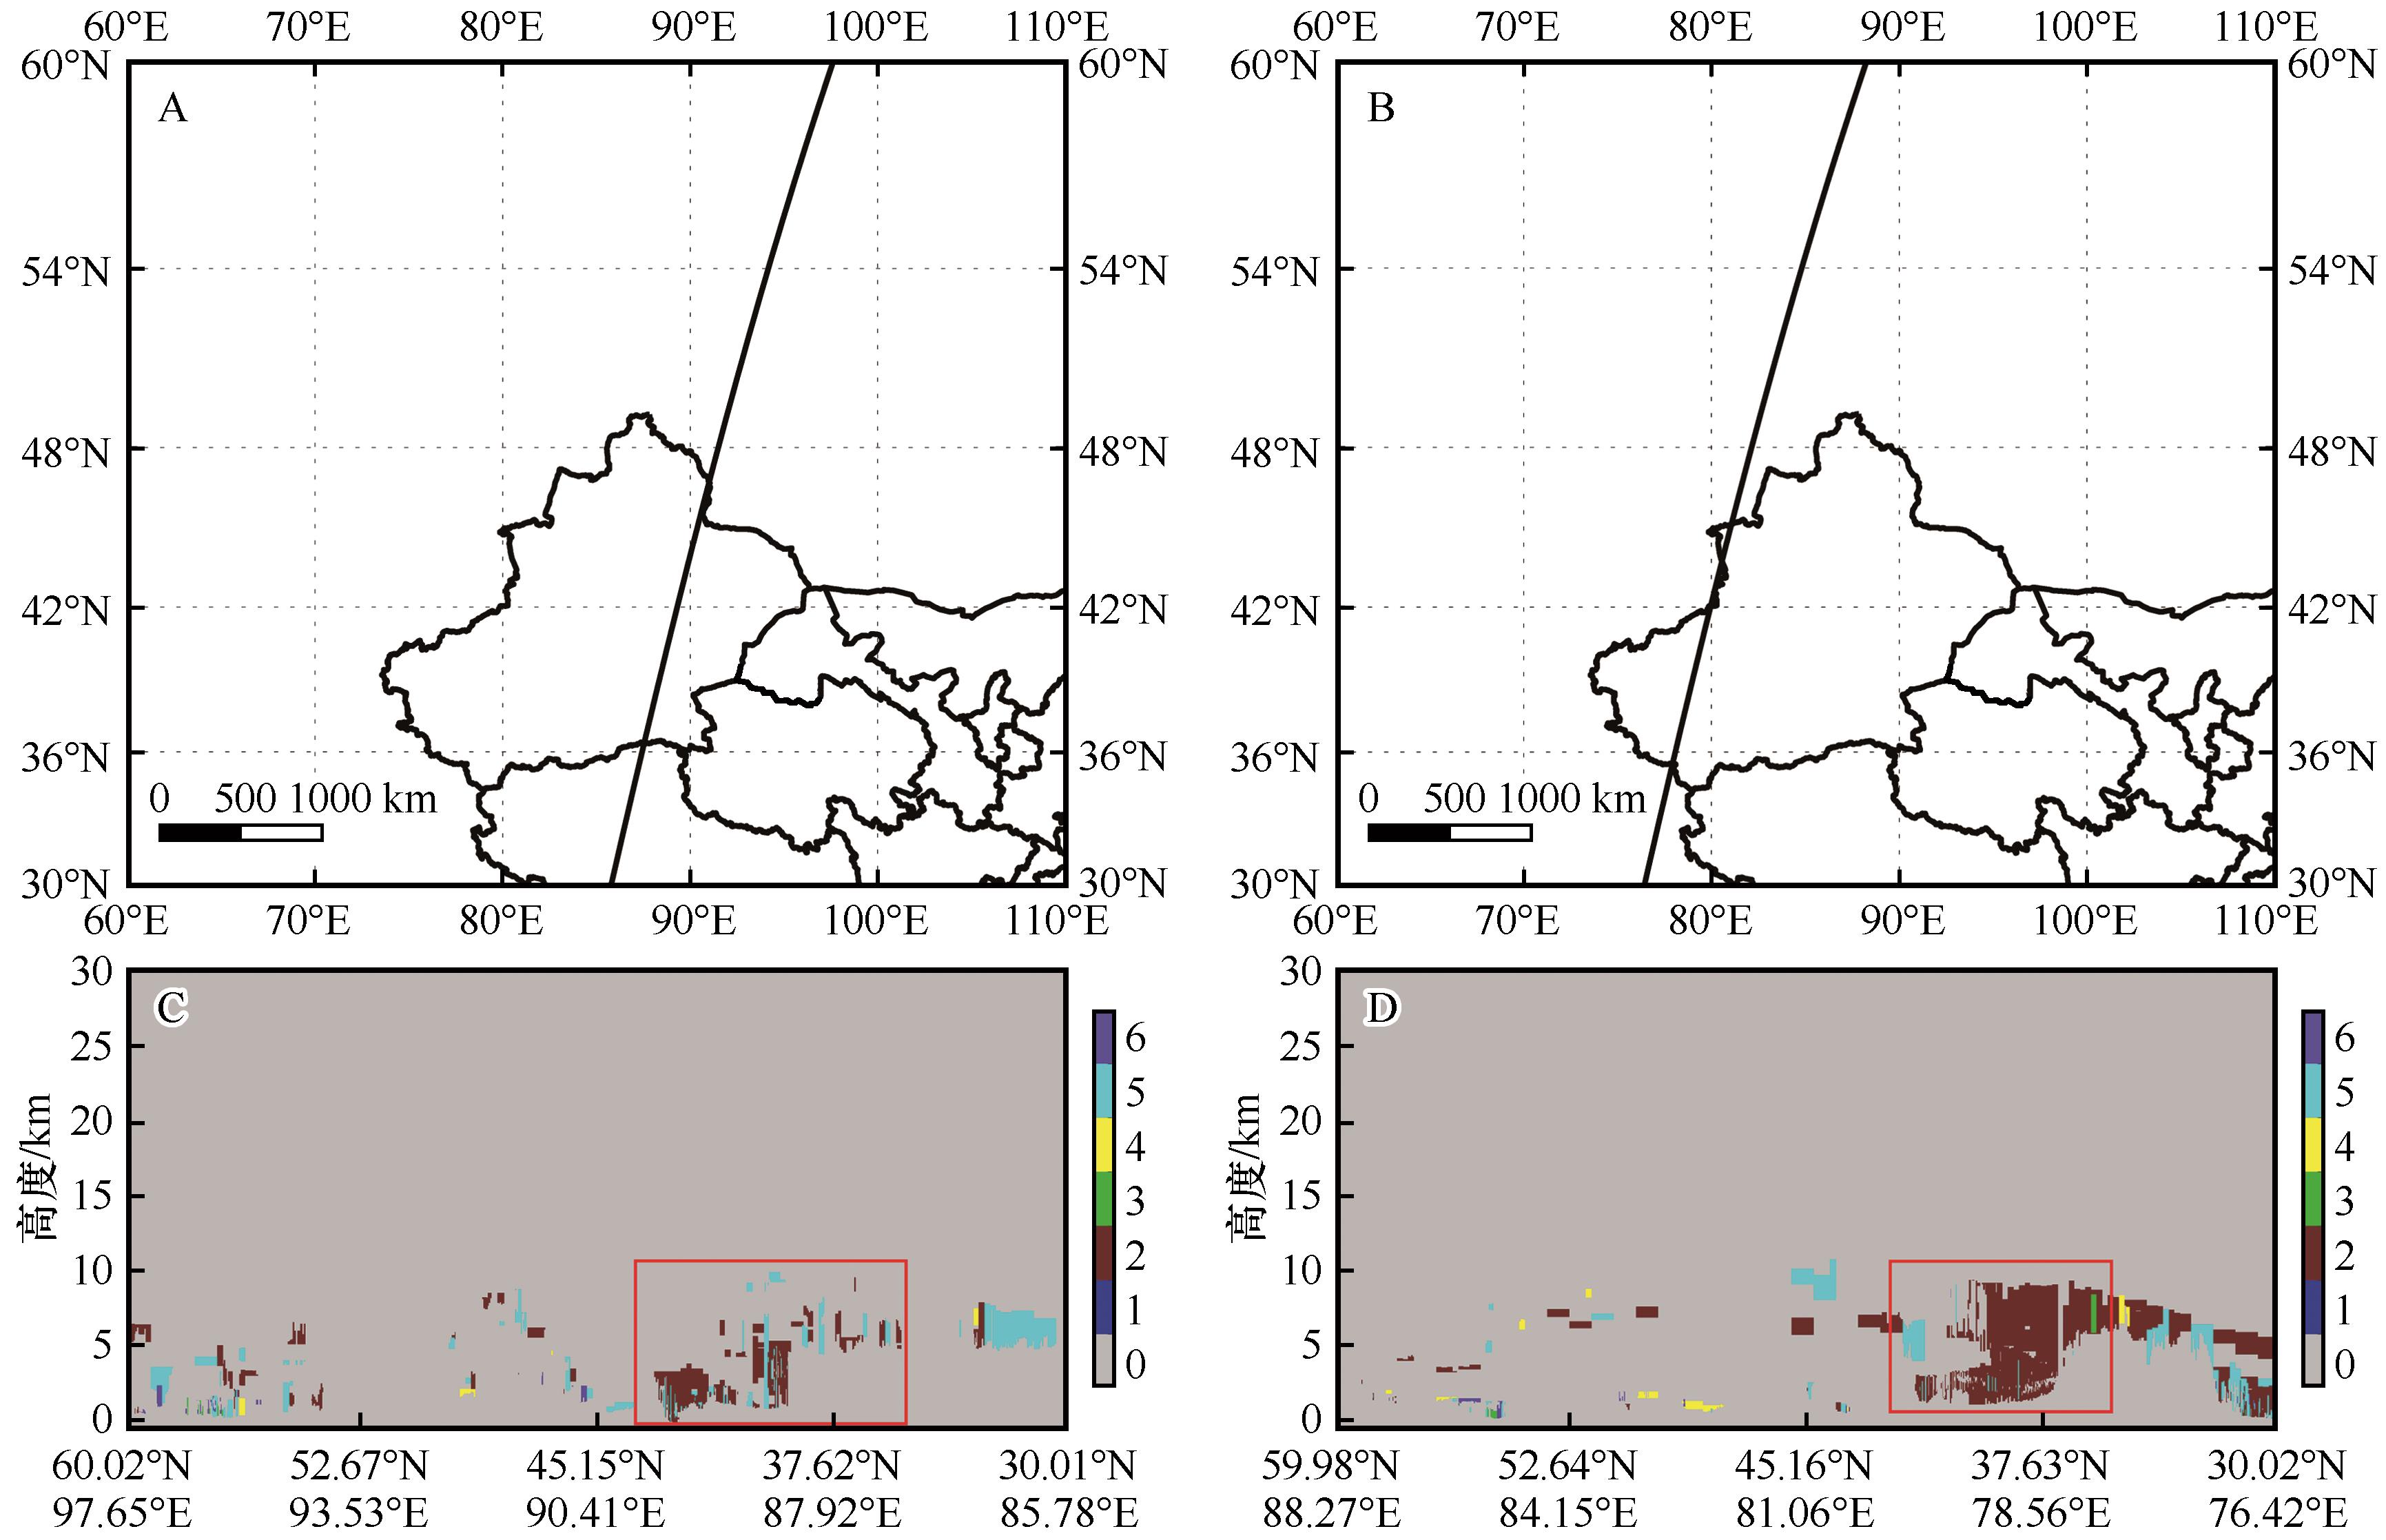
利用常规观测资料、再分析资料及CALIPSO星载激光雷达资料,基于HYSPLIT模式及潜在源贡献因子分析法、浓度权重轨迹分析法,对比分析了相似环流形势背景下塔里木盆地2015年6月和2022年3月两次典型沙尘天气过程,以和田为例分析两次过程中高低空系统配置、相关物理量特征、沙尘输送路径及潜在源区的差异。结果表明:两次天气过程均受高空槽影响,但2015年6月沙尘天气过程相对2022年3月沙尘天气过程高空槽位置更为偏南且具有明显的经向特征,阻塞高压系统的崩溃使得冷空气迅速爆发,大气垂直运动强烈,从而盆地内沙尘天气强度强于2022年3月沙尘天气过程。2022年3月沙尘天气过程除受槽底少许冷空气翻山造成沙尘天气外,低层偏东风急流相对2015年6月沙尘天气过程更为强盛,使得盆地东部出现沙尘暴并自西向东输送,盆地同时受东、西两路沙尘天气影响。2015年6月沙尘天气过程沙尘主要由偏西路径输送,主要源地为塔克拉玛干沙漠西部,并有部分沙尘由吉尔吉斯斯坦南部输入,2022年3月沙尘天气过程沙尘颗粒主要受偏东气流驱动,塔克拉玛干沙漠是主要起沙源地。2022年3月沙尘天气过程期间和田附近偏西风及偏东风场辐合使得沙尘颗粒汇聚,加之稳定的环流形势及相对暖湿的大气条件,沙尘不易扩散,因此低能见度持续时间相对更长。特殊的地理位置使得无论是盆地内部由西向东还是由东向西的沙尘过程都会在和田地区累积造成影响。

关键词: 沙尘天气, 诊断分析, 传输路径, 潜在源分析

Abstract:

Using the conventional observation data, NCEP reanalysis data and CALIPSO satellite data, HYSPLIT model, potential source contribution factor analysis method and concentration weight trajectory analysis method, two typical dust weather processes in summer of 2015 and spring of 2022 in Tarim Basin under similar circulation situation were compared and analyzed. Taking Hotan as an example, the differences of weather system configuration, related physical quantity characteristics, dust transport path and potential source areas in the two processes were analyzed. The results show that the two weather processes were both affected by the upper trough, but the location of the upper trough in summer of 2015 was more southward than that in spring of 2022 and had obvious meridional characteristics. The collapse of the blocking high system caused the rapid outbreak of cold air and the strong vertical movement of the atmosphere, so the intensity of dust weather in summer of 2015 in the basin was stronger than that in spring of 2022. In spring of 2022, in addition to the dust weather caused by a little cold air over the bottom of the trough, the low-level easterly jet was stronger than in summer of 2015, which caused the sandstorm in the east of the basin and transported from west to east. The dust in summer of 2015 was mainly transported by west path, and the main source was the west of Taklimakan Desert, and some dust was transported from south of Kyrgyzstan. The dust particles in spring of 2022 were mainly driven by easterly airflow, and Taklimakan Desert was the main source of dust. During spring of 2022, the convergence of the westerly and easterly wind fields near Hotan made the dust particles converge. In addition, the stable circulation situation and relatively warm and humid atmospheric conditions made the dust difficult to diffuse. Therefore, the duration of low visibility in spring of 2022 was relatively longer. The special geographical location made the dust process from west to east or from east to west in the basin accumulated in Hotan area.

Key words: dust weather, diagnostic analysis, transmission path, potential source analysis

中图分类号: