中国沙漠 ›› 2021, Vol. 41 ›› Issue (4): 12-22.DOI: 10.7522/j.issn.1000-694X.2021.00026
杨洁a( ), 谢保鹏b, 张德罡a()
收稿日期:2020-12-18
修回日期:2021-03-12
出版日期:2021-07-27
发布日期:2021-07-27
通讯作者:
张德罡
作者简介:张德罡(E-mail: zhangdg@gsau.edu.cn)基金资助:
Jie Yanga(), Baopeng Xieb, Degang Zhanga()
Received:2020-12-18
Revised:2021-03-12
Online:2021-07-27
Published:2021-07-27
Contact:
Degang Zhang
摘要:
黄河流域是中国重要的生态区域,探究该流域生物多样性时空变化特征对区域生态保护修复具有重要意义。运用InVEST模型评估黄河流域2000—2018年生境质量并结合空间自相关模型探究其时空变化及分布特征,利用地理探测器单因子探测和交互探测方法分析生境质量空间分异特征的驱动因子。结果表明:2000—2018年,黄河流域平均生境质量指数为0.631,整体呈现小幅下降趋势,下降幅度为0.16%,在空间上表现出西高东低的分布特征;黄河流域生境质量在空间上表现高度正相关特征,表现为生境质量相似值在空间上集聚,生境质量低值区域集中在黄河流域下游、关中平原以及汾河谷地区,生境质量高值区域集中在黄河上游青藏高原地区;土地利用/覆被是生境质量空间分异最重要的驱动因子,q值为0.5560,而且任何两种驱动因子对生境质量空间分异的交互作用都要大于单个驱动因子的作用,土地利用/覆被与气温、海拔、降雨量、坡度以及NDVI的交互因子均大于0.5。
中图分类号:
杨洁, 谢保鹏, 张德罡. 黄河流域生境质量时空演变及其影响因素[J]. 中国沙漠, 2021, 41(4): 12-22.
Jie Yang, Baopeng Xie, Degang Zhang. Spatial-temporal evolution of habitat quality and its influencing factors in the Yellow River Basin based on InVEST model and GeoDetector[J]. Journal of Desert Research, 2021, 41(4): 12-22.
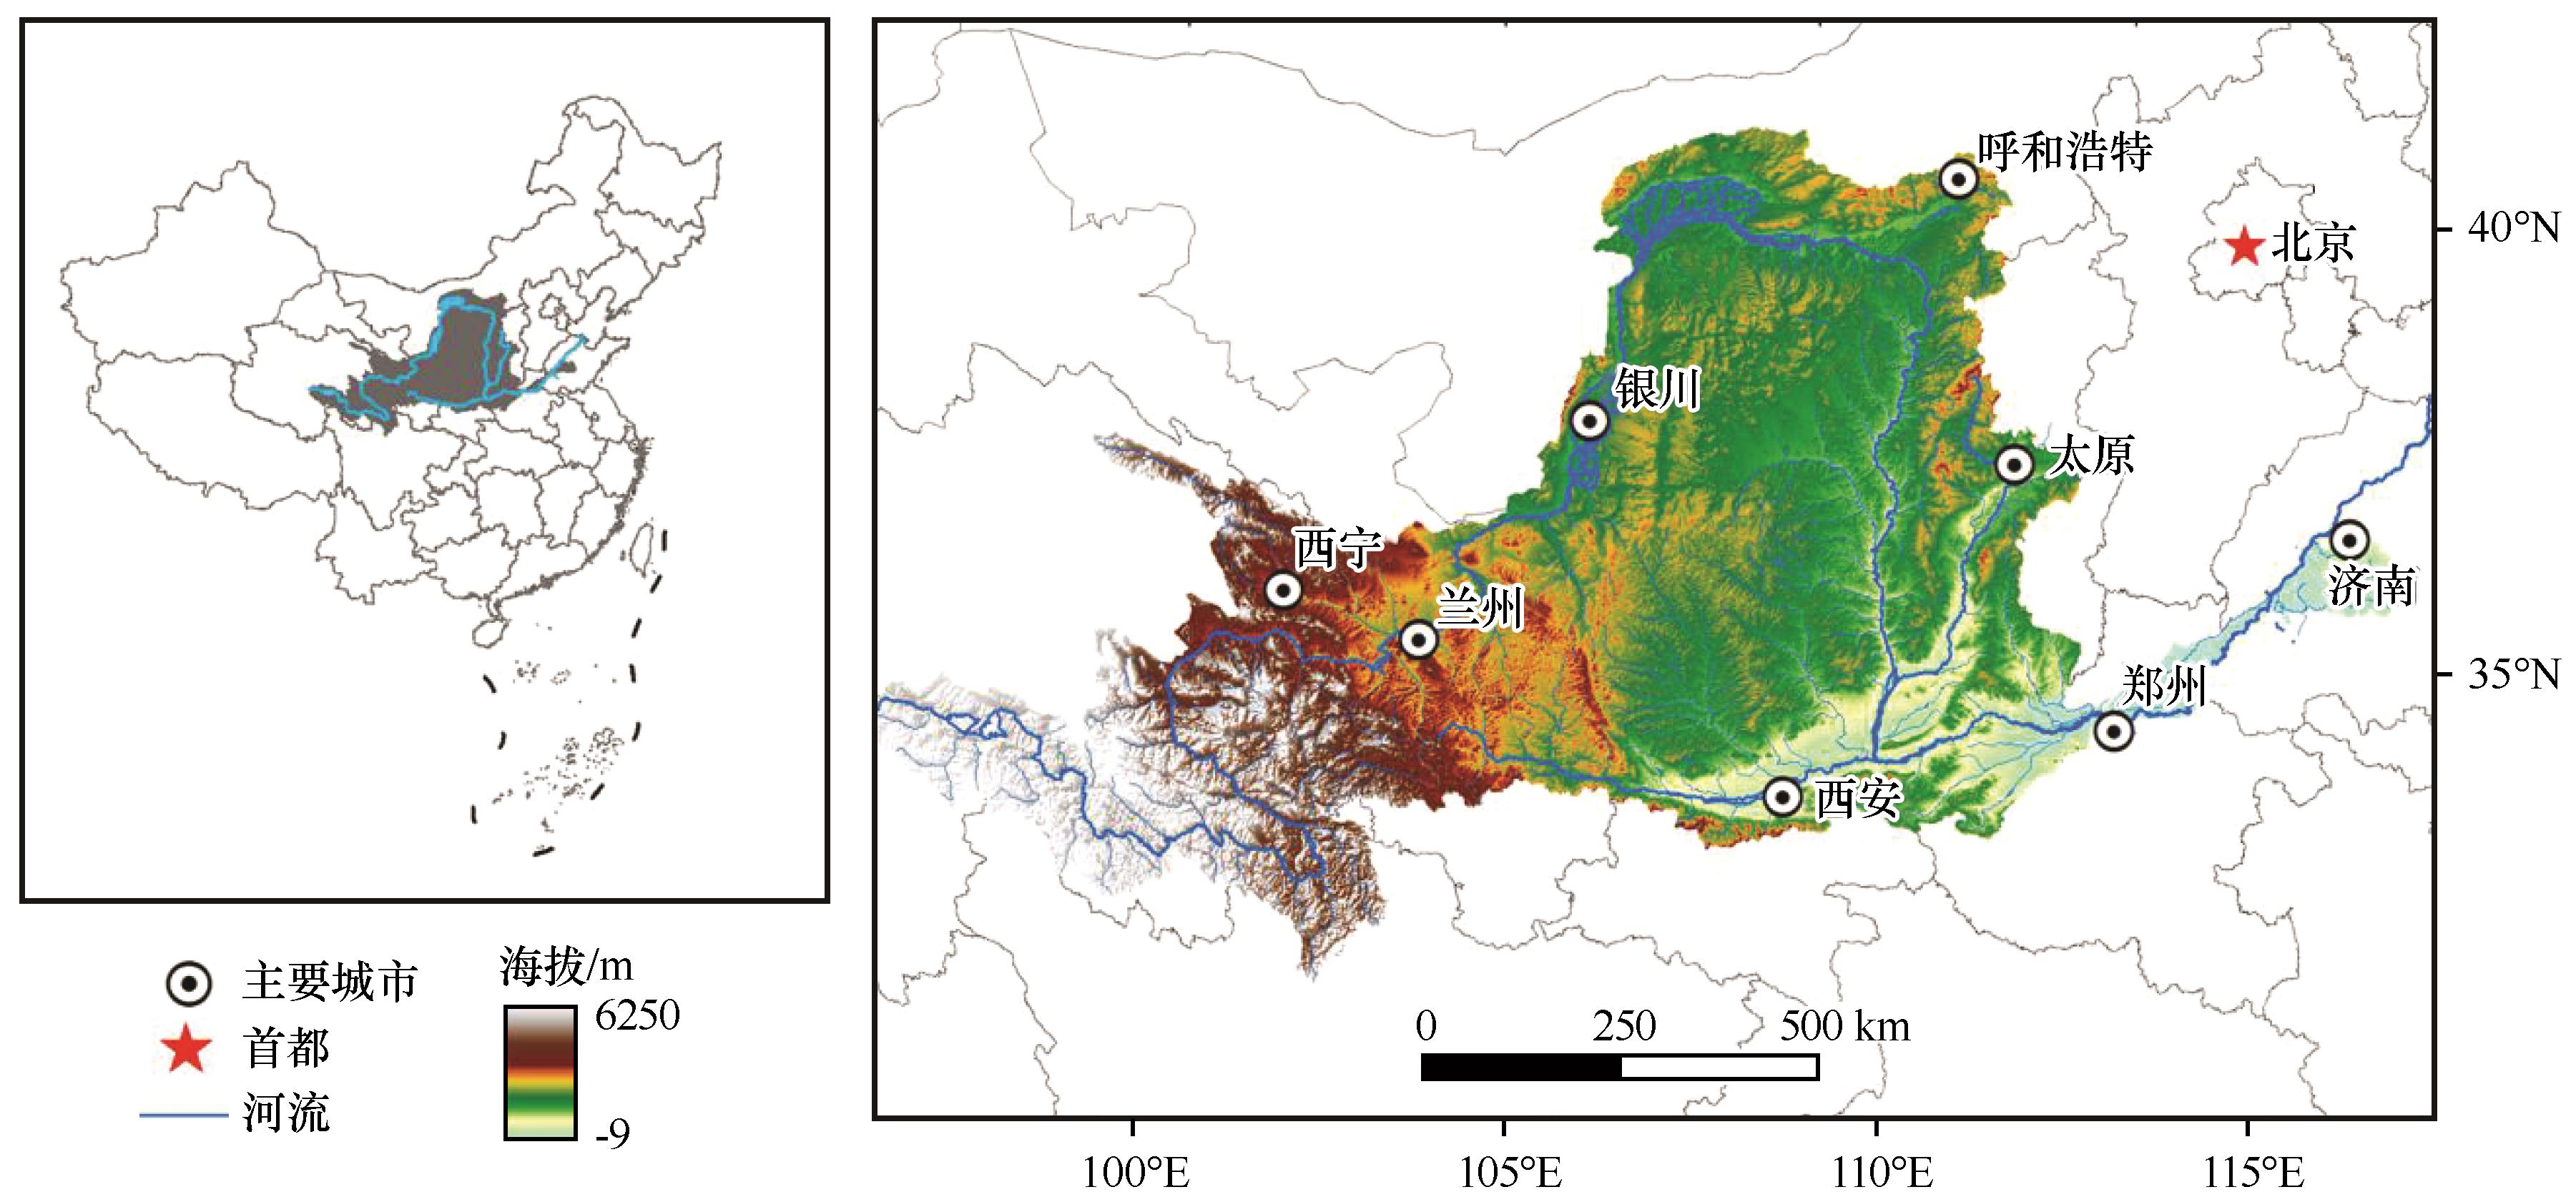
图1 黄河流域范围及水系分布
Fig.1 Range of Yellow River Basin and distribution of river system
| 威胁因子 | 最大影响距离/km | 权重 | 衰退类型 |
|---|---|---|---|
| 城镇用地 | 10 | 1.0 | 指数 |
| 农村居民地 | 8 | 0.8 | 指数 |
| 其他建设用地 | 9 | 0.9 | 指数 |
| 耕地 | 6 | 0.6 | 线性 |
| 未利用地 | 4 | 0.4 | 线性 |
表1 威胁源的权重和最大影响距离
Table 1 The weight and the maximum influence distance of the threat source
| 威胁因子 | 最大影响距离/km | 权重 | 衰退类型 |
|---|---|---|---|
| 城镇用地 | 10 | 1.0 | 指数 |
| 农村居民地 | 8 | 0.8 | 指数 |
| 其他建设用地 | 9 | 0.9 | 指数 |
| 耕地 | 6 | 0.6 | 线性 |
| 未利用地 | 4 | 0.4 | 线性 |
| 土地利用/覆被 | 生境适宜度 | 敏感度 | ||||
|---|---|---|---|---|---|---|
| 城镇用地 | 农村居民点 | 其他建设用地 | 耕地 | 未利用地 | ||
| 耕地 | 0.3 | 0.8 | 0.6 | 0.7 | 0.0 | 0.4 |
| 林地 | 1.0 | 0.8 | 0.7 | 0.7 | 0.6 | 0.2 |
| 草地 | 1.0 | 0.7 | 0.5 | 0.6 | 0.5 | 0.6 |
| 水域 | 0.9 | 0.7 | 0.6 | 0.7 | 0.4 | 0.4 |
| 建设用地 | 0.0 | 0.0 | 0.0 | 0.0 | 0.0 | 0.0 |
| 未利用地 | 0.6 | 0.6 | 0.5 | 0.6 | 0.4 | 0.0 |
表2 各土地利用/覆被对威胁因子的敏感度
Table 2 Sensitivity of land use type to habitat threat factors
| 土地利用/覆被 | 生境适宜度 | 敏感度 | ||||
|---|---|---|---|---|---|---|
| 城镇用地 | 农村居民点 | 其他建设用地 | 耕地 | 未利用地 | ||
| 耕地 | 0.3 | 0.8 | 0.6 | 0.7 | 0.0 | 0.4 |
| 林地 | 1.0 | 0.8 | 0.7 | 0.7 | 0.6 | 0.2 |
| 草地 | 1.0 | 0.7 | 0.5 | 0.6 | 0.5 | 0.6 |
| 水域 | 0.9 | 0.7 | 0.6 | 0.7 | 0.4 | 0.4 |
| 建设用地 | 0.0 | 0.0 | 0.0 | 0.0 | 0.0 | 0.0 |
| 未利用地 | 0.6 | 0.6 | 0.5 | 0.6 | 0.4 | 0.0 |
| 判断依据 | 交互作用类型 |
|---|---|
| 非线性减弱 | |
| min( | 单因子非线性减弱 |
| 双因子增强 | |
| 独立 | |
| 非线性增强 |
表3 双因子交互作用结果类型
Table 3 Types of two-factor interaction result
| 判断依据 | 交互作用类型 |
|---|---|
| 非线性减弱 | |
| min( | 单因子非线性减弱 |
| 双因子增强 | |
| 独立 | |
| 非线性增强 |
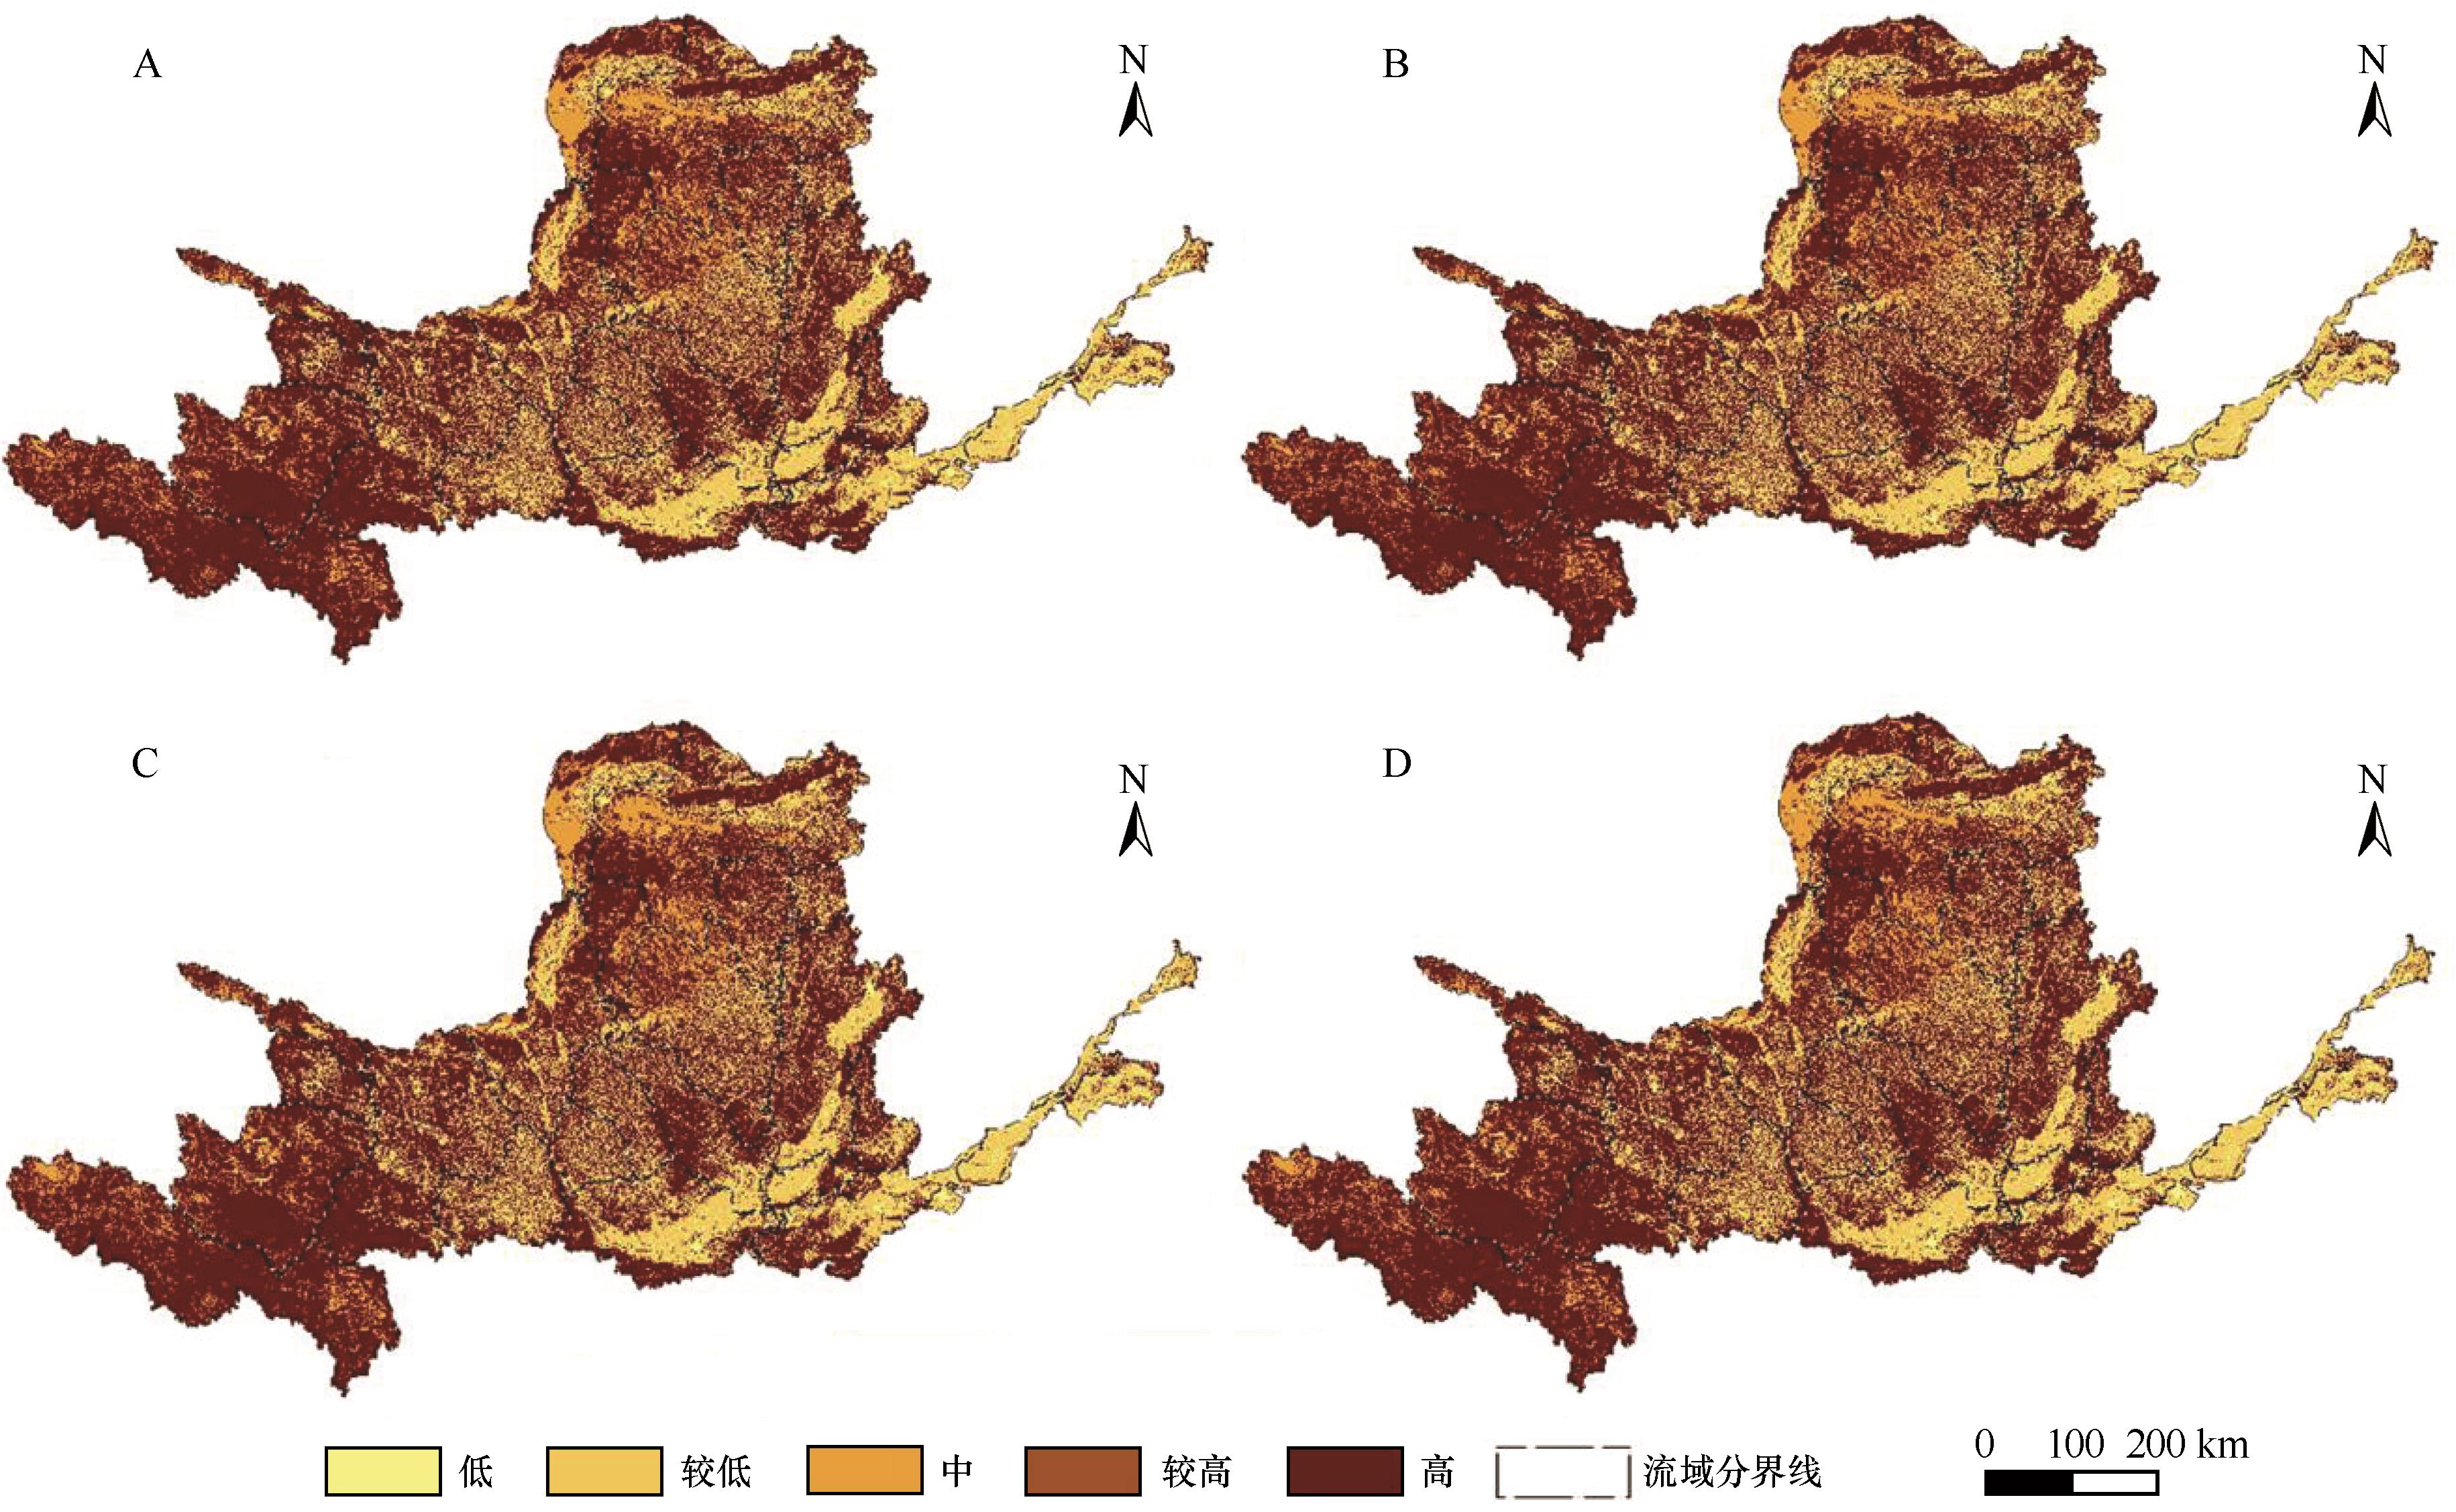
图2 2000年(A)、2005年(B)、2010年(C)和2018年(D)黄河流域生境质量空间分布
Fig.2 Spatial distribution of habitat quality in 2000 (A), 2005 (B), 2010 (C), 2018 (D)
| 等级 | 生境质量 指数 | 各质量等级生境在不同年份所占的比例/% | |||
|---|---|---|---|---|---|
| 2000年 | 2005年 | 2010年 | 2018年 | ||
| 低 | 0.0—0.2 | 2.31 | 2.31 | 2.56 | 3.02 |
| 较低 | 0.2—0.4 | 27.05 | 27.05 | 26.51 | 26.31 |
| 中等 | 0.4—0.6 | 8.96 | 8.96 | 9.11 | 8.93 |
| 较高 | 0.6—0.8 | 0.00 | 0.00 | 0.00 | 0.00 |
| 高 | 0.8—1.0 | 61.68 | 61.68 | 61.82 | 61.74 |
表4 黄河流域2000—2018年各质量等级生境所占比例
Table 4 Proportion of habitat quality of different grades in the Yellow River Basin from 2000 to 2018
| 等级 | 生境质量 指数 | 各质量等级生境在不同年份所占的比例/% | |||
|---|---|---|---|---|---|
| 2000年 | 2005年 | 2010年 | 2018年 | ||
| 低 | 0.0—0.2 | 2.31 | 2.31 | 2.56 | 3.02 |
| 较低 | 0.2—0.4 | 27.05 | 27.05 | 26.51 | 26.31 |
| 中等 | 0.4—0.6 | 8.96 | 8.96 | 9.11 | 8.93 |
| 较高 | 0.6—0.8 | 0.00 | 0.00 | 0.00 | 0.00 |
| 高 | 0.8—1.0 | 61.68 | 61.68 | 61.82 | 61.74 |
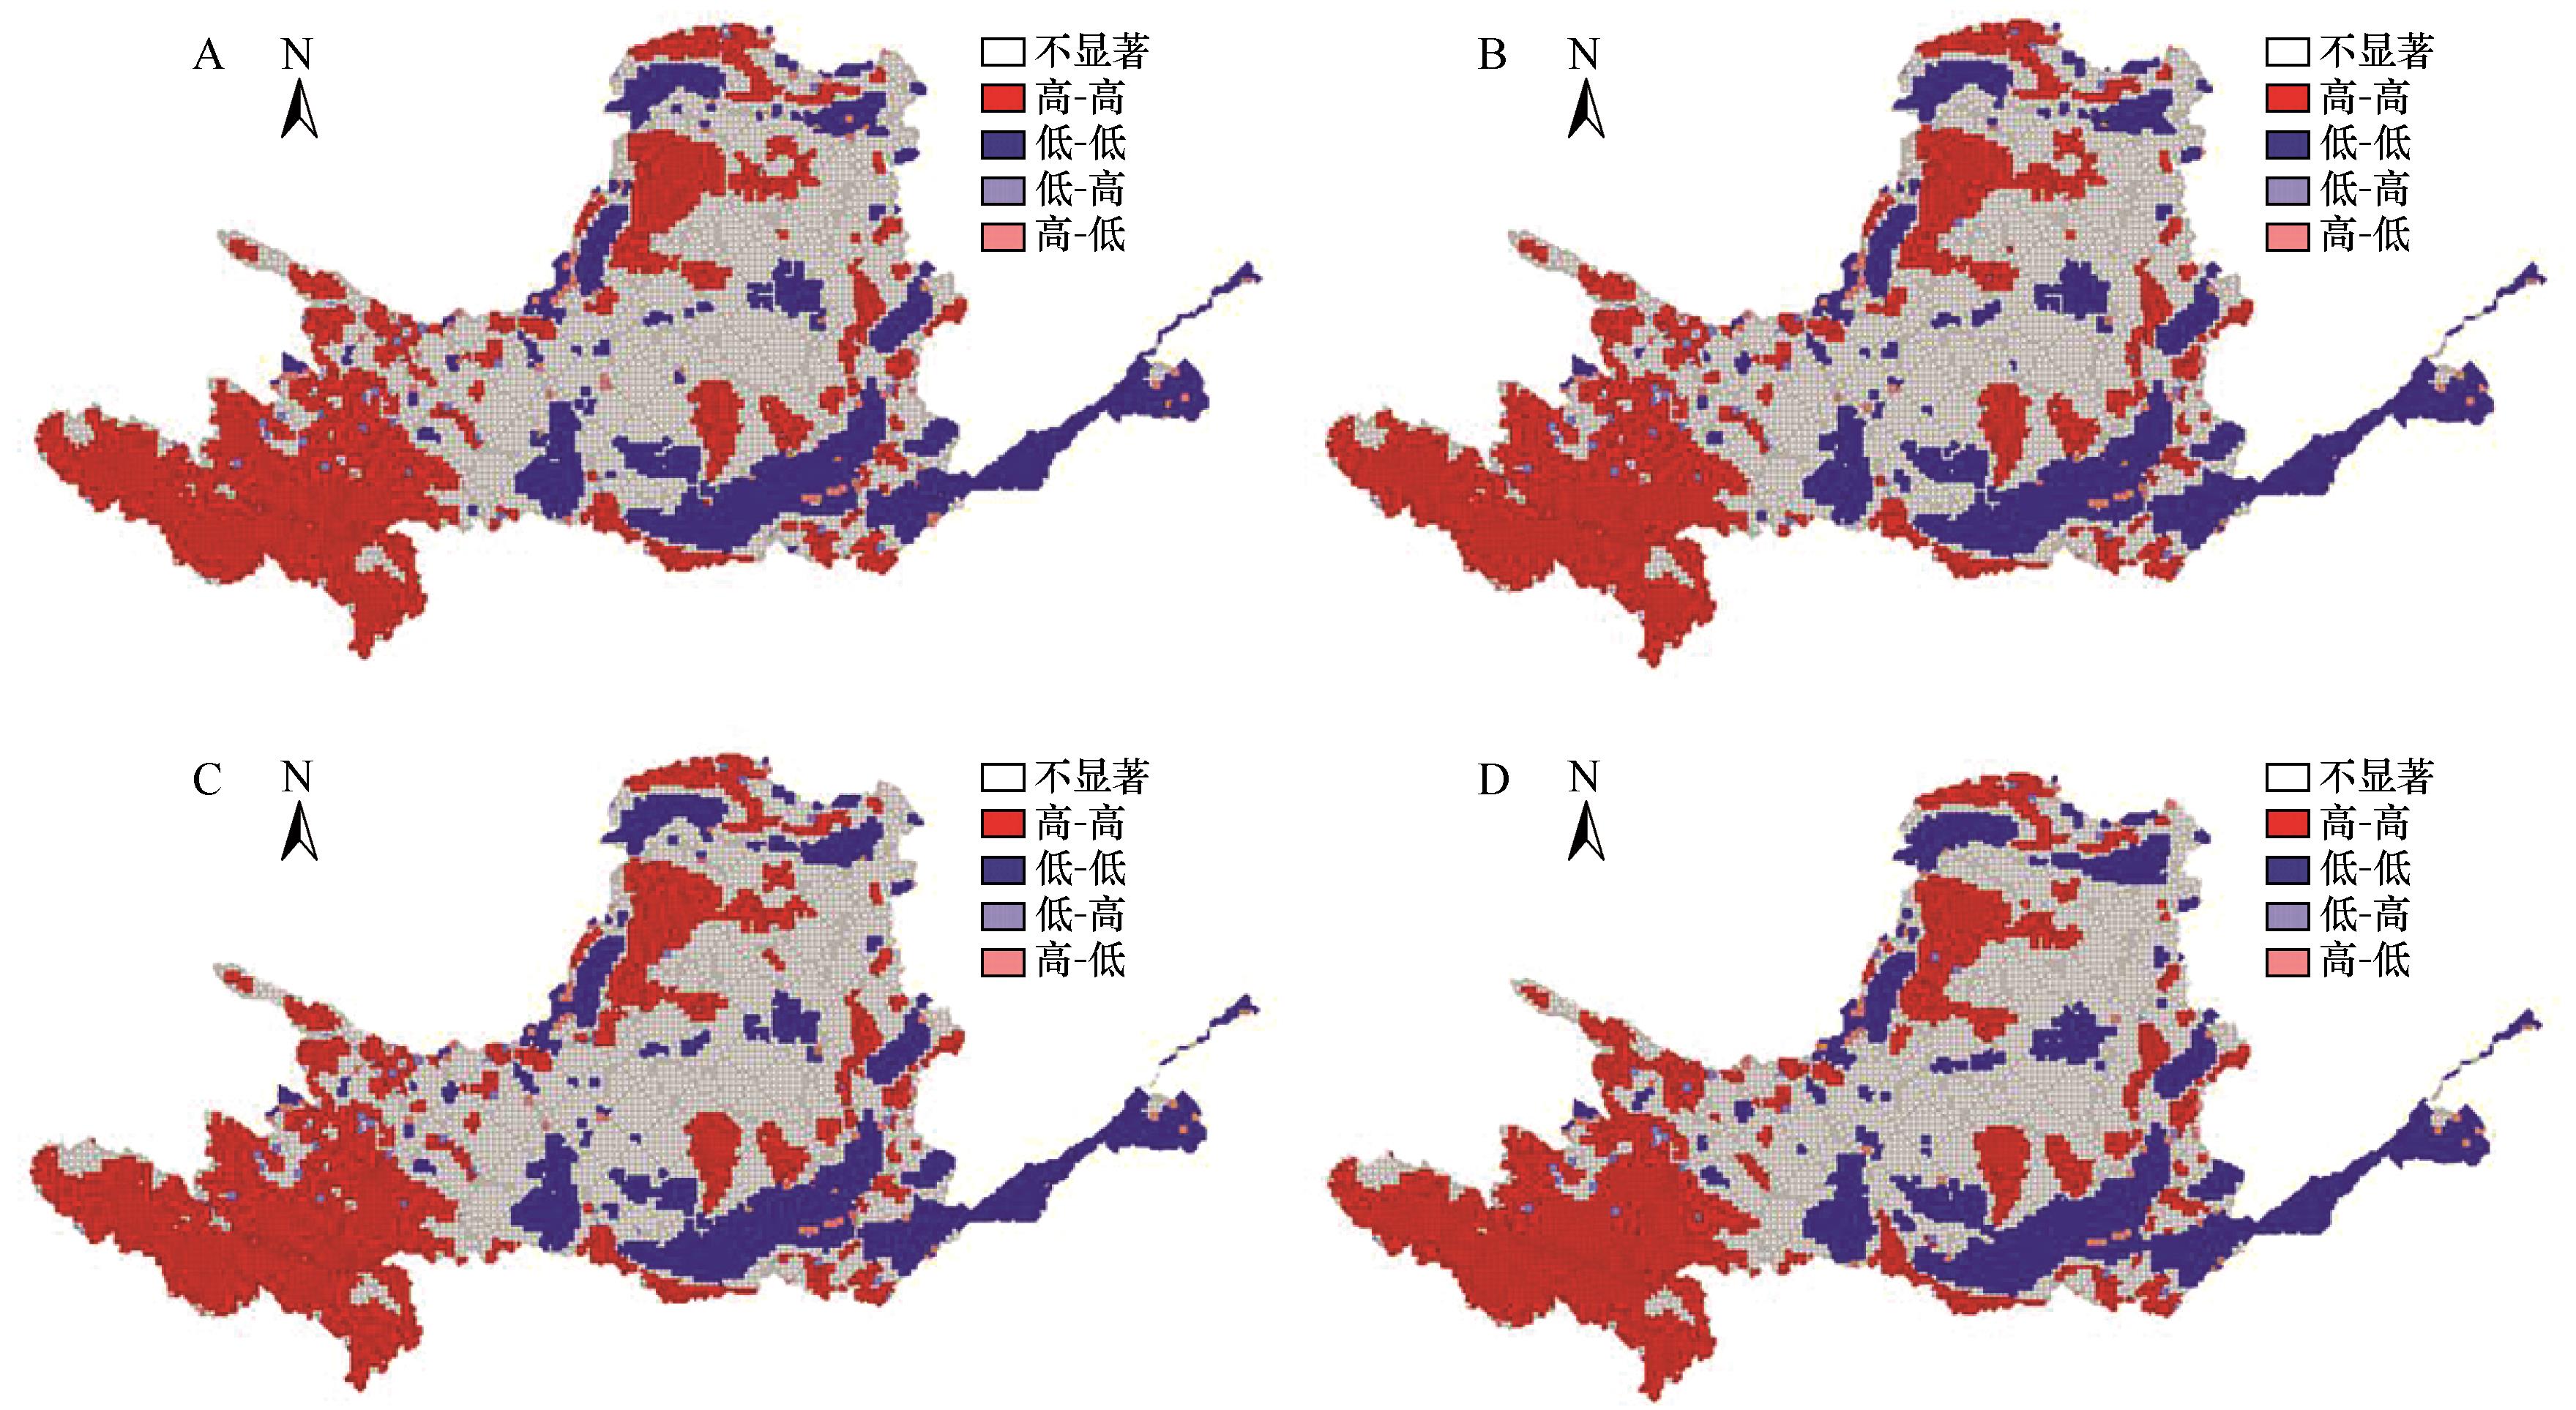
图3 2000年(A)、2005年(B)、2010年(C)和2018年(D)黄河流域生境质量空间LISA集聚图
Fig.3 Spatial Lisa cluster of habitat quality in 2000 (A), 2005 (B), 2010 (C), 2018 (D)
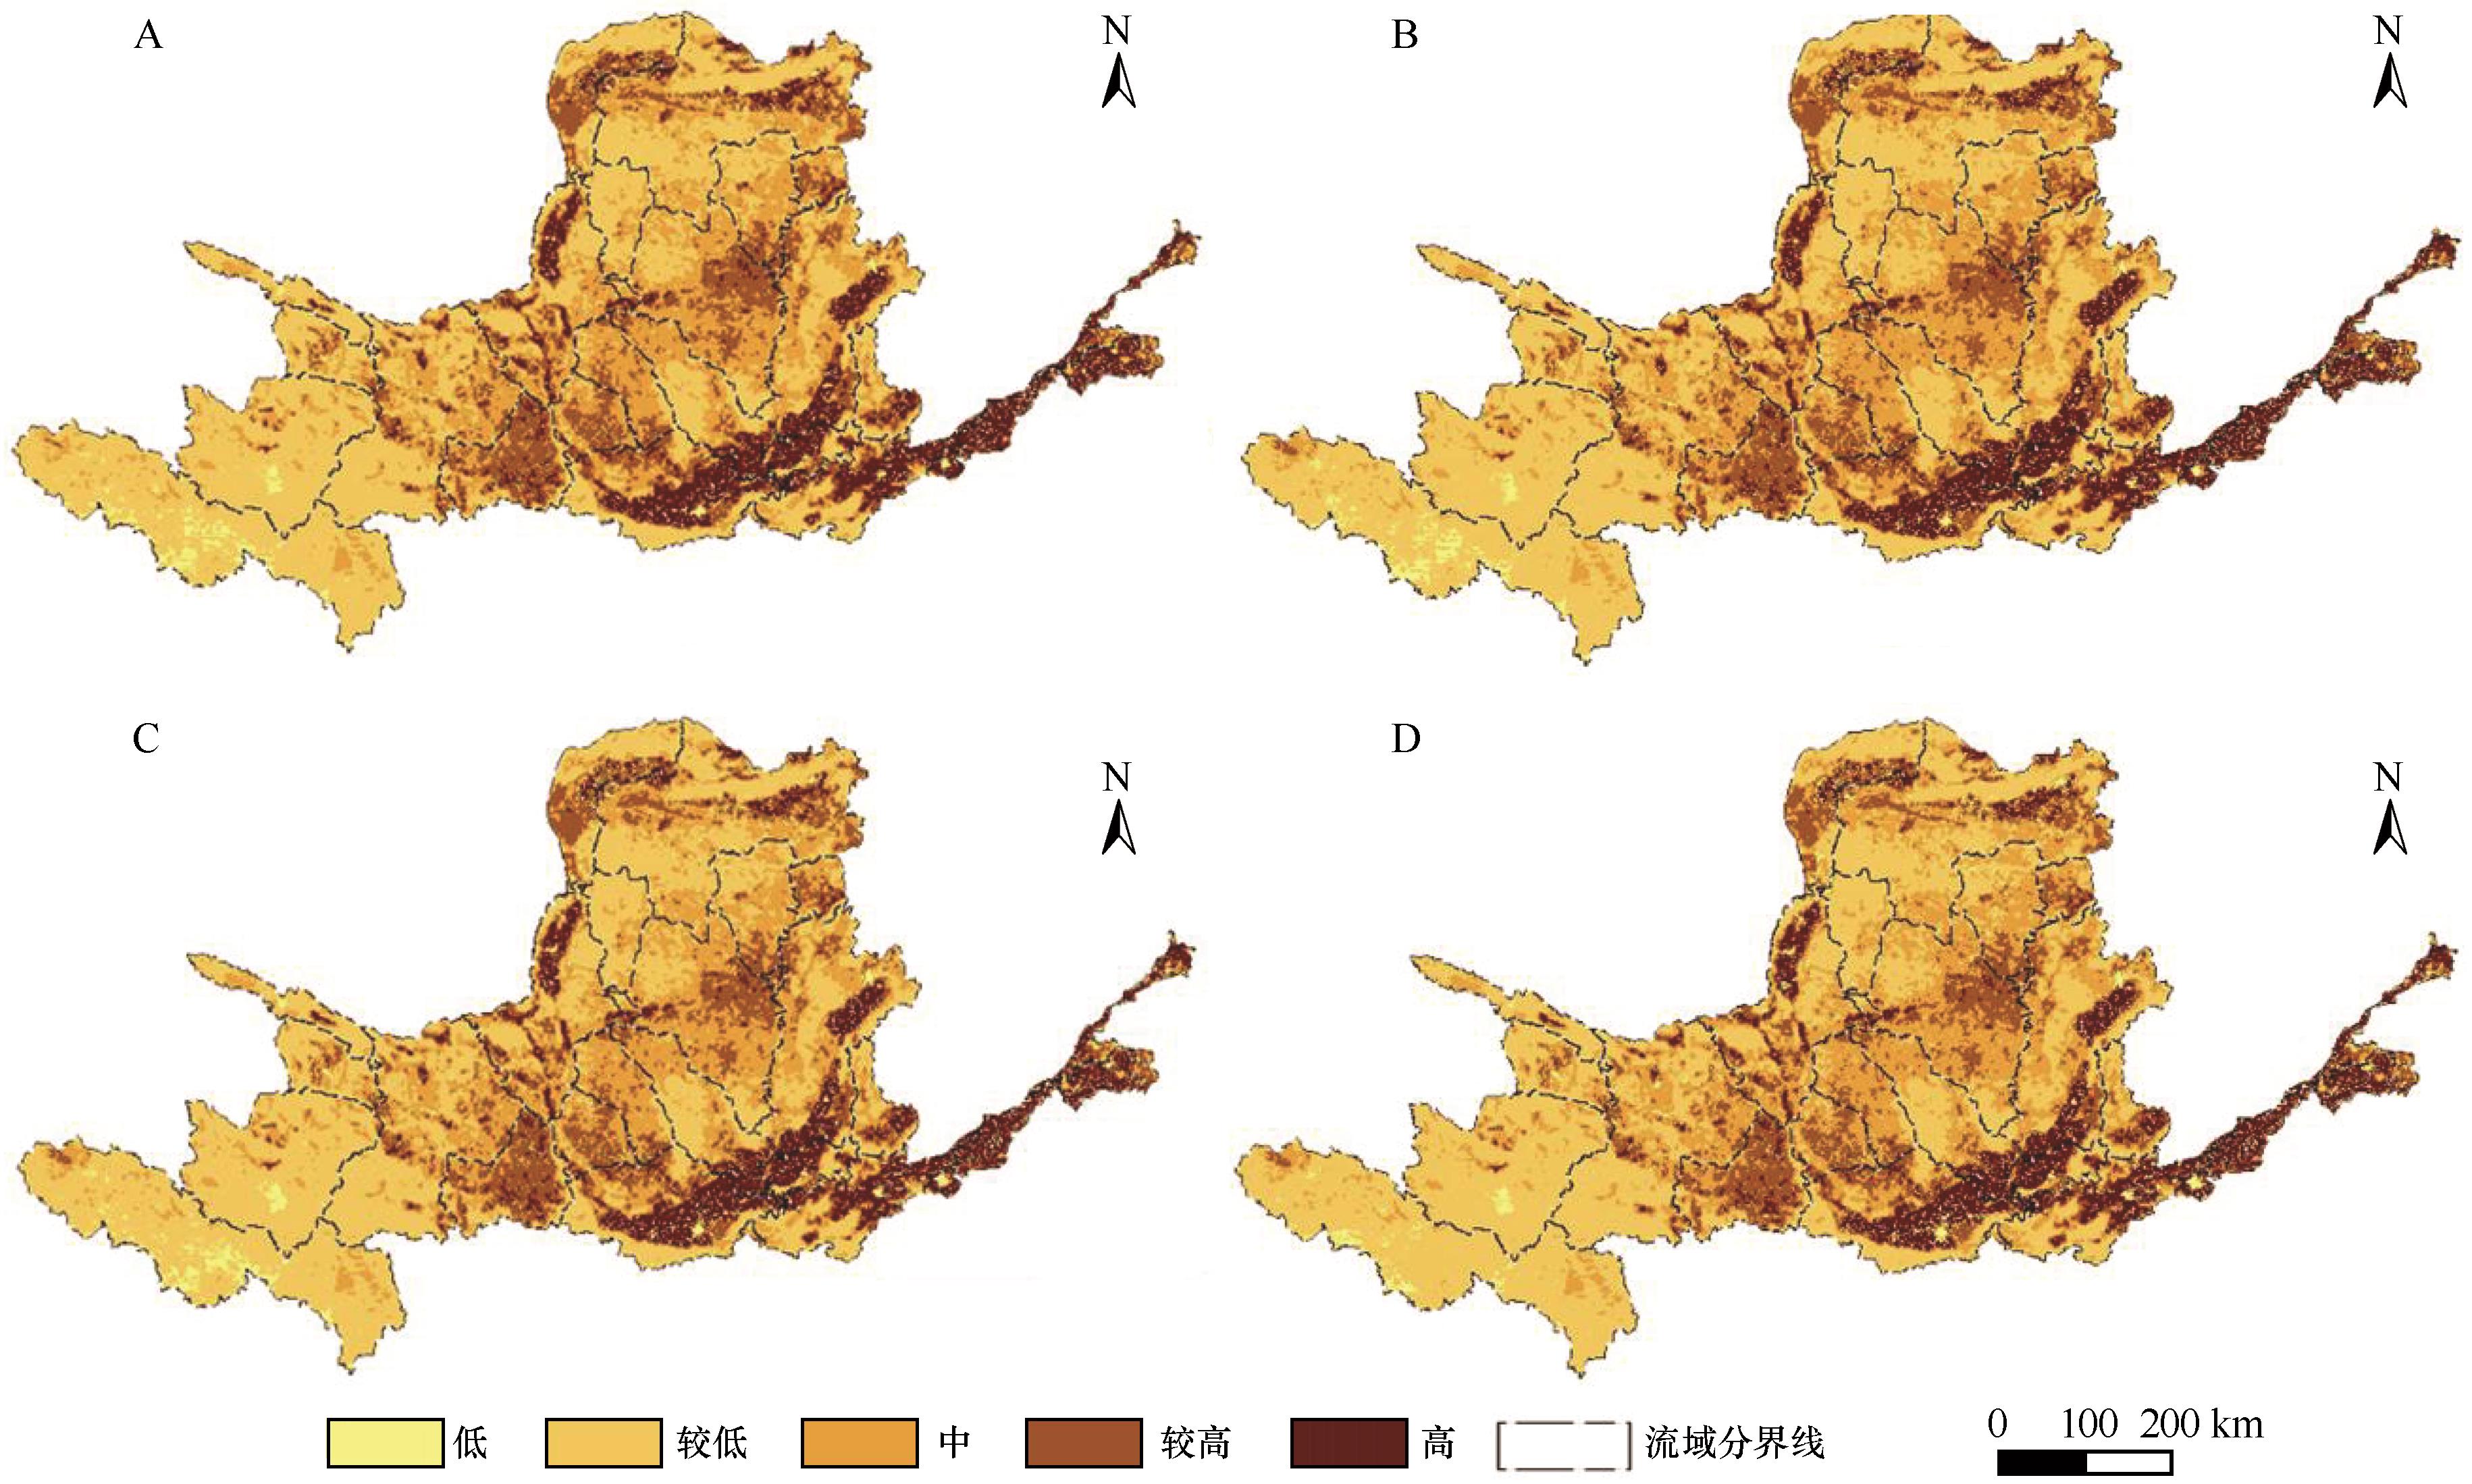
图4 2000年(A)、2005年(B)、2010年(C)和2018年(D)黄河流域生境退化度空间分布
Fig.4 Spatial distribution of habitat quality degradation in 2000 (A), 2005 (B), 2010 (C), 2018 (D)
| 等级 | 生境 退化度 | 各退化度等级生境在不同年份所占的比例/% | |||
|---|---|---|---|---|---|
| 2000年 | 2005年 | 2010年 | 2018年 | ||
| 低 | 0.00 | 3.225 | 3.233 | 3.532 | 3.493 |
| 较低 | 0.00—0.03 | 43.438 | 43.560 | 43.514 | 43.472 |
| 中等 | 0.03—0.06 | 27.833 | 28.099 | 28.097 | 28.394 |
| 较高 | 0.06—0.09 | 16.052 | 15.808 | 15.702 | 15.675 |
| 高 | ≥0.09 | 9.452 | 9.300 | 9.155 | 8.966 |
表5 黄河流域2000—2018年各退化度等级生境所占比例
Table 5 Proportion of habitat quality of different degradation grades in the Yellow River Basin from 2000 to 2018
| 等级 | 生境 退化度 | 各退化度等级生境在不同年份所占的比例/% | |||
|---|---|---|---|---|---|
| 2000年 | 2005年 | 2010年 | 2018年 | ||
| 低 | 0.00 | 3.225 | 3.233 | 3.532 | 3.493 |
| 较低 | 0.00—0.03 | 43.438 | 43.560 | 43.514 | 43.472 |
| 中等 | 0.03—0.06 | 27.833 | 28.099 | 28.097 | 28.394 |
| 较高 | 0.06—0.09 | 16.052 | 15.808 | 15.702 | 15.675 |
| 高 | ≥0.09 | 9.452 | 9.300 | 9.155 | 8.966 |
| 影响因子 | NDVI | 人口密度 | GDP | 土地利用/覆被 | 降雨量 | 气温 | 坡度 | 海拔 |
|---|---|---|---|---|---|---|---|---|
| 决定力 | 0.3500 | 0.2012 | 0.2000 | 0.5560 | 0.2066 | 0.4394 | 0.1541 | 0.3430 |
表6 生境质量空间分异特征的影响因子探测结果
Table 6 GeoDetector of habitat quality factors
| 影响因子 | NDVI | 人口密度 | GDP | 土地利用/覆被 | 降雨量 | 气温 | 坡度 | 海拔 |
|---|---|---|---|---|---|---|---|---|
| 决定力 | 0.3500 | 0.2012 | 0.2000 | 0.5560 | 0.2066 | 0.4394 | 0.1541 | 0.3430 |
| 影响因子 | NDVI | 人口密度 | GDP | 土地利用/覆被 | 降雨量 | 气温 | 坡度 | 海拔 |
|---|---|---|---|---|---|---|---|---|
| NDVI | 0.3500 | |||||||
| 人口密度 | 0.3913 | 0.2012 | ||||||
| GDP | 0.3906 | 0.2020 | 0.2000 | |||||
| 土地利用/覆被 | 0.6764 | 0.5647 | 0.5634 | 0.5560 | ||||
| 降雨量 | 0.4709 | 0.2725 | 0.2789 | 0.6131 | 0.2066 | |||
| 气温 | 0.6659 | 0.5082 | 0.5083 | 0.7012 | 0.4934 | 0.4394 | ||
| 坡度 | 0.5096 | 0.3147 | 0.3133 | 0.6986 | 0.4042 | 0.5159 | 0.1541 | |
| 海拔 | 0.6488 | 0.5091 | 0.5086 | 0.7021 | 0.4773 | 0.4634 | 0.3964 | 0.3430 |
表7 生境质量空间分异特征影响因子的交互作用探测结果
Table 7 Interactive detection of habitat quality factors
| 影响因子 | NDVI | 人口密度 | GDP | 土地利用/覆被 | 降雨量 | 气温 | 坡度 | 海拔 |
|---|---|---|---|---|---|---|---|---|
| NDVI | 0.3500 | |||||||
| 人口密度 | 0.3913 | 0.2012 | ||||||
| GDP | 0.3906 | 0.2020 | 0.2000 | |||||
| 土地利用/覆被 | 0.6764 | 0.5647 | 0.5634 | 0.5560 | ||||
| 降雨量 | 0.4709 | 0.2725 | 0.2789 | 0.6131 | 0.2066 | |||
| 气温 | 0.6659 | 0.5082 | 0.5083 | 0.7012 | 0.4934 | 0.4394 | ||
| 坡度 | 0.5096 | 0.3147 | 0.3133 | 0.6986 | 0.4042 | 0.5159 | 0.1541 | |
| 海拔 | 0.6488 | 0.5091 | 0.5086 | 0.7021 | 0.4773 | 0.4634 | 0.3964 | 0.3430 |
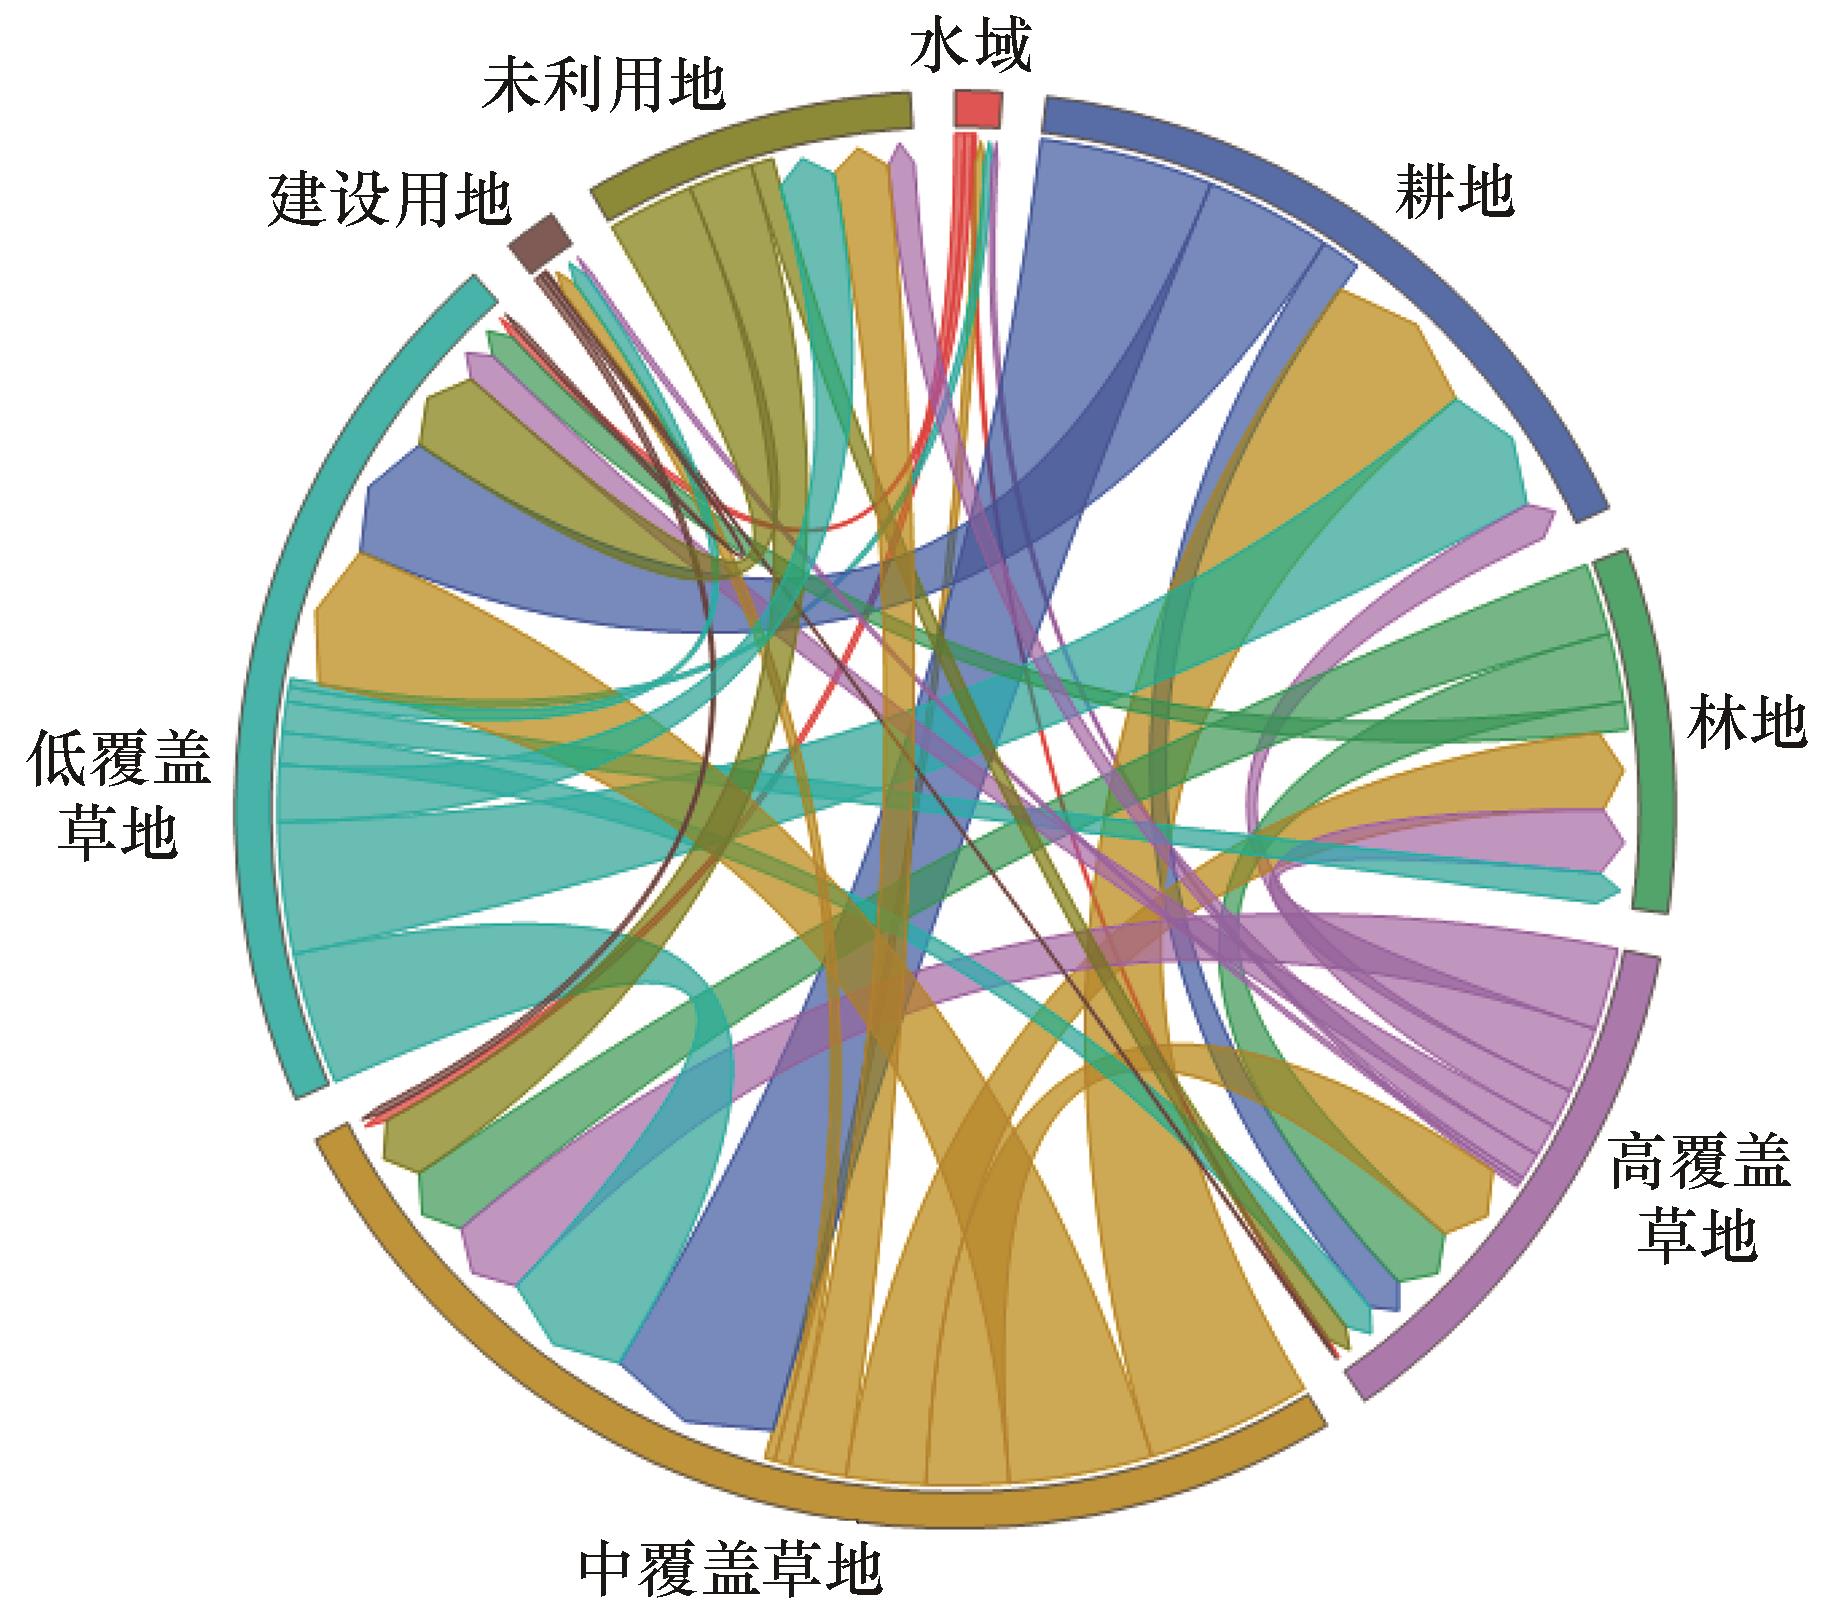
图5 黄河流域2000—2018土地利用转移矩阵
Fig.5 Transition matrix of land-use in the Yellow River Basin in 2000—2018
| 1 | Millennium Ecosystem Assessment.Ecosystems and Human Well-being:Biodiversity Synthesis[R].Washington DC,USA:Island Press,2005. |
| 2 | Ellis E C,Pascual U,Mertz O.Ecosystem services and nature’s contribution to people:negotiating diverse values and trade-offs in land systems[J].Current Opinion in Environmental Sustainability,2019,38:86-94. |
| 3 | Watson K B,Galford G L,Sonter L J,et al.Effects of human demand on conservation planning for biodiversity and ecosystem services[J].Conservation Biology,2019,33:942-952. |
| 4 | Fellman J B,Hood E,Dryer W,et al.Stream physical characteristics impact habitat quality for pacific salmon in two temperate coastal watersheds[J].PloS One,2003,10(7):e0132652. |
| 5 | Gaglio M,Aschonitis V G,Gissi E,et al.Land use change effects on ecosystem services of river deltas and coastal wetlands:case study in Volano-Mesola-Goro in Po river delta (Italy)[J].Wetlands Ecology and Management,2017,25:67-86. |
| 6 | Gao Y,Ma L,Liu J X,et al.Constructing ecological networks based on habitat quality assessment:a case study of Changzhou,China[J].Scientific Reports,2017,7:46073. |
| 7 | Sharp R,Tallis H T,Ricketts T,et al.InVEST 3.2.0 User's Guide[Z].The Natural Capital Project,Stanford University,University of Minnesota,The Nature Conservancy,World Wildlife Fund,2018. |
| 8 | Hillard E M,Nielsen C K,Groninger J W.Swamp rabbits as indicators of wildlife habitat quality in bottomland hardwood forest ecosystems[J].Ecological Indicators,2017,79:47-53. |
| 9 | Dominique W,Gabriela S,Klaus E.Predicting habitat quality of protected dry grasslands using Landsat NDVI phenology[J].Ecological Indicators,2018,91:447-460. |
| 10 | Peng J,PanY,Liu Y,et al.Linking ecological degradation risk to identify ecological security patterns in a rapidly urbanizing landscape[J].Habitat International,2018,71:110-124. |
| 11 | Barbara R,Stefan L.A spatially explicit patch model of habitat quality,integrating spatio-structural indicators[J].Ecological Indicators,2018,94:8-14. |
| 12 | Haddad N M,Brudvig L A,Clobert J,et al.Habitat fragmentation and its lasting impact on Earth's ecosystems[J].Science Advances,2015,1(2):e1500052. |
| 13 | Newbold T,Hudson L N,Hill S L,et al.Global effects of land use on local terrestrial biodiversity[J].Nature,2015,520(7545):45-50. |
| 14 | Janus J,Bozek P.Land abandonment in Poland after the collapse of socialism:over a quarter of a century of increasing tree cover on agricultural land[J].Ecological Engineering,2019,138:106-117. |
| 15 | Liu Y,Huang X,Yang H,et al.Environmental effects of land-use/cover change caused by urbanization and policies in Southwest China Karstarea:a case study of Guiyang[J].Habitat International,2014,44:339-348. |
| 16 | Guo Z,Zhang L,Li Y.Increased dependence of humans on ecosystem services and biodiversity[J].PLoS One,2010,5:e13113. |
| 17 | Dai L,Li S,Lewis B J,et al.The influence of land use change on the spatial-temporal variability of habitat quality between 1990 and 2010 in Northeast China[J].Journal of Foraminiferal Research,2019,30:2227-2236. |
| 18 | 孔令桥,张路,郑华,等.长江流域生态系统格局演变及驱动力[J].生态学报,2018,38(3):741-749. |
| 19 | 金龙如,孙克萍,贺红士,等.生境适宜度指数模型研究进展[J].生态学杂志,2008,27(5):841-846. |
| 20 | Pressey R L,Bottrill M C.Approaches to landscape-and seascape-scale conservation planning:convergence,contrasts and challenges[J].Oryx,2009,43:464-475. |
| 21 | Sarkar S,Pressey R L,Faith D P,et al.Biodiversity conservation planning tools:present status and challenges for the future[J].Annual Review of Environment and Resources,2006,31:123-159. |
| 22 | Terrado M,Sabater S,Chaplin-Kramer B,et al.Model development for the assessment of terrestrial and aquatic habitat quality in conservation planning[J].Science of The Total Environent,2016,540:63-70. |
| 23 | Tallis H,Ricketts T,Guerry A,et al.InVEST 3.3.0 User’s guide:integrated valuation of environmental services and tradeoffs[Z].(2020-11-20).. |
| 24 | Polasky S,Nelson E,Pennington D,et al.The impact of land-use change on ecosystem services,biodiversity and returns to landowners:a case study in the state of Minnesota[J].Environmental & Resource Economics,2011,48:219-242. |
| 25 | Kunwar R M,Evans A,Mainali J,et al.Change in forest and vegetation cover influencing distribution and uses of plants in the Kailash Sacred Landscape,Nepal[J].Environment,Development and Sustainability,2020,22:1397-1412. |
| 26 | Sharp R,Tallis H T,Ricketts T,et al.InVEST 3.6.0 User’s Guide[Z].The Natural Capital Project,Stanford University,the University of Minnesota,The Nature Conservancy, the World Wildlife Fund.(2020-11-20) . |
| 27 | Sallustio L,De Toni A,Strollo A,et al.Assessing habitat quality in relation to the spatial distribution of protected areas in Italy[J].Journal of Environmental Management,2017,201:129-137. |
| 28 | 王惠,许月卿,刘超,等.基于地理加权回归的生境质量对土地利用变化的响应:以河北省张家口市为例[J].北京大学学报(自然科学版),2019,55(3):509-518. |
| 29 | 谢余初,巩杰,张素欣,等.基于遥感和InVEST模型的白龙江流域景观生物多样性时空格局研究[J].地理科学,2018,8(6):979-986. |
| 30 | 包玉斌,刘康,李婷,等.基于InVEST 模型的土地利用变化对生境的影响:以陕西省黄河湿地自然保护区为例[J].干旱区研究,2015,32(3):622-629. |
| 31 | 钟莉娜,王军.基于InVEST模型评估土地整治对生境质量的影响[J].农业工程学报,2017,33(1):250-255. |
| 32 | 刘春艳,朱康文,刘吉平.三峡库区重庆段土地覆盖和生物多样性功能演化及预测[J].农业工程学报,2017,33(19):258-267. |
| 33 | Zhang X R,Song W,Lang Y Q,et al.Land use changes in the coastal zone of China’s Hebei Province and the corresponding impacts on habitat quality[J].Land Use Policy,2020,99:104957. |
| 34 | 朱增云,阿里木江·卡斯木.基于地理探测器的伊犁谷地生境质量时空演变及其影响因素[J].生态学杂志,2020,39(10):3408-3420. |
| 35 | Zhang X R,Zhou J,Li G N,et al.Spatial pattern reconstruction of regional habitat quality based on the simulation of land use changes from 1975 to 2010[J].Journal of Geographical Sciences,2020,30(12):601-620. |
| 36 | Anselin L.Local indicators of spatial association-LISA[J].Geographical Analysis,1995,27:93-115. |
| 37 | Getis A,Ord J K.The analysis of spatial association by use of distance statistics[J].Geographic Analysis,1992,24:189-206. |
| 38 | 王蓓,赵军,胡秀芳.基于InVEST模型的黑河流域生态系统服务空间格局分析[J].生态学杂志,2016,35(10):2783-2792. |
| 39 | 王劲峰,徐成东.地理探测器:原理与展望[J].地理学报,2017,72(1):116-134. |
| 40 | Hu Y,Wang J F,Li X H,et al.Geographical detector-based risk assessment of the under-five mortality in the 2008 Wenchuan earthquake,China[J].PloS One,2011,6(6):2466299947. |
| 41 | Zhan D,Kwan M P,Zhang W,et al.The driving factors of air quality index in China[J].Journal of Cleaner Production,2018,197:1342-1351. |
| 42 | Huang J X,Wang J F,Bo Y C,et al.Identification of health risks of hand,foot and mouth disease in China using the geographical detector technique[J].International Journal of Environmental Research and Publichealth,2014,11(3):3407-3423. |
| 43 | 韦惠兰,郭达.玛曲高寒草甸生态系统的动态变化及其驱动力[J].中国沙漠,2015,35(5):1413-1420. |
| 44 | 常亚斌,朱睿,肖生春,等.1980—2015年阿拉善盟沙地面积变化及其驱动因子[J].中国沙漠,2020,40(6):82-90. |
| 45 | Ma L B,Bo J,Li X Y,et al.Identifying key landscape pattern indices influencing the ecological security of inland river basin:the middle and lower reaches of Shule River Basin as an example[J].Science of the Total Environment,2019,674:424-438. |
| 46 | Yang W,Jin Y,Sun T,et al.Trade-offs among ecosystem services in coastal wetlands under the effects of reclamation activities[J].Ecological Indicators,2017,92:354-366. |
| 47 | Brumm K J,Jonas J L,Prichard C G,et al.Land cover influences on juvenile Rainbow Trout diet composition and condition in Lake Michigan tributaries[J].Ecology of Freshwater Fish,2019,28:11-19. |
| 48 | John J,Chithra N R,Thampi S G.Prediction of land use/cover change in the Bharathapuzha river basin,India using geospatial techniques[J].Environmetntal Monitoring and Assessment,2019,191:15. |
| 49 | Aide T M,Clark M L,Grau H R,et al.Deforestation and reforestation of Latin America and the Caribbean (2001-2010)[J].Biotropica,2013,45:262-271. |
| 50 | Weber D,Schaepman-Strub G,Ecker K.Predicting habitat quality of protected dry grasslands using Landsat NDVI phenology[J].Ecological Indicatos,2018,91:447-460. |
| 51 | Yan S J,Wang X,Cai Y P,et al.An integrated investigation of spatiotemporal habitat quality dynamics and driving forces in the upper basin of Miyun reservoir North China[J].Sustainability,2018,10(12):4625-4641. |
| 52 | Wu C F,Lin Y P,Chang L C, et al.Assessing highway’s impacts on landscape patterns and ecosystem services:a case study in Puli Township,Taiwan[J].Landscape and Urban Planning,2014,128:60-71. |
| 53 | Terrado M,Sabater S,Chaplin-Kramer B,et al.Model development for the assessment of terrestrial and aquatic habitat quality in conservation planning[J].Science of the Total Environment,2016,540:63-70. |
| 54 | Tang F,Fu M C,Wang L,et al.Land-use change in Changli County,China:predicting its spatio-temporal evolution in habitat quality[J].Ecological Indicators,2020,117:106719. |
| 55 | Xu L T,Chen S S,Xu Y,al et ,Impacts of land-use change on habitat quality during1985-2015 in the Taihu Lake Basin[J].Sustainability,2019,11(13):3513-3533. |
| [1] | 周成, 张旭红, 张倩, 柳炳华. 黄河流域“五位一体”综合评价体系建构与空间差异研究[J]. 中国沙漠, 2021, 41(4): 1-11. |
| [2] | 刘孟竹, 王彦芳, 裴宏伟. 退耕还林(草)背景下中国北方农牧交错带土地利用及碳储量变化[J]. 中国沙漠, 2021, 41(1): 174-182. |
| [3] | 王旭洋, 李玉霖, 连杰, 段育龙, 王立龙. 半干旱典型风沙区植被覆盖度演变与气候变化的关系及其对生态建设的意义[J]. 中国沙漠, 2021, 41(1): 183-194. |
| [4] | 常亚斌, 朱睿, 肖生春, 李雅培. 1980-2015年阿拉善盟沙地面积变化及其驱动因子[J]. 中国沙漠, 2020, 40(6): 82-90. |
| [5] | 卓静, 朱延年, 王娟, 何慧娟, 邹继业. 红碱淖面积时空演变规律及保护措施成效[J]. 中国沙漠, 2019, 39(4): 195-203. |
| [6] | 张福平, 李肖娟, 冯起, 王虎威, 魏永芬, 白皓. 基于InVEST模型的黑河流域上游水源涵养量[J]. 中国沙漠, 2018, 38(6): 1321-1329. |
| [7] | 张晗, 任志远. 基于Whittaker滤波的陕西省植被物候特征[J]. 中国沙漠, 2015, 35(4): 901-906. |
| [8] | 周丹, 张勃, 安美玲, 张耀宗, 罗静. 黄河流域不同时间尺度干旱对ENSO事件的响应[J]. 中国沙漠, 2015, 35(3): 753-762. |
| [9] | 张亚玲, 苏惠敏, 张小勇. 1998—2012年黄河流域植被覆盖变化时空分析[J]. 中国沙漠, 2014, 34(2): 597-602. |
| [10] | 段翰晨1,2, 王 涛1, 薛 娴1, 孙家欢1,2, 杨林海1. 基于RS与GIS的科尔沁沙地沙漠化时空演变[J]. 中国沙漠, 2013, 33(2): 470-477. |
| [11] | 谢 霞1,2, 塔西甫拉提·特依拜2,3. 艾比湖流域绿洲化与荒漠化过程时空演变研究[J]. 中国沙漠, 2013, 33(1): 38-45. |
| [12] | 李玲萍, 李岩瑛, 刘明春. 石羊河流域1961—2005年蒸发皿蒸发量变化趋势及原因初探[J]. 中国沙漠, 2012, 32(3): 832-841. |
| [13] | 郑影华;李 森;王兮之;李会川;高尚玉. RS与GIS支持下近50 a海南岛西部土地沙漠化时空演变过程研究[J]. 中国沙漠, 2009, 29(1): 56-62. |
| [14] | 王鹏祥;杨金虎. 中国西北近45 a来极端高温事件及其对区域性增暖的响应[J]. 中国沙漠, 2007, 27(4): 649-655. |
| 阅读次数 | ||||||
|
全文 |
|
|||||
|
摘要 |
|
|||||
©2018中国沙漠 编辑部
地址: 兰州市天水中路8号 (730000)
电话:0931-8267545
Email:caiedit@lzb.ac.cn;desert@lzb.ac.cn

 甘公网安备 62010202000688号