中国沙漠 ›› 2025, Vol. 45 ›› Issue (3): 222-232.DOI: 10.7522/j.issn.1000-694X.2025.00029
杨丽雯1,2,3( ), 李小军2, 杨昊天2, 张志山2, 史卓群1, 秦晓1, 洪丹丹4, 王大勇5()
收稿日期:2025-02-11
修回日期:2025-04-24
出版日期:2025-05-20
发布日期:2025-06-30
通讯作者:
王大勇
作者简介:杨丽雯(1978—),女,新疆乌鲁木齐人,博士,副教授,主要研究方向为生态系统服务评估。E-mail: Yanglw@sxie.edu.cn
基金资助:
Liwen Yang1,2,3(), Xiaojun Li2, Haotian Yang2, Zhishan Zhang2, Zhuoqun Shi1, Xiao Qin1, Dandan Hong4, Dayong Wang5()
Received:2025-02-11
Revised:2025-04-24
Online:2025-05-20
Published:2025-06-30
Contact:
Dayong Wang
摘要:
为更好地评估生态恢复工程的固碳服务效果,本研究定量评价了2015年和2020年沙坡头人工固沙植被生态系统不同演替阶段固碳服务供需平衡。结果表明:(1)人工固沙植被生态系统单位面积固碳服务供给量随固沙年限增加呈现波动上升趋势,在固沙52年以后逐渐趋于稳定。固沙前17年,灌木是固碳服务的主要贡献者,固沙25~60年以土壤固碳服务为主。土壤与灌木固碳服务供给呈现显著负相关,符合回归方程
中图分类号:
杨丽雯, 李小军, 杨昊天, 张志山, 史卓群, 秦晓, 洪丹丹, 王大勇. 腾格里沙漠东南缘人工固沙植被生态系统固碳服务供需平衡定量评价[J]. 中国沙漠, 2025, 45(3): 222-232.
Liwen Yang, Xiaojun Li, Haotian Yang, Zhishan Zhang, Zhuoqun Shi, Xiao Qin, Dandan Hong, Dayong Wang. Quantitative assessment on the supply-demand balance of carbon sequestration service in artificial sand-binding vegetation ecosystem at the southeastern edge of the Tengger Desert[J]. Journal of Desert Research, 2025, 45(3): 222-232.
| 演替阶段(固沙年限)/a | 优势物种 | 土壤有机质 /(g·kg-1) | 土壤容重 /(g·cm-3) | 物种数量 /个 | 覆盖度/% | 地上部生物量/(g·m-2) | 凋落物 /(g·m-2) | ||
|---|---|---|---|---|---|---|---|---|---|
| 灌丛 | 草本 | 灌丛 | 草本 | ||||||
| 0 | 沙米、花棒 | 0.41±0.07 | 1.55±0.01 | 1.4±0.32 | 0.22±0.12 | 0.16±0.03 | 2.14±0.40 | 0.11±0.02 | 0 |
| 4 | 油蒿、花棒、柠条 | 0.43±0.07 | 1.55±0.01 | 3.6±0.32 | 10.7±1.05 | 1.06±0.17 | 70.68±6.33 | 3.10±0.30 | 1.04±0.20 |
| 5 | 油蒿、花棒、柠条 | 0.55±0.08 | 1.54±0.01 | 3.8±0.26 | 14.02±0.68 | 2.30±0.33 | 85.12±5.99 | 3.14±0.34 | 1.19±0.09 |
| 17 | 油蒿、花棒、柠条、小画眉草 | 0.95±0.03 | 1.52±0.01 | 5.6±0.66 | 28.50±0.69 | 6.94±0.24 | 365.29±24.68 | 16.48±0.78 | 4.41±0.37 |
| 25 | 油蒿、花棒、雾冰藜、小画眉草 | 1.65±0.10 | 1.51±0.01 | 5.8±0.26 | 21.76±1.65 | 11.08±0.83 | 207.46±17.25 | 29.18±3.10 | 5.69±0.30 |
| 29 | 油蒿、花棒、雾冰藜、小画眉草 | 1.70±0.17 | 1.49±0.01 | 7.2±0.48 | 13.80±1.20 | 10.98±0.43 | 170.61±16.58 | 30.44±4.85 | 5.70±0.44 |
| 35 | 油蒿、雾冰藜、小画眉草 | 2.27±0.25 | 1.49±0.02 | 8.2±0.48 | 10.68±0.78 | 14.30±1.06 | 142.07±14.48 | 35.09±3.39 | 8.93±0.83 |
| 43 | 油蒿、雾冰藜、小画眉草 | 3.62±0.39 | 1.47±0.02 | 8.6±0.66 | 7.22±0.39 | 14.46±0.74 | 104.93±17.61 | 43.45±4.58 | 9.24±0.56 |
| 52 | 油蒿、雾冰藜、小画眉草 | 4.66±0.21 | 1.43±0.02 | 9.8±0.48 | 5.98±0.64 | 20.36±0.52 | 91.16±5.7 | 57.73±2.91 | 11.29±0.83 |
| 60 | 油蒿、雾冰藜、小画眉草 | 4.83±0.39 | 1.41±0.02 | 10.0±0.41 | 4.50±0.93 | 23.46±0.73 | 103.07±7.71 | 57.43±4.31 | 11.44±0.67 |
| NV | 驼绒藜、油蒿、小画眉草 和短花针茅 | 6.22±0.36 | 1.20±0.01 | 15.8±0.75 | 15.20±0.85 | 36.42±1.72 | 160.15±20.18 | 144.61±13.43 | 21.49±1.72 |
| F | 109.97 | 117.21 | 249.59 | 105.11 | 62.41 | 126.24 | |||
| P | <0.001 | <0.001 | <0.001 | <0.001 | <0.001 | <0.001 | |||
表1 沙坡头人工固沙植被生态系统不同演替阶段样地的基本情况[8]
Table 1 Basic information of the sample plots at different succession stages of the artificial sand-fixing vegetation ecosystem in Shapotou[8]
| 演替阶段(固沙年限)/a | 优势物种 | 土壤有机质 /(g·kg-1) | 土壤容重 /(g·cm-3) | 物种数量 /个 | 覆盖度/% | 地上部生物量/(g·m-2) | 凋落物 /(g·m-2) | ||
|---|---|---|---|---|---|---|---|---|---|
| 灌丛 | 草本 | 灌丛 | 草本 | ||||||
| 0 | 沙米、花棒 | 0.41±0.07 | 1.55±0.01 | 1.4±0.32 | 0.22±0.12 | 0.16±0.03 | 2.14±0.40 | 0.11±0.02 | 0 |
| 4 | 油蒿、花棒、柠条 | 0.43±0.07 | 1.55±0.01 | 3.6±0.32 | 10.7±1.05 | 1.06±0.17 | 70.68±6.33 | 3.10±0.30 | 1.04±0.20 |
| 5 | 油蒿、花棒、柠条 | 0.55±0.08 | 1.54±0.01 | 3.8±0.26 | 14.02±0.68 | 2.30±0.33 | 85.12±5.99 | 3.14±0.34 | 1.19±0.09 |
| 17 | 油蒿、花棒、柠条、小画眉草 | 0.95±0.03 | 1.52±0.01 | 5.6±0.66 | 28.50±0.69 | 6.94±0.24 | 365.29±24.68 | 16.48±0.78 | 4.41±0.37 |
| 25 | 油蒿、花棒、雾冰藜、小画眉草 | 1.65±0.10 | 1.51±0.01 | 5.8±0.26 | 21.76±1.65 | 11.08±0.83 | 207.46±17.25 | 29.18±3.10 | 5.69±0.30 |
| 29 | 油蒿、花棒、雾冰藜、小画眉草 | 1.70±0.17 | 1.49±0.01 | 7.2±0.48 | 13.80±1.20 | 10.98±0.43 | 170.61±16.58 | 30.44±4.85 | 5.70±0.44 |
| 35 | 油蒿、雾冰藜、小画眉草 | 2.27±0.25 | 1.49±0.02 | 8.2±0.48 | 10.68±0.78 | 14.30±1.06 | 142.07±14.48 | 35.09±3.39 | 8.93±0.83 |
| 43 | 油蒿、雾冰藜、小画眉草 | 3.62±0.39 | 1.47±0.02 | 8.6±0.66 | 7.22±0.39 | 14.46±0.74 | 104.93±17.61 | 43.45±4.58 | 9.24±0.56 |
| 52 | 油蒿、雾冰藜、小画眉草 | 4.66±0.21 | 1.43±0.02 | 9.8±0.48 | 5.98±0.64 | 20.36±0.52 | 91.16±5.7 | 57.73±2.91 | 11.29±0.83 |
| 60 | 油蒿、雾冰藜、小画眉草 | 4.83±0.39 | 1.41±0.02 | 10.0±0.41 | 4.50±0.93 | 23.46±0.73 | 103.07±7.71 | 57.43±4.31 | 11.44±0.67 |
| NV | 驼绒藜、油蒿、小画眉草 和短花针茅 | 6.22±0.36 | 1.20±0.01 | 15.8±0.75 | 15.20±0.85 | 36.42±1.72 | 160.15±20.18 | 144.61±13.43 | 21.49±1.72 |
| F | 109.97 | 117.21 | 249.59 | 105.11 | 62.41 | 126.24 | |||
| P | <0.001 | <0.001 | <0.001 | <0.001 | <0.001 | <0.001 | |||
| 土地利用 类型 | 碳排放系数 /(kg·m-2·a-1) | 参考文献 |
|---|---|---|
| 0.4970 | 冯杰等[ | |
| -0.5810 | 冯杰等[ | |
| -0.0205 | 郑永超等[ | |
| -0.0253 | 郑永超等[ | |
| -0.0005 | 郑永超等[ |
表2 不同土地利用类型的碳排放系数
Table 2 Carbon emission coefficient of different land use types
| 土地利用 类型 | 碳排放系数 /(kg·m-2·a-1) | 参考文献 |
|---|---|---|
| 0.4970 | 冯杰等[ | |
| -0.5810 | 冯杰等[ | |
| -0.0205 | 郑永超等[ | |
| -0.0253 | 郑永超等[ | |
| -0.0005 | 郑永超等[ |
| 能源种类 | 转换系数 | 碳排放系数/(t·t-1) |
|---|---|---|
| 原煤 | 0.7143 kg·t-1 | 0.7559 |
| 洗精煤 | 0.9000 kg·t-1 | 0.7559 |
| 焦炭 | 0.9714 kg·t-1 | 0.8550 |
| 原油 | 1.4286 kg·t-1 | 0.5854 |
| 汽油 | 1.4714 kg·t-1 | 0.5538 |
| 柴油 | 1.4571 kg·t-1 | 0.5921 |
| 燃料油 | 1.4286 kg·t-1 | 0.6185 |
| 煤油 | 1.4545 kg·t-1 | 0.5708 |
| 天然气 | 1.3300 kg·m3 | 0.4483 |
| 电力 | 0.1229 kg·kWh-1 | 0.2720 |
表3 各类能源标准煤系数和碳排放系数[45]
Table 3 Standard coal conversion factors and carbon emission coefficients for various types of energy sources[45]
| 能源种类 | 转换系数 | 碳排放系数/(t·t-1) |
|---|---|---|
| 原煤 | 0.7143 kg·t-1 | 0.7559 |
| 洗精煤 | 0.9000 kg·t-1 | 0.7559 |
| 焦炭 | 0.9714 kg·t-1 | 0.8550 |
| 原油 | 1.4286 kg·t-1 | 0.5854 |
| 汽油 | 1.4714 kg·t-1 | 0.5538 |
| 柴油 | 1.4571 kg·t-1 | 0.5921 |
| 燃料油 | 1.4286 kg·t-1 | 0.6185 |
| 煤油 | 1.4545 kg·t-1 | 0.5708 |
| 天然气 | 1.3300 kg·m3 | 0.4483 |
| 电力 | 0.1229 kg·kWh-1 | 0.2720 |
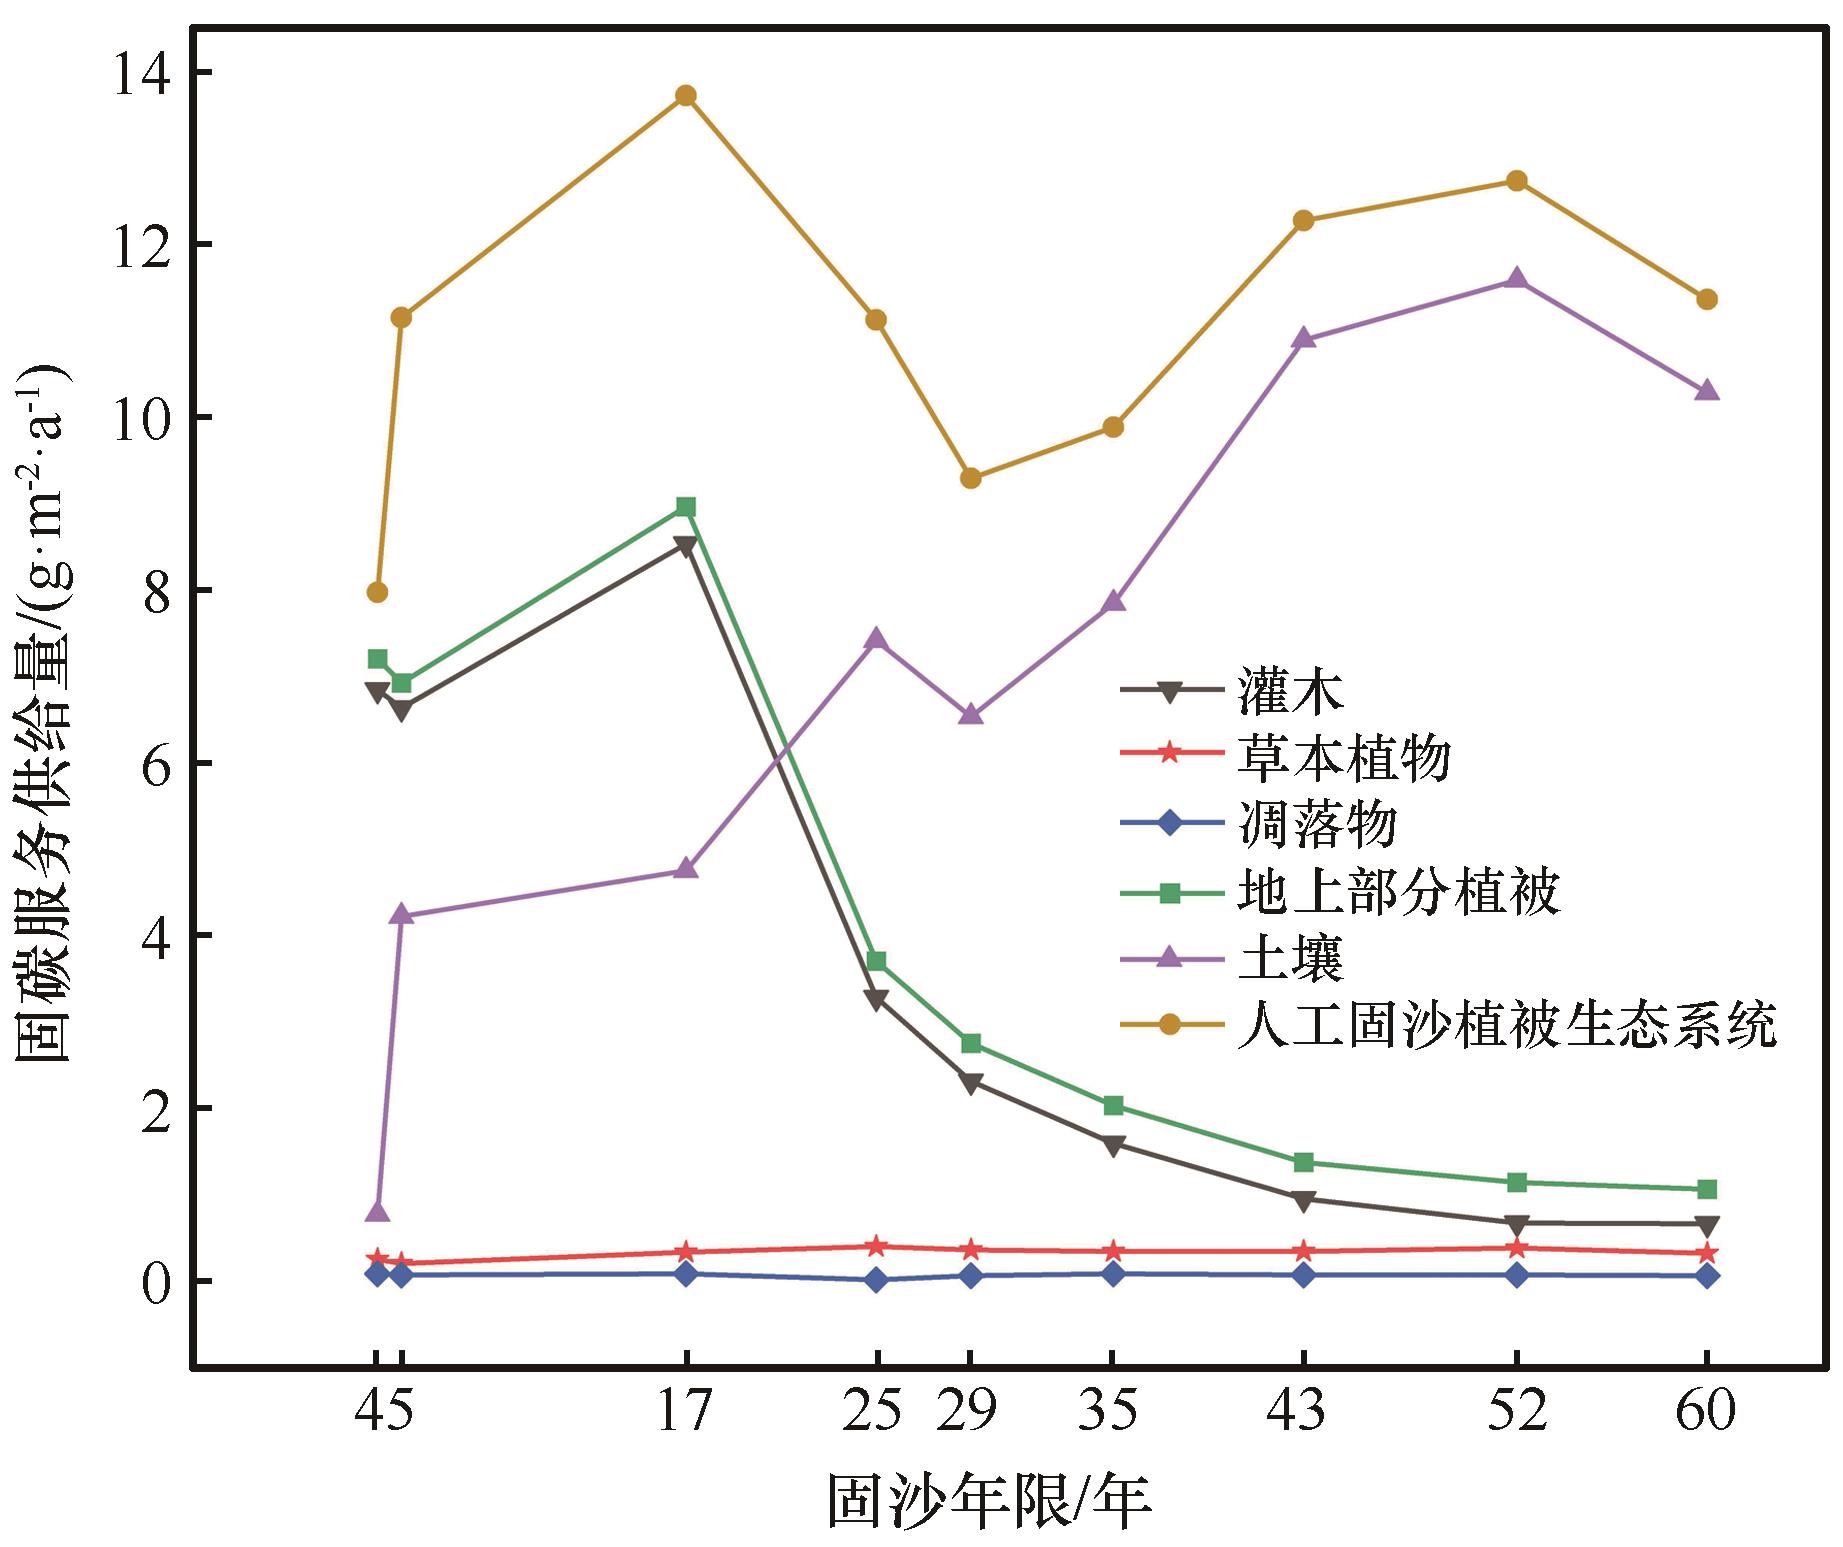
图1 人工固沙植被生态系统固碳服务供给的时间变化特征
Fig.1 The temporal variation characteristics of carbon sequestration service supply of various components in artificial sand-binding vegetation ecosystem
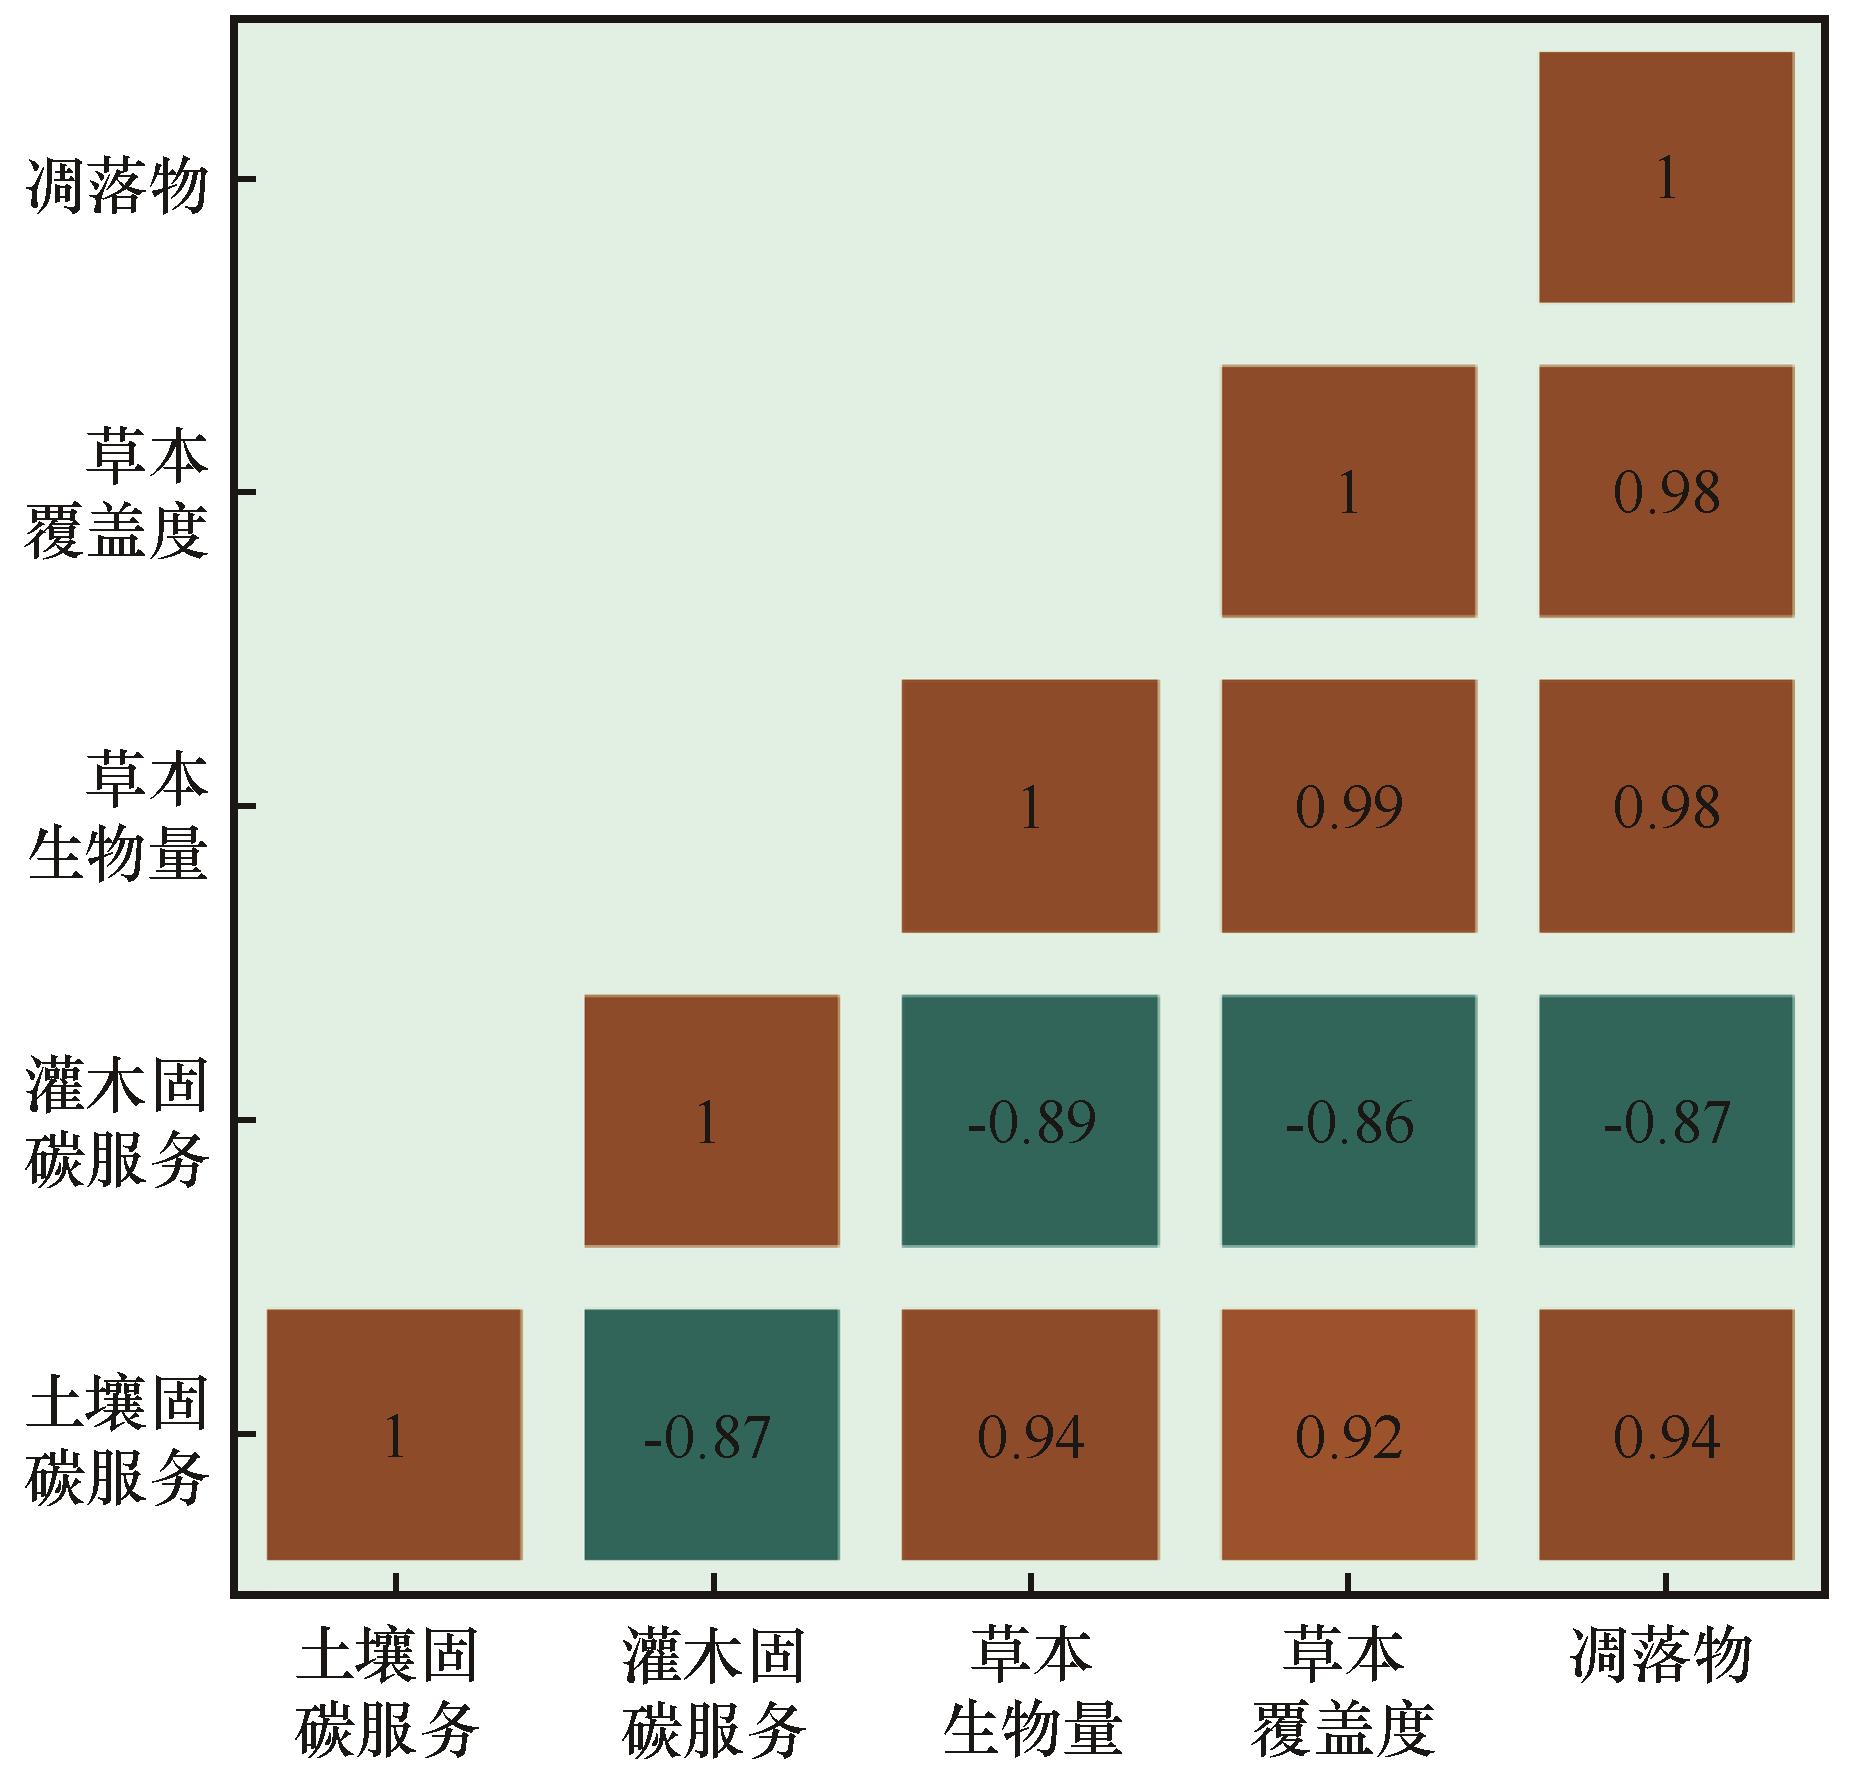
图2 土壤和灌木固碳服务供给与草本覆盖度、草本生物量和凋落物的皮尔逊相关系数矩阵
Fig.2 The matrix of Pearson Correlation Coefficients between shrubs and soil carbon sequestration service supply and herbaceous coverage, herbaceous biomass, as well as Litter
| 年份 | 碳排放总量 /105 t | 碳排放比例/% | 碳吸收总量 /105t | 碳吸收比例/% | 净碳排放量 /105t | ||||
|---|---|---|---|---|---|---|---|---|---|
| 农田 | 建设用地 | 林地 | 草地 | 水体 | 裸地 | ||||
| 2015 | 20.95 | 1.46 | 98.54 | 0.122 | 0.02 | 90.24 | 9.44 | 0.30 | 20.83 |
| 2020 | 29.97 | 1.37 | 98.63 | 0.118 | 0.03 | 90.19 | 9.52 | 0.27 | 29.86 |
表4 2015年和2020年沙坡头区不同土地利用类型的碳排放量与碳吸收量及所占比例
Table 4 Carbon emission quantity, carbon absorption quantity, and their respective proportions among different land use types in 2015 and 2020 of Shapotou area
| 年份 | 碳排放总量 /105 t | 碳排放比例/% | 碳吸收总量 /105t | 碳吸收比例/% | 净碳排放量 /105t | ||||
|---|---|---|---|---|---|---|---|---|---|
| 农田 | 建设用地 | 林地 | 草地 | 水体 | 裸地 | ||||
| 2015 | 20.95 | 1.46 | 98.54 | 0.122 | 0.02 | 90.24 | 9.44 | 0.30 | 20.83 |
| 2020 | 29.97 | 1.37 | 98.63 | 0.118 | 0.03 | 90.19 | 9.52 | 0.27 | 29.86 |
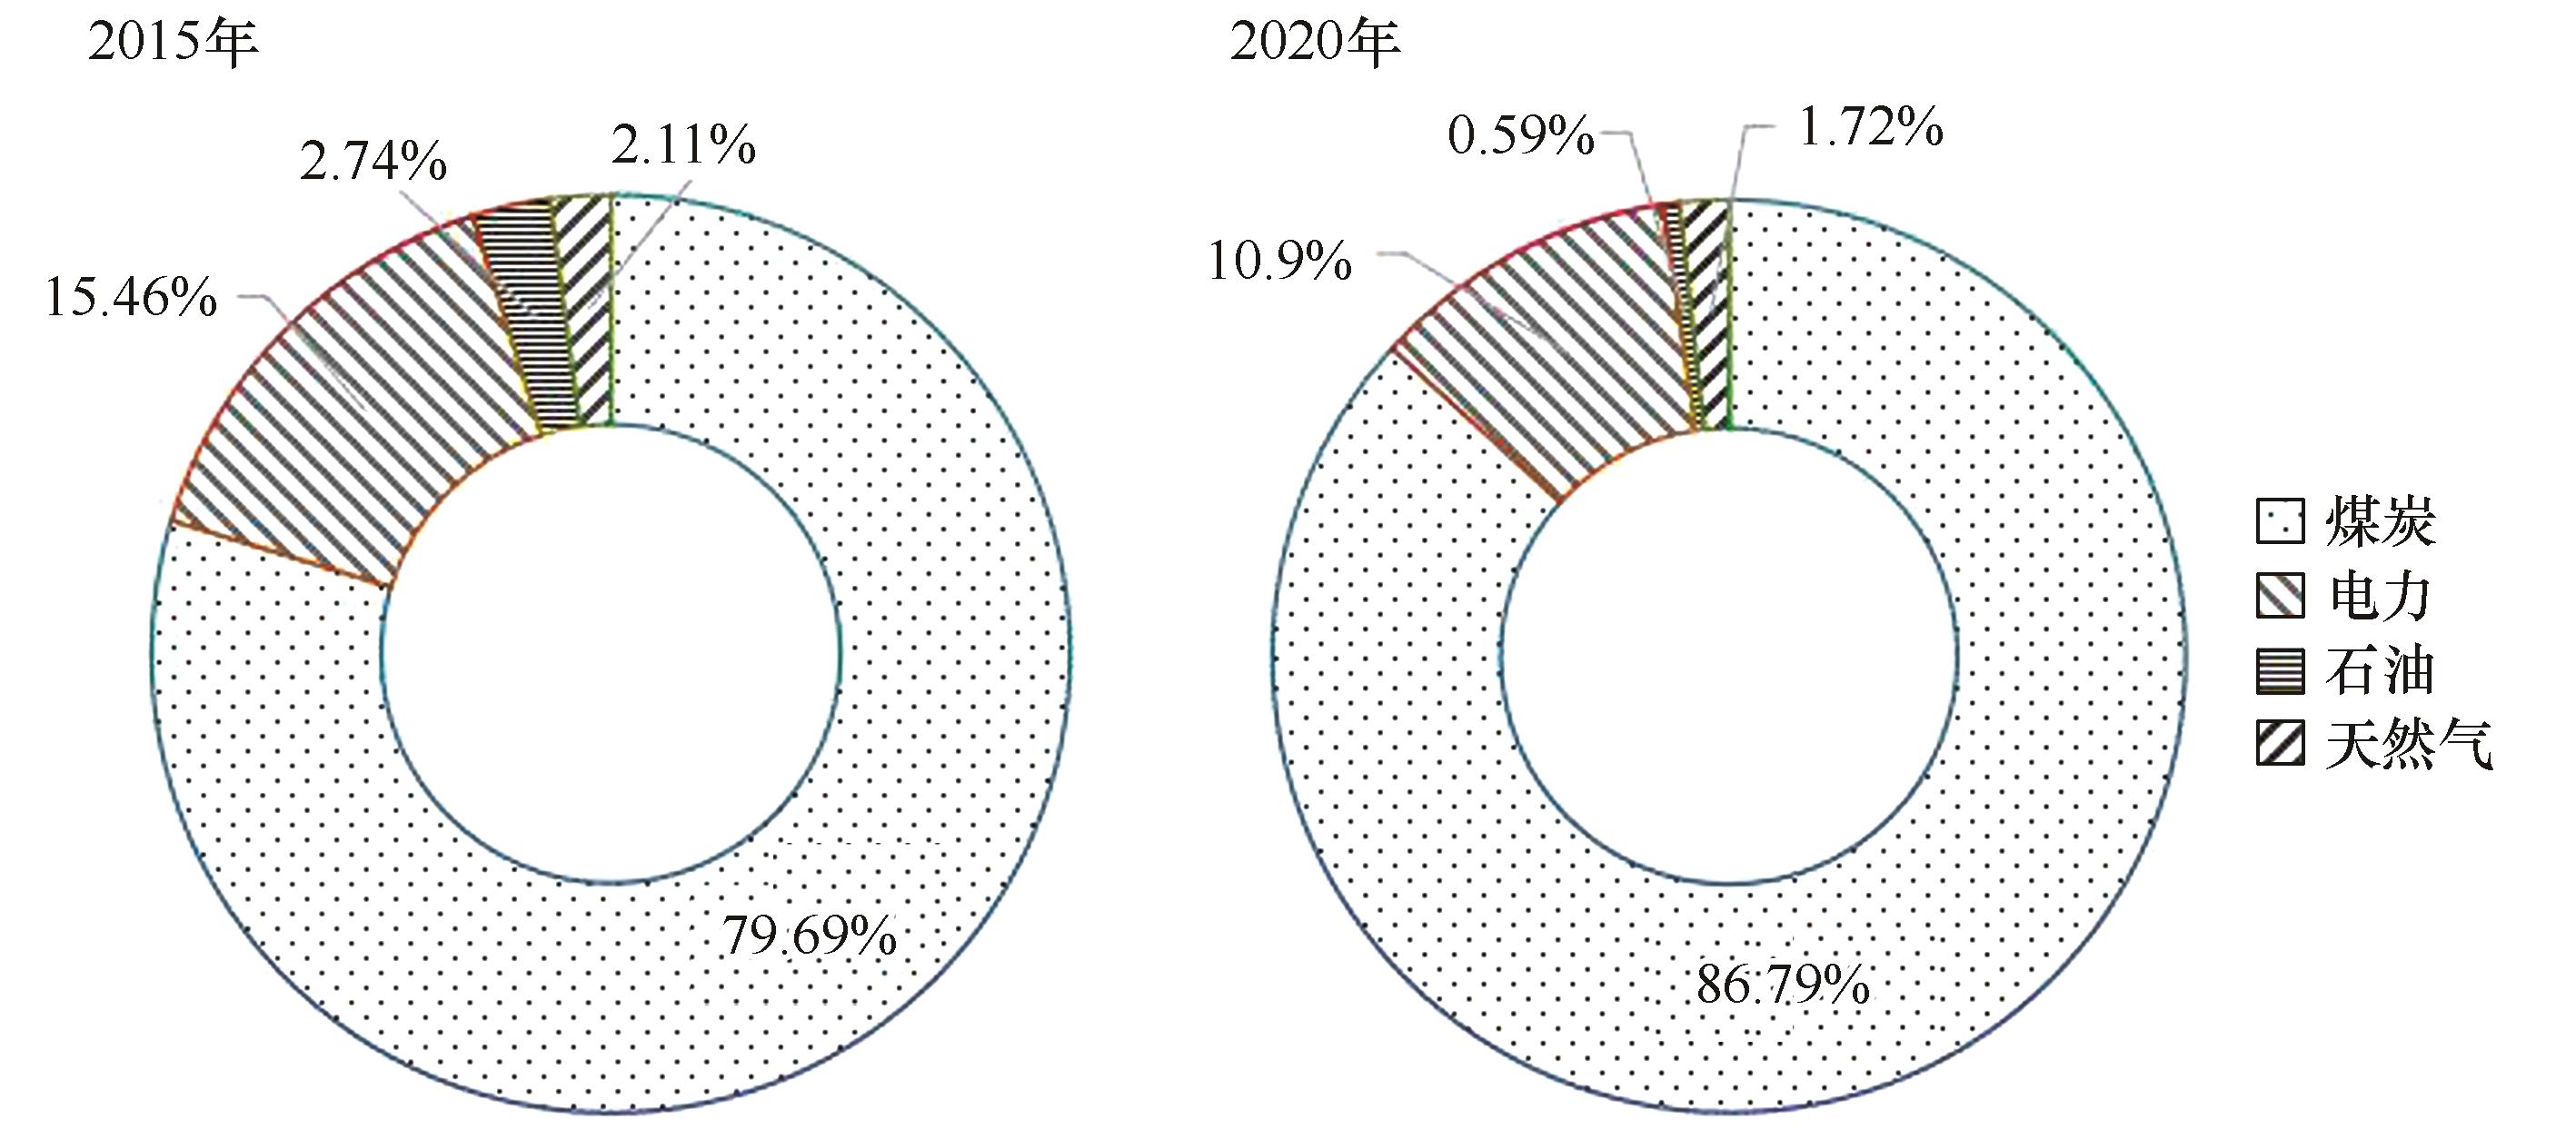
图3 2015年和2020年沙坡头区能源消费结构
Fig.3 The energy consumption structure in Shapotou area in 2015 and 2020
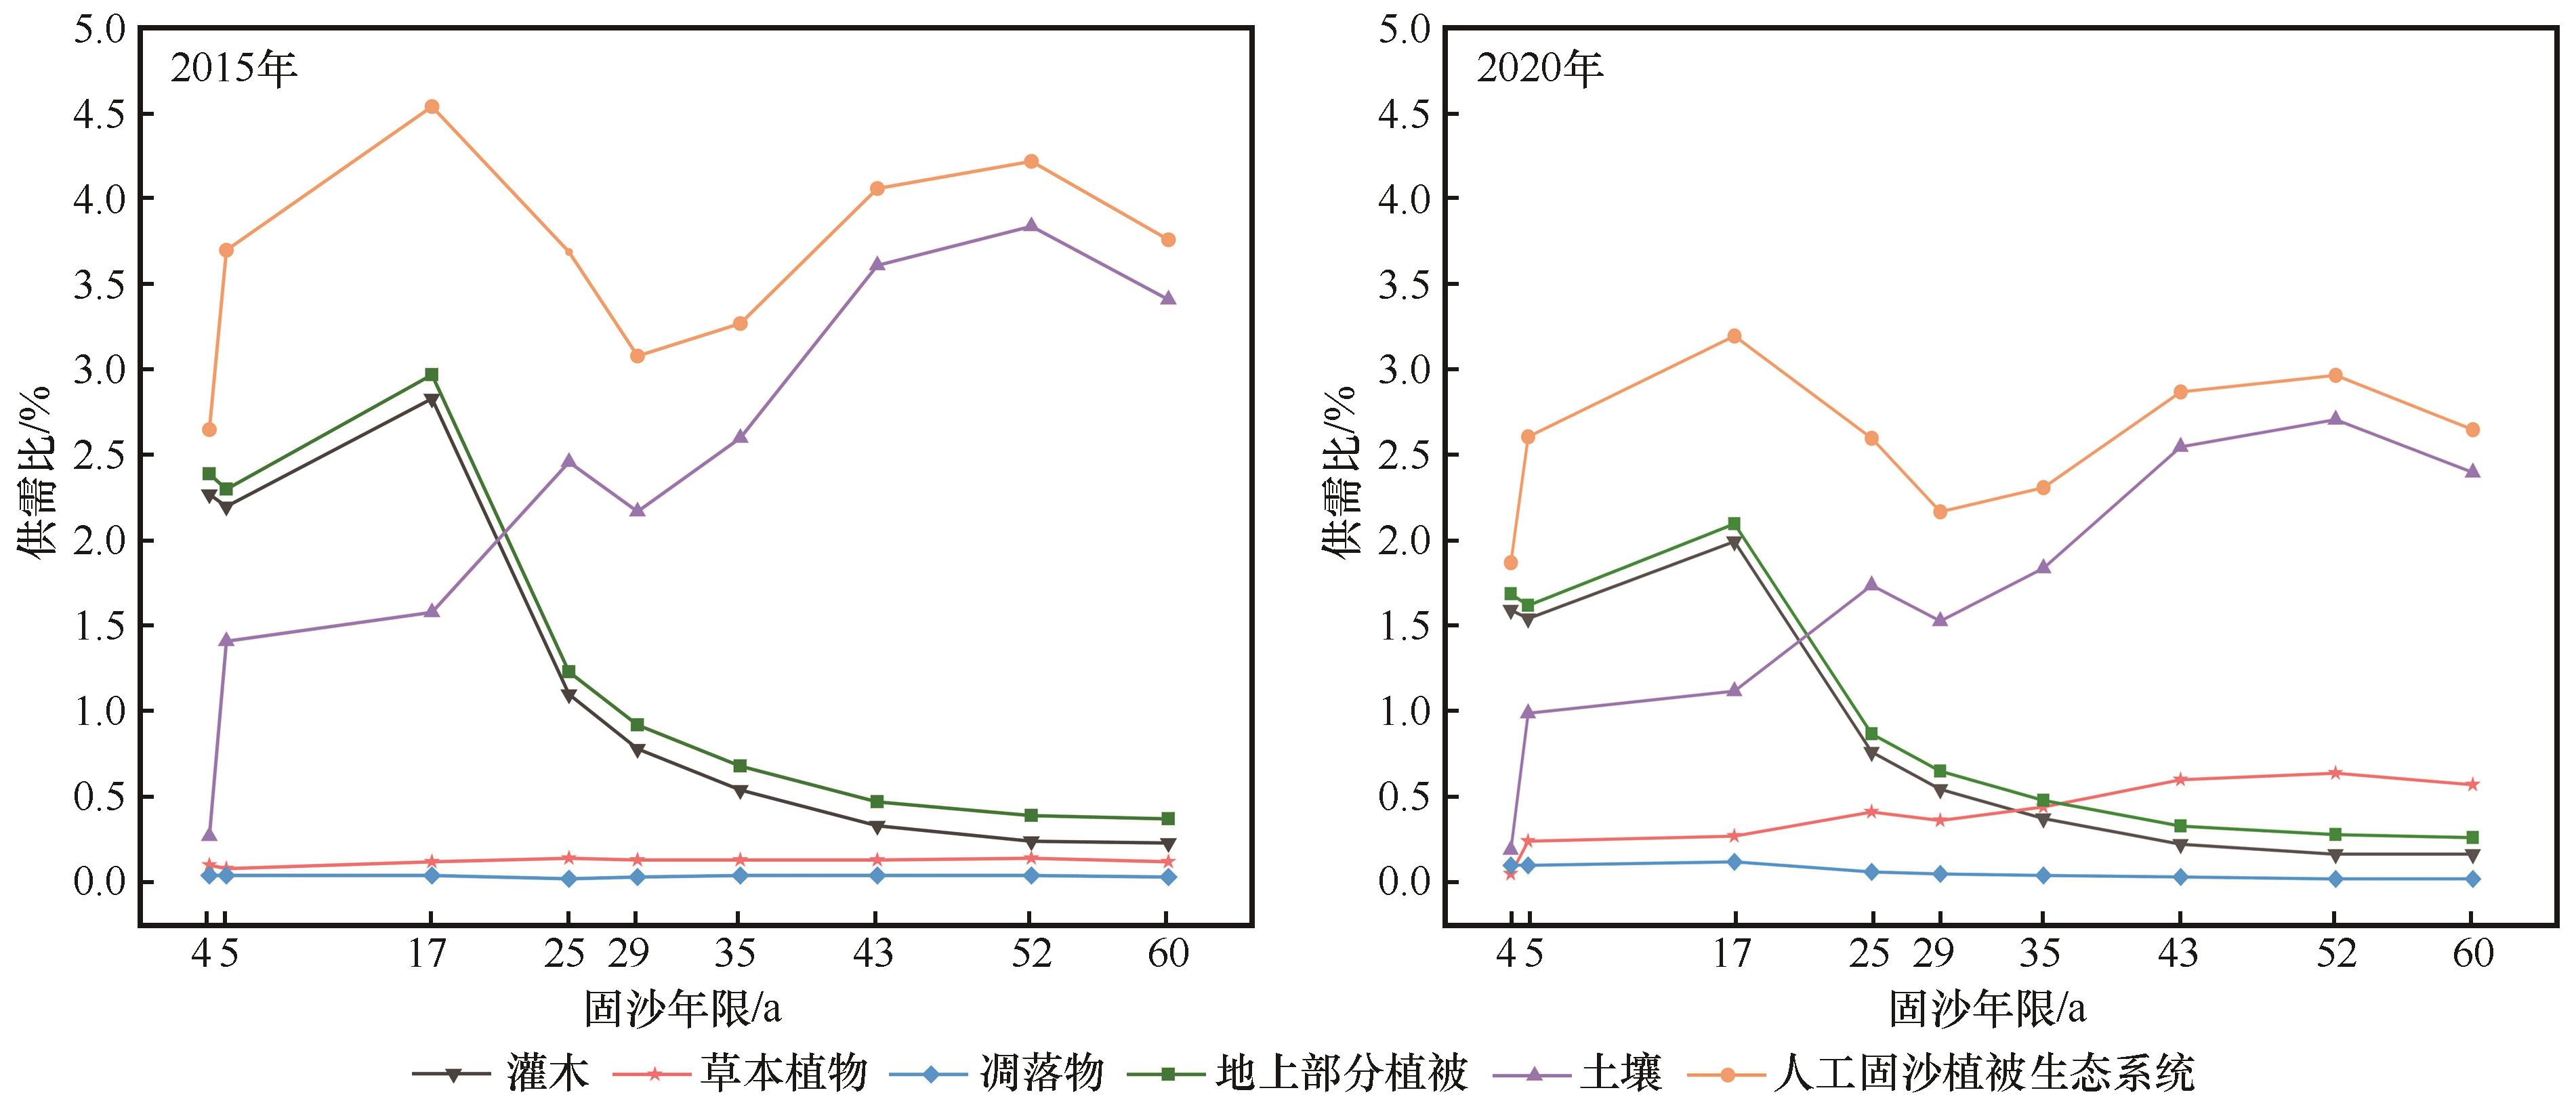
图4 2015年和2020年人工固沙植被生态系统固碳服务供需比
Fig.4 The supply-demand ratio of carbon sequestration service of artificial sand-binding vegetation ecosystem in 2015 and 2020
| 1 | 傅伯杰,刘焱序,赵文武.“一带一路”生态环境保护和可持续发展科技合作重点领域[J].中国科学院院刊,2023,38(9):1273-1281. |
| 2 | 崔桂鹏,肖春蕾,雷加强,等.大国治理:中国荒漠化防治的战略选择与未来愿景[J].中国科学院院刊,2023,38(7):943-955. |
| 3 | Li X R, He M Z, Duan Z H,et al.Recovery of topsoil physicochemical properties in revegetated sites in the sand-burial ecosystems of the Tengger Desert,northern China[J].Geomorphology,2007,88(3/4):254-265. |
| 4 | Li X R, Kong D S, Tan H J,et al.Changes in soil and vegetation following stabilisation of dunes in the southeastern fringe of the Tengger Desert,China[J].Plant and Soil,2007,300(1):221-231. |
| 5 | 于钊,李奇铮,王培源,等.退化和恢复过程驱动的荒漠草地生态系统有机碳密度变化[J].中国沙漠,2022,42(2):215-222. |
| 6 | Yang H T, Li X R, Wang Z R,et al.Carbon sequestration capacity of shifting sand dune after establishing new vegetation in the Tengger Desert,northern China[J].Science of the Total Environment,2014(478):1-11. |
| 7 | Chen Y L, Zhang Z S, Zhao Y,et al.Soil carbon storage along a 46-year revegetation chronosequence in a desert area of northern China[J].Geoderma,2018(325):28-36. |
| 8 | Li X J, Li Y F, Xie T,et al.Recovery of soil carbon and nitrogen stocks following afforestation with xerophytic shrubs in the Tengger Desert,North China[J].Catena,2022(214):106277. |
| 9 | 国家林业和草原局. 全国防沙治沙规划(2021-2030年) [S].北京:国家林业和草原局,2023. |
| 10 | MA(Millennium Ecosystem Assessment).Ecosystems and Human Well-Being Synthesis[M].Washington DC:Island Press,2005. |
| 11 | Costanza R.Valuing natural capital and ecosystem services toward the goals of efficiency,fairness,and sustainability[J].Ecosystem Services,2020,43:101096. |
| 12 | 邴龙飞,王娇月,尹岩,等.地市尺度气候调节服务评估:以福州市为例[J].应用生态学报,2022,33(7):1966-1974. |
| 13 | 孙杰,徐梦佳,刘冬,等.长江三角洲地区生态系统气候调节服务价值空间变化影响机制分析[J].生态与农村环境学报,2024,40(9):1121-1133. |
| 14 | United Nations,et al.System of environmental-economic accounting ecosystem accounting (SEEA EA) [EB/OL].[2023-09-18].. |
| 15 | Sharp R, Douglass J, Wolny S,et al.InVEST 3.9.2.user's guide[Z].Stanford,USA:Stanford University,2020:307. |
| 16 | Yang G, Su C, Zhang H,et al.Tree-level landscape transitions and changes in carbon storage throughout the mine life cycle[J].Science of Total Environment,2023,905(12):166896. |
| 17 | Zhao C, Sander H A.Quantifying and mapping the supply of and demand for carbon storage and sequestration service from urban trees[J].PLoS One,2015,10(8):e0136392. |
| 18 | Sahle M, Saito O, Fürst C,et al.Quantification and mapping of the supply of and demand for carbon storage and sequestration service in woody biomass and soil to mitigate climate change in the socioecological environment[J].Science of the Total Environment,2018,624(12):342-354. |
| 19 | Zhu C X, Wei F, Wu X H,et al.Spatial mismatch and the attribution analysis of carbon storage demand and supply in the Yangtze River Economic Belt,China[J].Journal of Cleaner Production,2024,434:140036. |
| 20 | 贾晓红,李新荣,周玉燕,等.干旱沙区人工固沙植被演变过程中土壤有机碳氮储量及其分布特征[J].环境科学,2012,33(3):938-944. |
| 21 | Li Y F, Zhang X, Wang B Y,et al.Revegetation promotes soil ineral-associated organic carbon sequestration and soil carbon stability in the Tengger Desert,northern China[J].Soil Biology and Biochemistry,2023,185:109155. |
| 22 | 安立伟,李志刚.退化荒漠草地恢复对土壤有机碳及其驱动因子的影响[J].生态学报,2024,44(13):5519-5531. |
| 23 | Chen L L, Sun J H, Taogetao B Y.Changes in soil organic carbon and nitrogen stocks following revegetation in a semi-arid grassland of North China[J].Journal of Environmental Management,2023,346:118995. |
| 24 | Kang X E, Liu T X, Hao L N,et al.Carbon dynamics of the plant-soil system during vegetation succession in dune-meadow cascade ecosystems in Horqin Sandy Land,China[J].Ecological Indicators,2023,155:110916. |
| 25 | Wang A N, Zha T G, Zhang Z Q.Variations in soil organic carbon storage and stability with vegetation restoration stages on the Loess Plateau of China[J].Catena,2023,228:107142. |
| 26 | 袁壮壮, 叶长盛,李辉丹。基于土地利用变化的南昌市碳排放效应分析[J].湖南师范大学自然科学学报,2021,44(5):30-39. |
| 27 | Li Q X, Yang D F, Jia Z Q,et al.Changes in soil organic carbon and total nitrogen stocks along a chronosequence of Caragana intermedia plantations in alpine sandy land[J].Ecological Engineering,2019,133:53-59. |
| 28 | Huang L, Xu X L, Shao Q,et al.Improving carbon mitigation potential through grassland ecosystem restoration under climatic change in northeastern Tibetan Plateau[J].Advances in Meteorology,2014,379306:1-11. |
| 29 | Zuo X A, Zhang J, Zhou X,et al.Changes in carbon and nitrogen storage along a restoration gradient in a semiarid sandy grassland[J].Acta Oecologica,2015,69:1-8. |
| 30 | Yu Z C, Zhang W, Liu Y S,et al.Dynamics of SOC density and driving factors during the restoration of artificial grassland and abandoned farmland in Mu Us Desert,China[J].Catena,2023,224:106991. |
| 31 | Han X, Gao G, Li Z,et al.Effects of plantation age and precipitation gradient on soil carbon and nitrogen changes following afforestation in the Chinese Loess Plateau[J].Land Degradation & Development,2019,30(18):2298-2310. |
| 32 | Eggleston H S, Buendia L, Miwa K,et al.IPCC guidelines for national greenhouse gas inventories[R].Tokyo,Japan:IGES,2006. |
| 33 | 张志山,何明珠,谭会娟,等.沙漠人工植被区生物结皮类土壤的蒸发特性:以沙坡头沙漠研究试验站为例[J].土壤学报,2007,44(3):404-410. |
| 34 | FAO-ISRIC-ISSS.World Reference Base for Soil Resources[M].Rome,Italy:FAO,1998. |
| 35 | 杨昊天,李新荣,闫培洁,等.腾格里沙漠土壤类型空间分布特征[J].中国沙漠,2020,40(4):154-162. |
| 36 | 张甜,贾荣亮,高艳红,等.沙坡头人工固沙植被演替过程中主要结皮生物生态位和种间关联变化特征[J].中国沙漠,2021,41(4):100-108. |
| 37 | 李新荣,张志山,谭会娟,等.我国北方风沙危害区生态重建与恢复:腾格里沙漠土壤水分与植被承载力的探讨[J].中国科学:生命科学,2014,44(3):257-266. |
| 38 | 中国科学院资源环境科学数据中心.中国土地利用现状遥感监测数据[EB/OL].(2021-04-20) [2022-11-10].. |
| 39 | 中卫市统计局.中卫统计年鉴-2016[Z].银川:银川市昊博彩色印刷有限公司.2016 |
| 40 | 中卫市统计局.中卫统计年鉴-2021[Z].银川:银川市昊博彩色印刷有限公司.2021 |
| 41 | 冯杰,张胜,王涛.中国省际土地利用碳排放及其影响因素分析[J].统计与决策,2019,35(5):141-145. |
| 42 | 马远,刘真真.黄河流域土地利用碳排放的时空演变及影响因素研究[J].生态经济,2021,37(4):35-43. |
| 43 | 郑永超,文琦.宁夏自治区土地利用变化及碳排放效应[J].水土保持研究,2020,27(1):207-212. |
| 44 | 孙赫,梁红梅,常学礼,等.中国土地利用碳排放及其空间关联[J].经济地理,2015,35(3):154-162. |
| 45 | 李建强,张飞云,李倩,等.基于PLUS-InVEST模型的新疆土地利用碳排放与碳储量时空演变分析及模拟[J/OL].农业资源与环境学报,2025.. |
| 46 | 王亚娟,翟晨曦,刘彩玉,等.宁夏土地利用碳排放时空差异及影响因素分析[J].环境科学,2024(9):5049-5059. |
| 47 | Chai Q L, Ma Z Y, An Q Q,et al.Does Caragana korshinskii plantation increase soil carbon continuously in a water limited landscape on the Loess Plateau,China[J].Land Degradradation&Development,2019,30:1691-1698. |
| 48 | Li Y Q, Chen Y P, Wang X Y,et al.Improvements in soil carbon and nitrogen capacities after shrub planting to stabilize sand dunes in China's Horqin Sandy Land[J].Sustainability,2017,9(4):662. |
| 49 | Yang H T, Wang Z, Li X,et al.Vegetation restoration drives the dynamics and distribution of nitrogen and phosphorous pools in a temperate desert soil-plant system[J].Journal of Environmental Management,2019,245:200-209. |
| 50 | Li X R, Tian F, Jia R L,et al.Do biological soil crusts determine vegetation changes in sandy deserts?Implications for managing artificial vegetation[J].Hydrological Processes,2010,24:3621-3630. |
| 51 | 陈荷生.干旱区造林与水分平衡的关系[R].国家“七·五”重点科技攻关项目研究报告(75_08_01-06).1990. |
| 52 | Arnalds O, Orradottir B, Aradottir A L.Carbon accumulation in Icelandic desert Andosols during early stages of restoration[J].Geoderma,2013,193/194:172-179. |
| 53 | Garcia-Franco N, Wiesmeier M, Goberna M,et al.Carbon dynamics after afforestation of semiarid shrublands: implications of site preparation techniques[J].Forest Ecology and Management,2014,319:107-115. |
| 54 | 杨静,郭群.省级层面碳排放估算及减排路径方法研究:以宁夏为例[J].中国沙漠,2023,43(5):176-185. |
| 55 | van Groenigen K J, Six J, Hungate B A,et al.Element interactions limit soil carbon storage[J].Proceedings of the National Academy of Sciences of the United States of America,2006,103(17):6571-6574. |
| 56 | LeBauer D S, Treseder K K.Nitrogen limitation of net primary productivity in terrestrial ecosystems is globally distributed[J].Ecology,2008,89(2):371-379. |
| 57 | Hoogmoed M, Cunningham S C, Baker P J,et al.Is there more soil carbon under nitrogen-fixing trees than under non-nitrogen-fixing trees in mixed-species restoration plantings?[J].Agriculture Ecosystems & Environment,2014,188:80-84. |
| 58 | Delgado-Baquerizo M, Eldridge D J, Maestre F T,et al.Aridity decouples C∶N∶P stoichiometry across multiple trophic levels in terrestrial ecosystems[J].Ecosystems,2017,21(3):459-468. |
| 59 | Liu X, Yang T, Wang Q,et al.Dynamics of soil carbon and nitrogen stocks after afforestation in arid and semi-arid regions: a meta-analysis[J].Science of Total Environment,2018,618:1658-1664. |
| [1] | 王梅鑫, 刘良旭, 王少昆, 陈敏, 马旭君, Khaulenbek Akhmadi, 郭珍林, 张晓雪, 曲浩. 恢复措施对退化荒漠草原植被与土壤的影响[J]. 中国沙漠, 2025, 45(4): 295-304. |
| [2] | 罗永清, 白浩江, 贾豪, 李刚, 丁杰萍, 周静, 王立龙, 陈伊迪, 李玉强. 科尔沁沙地生态恢复研究进展与思考[J]. 中国沙漠, 2025, 45(4): 75-84. |
| [3] | 王秀磊, 张波, 常青, 孙向波, 李星耀, 吴波, 李佳. 宁夏中卫沙坡头国家级自然保护区鸟兽多样性及活动节律[J]. 中国沙漠, 2025, 45(3): 162-174. |
| [4] | 程星雨, 徐志伟, 俞妍, 张小啸. 卫星遥感揭示的2001年以来中蒙地区沙尘事件频次变化及其原因[J]. 中国沙漠, 2025, 45(2): 47-60. |
| [5] | 杜佳瑜, 刘宪锋, 孙高鹏, 李双双. 2003—2018年黄土高原植被光学厚度时空变化及其影响因素[J]. 中国沙漠, 2024, 44(3): 222-230. |
| [6] | 赵燕翘, 连煜超, 许文文, 赵逸雪, 韩高玲, 赵洋. 中国人工蓝藻结皮研究进展[J]. 中国沙漠, 2023, 43(5): 214-222. |
| [7] | 李鑫鹏, 王朝平, 邹松兵, 岳玮, 罗珊, 王文澍, 秦艺豪, 桑骏, 钱继坤, 王春苗. 基于层次分析法的黄河上游水源涵养区生态系统恢复力评价——以甘南州、临夏州为例[J]. 中国沙漠, 2022, 42(6): 85-93. |
| [8] | 于钊, 李奇铮, 王培源, 蒋齐. 退化和恢复过程驱动的荒漠草地生态系统有机碳密度变化[J]. 中国沙漠, 2022, 42(2): 215-222. |
| [9] | 张甜, 贾荣亮, 高艳红, 孙靖尧, 赵芸, 刘立超. 沙坡头人工固沙植被演替过程中主要结皮生物生态位和种间关联变化特征[J]. 中国沙漠, 2021, 41(4): 100-108. |
| [10] | 康文岩, 王立, 屈建军, 卢琴春. 包兰铁路沙坡头段不同编制结构的枝条阻沙栅栏防护效应风洞模拟[J]. 中国沙漠, 2020, 40(2): 94-99. |
| [11] | 梅诗婧, 李陇堂, 石磊, 宋小龙, 杨萍. 沙漠型景区旅游安全风险评价——以宁夏沙坡头景区为例[J]. 中国沙漠, 2019, 39(5): 143-154. |
| [12] | 宋小龙, 李陇堂, 王艳茹, 石磊, 杨萍, 高秀云. 沙漠型景区旅游环境承载力预警研究——以宁夏沙坡头为例[J]. 中国沙漠, 2019, 39(2): 19-26. |
| [13] | 王艳莉, 齐欣宇, 杨昊天, 宋光, 都军. 不同生境下砂蓝刺头(Echinops gmelini)形态结构及生物量分配特征[J]. 中国沙漠, 2018, 38(4): 756-764. |
| [14] | 石磊, 李陇堂, 张冠乐, 杨萍, 高秀云, 赵云鹏. 基于适宜性分析的沙漠旅游主体功能区划——以宁夏中卫市沙坡头区为例[J]. 中国沙漠, 2018, 38(2): 437-443. |
| [15] | 赵文智, 郑颖, 张格非. 绿洲边缘人工固沙植被自组织过程[J]. 中国沙漠, 2018, 38(1): 1-7. |
| 阅读次数 | ||||||
|
全文 |
|
|||||
|
摘要 |
|
|||||
©2018中国沙漠 编辑部
地址: 兰州市天水中路8号 (730000)
电话:0931-8267545
Email:caiedit@lzb.ac.cn;desert@lzb.ac.cn

 甘公网安备 62010202000688号