中国沙漠 ›› 2024, Vol. 44 ›› Issue (6): 330-341.DOI: 10.7522/j.issn.1000-694X.2024.00152
收稿日期:2024-09-23
修回日期:2024-11-05
出版日期:2024-11-20
发布日期:2024-12-06
通讯作者:
柳本立
作者简介:柳本立(E-mail: liubenli@1zb.ac.cn)基金资助:
Yu Xing1,2( ), Benli Liu1(
 ), Tao Ma3, Yimeng Wang1,2
Received:2024-09-23
Revised:2024-11-05
Online:2024-11-20
Published:2024-12-06
Contact:
Benli Liu
摘要:
基于土壤风蚀预报系统(WEPS)算法,结合多源地理数据,计算了河西走廊-塔克拉玛干沙漠边缘阻击战核心区2000—2023年土壤风蚀及PM10范围,分析其时空变化特征及主要影响因素。结果表明:在研究区总面积80.67万km2内,多年平均风蚀模数为3 553 t·km-2,风蚀高值区集中在塔克拉玛干沙漠东南缘及河西走廊中部。总体上,由于研究区风速下降、植被覆盖度和降水量增加,风蚀模数呈下降趋势,年代下降速率为41 t·km-2,减少区域占总面积的48%。同期,PM10的多年平均释放量为3.11×10⁷ t,平均释放速率为38.53 t·km-2·a-1。在各季节中,春季风蚀模数最高,占年内风蚀总量的47%。风速、植被覆盖度和土壤湿度是关键影响因素,风速对风蚀的贡献率超过90%。
中图分类号:
邢瑜, 柳本立, 马涛, 王伊蒙. 2000—2023年河西走廊-塔克拉玛干沙漠边缘阻击战核心区风蚀起尘量变化[J]. 中国沙漠, 2024, 44(6): 330-341.
Yu Xing, Benli Liu, Tao Ma, Yimeng Wang. Wind erosion and dust emission in the core area of Hexi Corridor-Taklimakan Desert edge in 2000-2023[J]. Journal of Desert Research, 2024, 44(6): 330-341.
| 变量 | 时期 | 数据类型 | 时间/空间分辨率 | 变量用途 |
|---|---|---|---|---|
| 风速 | 2000—2023年 | NetCDF | 1 h/0.25° | 用于估算风蚀量和PM10释放量,是风蚀和起尘的主要驱动力 |
| 土壤含水量 | 2000—2023年 | NetCDF | 1 d/0.25° | |
| 土壤数据 | — | GeoTIFF | —/0.05° | 用于估算土壤的可蚀性和起尘能力 |
| NDVI | 2000—2023年 | HDF | 8 d/0.05° | 反映植被覆盖和健康状况,影响土壤表面抗风蚀能力 |
| EVI | ||||
| LAI | 2000—2023年 | GeoTIFF | 16 d/500 m | |
| 降水量 | 2000—2023年 | NetCDF | 月/0.5° | 影响土壤湿度和植被生长,间接影响风蚀和PM10释放速率 |
| 温度 | 2000—2023年 | NetCDF | 月/0.25° |
表1 数据来源
Table 1 Data sources
| 变量 | 时期 | 数据类型 | 时间/空间分辨率 | 变量用途 |
|---|---|---|---|---|
| 风速 | 2000—2023年 | NetCDF | 1 h/0.25° | 用于估算风蚀量和PM10释放量,是风蚀和起尘的主要驱动力 |
| 土壤含水量 | 2000—2023年 | NetCDF | 1 d/0.25° | |
| 土壤数据 | — | GeoTIFF | —/0.05° | 用于估算土壤的可蚀性和起尘能力 |
| NDVI | 2000—2023年 | HDF | 8 d/0.05° | 反映植被覆盖和健康状况,影响土壤表面抗风蚀能力 |
| EVI | ||||
| LAI | 2000—2023年 | GeoTIFF | 16 d/500 m | |
| 降水量 | 2000—2023年 | NetCDF | 月/0.5° | 影响土壤湿度和植被生长,间接影响风蚀和PM10释放速率 |
| 温度 | 2000—2023年 | NetCDF | 月/0.25° |

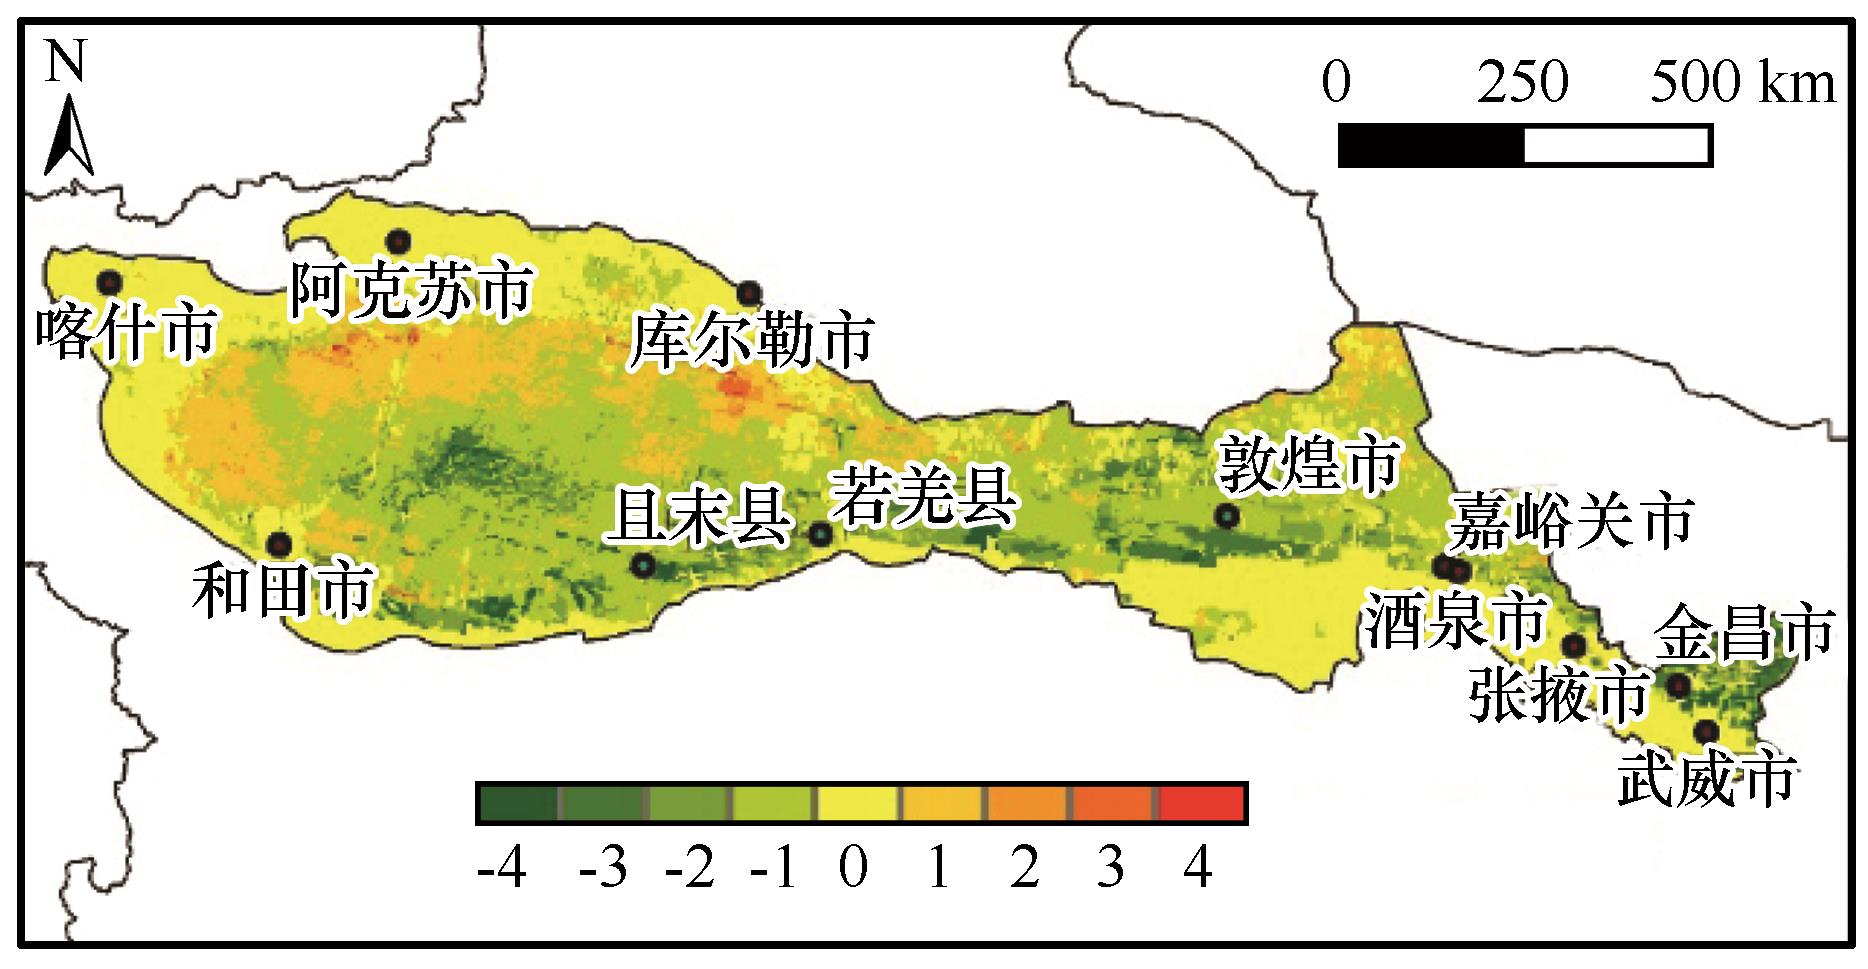
图6 2000—2023年研究区风蚀模数变化趋势空间分布注:正负值分别表示增加和减少趋势。数字绝对值大小表示变化程度,依次为极显著、显著、轻微和不显著
Fig.6 Spatial distribution of trends in wind erosion modulus changes in study area from 2000 to 2023 (Positive and negative values indicate increasing and decreasing trends, respectively. The absolute value of the numbers represents the degree of change, classified as extremely significant, significant, slight, and insignificant, in descending order)

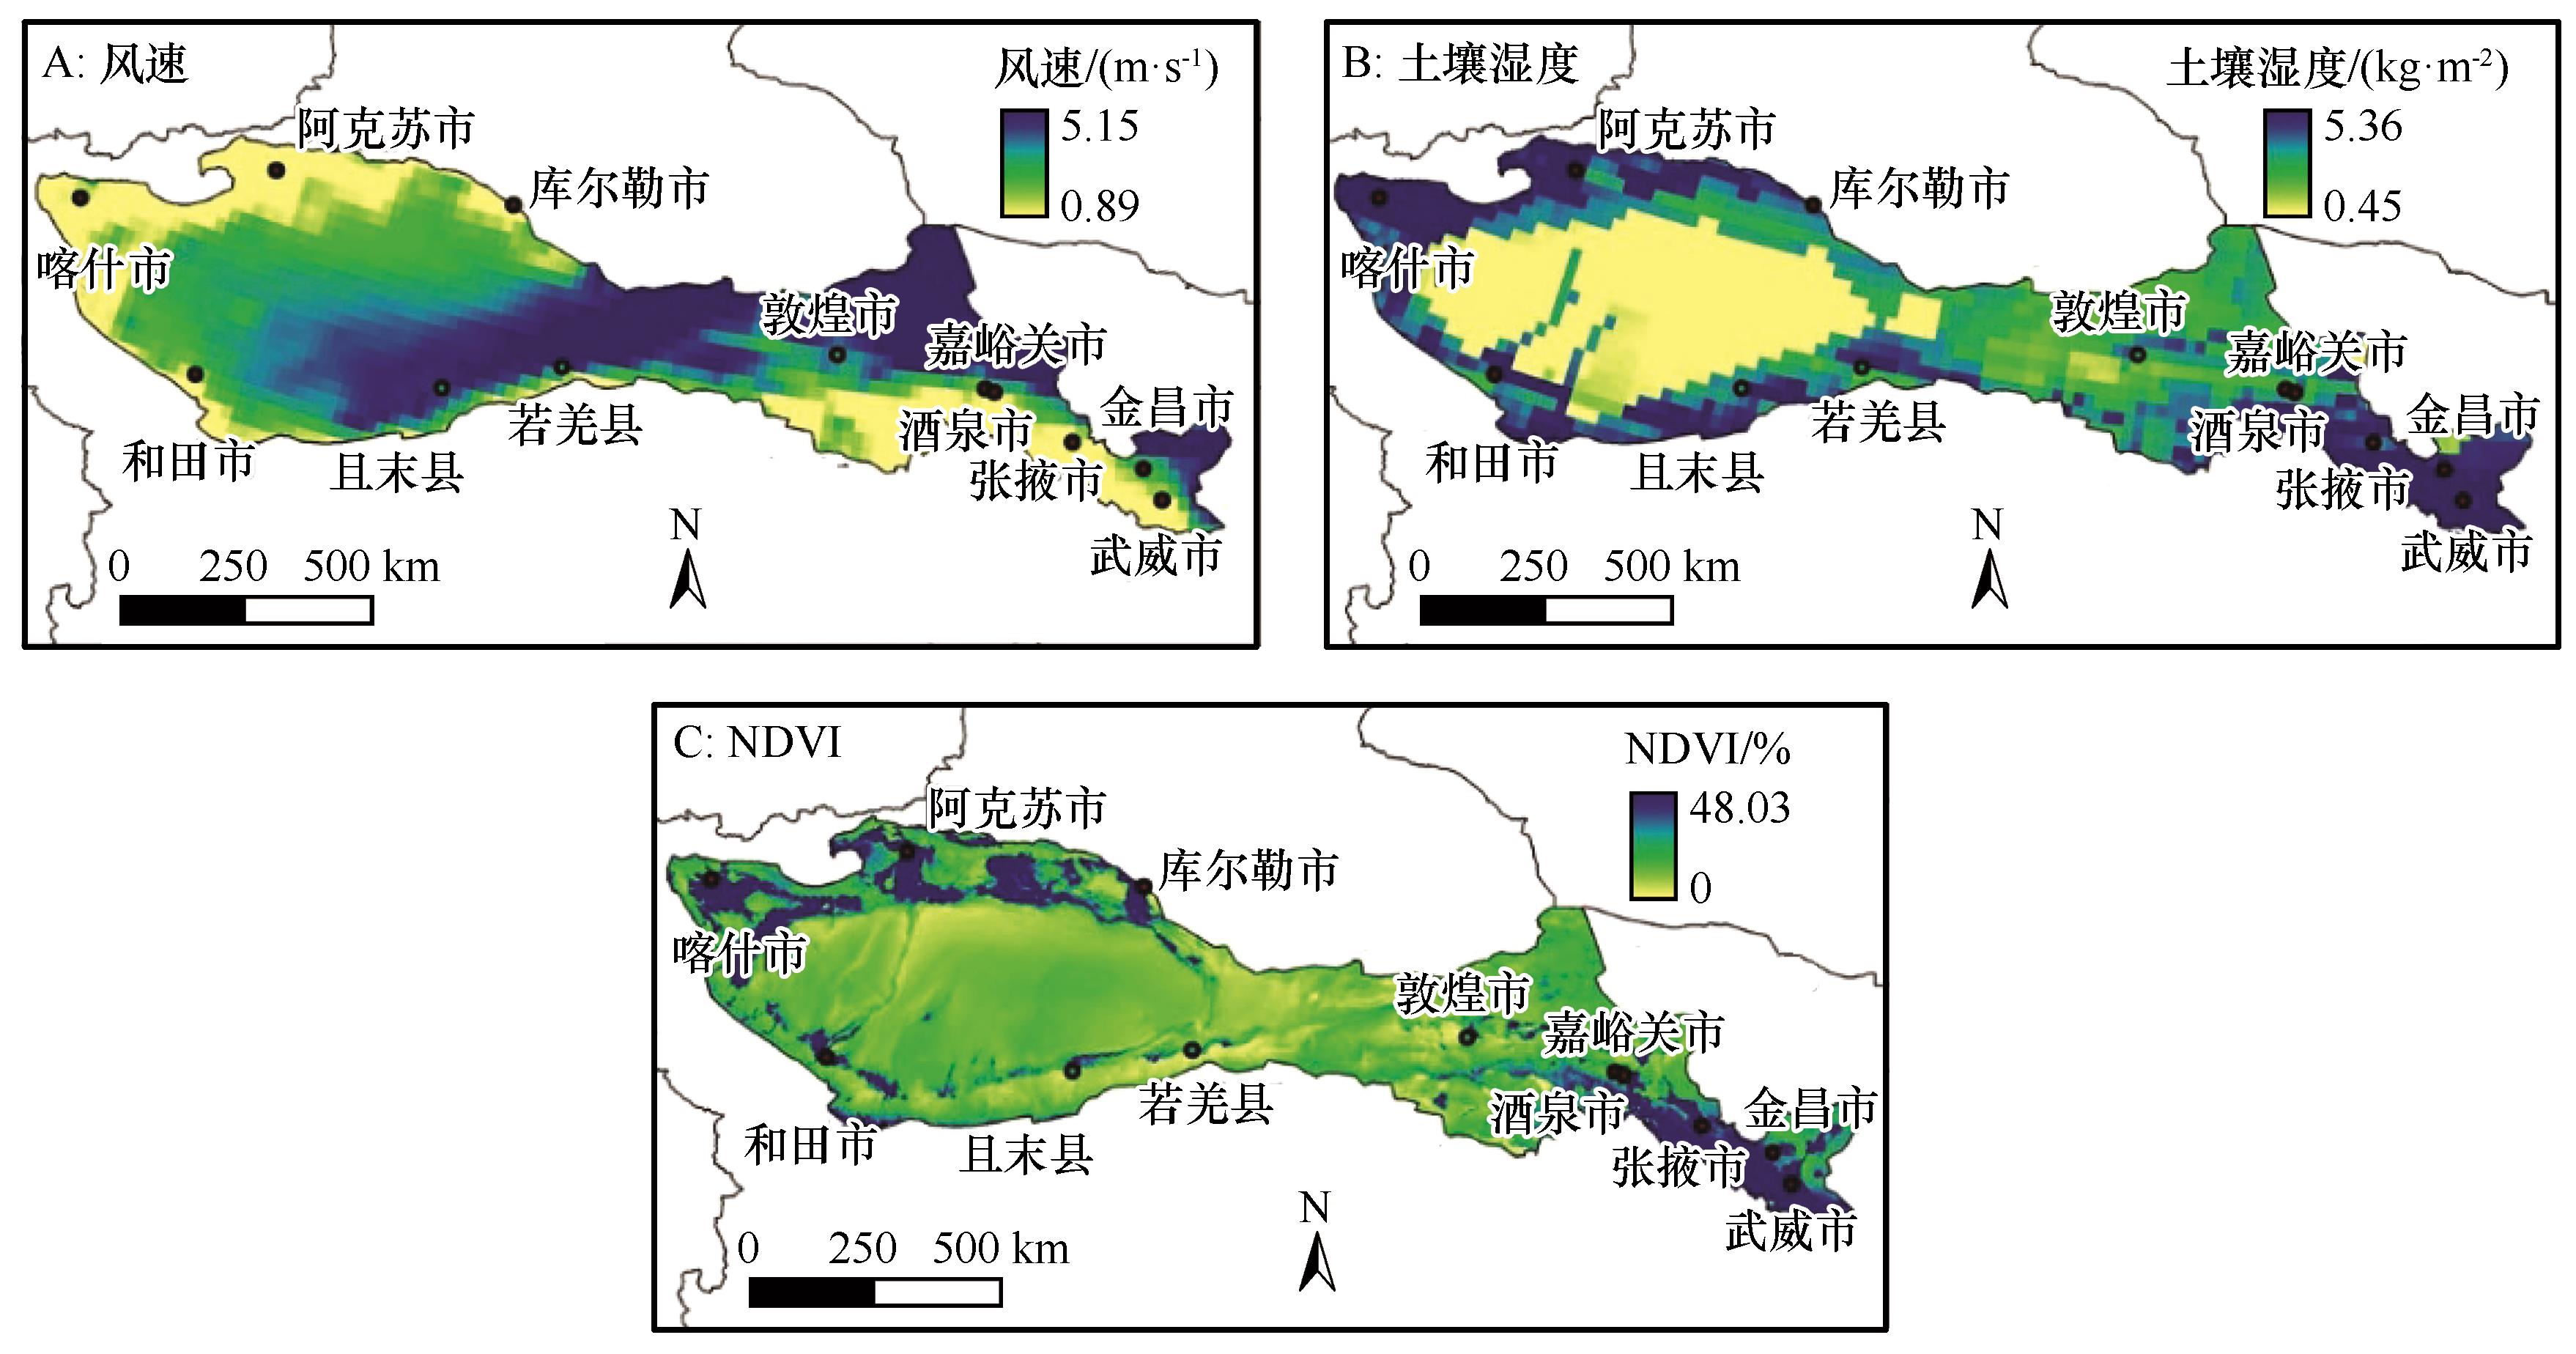
图9 研究区2000—2023年影响因素多年平均值空间分布
Fig.9 Spatial distribution of average wind speed (A), soil moisture (B), and NDVI (C) in the study area from 2000 to 2023

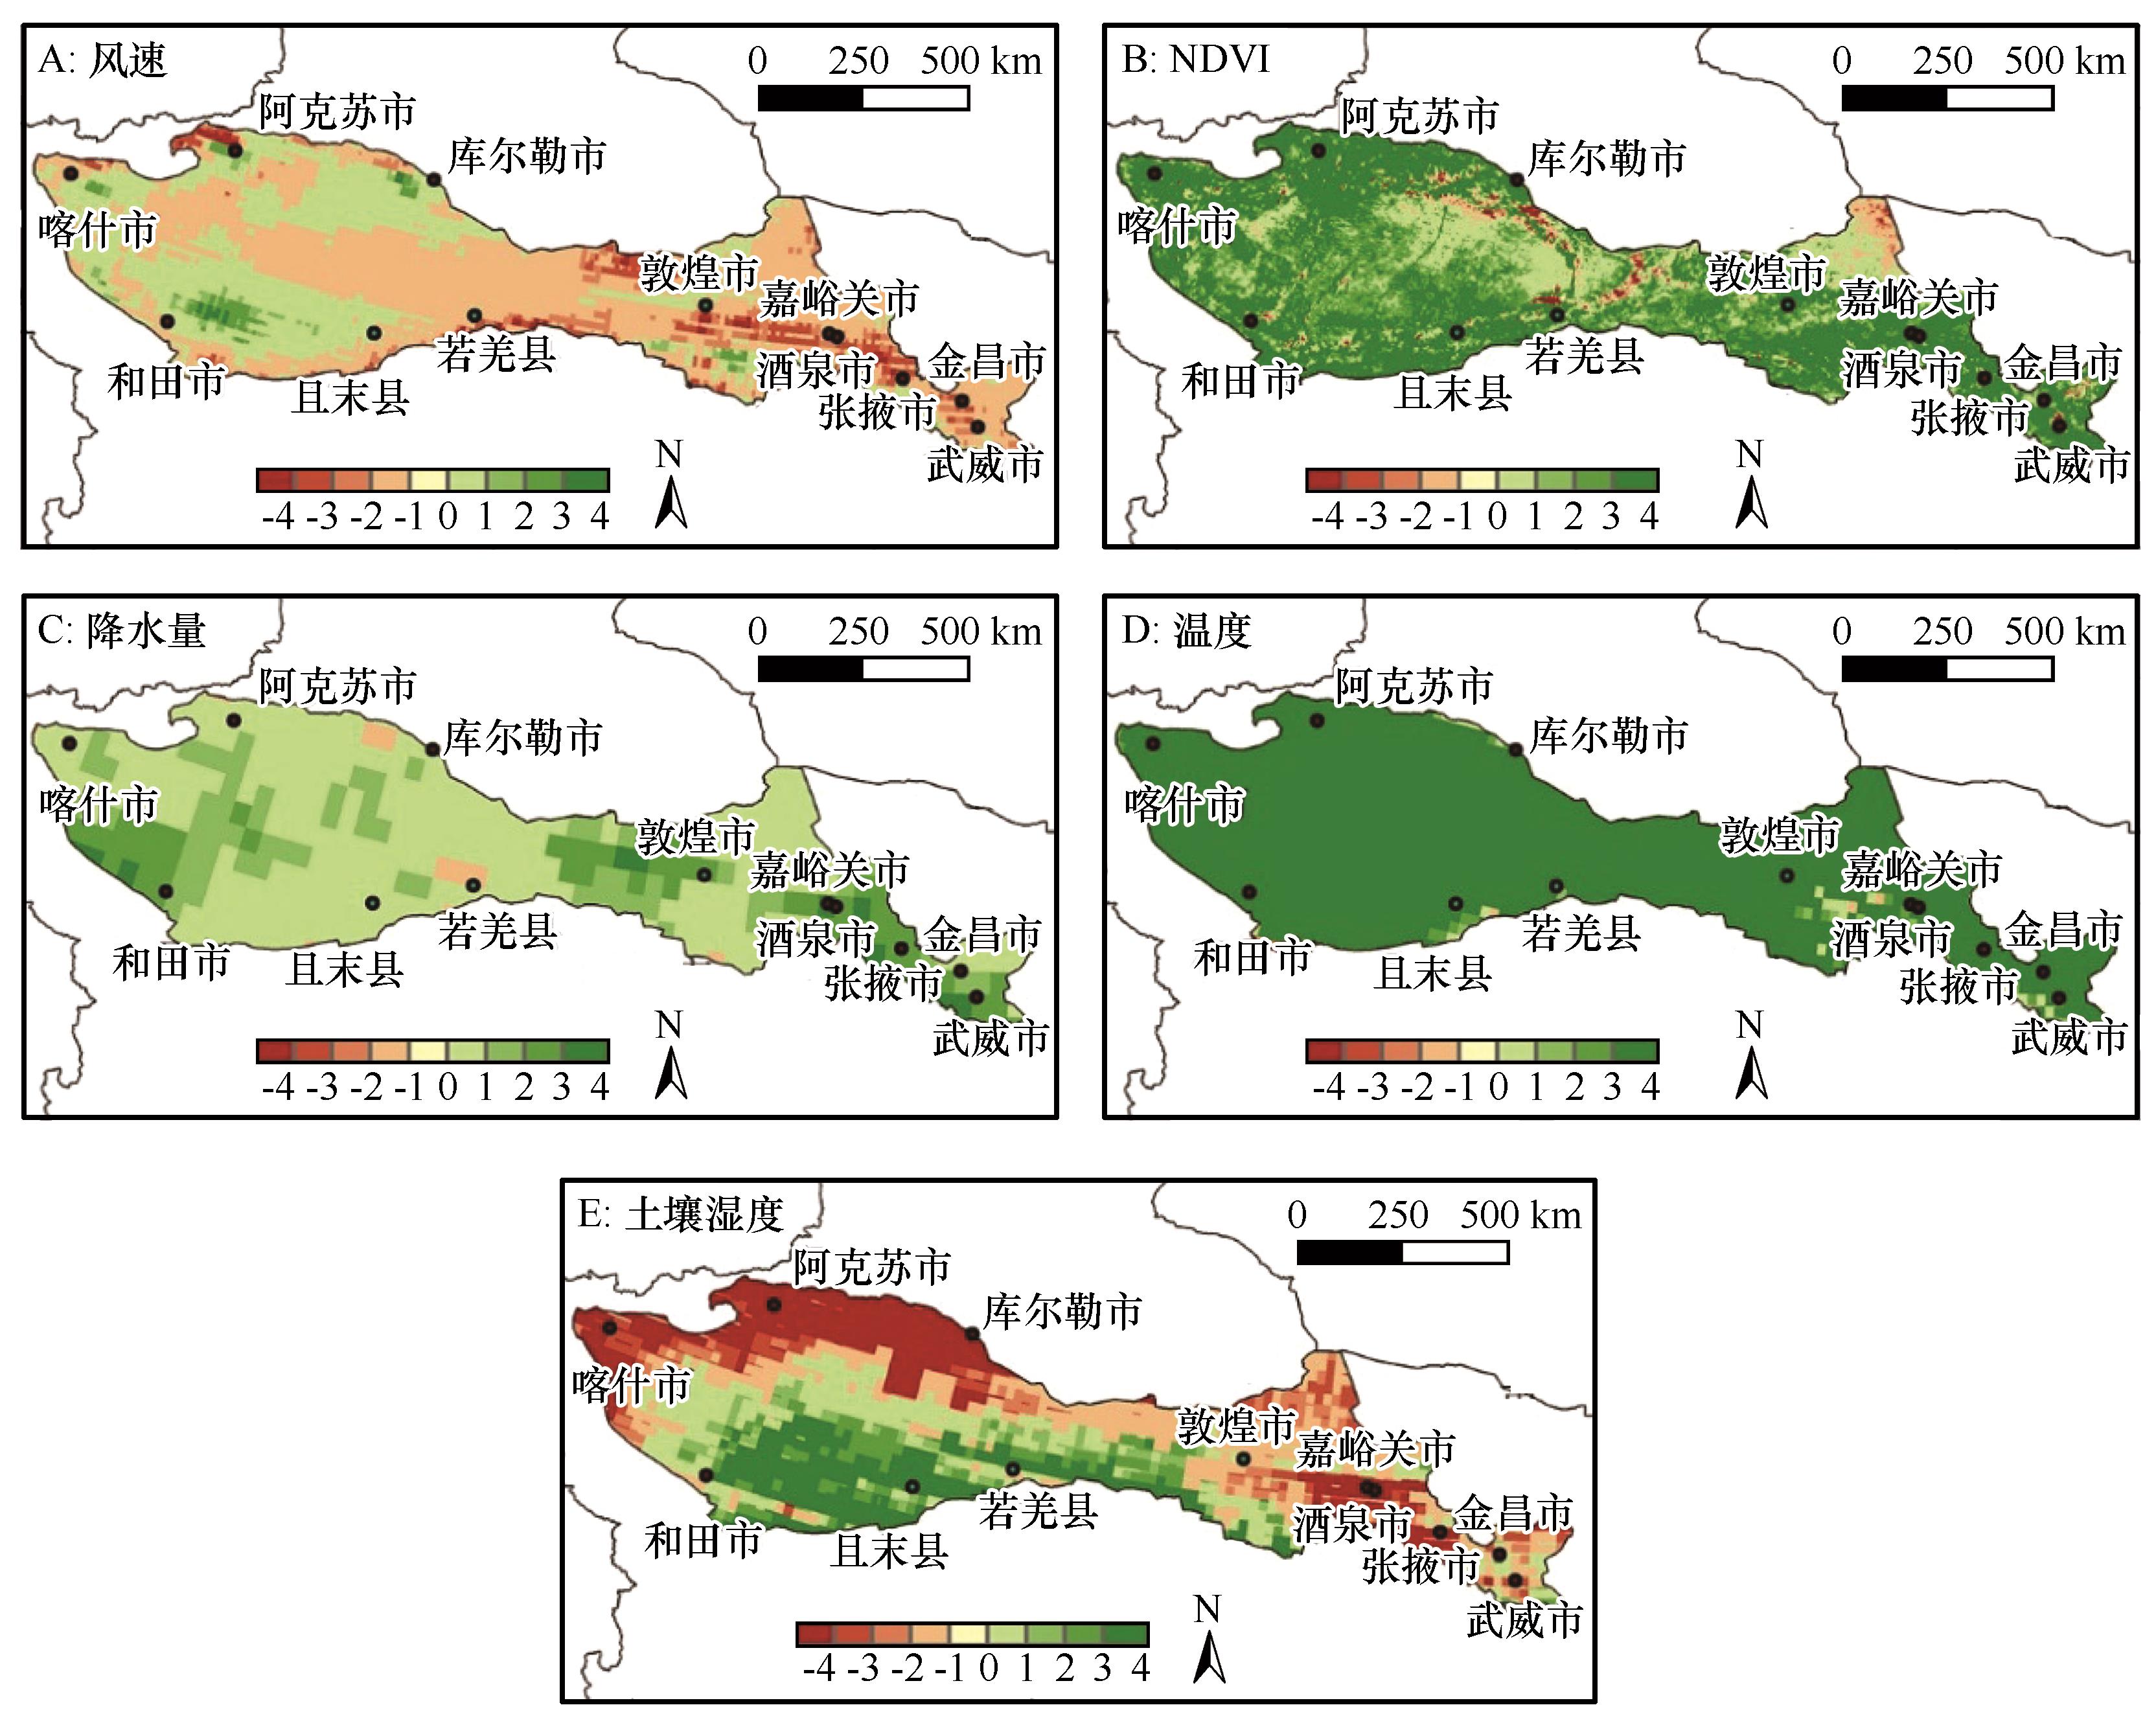
图10 2000—2023年研究区风蚀量与影响因子(风速、土壤湿度和NDVI)的相关系数(左)和偏相关系数(右)空间分布注:星号部分通过95%的显著性检验
Fig.10 Spatial distribution of correlation coefficients (Left) and partial correlation coefficients (Right) between wind erosion and influencing factors (wind speed, soil moisture, and NDVI) in study area from 2000 to 2023 (Asterisks indicate statistical significance at the 95% confidence level)

图11 研究区风蚀量演变的主导影响因子(回归分析通过95%的显著性检验)
Fig.11 Dominant factors driving the evolution of wind erosion in study area from 2000 to 2023(regression analysis passes the 95% significance test)

图12 2000—2023年研究区气候因素变化趋势注:正负值分别表示增加和减少趋势。数字绝对值大小表示变化程度,依次为极显著、显著、轻微和不显著
Fig.12 Trends of climatic factors in study area from 2000 to 2023(Positive and negative values indicate increasing and decreasing trends, respectively. The absolute value of the numbers represents the degree of change, classified as extremely significant, significant, slight, and insignificant, in descending order)
| 1 | 崔桂鹏,肖春蕾,雷加强,等.大国治理:中国荒漠化防治的战略选择与未来愿景[J].中国科学院院刊,2023,38(7):943-955. |
| 2 | 冯益明,卢琦,姚斌,等.河西走廊-塔克拉玛干沙漠边缘阻击战核心区现状、区划及任务[J].中国沙漠,2024,44(4):91-101. |
| 3 | 林锦阔.河西地区土壤侵蚀时空分异及其驱动因素[D].兰州:兰州大学,2021. |
| 4 | Hagen L J.A wind erosion prediction system to meet user needs[J].Journal of Soil and Water Conservation,1991,46(2):106-111. |
| 5 | Warren S D, Mitasova H, Hohmann M G,et al.Validation of a 3-d enhancement of the universal soil loss equation for prediction of soil erosion and sediment deposition[J].Catena,2005,64(2/3):281-296. |
| 6 | Mayaud J.Development and testing of a coupled vegetation sediment-transport model for dryland environments[D].Oxford,UK:University of Oxford,2017. |
| 7 | Lu H, Shao Y P.Toward quantitative prediction of dust storms:an integrated wind erosion modelling system and its applications[J].Environmental Modelling Software,2001,16(3):233-249. |
| 8 | Ravi S, D'odorico P, Breshears D D,et al.Aeolian processes and the biosphere[J].Reviews of Geophysics,2011,49(3):RG3001. |
| 9 | Fryrear D W, Stout J E, Hagen L J,et al.Wind erosion-field measurement and analysis[J].Transactions of the ASAE,1991,34(1):155-160. |
| 10 | Meng Z J, Dang X H, Gao Y,et al.Interactive effects of wind speed,vegetation coverage and soil moisture in controlling wind erosion in a temperate desert steppe,Inner Mongolia of China[J].Journal of Arid Land,2018,10(4):534-547. |
| 11 | Zhang G F, Azorin-Molina C, Shi P J,et al.Impact of near-surface wind speed variability on wind erosion in the eastern agro-pastoral transitional zone of northern China,1982-2016[J].Agricultural and Forest Meteorology,2019,271:102-115. |
| 12 | Woodruff N P, Siddoway F H.A wind erosion equation[J].Soil Science Society of America Journal,1965,29:602-608. |
| 13 | Fryrear D W, Saleh A, Bilbro J D,et al.Revised wind erosion equation[R].Lubbock,USA:USDA ARS,1998. |
| 14 | Jiang Y, Gao Y, Dong Z,et al.Simulations of wind erosion along the Qinghai-Tibet Railway in north-central Tibet[J].Aeolian Research,2018,32:192-201. |
| 15 | Guan Q, Sun X, Yang J,et al.Dust storms in northern china:long-term spatiotemporal characteristics and climate controls[J].Journal of Climate,2017,30(13):6683-6700. |
| 16 | Uwizeyimana D, Mureithi S M, Mvuyekure S M,et al.Modelling surface runoff using the soil conservation service-curve number method in a drought prone agro-ecological zone in Rwanda[J].International Soil and Water Conservation Research,2019,7(1):9-17. |
| 17 | 陆晓娟,李忆平,王劲松.中国北方干旱多发带极端春夏连旱的主要影响因子特征[J].高原气象:1-16. DOI: 10.7522/j.issn.1000-0534.2024.00053 . |
| 18 | 雷加强,高鑫,赵永成,等.河西走廊-塔克拉玛干沙漠边缘阻击战:风沙形势与防治任务[J].中国科学院院刊,2023,38(7):966-977. |
| 19 | 王燕,王萍.风蚀预报系统(WEPS)在民勤荒漠地区的应用分析研究[J].干旱区地理,2013,36(1):109-117. |
| 20 | Rawls W J.Estimating soil bulk-density from particle-size analysis and organic-matter content[J].Soil Science,1983,135(2):123-125. |
| 21 | Barik G, Acharya P, Maiti A,et al.A synergy of linear model and wavelet analysis towards space-time characterization of aerosol optical depth (AOD) during pre-monsoon season (2007-2016) over Indian sub-continent[J].Journal of Atmospheric and Solar-Terrestrial Physics,2020,211:105478. |
| 22 | 黄嘉佑.气象统计分析与预报方法[M].北京:气象出版社,1990. |
| 23 | 中华人民共和国水利部. 土壤侵蚀分类分级标准: [S].北京:中国水利水电出版社,2008. |
| 24 | Zender C S, Bian H S, Newman D.Mineral dust entrainment and deposition (dead) model:description and 1990s dust climatology[J].Journal of Geophysical Research-Atmospheres,2003,108(D14):4416. |
| 25 | He Q, Yang X H, Mamtimin A,et al.Impact factors of soil wind erosion in the center of Taklimakan Desert[J].Journal of Arid Land,2011,3(1):9-14. |
| 26 | de Oro L A, Buschiazzo D E.Threshold wind velocity as an index of soil susceptibility to wind erosion under variable climatic conditions[J].Land Degradation Development,2009,20(1):14-21. |
| 27 | Chi W, Zhao Y, Kuang W,et al.Impacts of anthropogenic land use/cover changes on soil wind erosion in China[J].The Science of the Total Environment,2019,668:204-215. |
| 28 | Li X, Wu Z, Du Z,et al.Study on regional soil wind erosion and its influencing factors based on different wind erosion models-take Inner Mongolia Autonomous Region as an example[J].Journal of Soil and Water Conservation,2021,35(6):69-75. |
| 29 | Wang X, Cheng H, Che H,et al.Modern dust aerosol availability in northwestern China[J].Scientific Reports,2017,7(1):8741. |
| 30 | Liu Y X, Teng Y, Liang S,et al.Establishment of pm10 and PM2.5 emission inventories from wind erosion source and simulation of its environmental impact based on WEPS-models3 in southern Xinjiang,China[J].Atmospheric Environment,2021,248:118222. |
| 31 | Li X L, Zhang H S.Seasonal variations in dust concentration and dust emission observed over Horqin Sandy Land area in China from December 2010 to November 2011[J].Atmospheric Environment,2012,61:56-65. |
| 32 | 霍文,杨青,何清,等.新疆大风区沙尘暴气候特征分析[J].干旱区地理,2011,34(5):753-761. |
| 33 | 马禹,肖开提,王旭.塔里木盆地沙尘天气的气候特征[J].北京大学学报(自然科学版),2006(6):784-790. |
| 34 | 赵兴梁.甘肃特大沙尘暴的危害与对策[J].中国沙漠,1993,13(3):4-10. |
| 35 | 张存杰 汤绪,李耀辉.河西走廊沙尘暴特征及气候成因分析[J].干旱气象,2003(4):18-22. |
| 36 | 宋敏红,钱正安,蔡英.19930505金昌特强沙尘暴爆发诱因再分析[J].高原气象,2020,39(5):1102-1109. |
| 37 | 黄麟,吴丹,孙朝阳.基于规划目标的京津风沙源治理区生态保护与修复效应[J].生态学报,2020,40(6):1923-1932. |
| 38 | 孙钦珂,周亮,唐相龙,等.干旱区绿洲城镇扩张对耕地空间影响及预测:以河西走廊区域为例[J].自然资源学报,2021,36(4):1008-1020. |
| 39 | 赵文智,任珩,杜军,等.河西走廊绿洲生态建设和农业发展的若干思考与建议[J].中国科学院院刊,2023,38(3):424-434. |
| 40 | Peng S, Chen A, Xu L,et al.Recent change of vegetation growth trend in China[J].Environmental Research Letters,2011,6(4):044027. |
| 41 | Tsoar H.Sand dunes mobility and stability in relation to climate[J].Physica A:Statistical Mechanics and its Applications,2005,357(1):50-56. |
| 42 | 柳本立,彭婉月,刘树林,等.2021年3月中旬东亚中部沙尘天气地面起尘量及源区贡献率估算[J].中国沙漠,2022,42(1):79-86. |
| [1] | 冯益明, 卢琦, 姚斌, 席磊, 曹晓明, 刘永萍, 宁虎森. 河西走廊-塔克拉玛干沙漠边缘阻击战核心区现状、区划及任务[J]. 中国沙漠, 2024, 44(4): 91-101. |
| [2] | 贾文茹, 李庆, 李秀明, 谢宝妮, 王翠. 2000—2018年河北坝上地区土壤风蚀模数变化[J]. 中国沙漠, 2024, 44(1): 130-141. |
| [3] | 李庆, 周娜, 王盛, 李童洲, 王仁德, 王金凤. 气候变化和人类活动对土壤风蚀影响的定量评估[J]. 中国沙漠, 2024, 44(1): 178-188. |
| [4] | 王仁德, 蒋红军, 李庆, 付刚, 李玉强, 苑依笑, 常春平, 郭中领. 土壤粉尘释放能力与土壤性质关系的初步研究[J]. 中国沙漠, 2024, 44(1): 43-49. |
| [5] | 迟文峰, 王月甜, 党晓宏, 吴晓光, 罗前程. 黄河流域土壤侵蚀时空演变与格局特征[J]. 中国沙漠, 2023, 43(3): 305-317. |
| [6] | 张正偲, 潘凯佳, 张焱, 韩兰英. 中国西北戈壁区沙尘暴过程中近地层风沙运动特征[J]. 中国沙漠, 2023, 43(2): 130-138. |
| [7] | 王仁德, 李庆, 常春平, 郭中领, 李继峰, 邹学勇, 张春来, 苑依笑, 刘颖, 周娜. 土壤风蚀中粉尘释放问题的研究进展[J]. 中国沙漠, 2023, 43(2): 85-103. |
| [8] | 王蕾, 蒙瑞丽, 曹磊, 高飞, 陈浩, 李毅辉, 张佳音, 闫东杰, 刘笑, 牛天田, 任静. 2016—2020年沙尘天气对陕西省空气质量的影响特征[J]. 中国沙漠, 2022, 42(4): 130-138. |
| [9] | 张越, 陈思宇, 毕鸿儒, 曹佳慧, 罗源, 龚咏琪, 陈渔. 干旱半干旱区农田土壤风蚀特征及参数化研究进展[J]. 中国沙漠, 2022, 42(3): 105-117. |
| [10] | 袁小琴, 刘生权, 艾峰, 张正, 李强, 蒋晋豫, 石长春. 毛乌素沙地东南缘沙柳(Salix psammophila)群落枯落物抗风蚀特征[J]. 中国沙漠, 2022, 42(1): 134-138. |
| [11] | 杨小菊, 赵学勇, 武发思, 张正模, 薛平, 陈章, 汪万福, 张国彬. 莫高窟PM10浓度与气象要素的关系[J]. 中国沙漠, 2021, 41(6): 54-64. |
| [12] | 邢丽珠, 张方敏, 邢开成, 李云鹏, 卢琦, 鲁飞飞. 基于RWEQ模型的内蒙古巴彦淖尔市土壤风蚀变化特征及归因分析[J]. 中国沙漠, 2021, 41(5): 111-119. |
| [13] | 王仁德, 安晨宇, 苑依笑, 张春来, 李庆, 查慧敏, 常春平, 郭中领. 不同时间尺度下农田土壤风蚀可蚀性的变化[J]. 中国沙漠, 2021, 41(5): 202-209. |
| [14] | 李汉林, 何清, 赵权威. 喀什地区PM10输送路径及潜在源区[J]. 中国沙漠, 2021, 41(5): 62-70. |
| [15] | 李亚红, 卜崇峰, 郭琦, 韦应欣. 毛乌素沙地藓、藻结皮生态功能对比[J]. 中国沙漠, 2021, 41(2): 138-144. |
| 阅读次数 | ||||||
|
全文 |
|
|||||
|
摘要 |
|
|||||
©2018中国沙漠 编辑部
地址: 兰州市天水中路8号 (730000)
电话:0931-8267545
Email:caiedit@lzb.ac.cn;desert@lzb.ac.cn
