
- CN 62-1070/P
- ISSN 1000-694X
- Bimonthly 1981
Journal of Desert Research ›› 2021, Vol. 41 ›› Issue (6): 235-248.DOI: 10.7522/j.issn.1000-694X.2021.00126
Haijin Shia( ), Wenheng Wua,b(), Yan Lia, Jinfeng Liua, Yun Wana
Received:2021-07-14
Revised:2021-09-25
Online:2021-11-20
Published:2021-12-17
Contact:
Wenheng Wu
CLC Number:
Haijin Shi, Wenheng Wu, Yan Li, Jinfeng Liu, Yun Wan. Study on spatial expansion and dynamic factors of built-up area of central cities in the Yellow River Basin based on night-time light data[J]. Journal of Desert Research, 2021, 41(6): 235-248.
Add to citation manager EndNote|Ris|BibTeX
URL: http://www.desert.ac.cn/EN/10.7522/j.issn.1000-694X.2021.00126
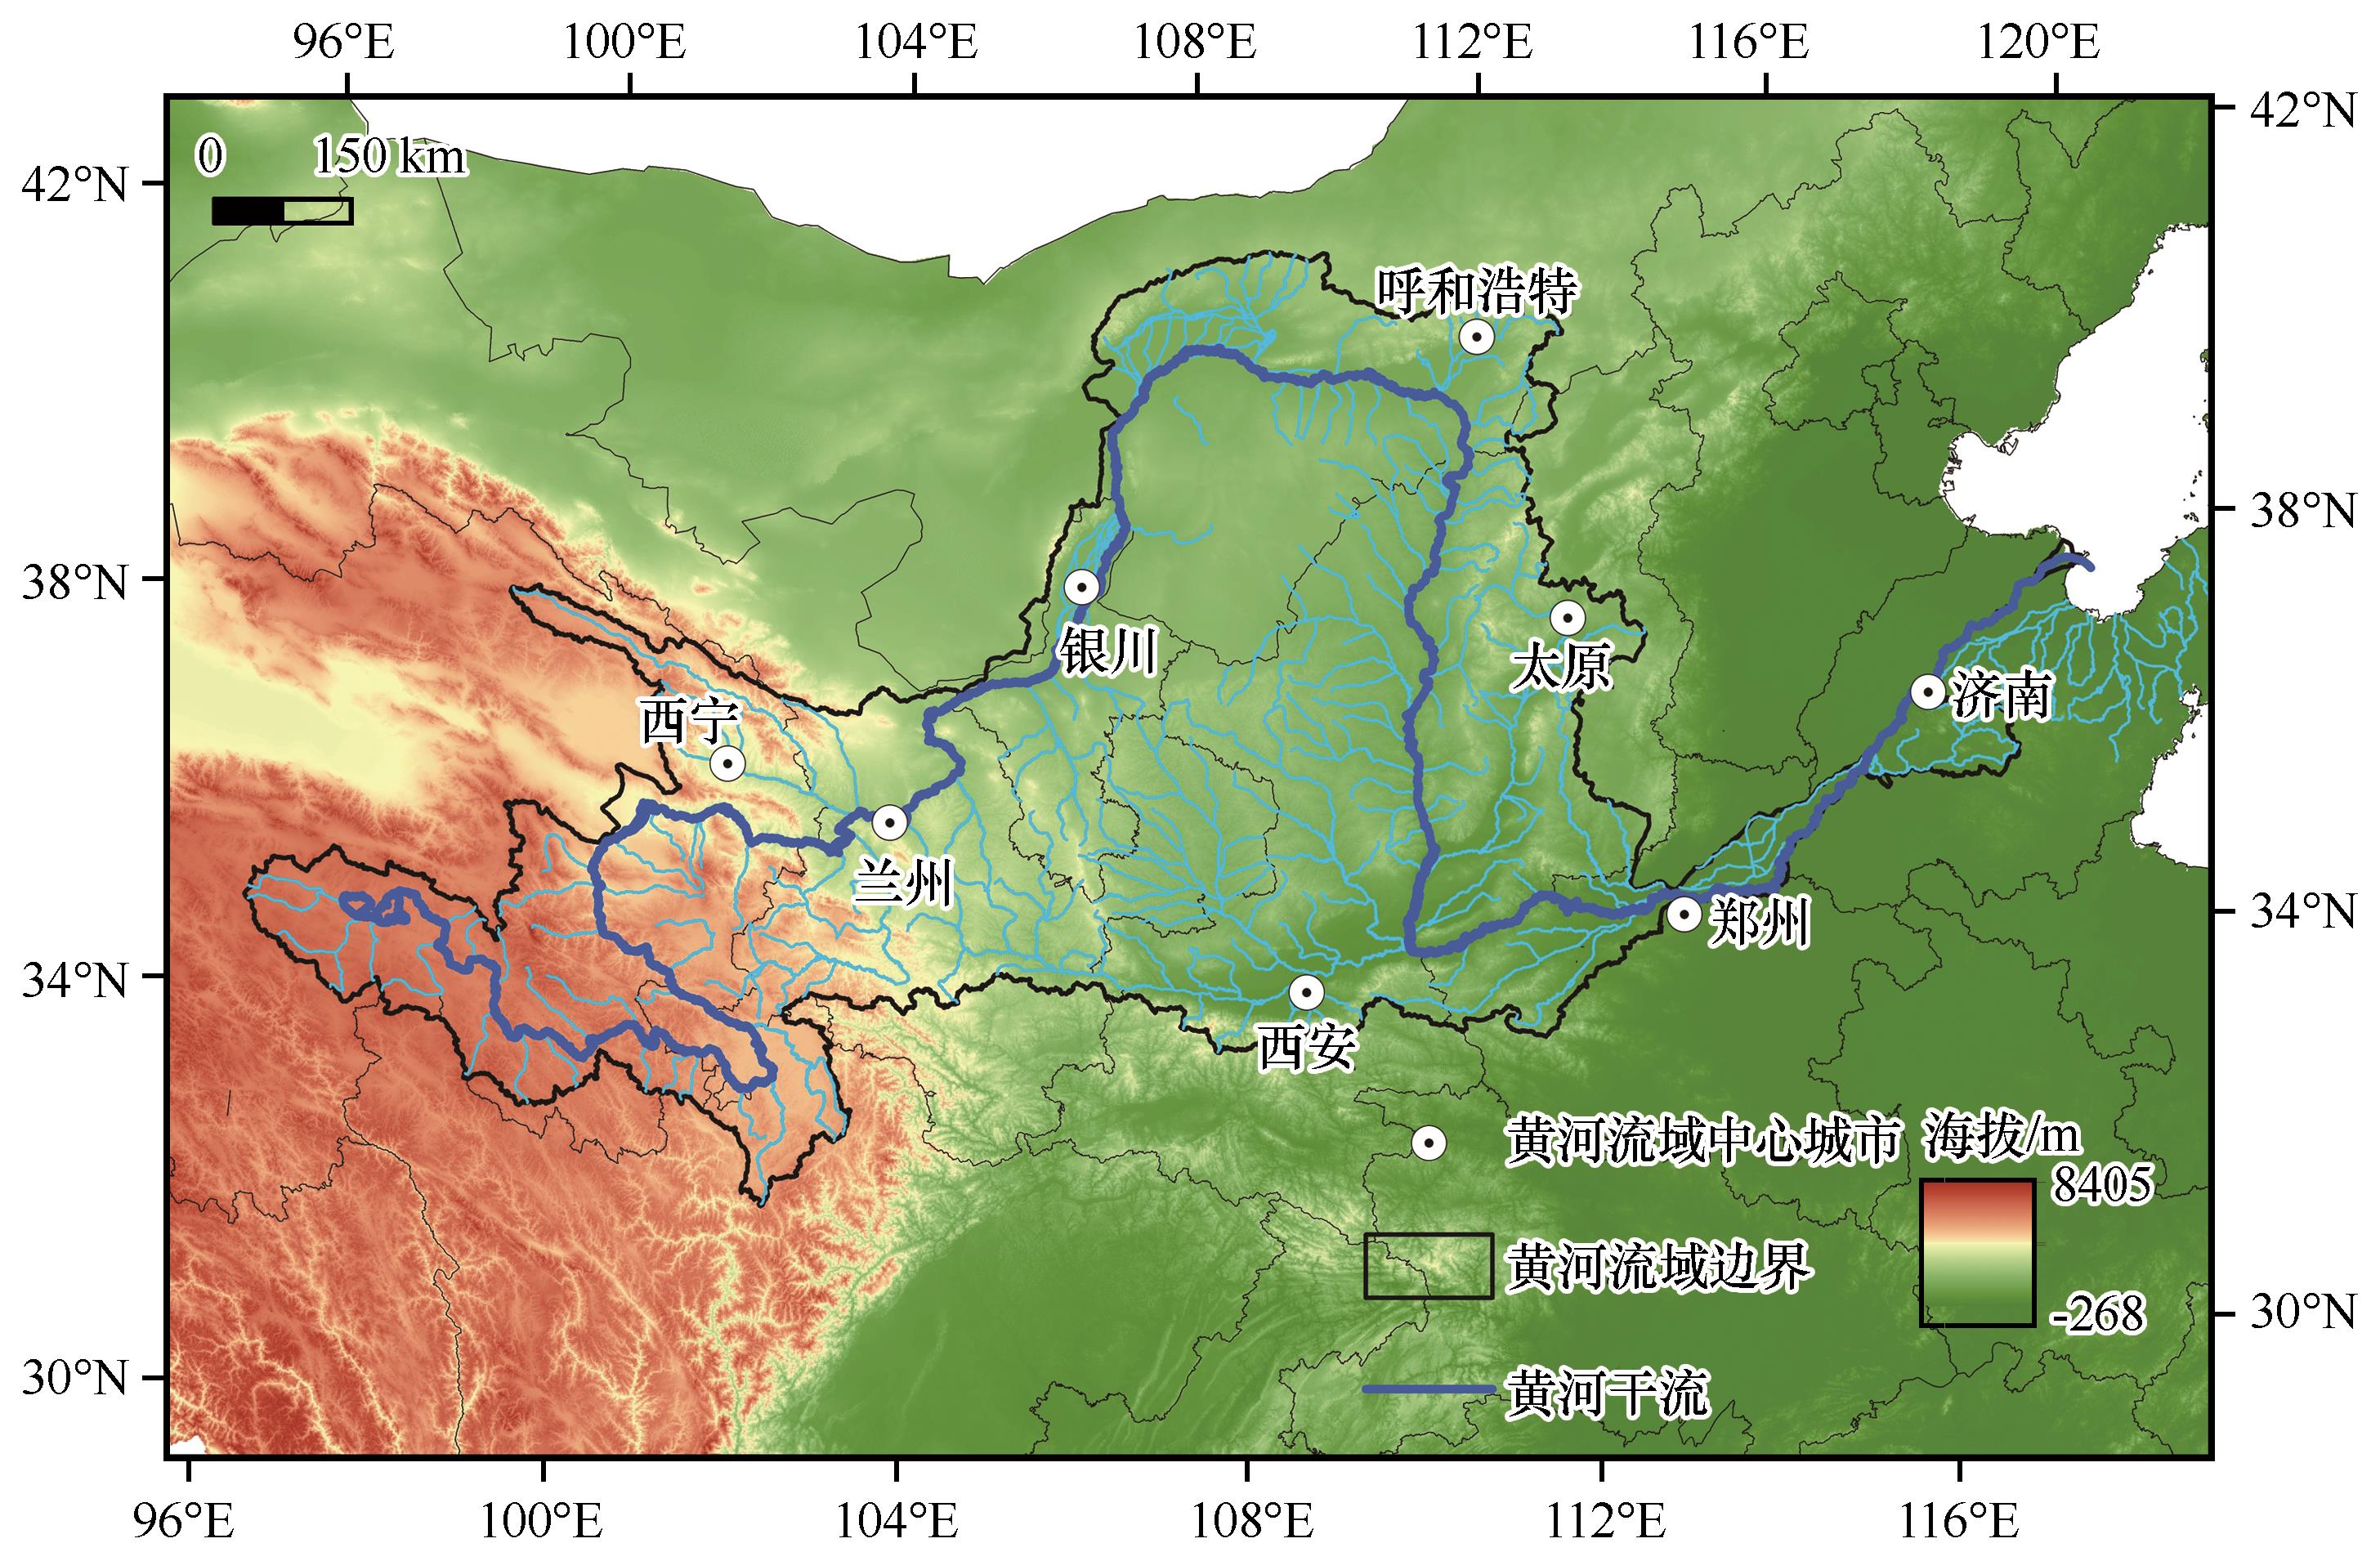
Fig.1 Distribution of central cities in the Yellow River Basin
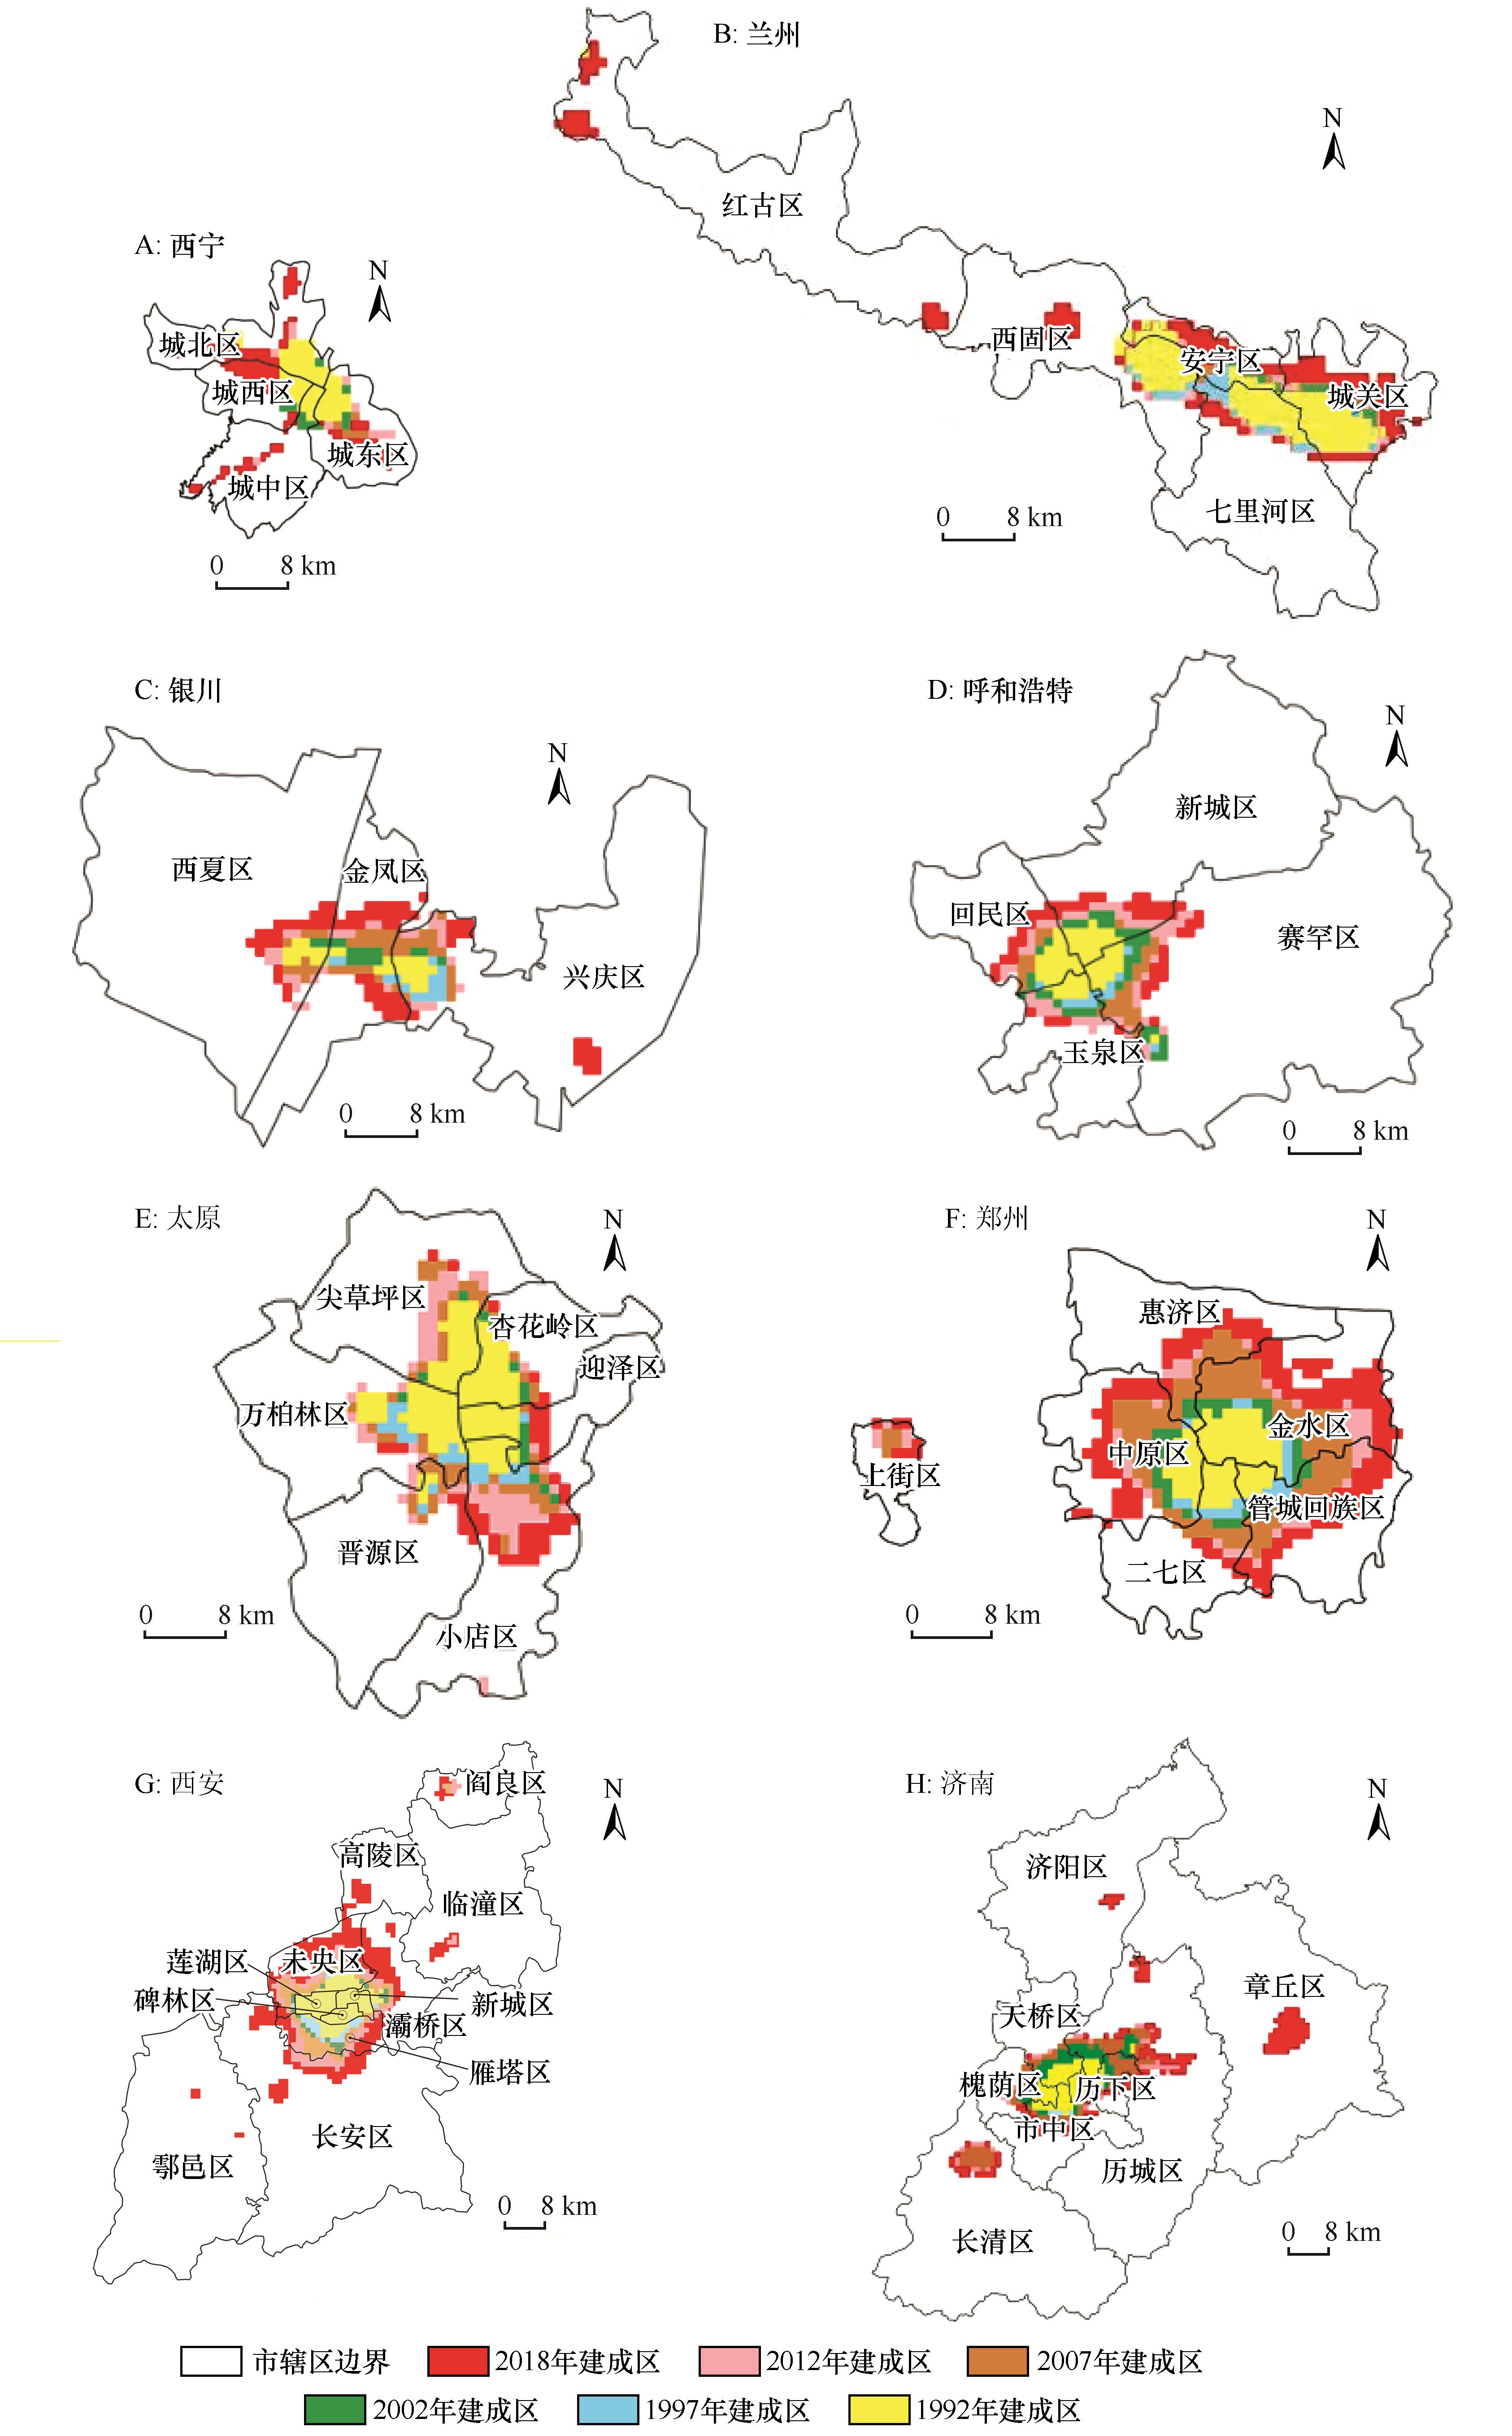
Fig.2 Spatial expansion of built-up areas in central cities from 1992 to 2018
| 城市 | 1992年 | 1997年 | 2002年 | 2007年 | 2012年 | 2018年 | 1992—2018年扩张 |
|---|---|---|---|---|---|---|---|
| 西宁 | 52 | 60 | 61 | 65 | 75 | 95 | 43 |
| 兰州 | 163 | 163 | 180 | 183 | 199 | 331 | 168 |
| 银川 | 42 | 46 | 60 | 107 | 135 | 203 | 161 |
| 呼和浩特 | 75 | 78 | 120 | 150 | 210 | 260 | 185 |
| 太原 | 168 | 168 | 177 | 238 | 310 | 340 | 172 |
| 西安 | 148 | 162 | 187 | 268 | 375 | 702 | 554 |
| 郑州 | 100 | 116 | 156 | 321 | 373 | 544 | 444 |
| 济南 | 110 | 115 | 190 | 315 | 363 | 524 | 414 |
Table 1 Built-up area of central cities from 1992 to 2018
| 城市 | 1992年 | 1997年 | 2002年 | 2007年 | 2012年 | 2018年 | 1992—2018年扩张 |
|---|---|---|---|---|---|---|---|
| 西宁 | 52 | 60 | 61 | 65 | 75 | 95 | 43 |
| 兰州 | 163 | 163 | 180 | 183 | 199 | 331 | 168 |
| 银川 | 42 | 46 | 60 | 107 | 135 | 203 | 161 |
| 呼和浩特 | 75 | 78 | 120 | 150 | 210 | 260 | 185 |
| 太原 | 168 | 168 | 177 | 238 | 310 | 340 | 172 |
| 西安 | 148 | 162 | 187 | 268 | 375 | 702 | 554 |
| 郑州 | 100 | 116 | 156 | 321 | 373 | 544 | 444 |
| 济南 | 110 | 115 | 190 | 315 | 363 | 524 | 414 |
| 城市 | 1992—1997年 | 1997—2002年 | 2002—2007年 | 2007—2012年 | 2012—2018年 |
|---|---|---|---|---|---|
| 西宁 | 3.08 | 0.33 | 1.31 | 3.08 | 4.44 |
| 兰州 | 0.00 | 2.09 | 0.33 | 1.75 | 11.06 |
| 银川 | 1.90 | 6.09 | 15.67 | 5.23 | 8.40 |
| 呼和浩特 | 0.80 | 10.77 | 5.00 | 8.00 | 3.97 |
| 太原 | 0.00 | 1.07 | 6.89 | 6.05 | 1.61 |
| 西安 | 1.89 | 3.09 | 8.66 | 7.99 | 14.53 |
| 郑州 | 3.20 | 6.90 | 21.15 | 3.24 | 7.64 |
| 济南 | 0.91 | 13.04 | 13.16 | 3.05 | 7.39 |
Table 2 Expansion intensity index of built-up areas in central cities from 1992 to 2018
| 城市 | 1992—1997年 | 1997—2002年 | 2002—2007年 | 2007—2012年 | 2012—2018年 |
|---|---|---|---|---|---|
| 西宁 | 3.08 | 0.33 | 1.31 | 3.08 | 4.44 |
| 兰州 | 0.00 | 2.09 | 0.33 | 1.75 | 11.06 |
| 银川 | 1.90 | 6.09 | 15.67 | 5.23 | 8.40 |
| 呼和浩特 | 0.80 | 10.77 | 5.00 | 8.00 | 3.97 |
| 太原 | 0.00 | 1.07 | 6.89 | 6.05 | 1.61 |
| 西安 | 1.89 | 3.09 | 8.66 | 7.99 | 14.53 |
| 郑州 | 3.20 | 6.90 | 21.15 | 3.24 | 7.64 |
| 济南 | 0.91 | 13.04 | 13.16 | 3.05 | 7.39 |
| 年份 | 西宁 | 兰州 | 银川 | 呼和浩特 | 太原 | 西安 | 郑州 | 济南 |
|---|---|---|---|---|---|---|---|---|
| 1992年 | 0.61 | 0.44 | 0.51 | 0.55 | 0.45 | 0.56 | 0.77 | 0.58 |
| 2018年 | 0.31 | 0.38 | 0.44 | 0.60 | 0.53 | 0.35 | 0.47 | 0.33 |
| 变化量 | -0.30 | -0.06 | -0.07 | 0.05 | 0.08 | -0.21 | -0.30 | -0.25 |
Table 3 The change of compactness index in central cities from 1992 to 2018
| 年份 | 西宁 | 兰州 | 银川 | 呼和浩特 | 太原 | 西安 | 郑州 | 济南 |
|---|---|---|---|---|---|---|---|---|
| 1992年 | 0.61 | 0.44 | 0.51 | 0.55 | 0.45 | 0.56 | 0.77 | 0.58 |
| 2018年 | 0.31 | 0.38 | 0.44 | 0.60 | 0.53 | 0.35 | 0.47 | 0.33 |
| 变化量 | -0.30 | -0.06 | -0.07 | 0.05 | 0.08 | -0.21 | -0.30 | -0.25 |
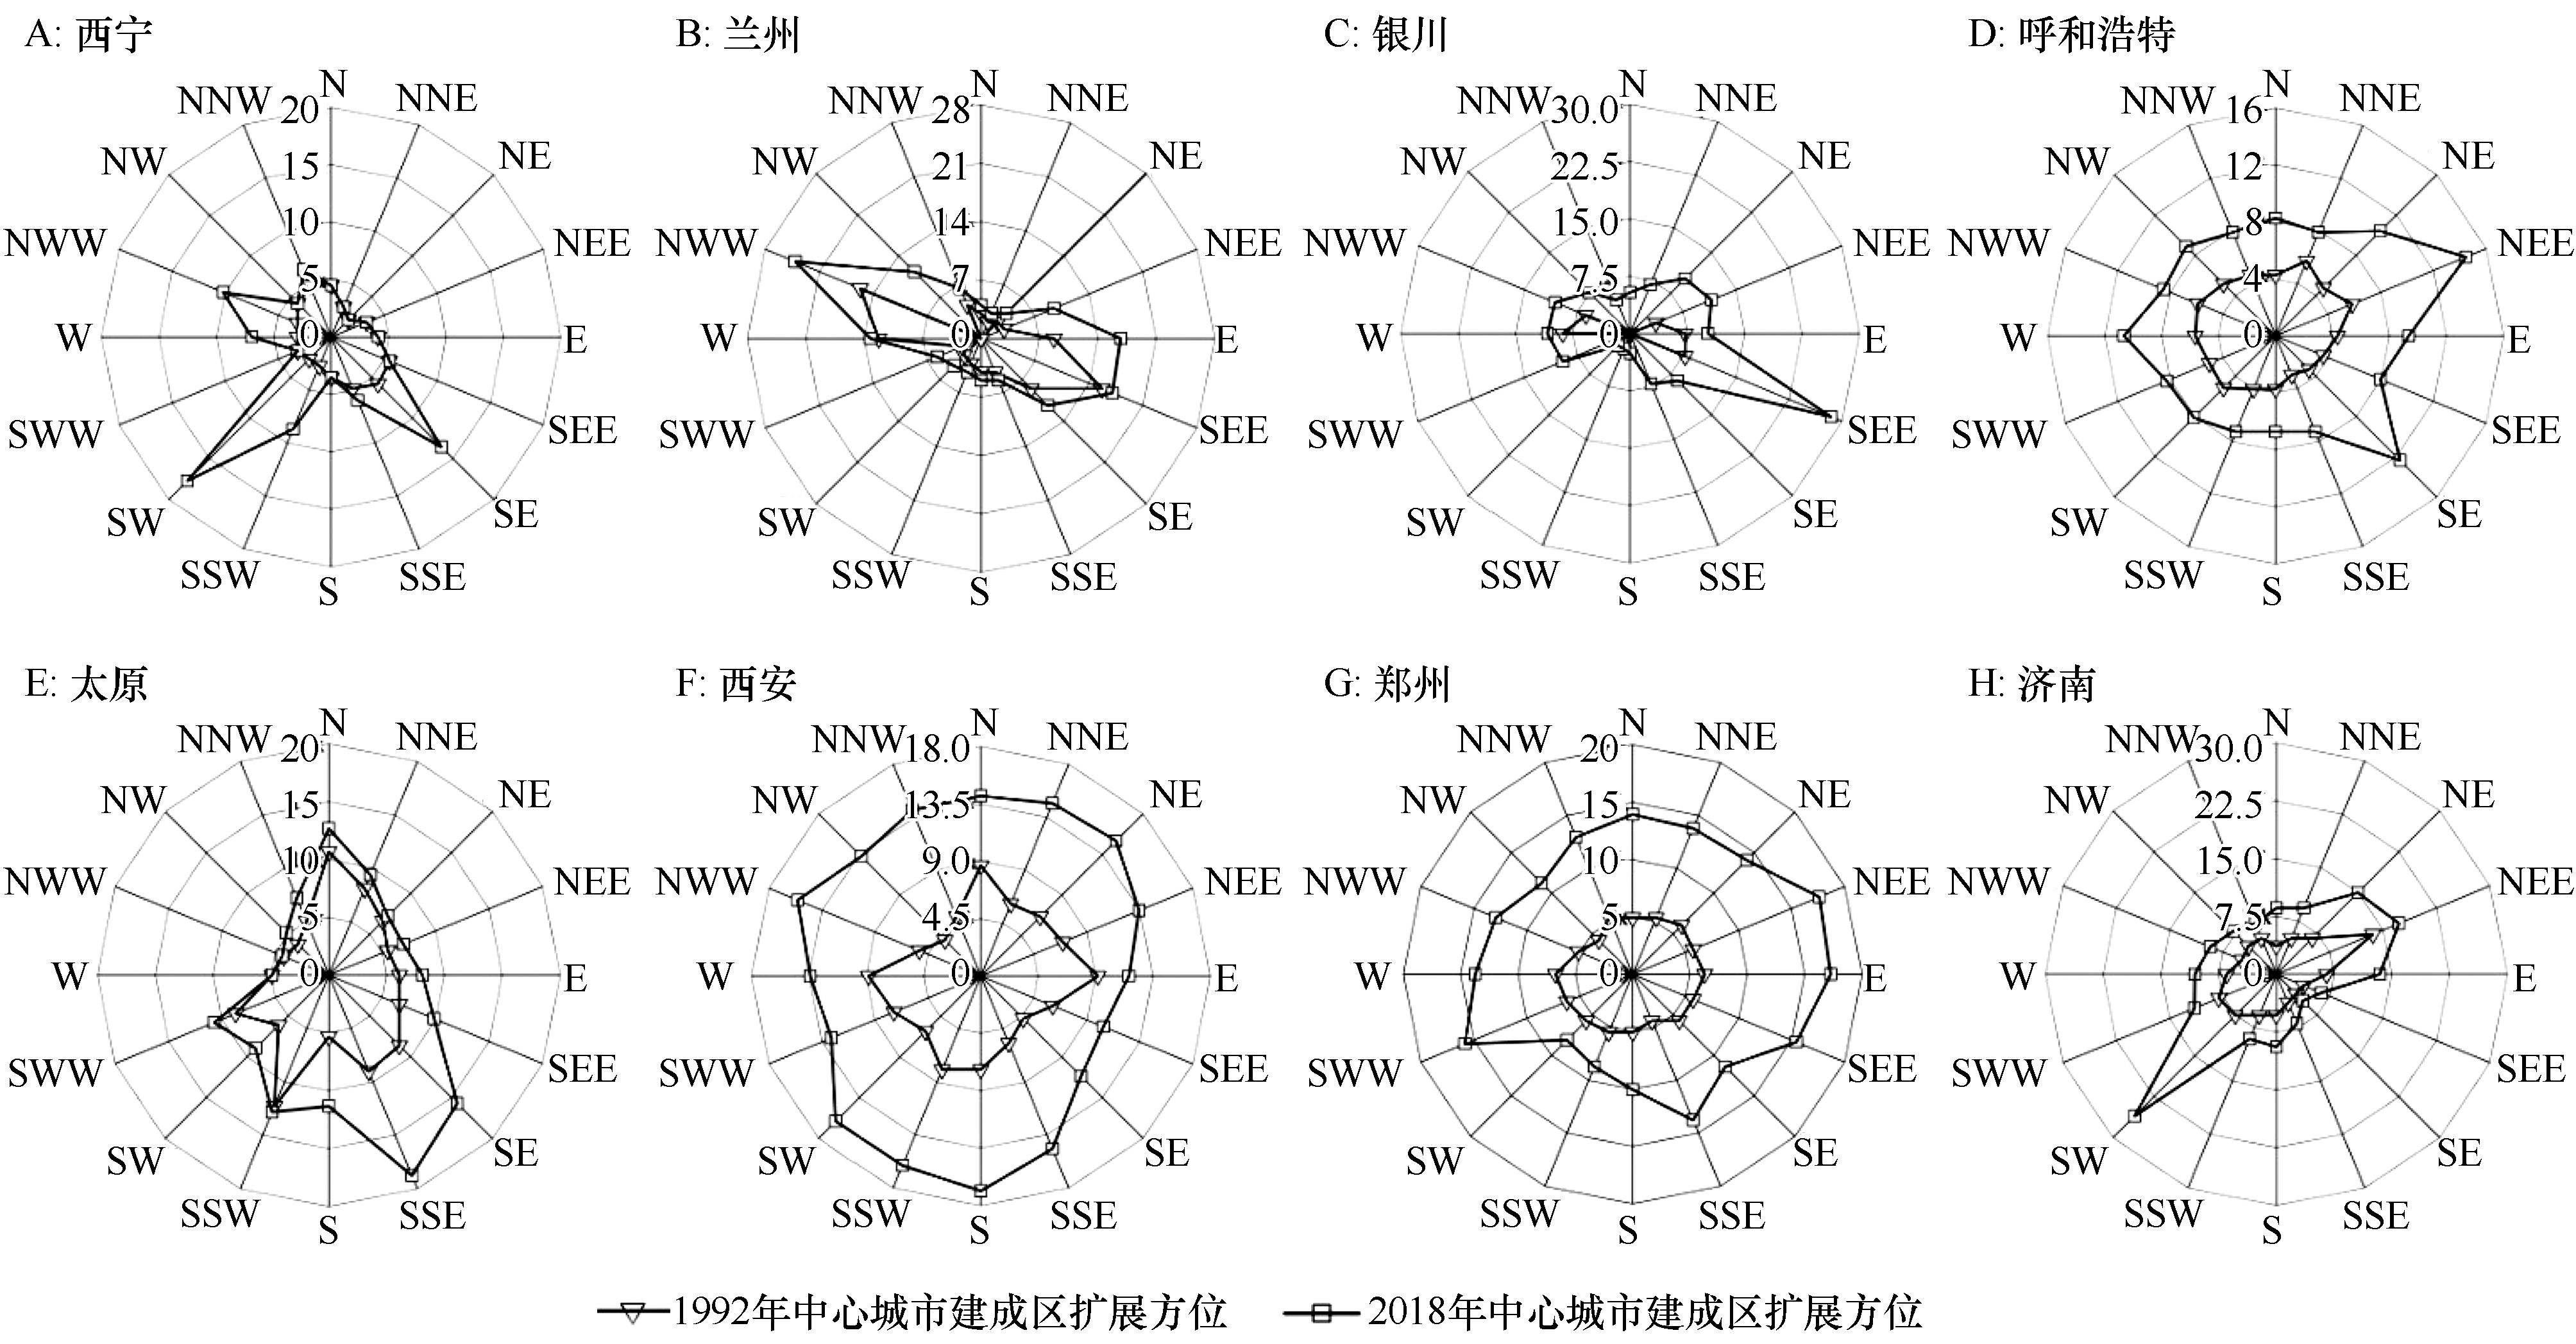
Fig.3 Azimuth diagrams of land expansion in central cities from 1992 to 2018
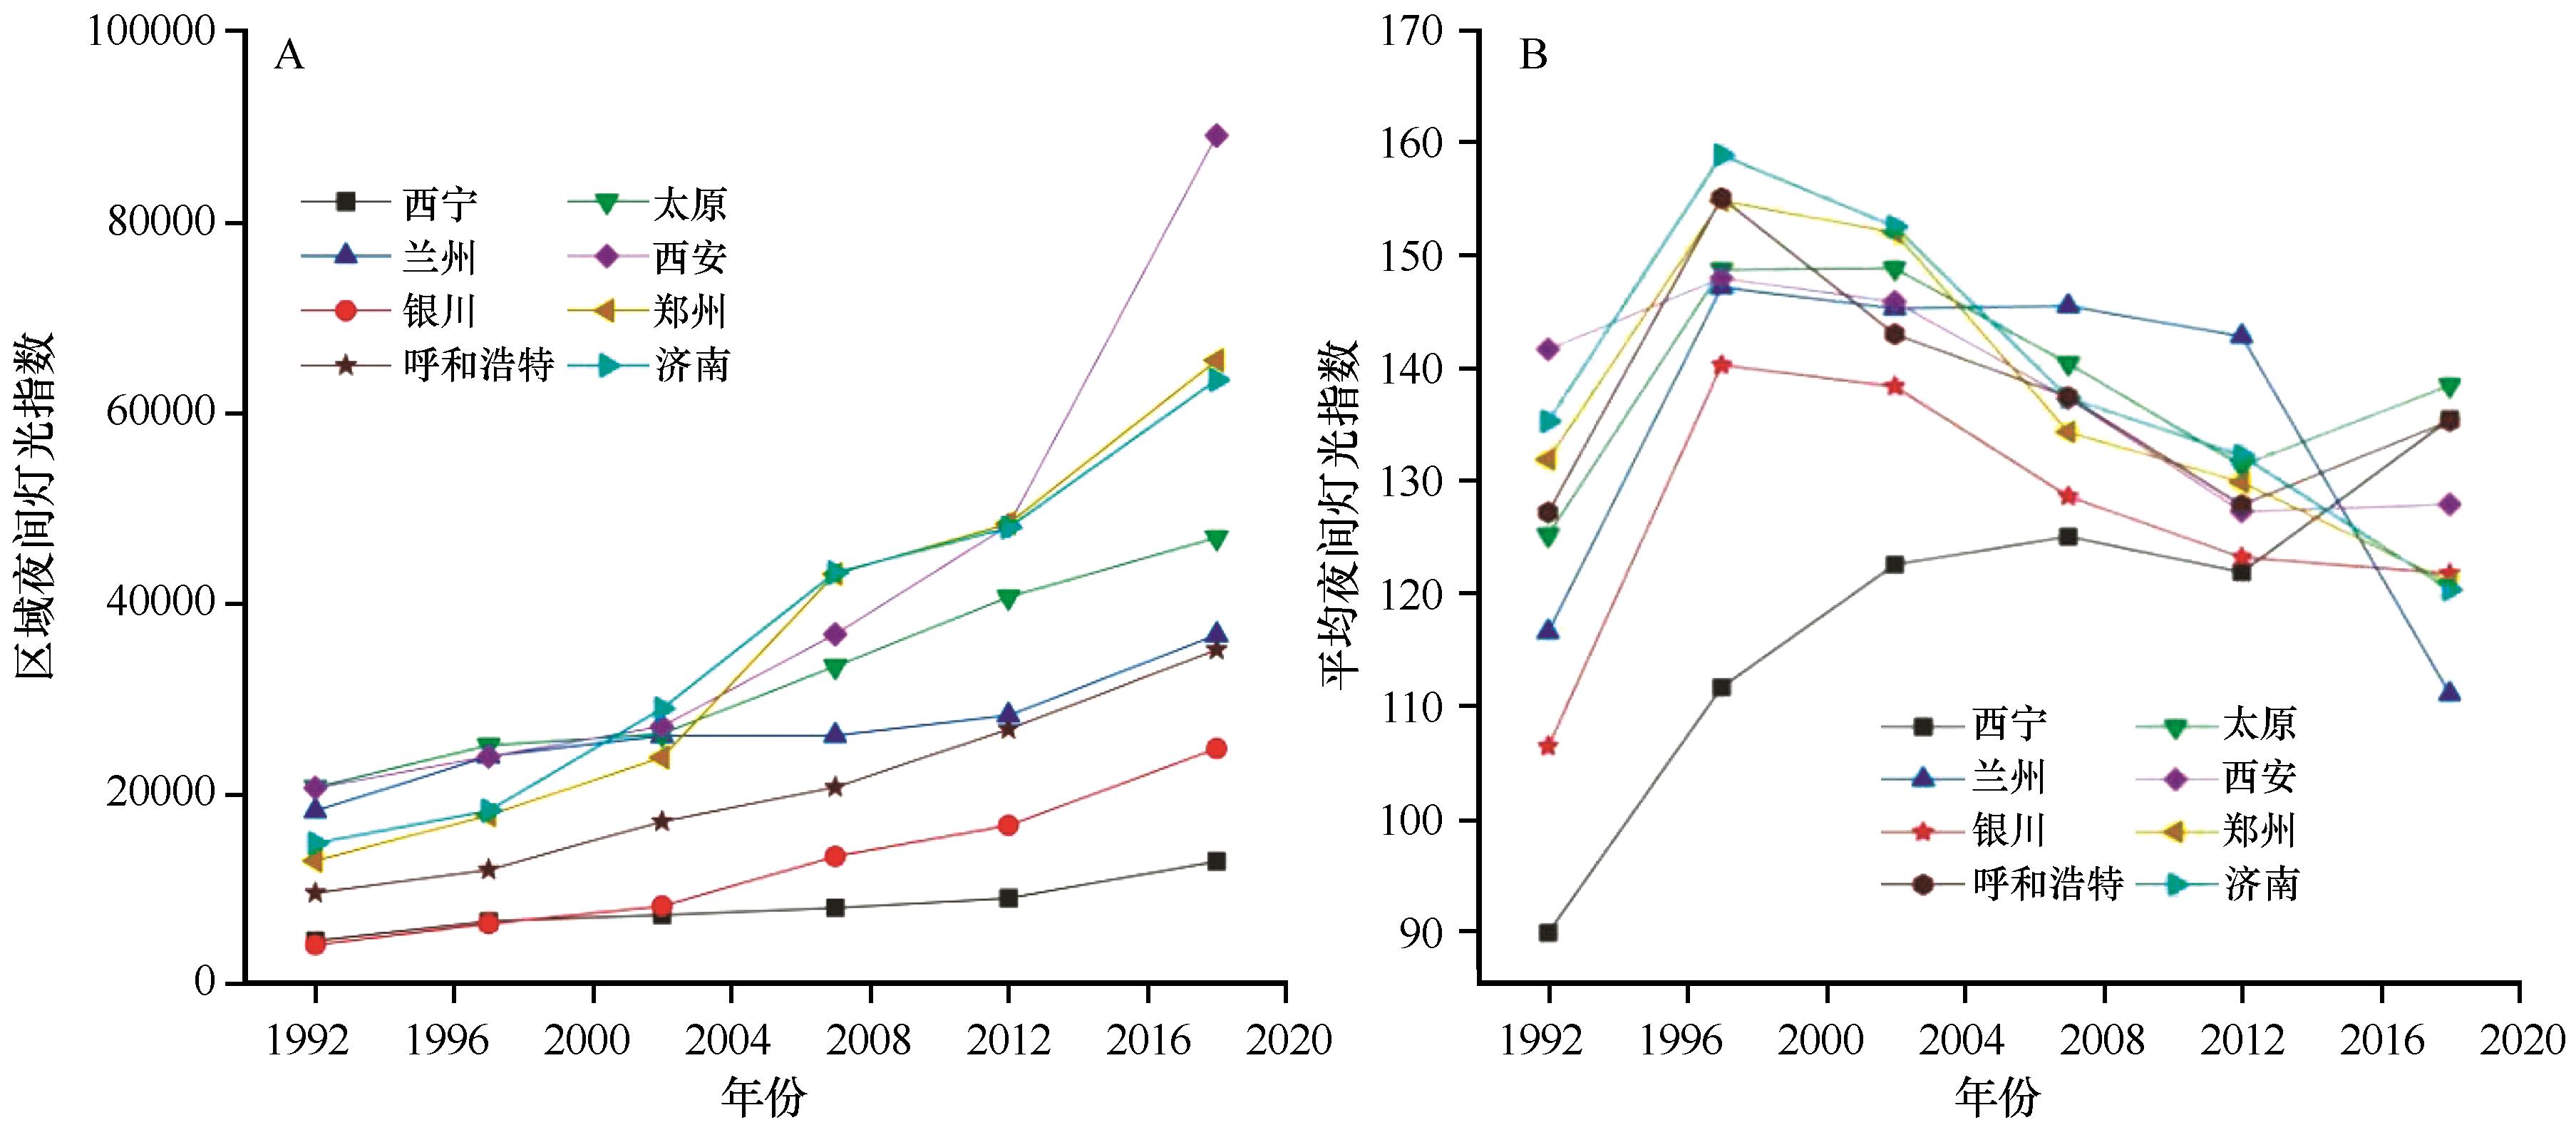
Fig.4 Total night-time light index and average night-time light index in central cities from 1992 to 2018
| 城市 | Rp | Re | ||||||||
|---|---|---|---|---|---|---|---|---|---|---|
| 1992— 1997年 | 1997— 2002年 | 2002— 2007年 | 2007— 2012年 | 2012— 2018年 | 1992— 1997年 | 1997— 2002年 | 2002— 2007年 | 2007— 2012年 | 2012— 2018年 | |
| 西宁 | 0.90 | 1.68 | 0.85 | 0.95 | 0.88 | 4.18 | 36.51 | 17.88 | 7.17 | 2.28 |
| 兰州 | 1.11 | 1.01 | 1.07 | 1.16 | 0.61 | / | 5.20 | 40.08 | 9.58 | 1.01 |
| 银川 | 1.04 | 0.93 | 0.70 | 1.22 | 0.73 | 11.94 | 1.74 | 2.03 | 4.25 | 1.40 |
| 呼和浩特 | 1.05 | 0.72 | 0.84 | 0.76 | 0.91 | 22.44 | 2.32 | 5.86 | 2.55 | 1.29 |
| 太原 | 1.11 | 1.05 | 0.84 | 0.96 | 0.95 | / | 7.21 | 4.10 | 2.51 | 6.01 |
| 西安 | 1.21 | 1.15 | 0.77 | 0.85 | 0.64 | 13.13 | 4.23 | 1.63 | 3.23 | 1.27 |
| 郑州 | 0.98 | 0.88 | 0.55 | 1.42 | 0.81 | 10.78 | 1.95 | 1.18 | 7.33 | 2.08 |
| 济南 | 1.03 | 0.78 | 0.65 | 1.00 | 0.95 | 31.64 | 1.34 | 1.50 | 4.59 | 1.94 |
| 全国 | 0.53 | 1.10 | 0.83 | 0.84 | 0.95 | 3.13 | 0.84 | 3.05 | 3.07 | 2.11 |
Table 4 Coordinated development coefficient of urban land use, population growth and economic growth in central cities from 1992 to 2018
| 城市 | Rp | Re | ||||||||
|---|---|---|---|---|---|---|---|---|---|---|
| 1992— 1997年 | 1997— 2002年 | 2002— 2007年 | 2007— 2012年 | 2012— 2018年 | 1992— 1997年 | 1997— 2002年 | 2002— 2007年 | 2007— 2012年 | 2012— 2018年 | |
| 西宁 | 0.90 | 1.68 | 0.85 | 0.95 | 0.88 | 4.18 | 36.51 | 17.88 | 7.17 | 2.28 |
| 兰州 | 1.11 | 1.01 | 1.07 | 1.16 | 0.61 | / | 5.20 | 40.08 | 9.58 | 1.01 |
| 银川 | 1.04 | 0.93 | 0.70 | 1.22 | 0.73 | 11.94 | 1.74 | 2.03 | 4.25 | 1.40 |
| 呼和浩特 | 1.05 | 0.72 | 0.84 | 0.76 | 0.91 | 22.44 | 2.32 | 5.86 | 2.55 | 1.29 |
| 太原 | 1.11 | 1.05 | 0.84 | 0.96 | 0.95 | / | 7.21 | 4.10 | 2.51 | 6.01 |
| 西安 | 1.21 | 1.15 | 0.77 | 0.85 | 0.64 | 13.13 | 4.23 | 1.63 | 3.23 | 1.27 |
| 郑州 | 0.98 | 0.88 | 0.55 | 1.42 | 0.81 | 10.78 | 1.95 | 1.18 | 7.33 | 2.08 |
| 济南 | 1.03 | 0.78 | 0.65 | 1.00 | 0.95 | 31.64 | 1.34 | 1.50 | 4.59 | 1.94 |
| 全国 | 0.53 | 1.10 | 0.83 | 0.84 | 0.95 | 3.13 | 0.84 | 3.05 | 3.07 | 2.11 |
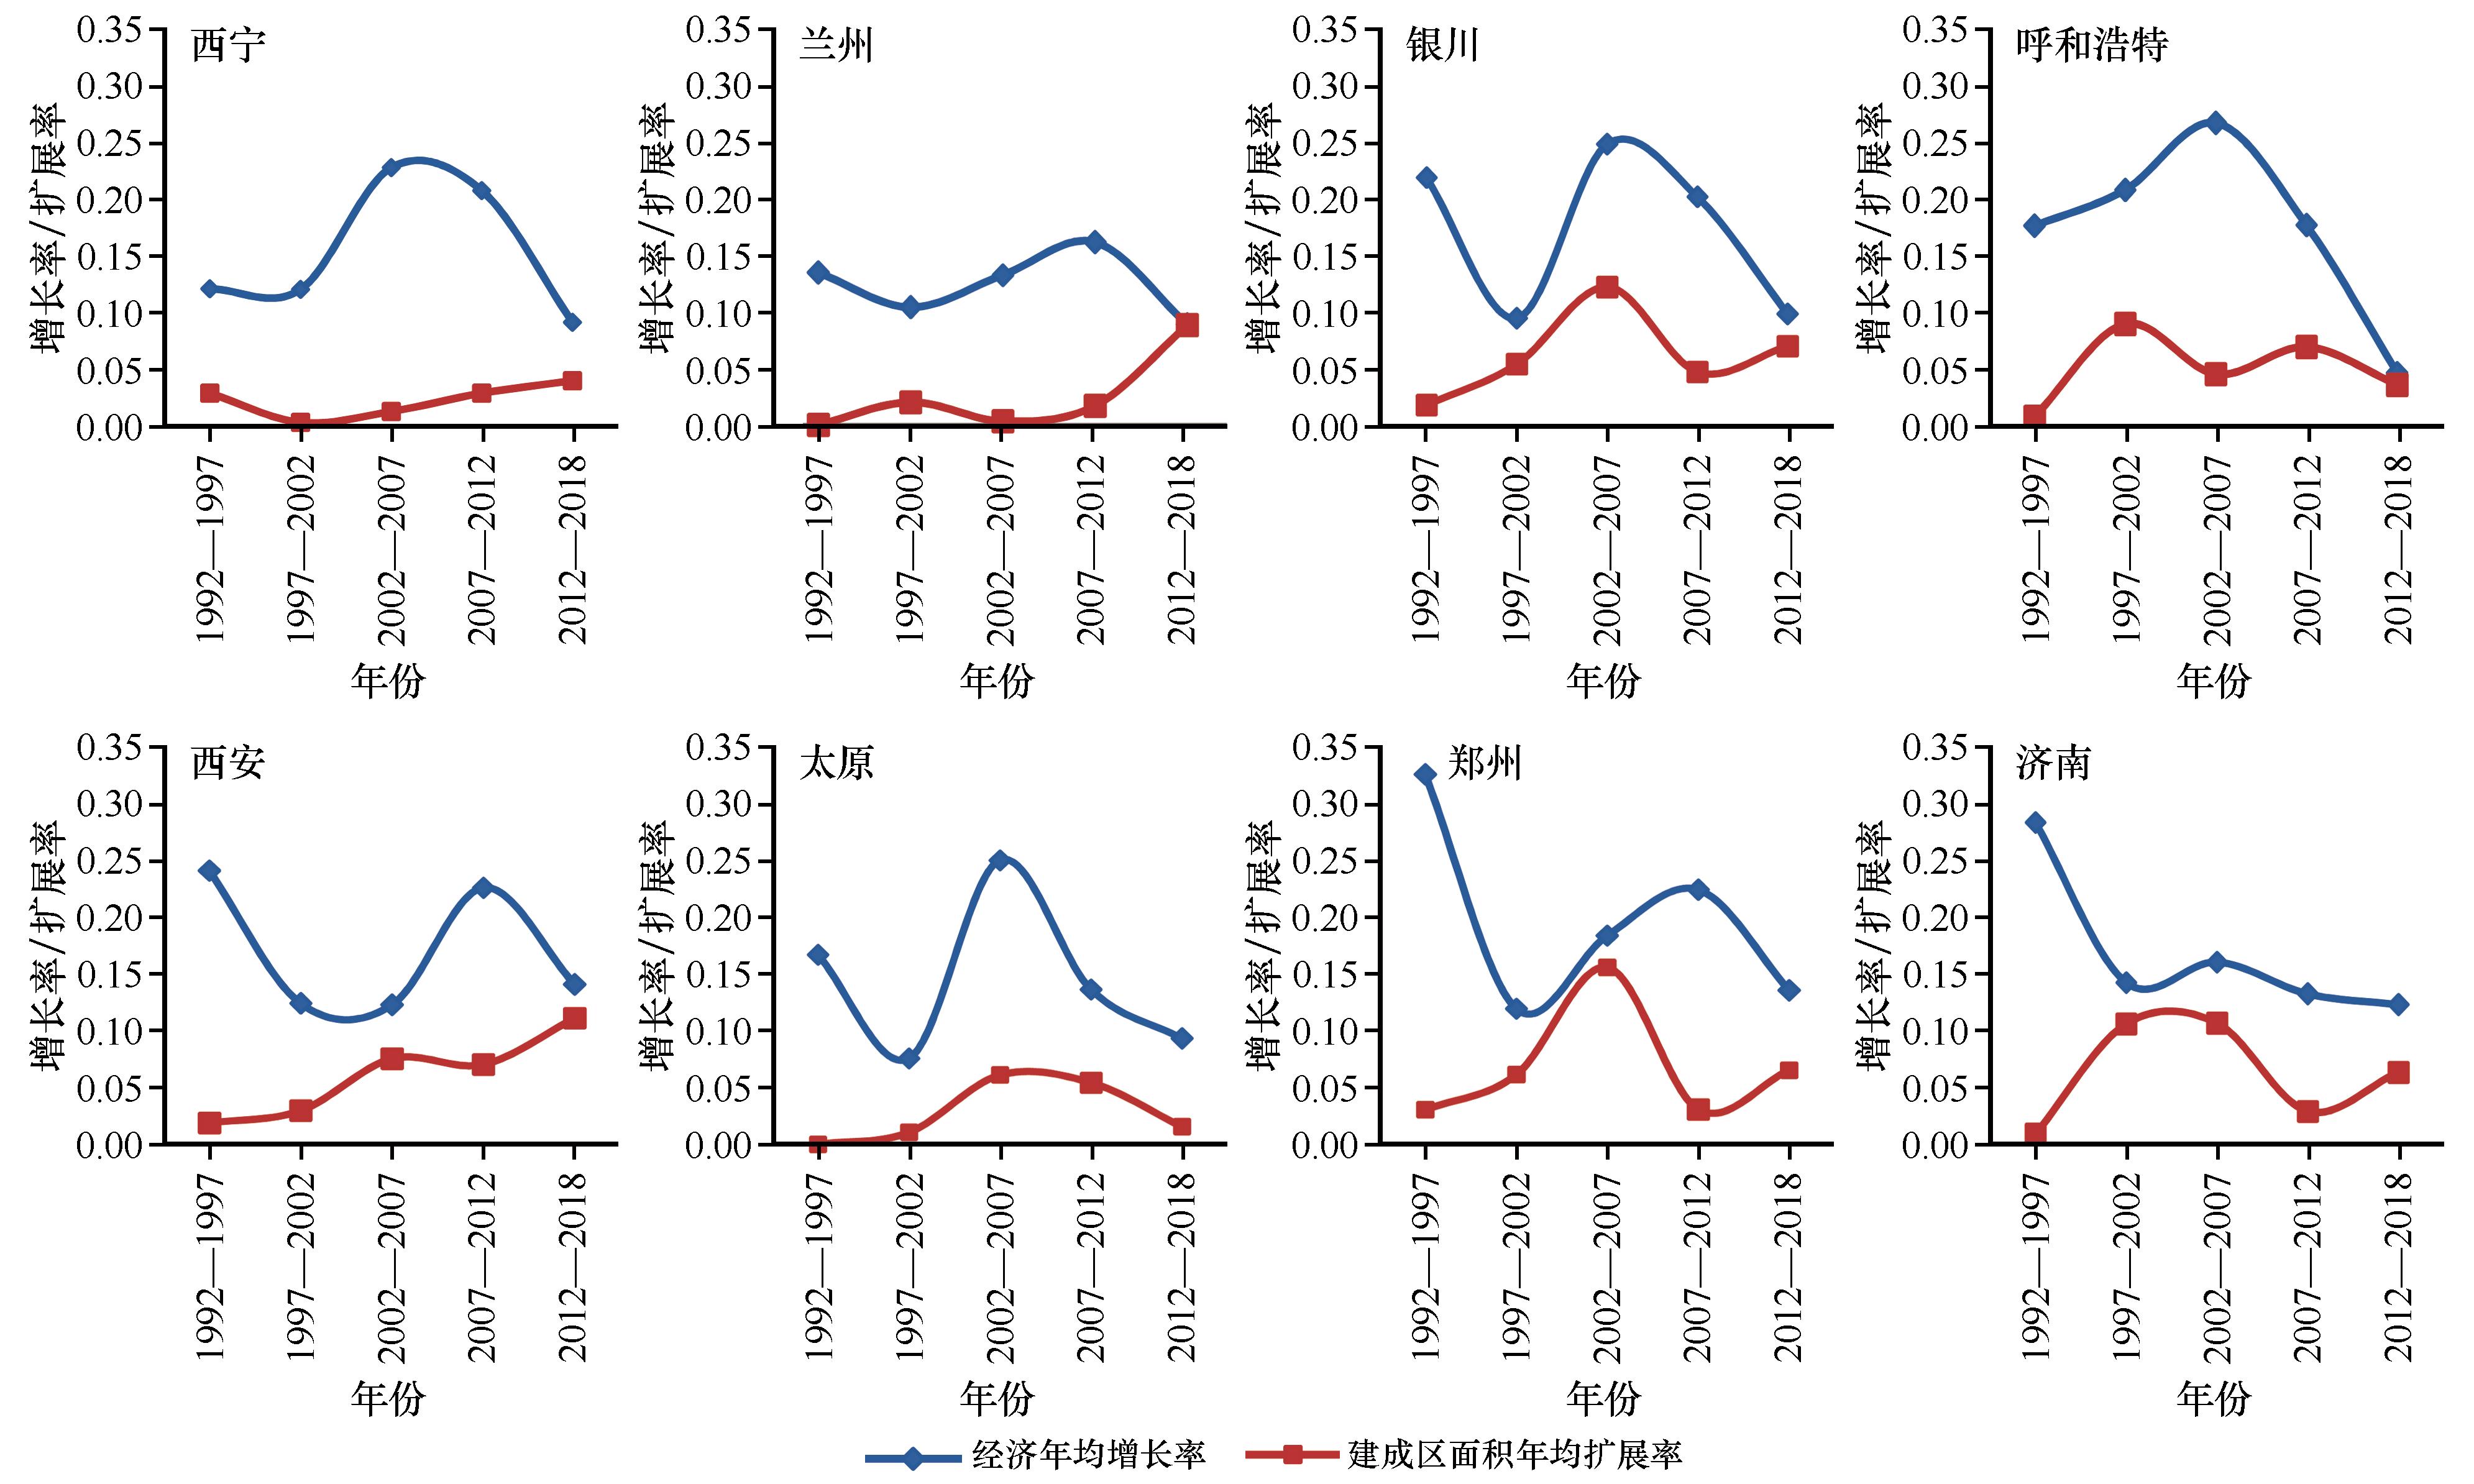
Fig.5 Average annual growth rate of economy and built-up area of central cities from 1992 to 2018
| 城市 | 时段 | X1 | X2 | X3 | X4 | X5 | 城市 | 时段 | X1 | X2 | X3 | X4 | X5 |
|---|---|---|---|---|---|---|---|---|---|---|---|---|---|
| 中心 城市 整体 | 1996—2018年 | 0.70 | 0.44 | 0.37 | 0.38 | 0.40 | 呼和 浩特 | 2002—2012年 | 0.58 | 0.15 | 0.12 | 0.23 | 0.02 |
| 1996—2002年 | 0.70 | 0.46 | 0.23 | 0.27 | 0.26 | 2012—2018年 | 0.54 | 0.24 | 0.33 | 0.15 | 0.27 | ||
| 2002—2012年 | 0.65 | 0.56 | 0.56 | 0.46 | 0.54 | 太原 | 1996—2018年 | 0.47 | 0.31 | 0.32 | 0.16 | 0.03 | |
| 2012—2018年 | 0.60 | 0.60 | 0.54 | 0.60 | 0.30 | 1996—2002年 | 0.57 | 0.29 | 0.29 | 0.02 | 0.24 | ||
| 西宁 | 1996—2018年 | 0.34 | 0.29 | 0.15 | 0.01 | 0.34 | 2002—2012年 | 0.66 | 0.44 | 0.44 | 0.27 | 0.07 | |
| 1996—2002年 | 0.54 | 0.29 | 0.32 | 0.37 | 0.30 | 2012—2018年 | 0.61 | 0.57 | 0.55 | 0.59 | 0.11 | ||
| 2002—2012年 | 0.66 | 0.23 | 0.43 | 0.26 | 0.29 | 西安 | 1996—2018年 | 0.43 | 0.16 | 0.43 | 0.26 | 0.31 | |
| 2012—2018年 | 0.24 | 0.27 | 0.36 | 0.28 | 0.41 | 1996—2002年 | 0.58 | 0.37 | 0.29 | 0.20 | 0.25 | ||
| 兰州 | 1996—2018年 | 0.37 | 0.07 | 0.03 | 0.02 | 0.24 | 2002—2012年 | 0.39 | 0.51 | 0.58 | 0.25 | 0.32 | |
| 1996—2002年 | 0.56 | 0.06 | 0.12 | 0.27 | 0.11 | 2012—2018年 | 0.81 | 0.61 | 0.26 | 0.29 | 0.34 | ||
| 2002—2012年 | 0.21 | 0.11 | 0.16 | 0.01 | 0.22 | 郑州 | 1996—2018年 | 0.60 | 0.01 | 0.17 | 0.03 | 0.34 | |
| 2012—2018年 | 0.63 | 0.45 | 0.21 | 0.25 | 0.31 | 1996—2002年 | 0.62 | 0.37 | 0.22 | 0.34 | 0.59 | ||
| 银川 | 1996—2018年 | 0.56 | 0.37 | 0.44 | 0.20 | 0.54 | 2002—2012年 | 0.54 | 0.52 | 0.33 | 0.37 | 0.36 | |
| 1996—2002年 | 0.62 | 0.46 | 0.37 | 0.29 | 0.42 | 2012—2018年 | 0.78 | 0.27 | 0.38 | 0.04 | 0.35 | ||
| 2002—2012年 | 0.53 | 0.44 | 0.40 | 0.26 | 0.53 | 济南 | 1996—2018年 | 0.64 | 0.36 | 0.41 | 0.25 | 0.07 | |
| 2012—2018年 | 0.66 | 0.39 | 0.38 | 0.14 | 0.64 | 1996—2002年 | 0.66 | 0.41 | 0.34 | 0.46 | 0.35 | ||
| 呼和 浩特 | 1996—2018年 | 0.20 | 0.23 | 0.17 | 0.00 | 0.59 | 2002—2012年 | 0.66 | 0.43 | 0.37 | 0.28 | 0.02 | |
| 1996—2002年 | 0.60 | 0.31 | 0.29 | 0.32 | 0.32 | 2012—2018年 | 0.73 | 0.51 | 0.36 | 0.03 | 0.49 | ||
Table 5 Grey relational coefficient matrix between built-up area and dynamic factors of central cities from 1996 to 2018
| 城市 | 时段 | X1 | X2 | X3 | X4 | X5 | 城市 | 时段 | X1 | X2 | X3 | X4 | X5 |
|---|---|---|---|---|---|---|---|---|---|---|---|---|---|
| 中心 城市 整体 | 1996—2018年 | 0.70 | 0.44 | 0.37 | 0.38 | 0.40 | 呼和 浩特 | 2002—2012年 | 0.58 | 0.15 | 0.12 | 0.23 | 0.02 |
| 1996—2002年 | 0.70 | 0.46 | 0.23 | 0.27 | 0.26 | 2012—2018年 | 0.54 | 0.24 | 0.33 | 0.15 | 0.27 | ||
| 2002—2012年 | 0.65 | 0.56 | 0.56 | 0.46 | 0.54 | 太原 | 1996—2018年 | 0.47 | 0.31 | 0.32 | 0.16 | 0.03 | |
| 2012—2018年 | 0.60 | 0.60 | 0.54 | 0.60 | 0.30 | 1996—2002年 | 0.57 | 0.29 | 0.29 | 0.02 | 0.24 | ||
| 西宁 | 1996—2018年 | 0.34 | 0.29 | 0.15 | 0.01 | 0.34 | 2002—2012年 | 0.66 | 0.44 | 0.44 | 0.27 | 0.07 | |
| 1996—2002年 | 0.54 | 0.29 | 0.32 | 0.37 | 0.30 | 2012—2018年 | 0.61 | 0.57 | 0.55 | 0.59 | 0.11 | ||
| 2002—2012年 | 0.66 | 0.23 | 0.43 | 0.26 | 0.29 | 西安 | 1996—2018年 | 0.43 | 0.16 | 0.43 | 0.26 | 0.31 | |
| 2012—2018年 | 0.24 | 0.27 | 0.36 | 0.28 | 0.41 | 1996—2002年 | 0.58 | 0.37 | 0.29 | 0.20 | 0.25 | ||
| 兰州 | 1996—2018年 | 0.37 | 0.07 | 0.03 | 0.02 | 0.24 | 2002—2012年 | 0.39 | 0.51 | 0.58 | 0.25 | 0.32 | |
| 1996—2002年 | 0.56 | 0.06 | 0.12 | 0.27 | 0.11 | 2012—2018年 | 0.81 | 0.61 | 0.26 | 0.29 | 0.34 | ||
| 2002—2012年 | 0.21 | 0.11 | 0.16 | 0.01 | 0.22 | 郑州 | 1996—2018年 | 0.60 | 0.01 | 0.17 | 0.03 | 0.34 | |
| 2012—2018年 | 0.63 | 0.45 | 0.21 | 0.25 | 0.31 | 1996—2002年 | 0.62 | 0.37 | 0.22 | 0.34 | 0.59 | ||
| 银川 | 1996—2018年 | 0.56 | 0.37 | 0.44 | 0.20 | 0.54 | 2002—2012年 | 0.54 | 0.52 | 0.33 | 0.37 | 0.36 | |
| 1996—2002年 | 0.62 | 0.46 | 0.37 | 0.29 | 0.42 | 2012—2018年 | 0.78 | 0.27 | 0.38 | 0.04 | 0.35 | ||
| 2002—2012年 | 0.53 | 0.44 | 0.40 | 0.26 | 0.53 | 济南 | 1996—2018年 | 0.64 | 0.36 | 0.41 | 0.25 | 0.07 | |
| 2012—2018年 | 0.66 | 0.39 | 0.38 | 0.14 | 0.64 | 1996—2002年 | 0.66 | 0.41 | 0.34 | 0.46 | 0.35 | ||
| 呼和 浩特 | 1996—2018年 | 0.20 | 0.23 | 0.17 | 0.00 | 0.59 | 2002—2012年 | 0.66 | 0.43 | 0.37 | 0.28 | 0.02 | |
| 1996—2002年 | 0.60 | 0.31 | 0.29 | 0.32 | 0.32 | 2012—2018年 | 0.73 | 0.51 | 0.36 | 0.03 | 0.49 | ||
| 1 | Schneider A,Woodcock C E.Compact,dispersed,fragmented,extensive?A comparison of urban growth in twenty-five global cities using remotely sensed data,pattern metrics and census information[J].Urban Studies,2008,45(3):659-692. |
| 2 | 谭雪兰,欧阳巧玲,江喆,等.基于RS/GIS的长沙市城市空间扩展及影响因素[J].经济地理,2017,37(3):81-85. |
| 3 | 朱建华,戚伟,修春亮.中国城市市辖区的空间结构及演化机制[J].地理研究,2019,38(5):1003-1015. |
| 4 | 熊皓,郑伯红,贾磊.驱动力与制约力相互作用下我国城市空间扩张[J].经济地理,2016,36(1):82-88. |
| 5 | 吴一凡,刘彦随,李裕瑞.中国人口与土地城镇化时空耦合特征及驱动机制[J].地理学报,2018,73(10):1865-1879. |
| 6 | 龙瀛,韩昊英,毛其智.利用约束性 CA 制定城市增长边界[J].地理学报,2009,64(8):999-1008. |
| 7 | 高晓路,吴丹贤,周侃,等.国土空间规划中城镇空间和城镇开发边界的划定[J].地理研究,2019,38(10):2458-2472. |
| 8 | 张翰超,宁晓刚,王浩,等.基于高分辨率遥感影像的2000-2015年中国省会城市高精度扩张监测与分析[J].地理学报,2018,73(12):2345-2363. |
| 9 | 董鹤松,李仁杰,李建明,等.基于DMSP-OLS与NPP-VIIRS整合数据的中国三大城市群城市空间扩展时空格局[J].地球信息科学学报,2020,22(5):1161-1174. |
| 10 | 欧阳晓,朱翔.中国城市群城市用地扩张时空动态特征[J].地理学报,2020,75(3):571-588. |
| 11 | 王春杨,吴国誉,张超.基于DMSP/OLS夜间灯光数据的成渝城市群空间结构研究[J].城市发展研究,2015,22(11):20-24. |
| 12 | 黄先梅,赵建吉,孟庆岩,等.基于夜间灯光数据的快速城镇化地区城市扩展与重心演变分析:以河南省为例[J].世界地理研究,2019,28(1):79-89. |
| 13 | 李俊峰,潘竟虎.基于夜间灯光的1992-2012年甘肃省城市空间扩展研究[J].冰川冻土,2016,38(3):829-835. |
| 14 | 王成新,窦旺胜,程钰,等.快速城市化阶段济南城市空间扩展及驱动力研究[J].地理科学,2020,40(9):1513-1521. |
| 15 | 高宁,盖迎春,宋晓谕.基于夜间灯光数据的西安市城市扩张及驱动因素研究[J].遥感技术与应用,2019,34(1):207-215. |
| 16 | 邱从毫,李阳兵,冯元嵩.贵阳市城市土地扩展空间的生态适宜性与优化[J].应用生态学报,2015,26(9):2777-2784. |
| 17 | 陈明星,陆大道,张华.中国城市化水平的综合测度及其动力因子分析[J].地理学报,2009,64(4):387-398. |
| 18 | 王利伟,冯长春.转型期京津冀城市群空间扩展格局及其动力机制:基于夜间灯光数据方法[J].地理学报,2016,71(12):2155-2169. |
| 19 | 欧向军,甄峰,秦永东,等.区域城市化水平综合测度及其理想动力分析:以江苏省为例[J].地理研究,2008,27(5):993-1002. |
| 20 | 文雅,龚建周,胡银根,等.基于生态安全导向的城市空间扩展模拟与分析[J].地理研究,2017,36(3):518-528. |
| 21 | 詹云军,朱捷缘,严岩.基于元胞自动机的城市空间动态模拟[J].生态学报,2017,37(14):4864-4872. |
| 22 | 刘沁萍,杨永春,付冬暇,等.基于DMSP_OLS灯光数据的1992-2010年中国城市空间扩张研究[J].地理科学,2014,34(2):129-136. |
| 23 | 杨育丽,马明国,葛伟.夜间灯光影像探究北京市城市发展空间特征[J].遥感信息,2019,34(5):41-50. |
| 24 | 徐杰佳,臧淑英.哈尔滨城市扩展特征及驱动力分析[J].测绘通报,2019(9):68-72. |
| 25 | 安树伟,李瑞鹏.黄河流域高质量发展的内涵与推进方略[J].改革,2020(1):76-86. |
| 26 | 张国兴,苏钊贤.黄河流域中心城市高质量发展评价体系构建与测度[J].生态经济,2020,36(7):37-43. |
| 27 | 曹子阳,吴志峰,匡耀求,等.DMSP/OLS夜间灯光影像中国区域的校正及应用[J].地球信息科学学报,2015,17(9):1092-1102. |
| 28 | Wu R,Yang D,Dong J,et al.Regional inequality in China based on NPP-VIIRS night-time light imagery[J].Remote Sensing,2018,10(2):240. |
| 29 | 图尔荪阿依•如孜,阿里木江•卡斯木,高鹏文,等.基于DMSP/OLS和NPP/VIIRS数据的新疆城市扩展时空变化研究[J].中国农业大学学报,2020,25(9):156-165. |
| 30 | 梁丽,边金虎,李爱农,等.中巴经济走廊DMSP/OLS与NPP/VIIRS夜光数据辐射一致性校正[J].遥感学报,2020,24(2):149-160. |
| 31 | 杜海波,魏伟,张学渊,等.黄河流域能源消费碳排放时空格局演变及影响因素:基于DMSP/OLS与NPP/VIIRS夜间灯光数据[J].地理研究,2021,40(7):2051-2065. |
| 32 | 许雪爽,包安明,常存,等.新疆重点城市建设用地扩张与人地配置协调性分析[J].经济地理,2017,37(10):92-99. |
| 33 | 牟凤云,张增祥,迟耀斌,等.基于多源遥感数据的北京市1973-2005年间城市建成区的动态监测与驱动力分析[J].遥感学报,2007,11(2):257-268. |
| 34 | 王婷婷,王运动,杨强,等.1988年~2014年莆田市城市扩展及其驱动力分析[J].遥感信息,2015,30(6):111-115. |
| 35 | 刘思峰.灰色系统理论及其应用[M].北京:科学出版社,1999. |
| 36 | 曹明霞.灰色关联度模型正负性问题的研究及其改进[J].系统工程与电子技术,2008,30(6):1086-1088. |
| 37 | 赵鹏军,刘迪.中国小城镇基础设施与社会经济发展的关联分析[J].地理科学进展,2018,37(9):1245-1256. |
| 38 | 杨保军.城市规划30年回顾与展望[J].城市规划学刊,2010(1):14-23. |
| 39 | 耿甜伟,毛雅倩,李九全,等.西安城市扩展时空特征及驱动机制[J].经济地理,2019,39(10):62-70. |
| 40 | 杨荣南,张雪莲.城市空间扩展的模式与动力机制研究[J].地域研究与开发,1997,16(2):1-6. |
| 41 | Lo C P.Modeling the population of China using DMSP operational line scan system nighttime data[J].Photogrammetric Engineering & Remote Sensing,2001,67(9):1037-1048. |
| 42 | Doll C N,Muller J P,Morley J G.Mapping regional economic activity from night-time light satellite imagery[J].Ecological Economics,2006,57(1):75-92. |
| 43 | 吴文恒,黄坤,丁竹慧,等.西安市企业社区分布格局与形成机制[J].地理研究,2019,38(12):3038-3054. |
| 44 | 吴文恒,等.企业社区空间再生产研究[M].北京:科学出版社,2020. |
| 45 | 杨永春.中国西部河谷型城市的形成与发展[J].经济地理,1999,19(2):45-50. |
| [1] | Cheng Zhou, Binghua Liu, Xuhong Zhang, Juan Tian, Lin Zhou. Spatial distribution characteristics and influencing factors of heritage conservation units in the Yellow River Basin [J]. Journal of Desert Research, 2021, 41(6): 10-20. |
| [2] | Zhiwei Ding, Rui Zhao, Zihan Jian, Yiwei Meng, Gaisu Zhang. Economics spatial pattern and its influencing factors of Yellow River Basin at town scale from the perspective of urban-rural integration [J]. Journal of Desert Research, 2021, 41(6): 195-204. |
| [3] | Juan Wang, Huijuan He, Jinfang Dong, Bin Guo. Spatio-temporal distribution of vegetation net primary productivity in the Yellow River Basin in 2000-2019 and its natural driving factors [J]. Journal of Desert Research, 2021, 41(6): 213-222. |
| [4] | Pan Yang, Wei Liang, Jianwu Yan, Siya Li, Zhiyang Lan. Multi-scale analysis of water system structure changes in the Yellow River Basin [J]. Journal of Desert Research, 2021, 41(6): 223-234. |
| [5] | Cheng Zhou, Xuhong Zhang, Qian Zhang, Binghua Liu. The construction of "Five in One" comprehensive evaluation system and spatial difference in the Yellow River Basin [J]. Journal of Desert Research, 2021, 41(4): 1-11. |
| [6] | Jie Yang, Baopeng Xie, Degang Zhang. Spatial-temporal evolution of habitat quality and its influencing factors in the Yellow River Basin based on InVEST model and GeoDetector [J]. Journal of Desert Research, 2021, 41(4): 12-22. |
| [7] | Man Sun, Tao Song. Spatio-temporal patterns and coordinated development of technological innovation and industrial development in the Yellow River Basin of Gansu Province, China [J]. Journal of Desert Research, 2021, 41(4): 140-151. |
| [8] | Mengtao Han, Jianjun Tu, Guiping Xu, Li Jiang. Spatio-temporal coordination between aquatic ecosystem services and economic development in the Yellow River Basin [J]. Journal of Desert Research, 2021, 41(4): 167-176. |
| [9] | Guangqin Li, Xubing Fang. Spatio-temporal evolution characteristics of green development level in the Yellow River Basin [J]. Journal of Desert Research, 2021, 41(4): 129-139. |
| [10] | Gaopeng Sun, Xianfeng Liu, Xiaohong Wang, Shuangshuang Li. Changes in vegetation coverage and its influencing factors across the Yellow River Basin during 2001-2020 [J]. Journal of Desert Research, 2021, 41(4): 205-212. |
| [11] | Youheng Wang, Dan Tan, Lanying Han, Danhua Li, xin Wang, Guoyang Lu, Jingjing Lin. Review of climate change in the Yellow River Basin [J]. Journal of Desert Research, 2021, 41(4): 235-246. |
| [12] | Zhou Dan, Zhang Bo, An Meiling, Zhang Yaozong, Luo Jing. Responses of Drought with Different Time Scalese to the ENSO Events in the Yellow River Basin [J]. JOURNAL OF DESERT RESEARCH, 2015, 35(3): 753-762. |
| [13] | Zhang Yaling, Su Huimin, Zhang Xiaoyong. The Spatial-temporal Changes of Vegetation Restoration in the Yellow River Basin From 1998 to 2012 [J]. JOURNAL OF DESERT RESEARCH, 2014, 34(2): 597-602. |
| [14] | LAN Yong-chao;LIN Shu;LI Zhou-ying;LIU Jin-qi;MA Jian-hua. Study on Variations of Water Cycle Factors in Upper Yellow River Basin during Recent 50 Years [J]. JOURNAL OF DESERT RESEARCH, 2006, 26(5): 849-854. |
| Viewed | ||||||
|
Full text |
|
|||||
|
Abstract |
|
|||||
©2018Journal of Desert Research
Tel:0931-8267545
Email:caiedit@lzb.ac.cn;desert@lzb.ac.cn
Support:Magtech