中国沙漠 ›› 2024, Vol. 44 ›› Issue (3): 158-171.DOI: 10.7522/j.issn.1000-694X.2023.00128
• • 上一篇
陈俊言( ), 贯雅雯, 张越, 陈渔, 毕鸿儒, 娄高僮, 郭馨阳, 王洋, 陈思宇()
收稿日期:2023-06-11
修回日期:2023-12-29
出版日期:2024-05-20
发布日期:2024-06-11
通讯作者:
陈思宇
作者简介:陈思宇(E-mail: chensiyu@lzu.edu.cn)基金资助:
Junyan Chen(), Yawen Guan, Yue Zhang, Yu Chen, Hongru Bi, Gaotong Lou, Xinyang Guo, Yang Wang, Siyu Chen()
Received:2023-06-11
Revised:2023-12-29
Online:2024-05-20
Published:2024-06-11
Contact:
Siyu Chen
摘要:
戈壁沙漠是沙尘天气频发区域,也是东亚沙尘暴的关键源地。青藏高原毗邻东亚和南亚两大沙源区,是全球气候变化的敏感地区。然而戈壁沙漠沙尘向青藏高原传输路径以及传输机制尚不清晰。基于区域空气质量模式WRF-Chem、FNL再分析资料并结合HYSPLIT后向轨迹模型,以2020年4月戈壁沙漠一次强沙尘事件为例,探讨了戈壁沙漠沙尘向青藏高原传输路径以及传输机制。结果表明:在此次沙尘事件期间,青藏高原东坡和北坡是戈壁沙漠沙尘传输至青藏高原的重要通道。受环流形势和高大地形的影响,青藏高原北坡沙尘传输效率大于东坡,而东坡沙尘垂直运动较北坡旺盛。500 hPa乌拉尔山以东的气旋系统和蒙古气旋共同控制中高纬度带,影响沙尘输送过程。随着中高纬气旋系统的东移,500 hPa新疆脊被破坏,青藏高原上空短波槽开始建立。短波槽前低层辐合的环流场有利于700 hPa闭合低压的维持,促使青藏高原北坡的偏北大风产生,有利于北坡沙尘向青藏高原输送。200 hPa高空急流动量下传引起河西走廊近地东风盛行,有利于戈壁沙漠沙尘从东坡向青藏高原输送。此环流形势构成了戈壁沙漠沙尘向青藏高原传输的有利风场。该研究成果进一步完善了戈壁沙漠沙尘的传输路径,为研究沙尘影响青藏高原及其周边地区的天气气候变化提供了科学支撑。
中图分类号:
陈俊言, 贯雅雯, 张越, 陈渔, 毕鸿儒, 娄高僮, 郭馨阳, 王洋, 陈思宇. 戈壁沙漠沙尘向青藏高原传输路径和传输机制:以2020年4月一次沙尘事件为例[J]. 中国沙漠, 2024, 44(3): 158-171.
Junyan Chen, Yawen Guan, Yue Zhang, Yu Chen, Hongru Bi, Gaotong Lou, Xinyang Guo, Yang Wang, Siyu Chen. Transport of dust from Gobi Desert to the Tibetan Plateau and its dynamic mechanism: a case study of a dust event in April of 2020[J]. Journal of Desert Research, 2024, 44(3): 158-171.
| 大气过程 | 具体过程 | 参考文献来源 |
|---|---|---|
| 物理过程 | 陆面过程 | Chen等[ |
| 边界层 | Hong等[ | |
| 积云对流 | Grell等[ | |
| 云微物理 | Thompson等[ | |
| 长/短波辐射 | Iacono等[ | |
| 起沙过程 | Ginoux等[ | |
| 化学过程 | 气溶胶化学 | Ginoux等[ |
表1 参数化方案设置
Table 1 Parametric scheme settings
| 大气过程 | 具体过程 | 参考文献来源 |
|---|---|---|
| 物理过程 | 陆面过程 | Chen等[ |
| 边界层 | Hong等[ | |
| 积云对流 | Grell等[ | |
| 云微物理 | Thompson等[ | |
| 长/短波辐射 | Iacono等[ | |
| 起沙过程 | Ginoux等[ | |
| 化学过程 | 气溶胶化学 | Ginoux等[ |
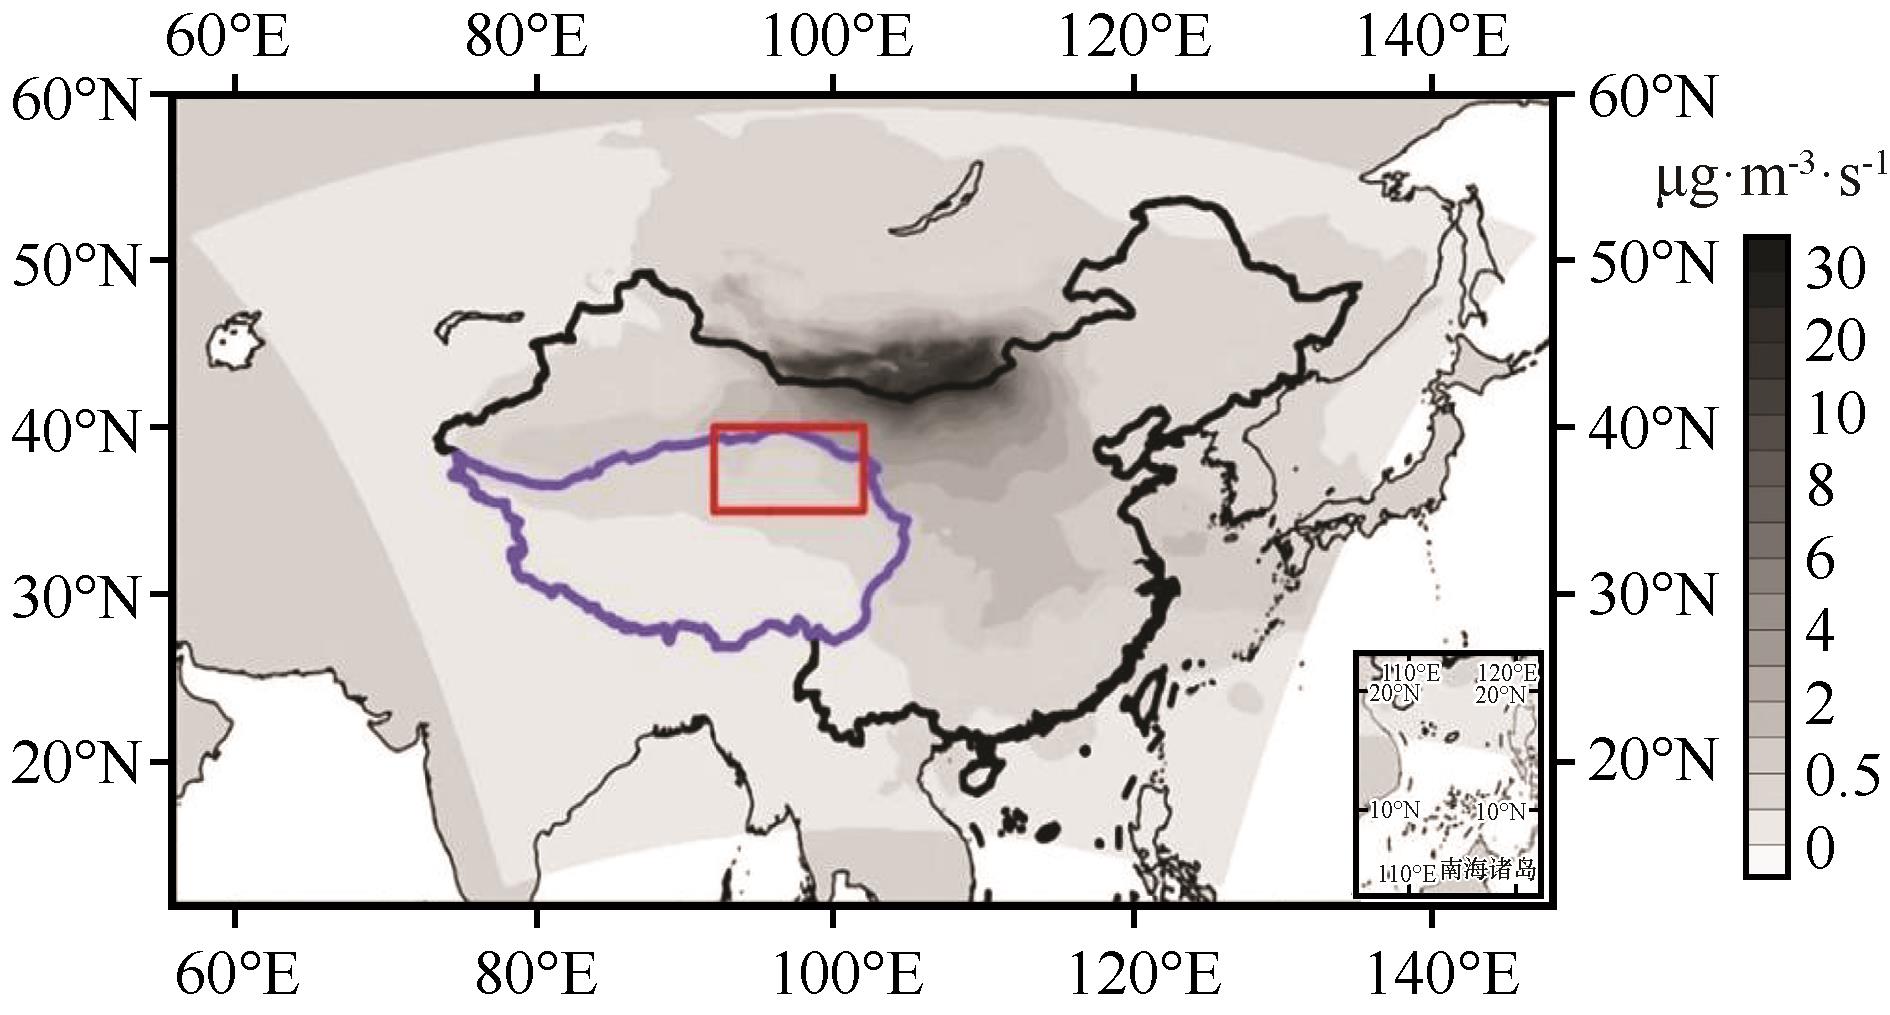
图1 WRF-Chem模拟戈壁沙漠2020年4月14—19日的平均起沙通量注:基于自然资源部标准地图服务网站标准地图(审图号:GS(2023)2762号)制作,底图边界无修改。方框表示此次沙尘事件中,沙尘传输至青藏高原的主要区域(35°—40°N,92°—102°E)
Fig.1 Average sand emission flux simulated by WRF-Chem in the Gobi Desert during April 14-19, 2020. The box indicates the main area where dust was transported to the Tibetan Plateau (35°-40°N, 92°-102°E) during this dust event. These include the main dust coverage area on the north slope (35°-40°N,92°-96°E) and the main dust coverage area on the east slope (35°-40°N, 99°-102°E)
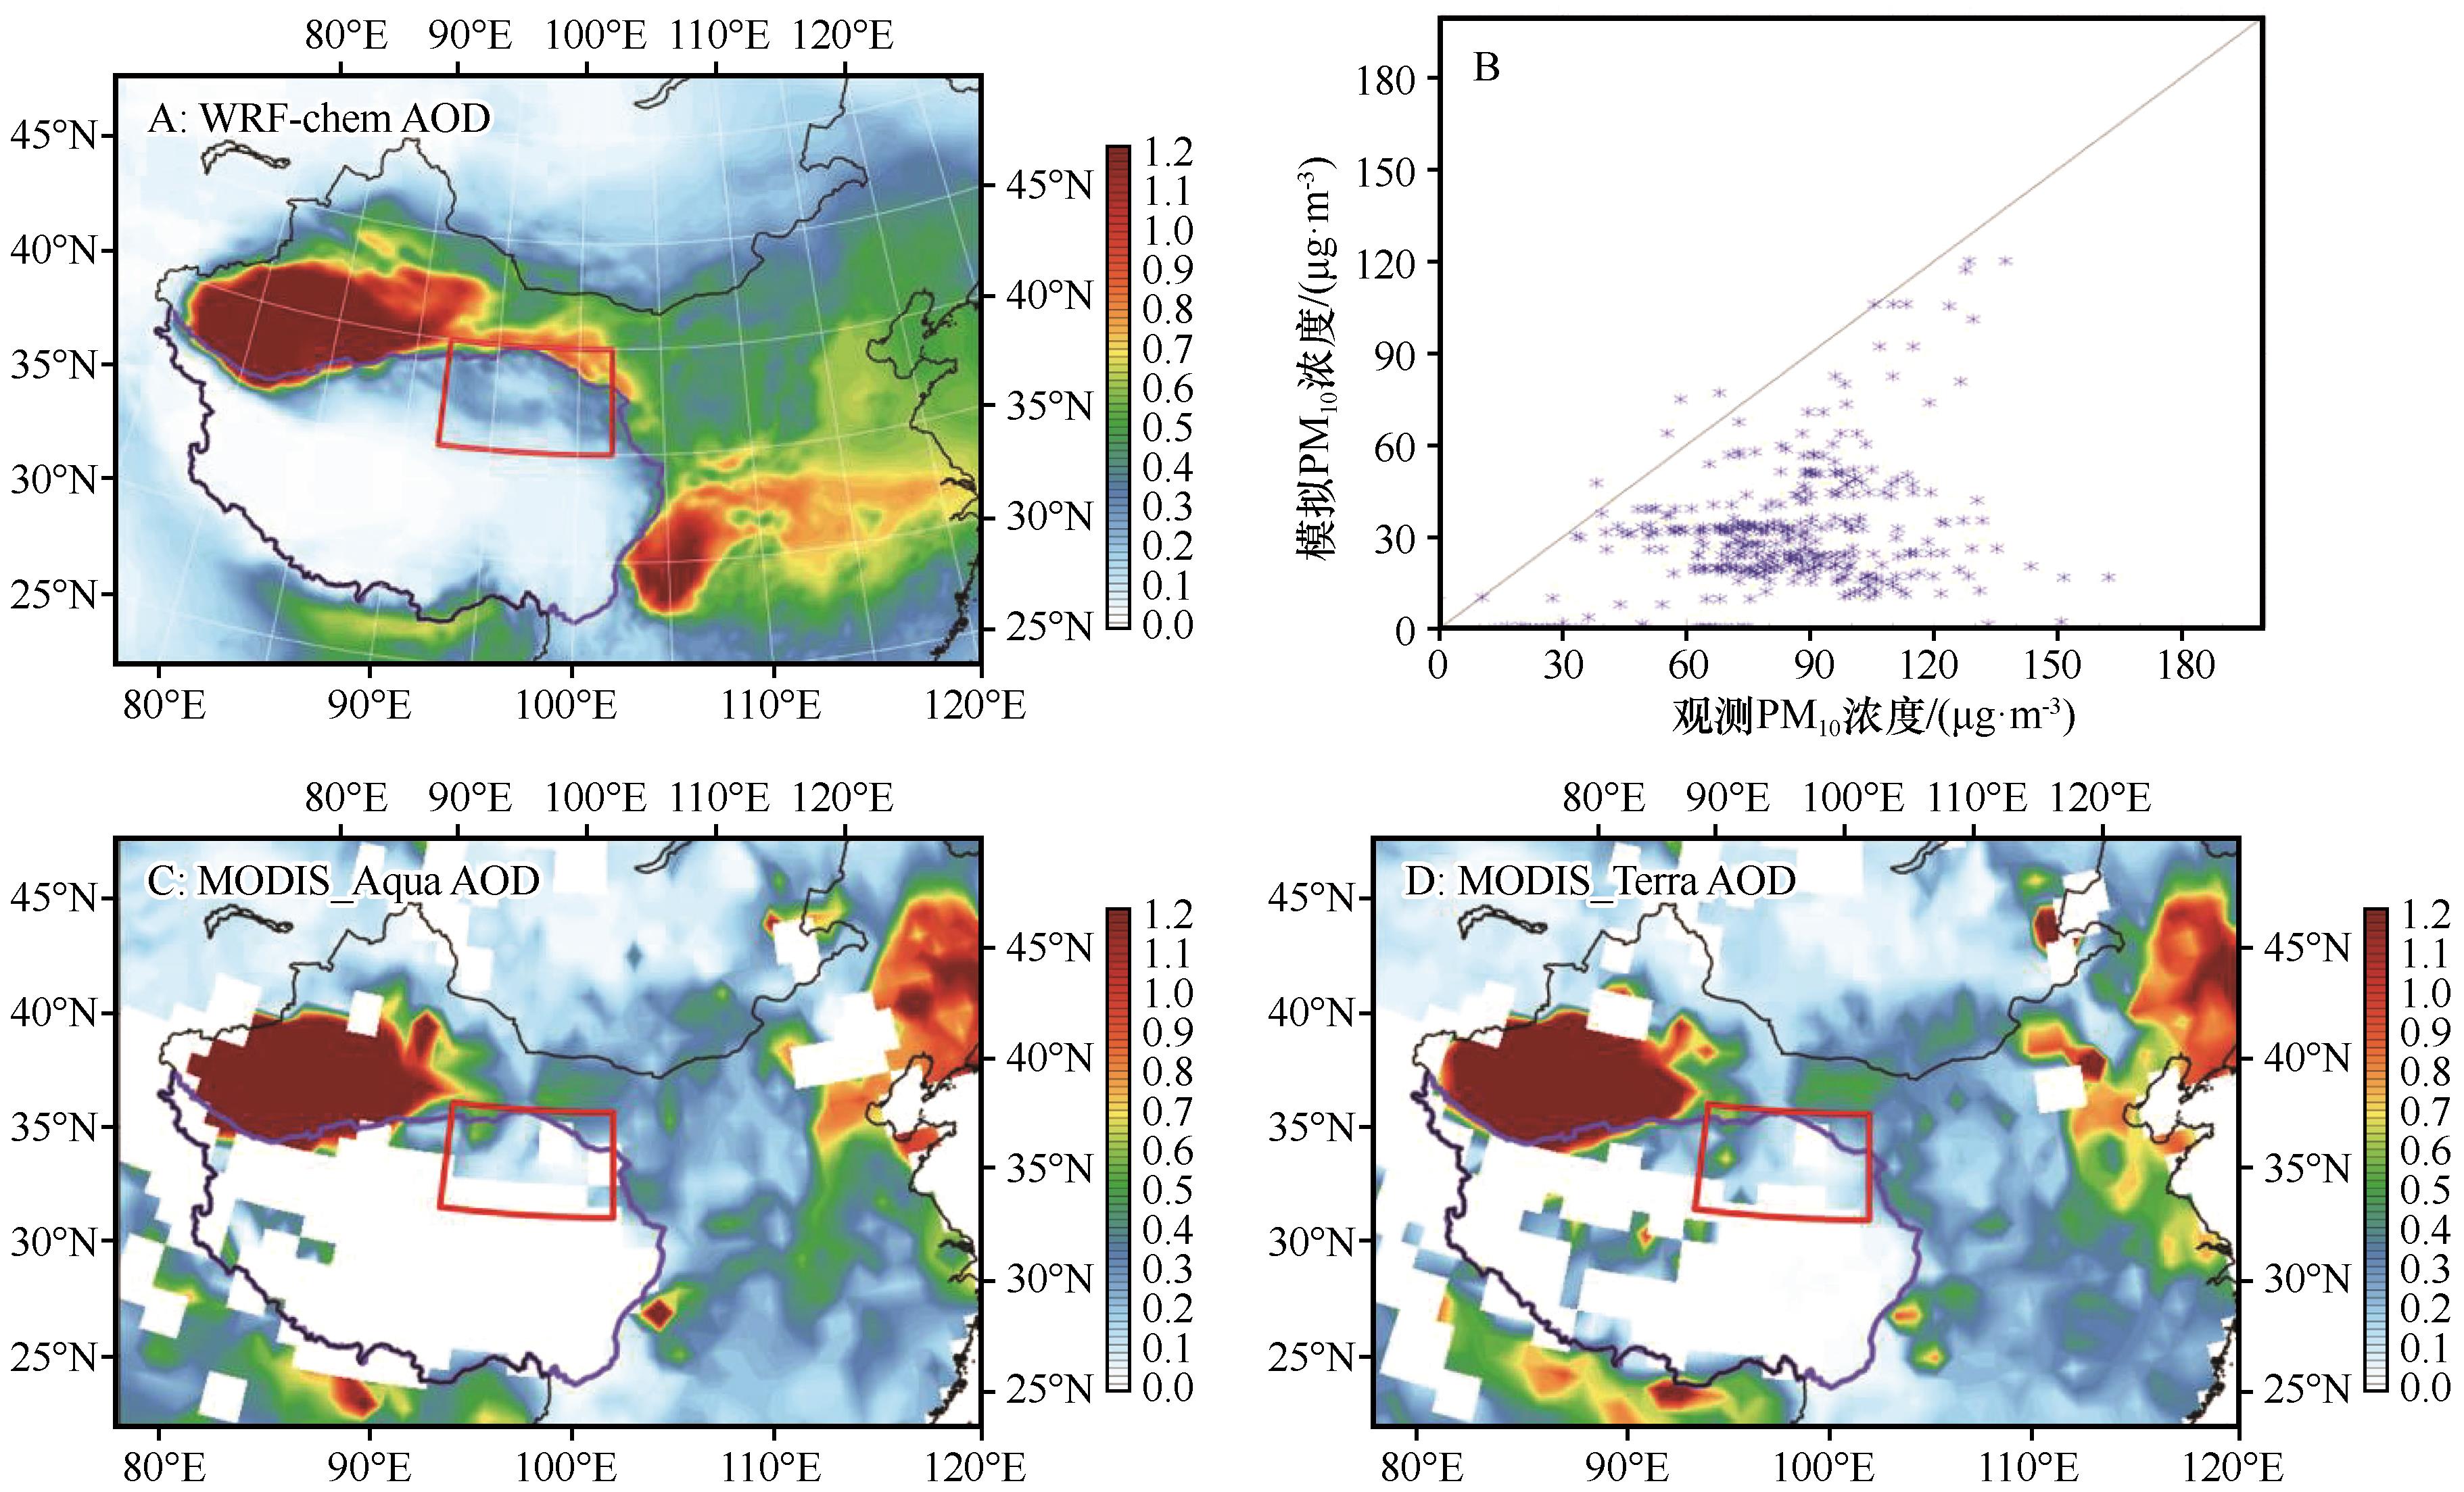
图2 2020年4月14—19日WRF-chem模拟 550 nm 处AOD(A),Aqua卫星(图C)和Terra卫星(图D)监测的 550 nm 处MODIS AOD对比,以及中国北方(30°—50°N,80°—120°E)站点观测日平均PM10浓度与WRF-chem模拟PM10浓度对比(B)注:基于自然资源部标准地图服务网站标准地图(审图号:GS(2023)2762号)制作,底图边界无修改
Fig.2 Comparison of WRF-chem AOD (A), MODIS_Aqua AOD (C), and MODIS_Terra AOD (D) during April 14-19, 2020,and comparison between the daily average PM10 concentration and PM10 concentration simulated by WRF-chem at most stations in northern China (30°-50°N, 80°-120°E, B)
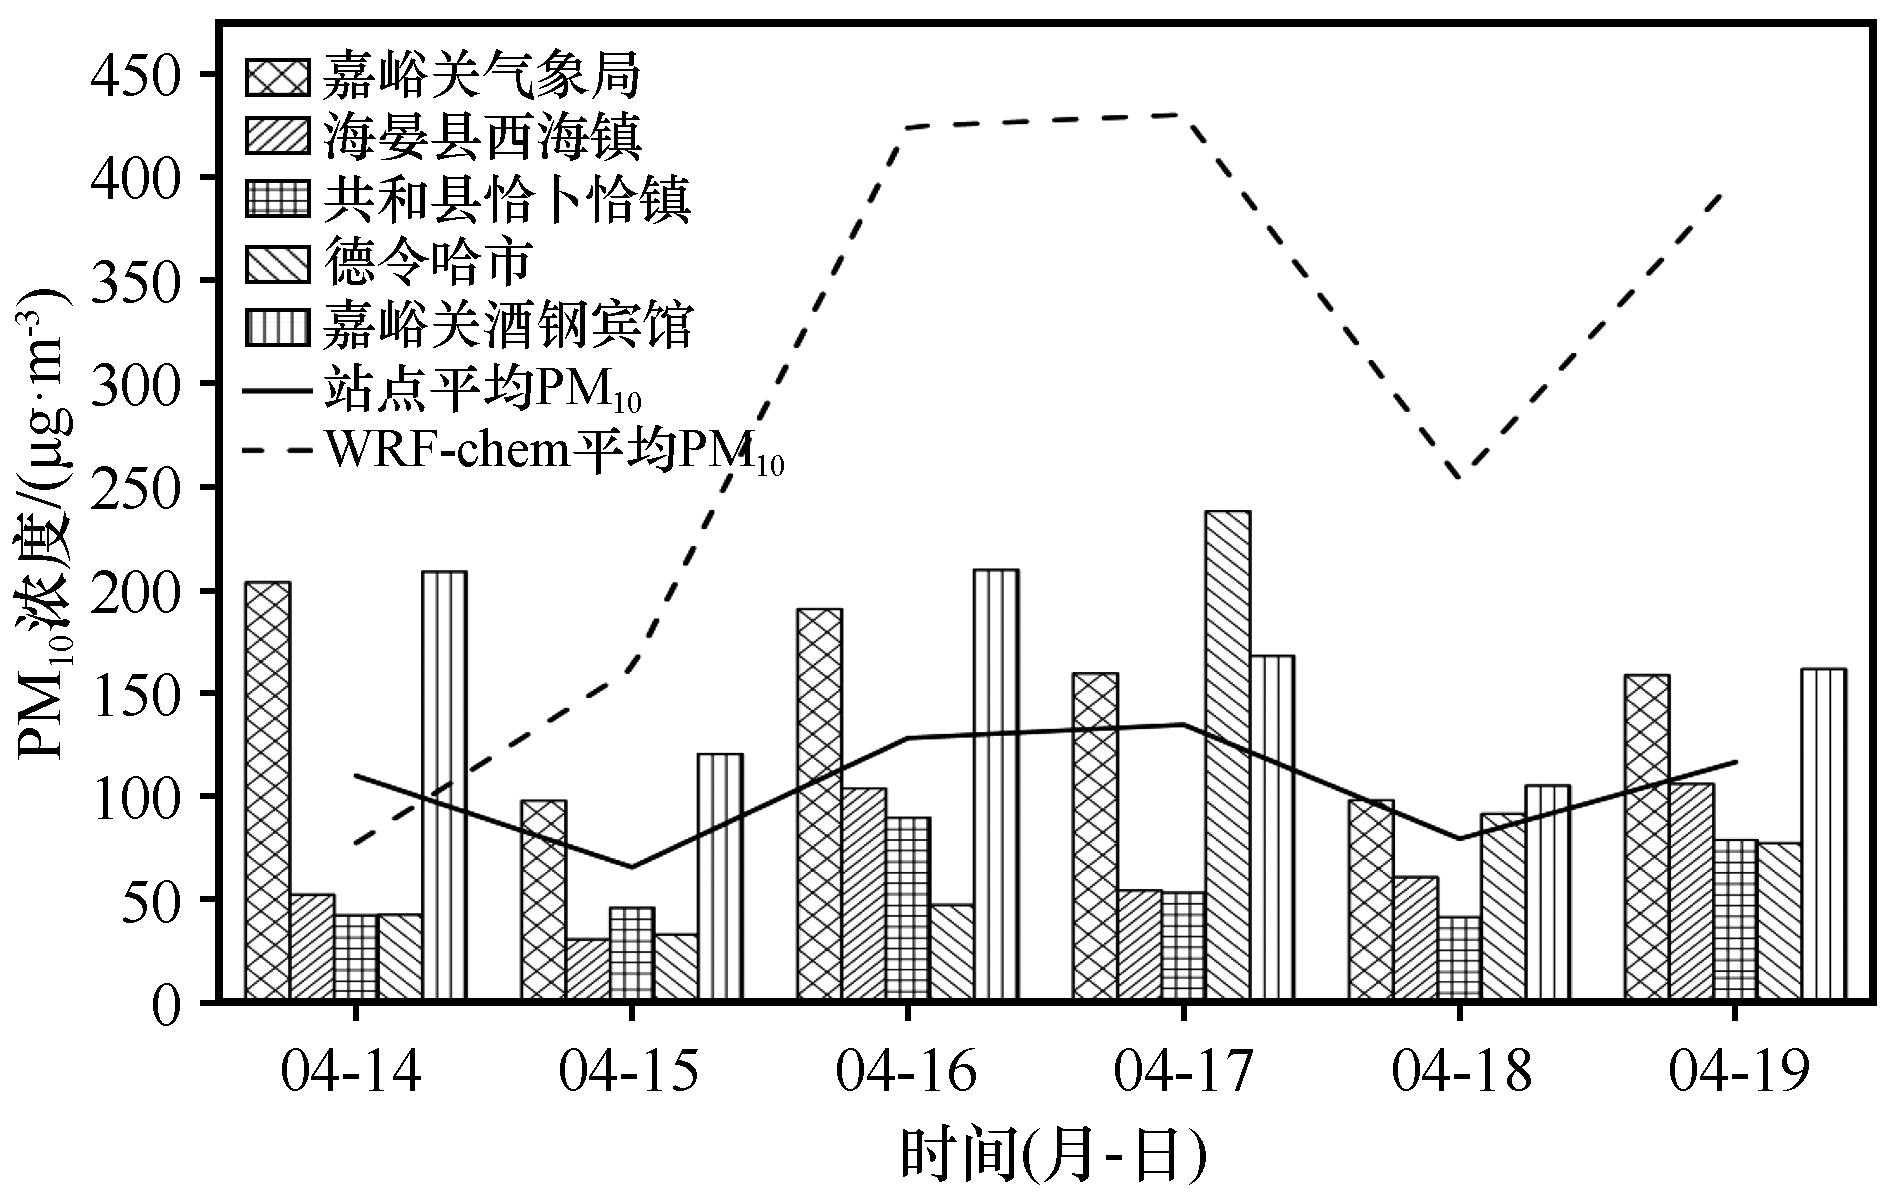
图3 2020年4月14—19日站点观测和模式模拟的PM10浓度时间序列
Fig.3 PM10 concentration time series for sites and model results during April 14-19, 2020
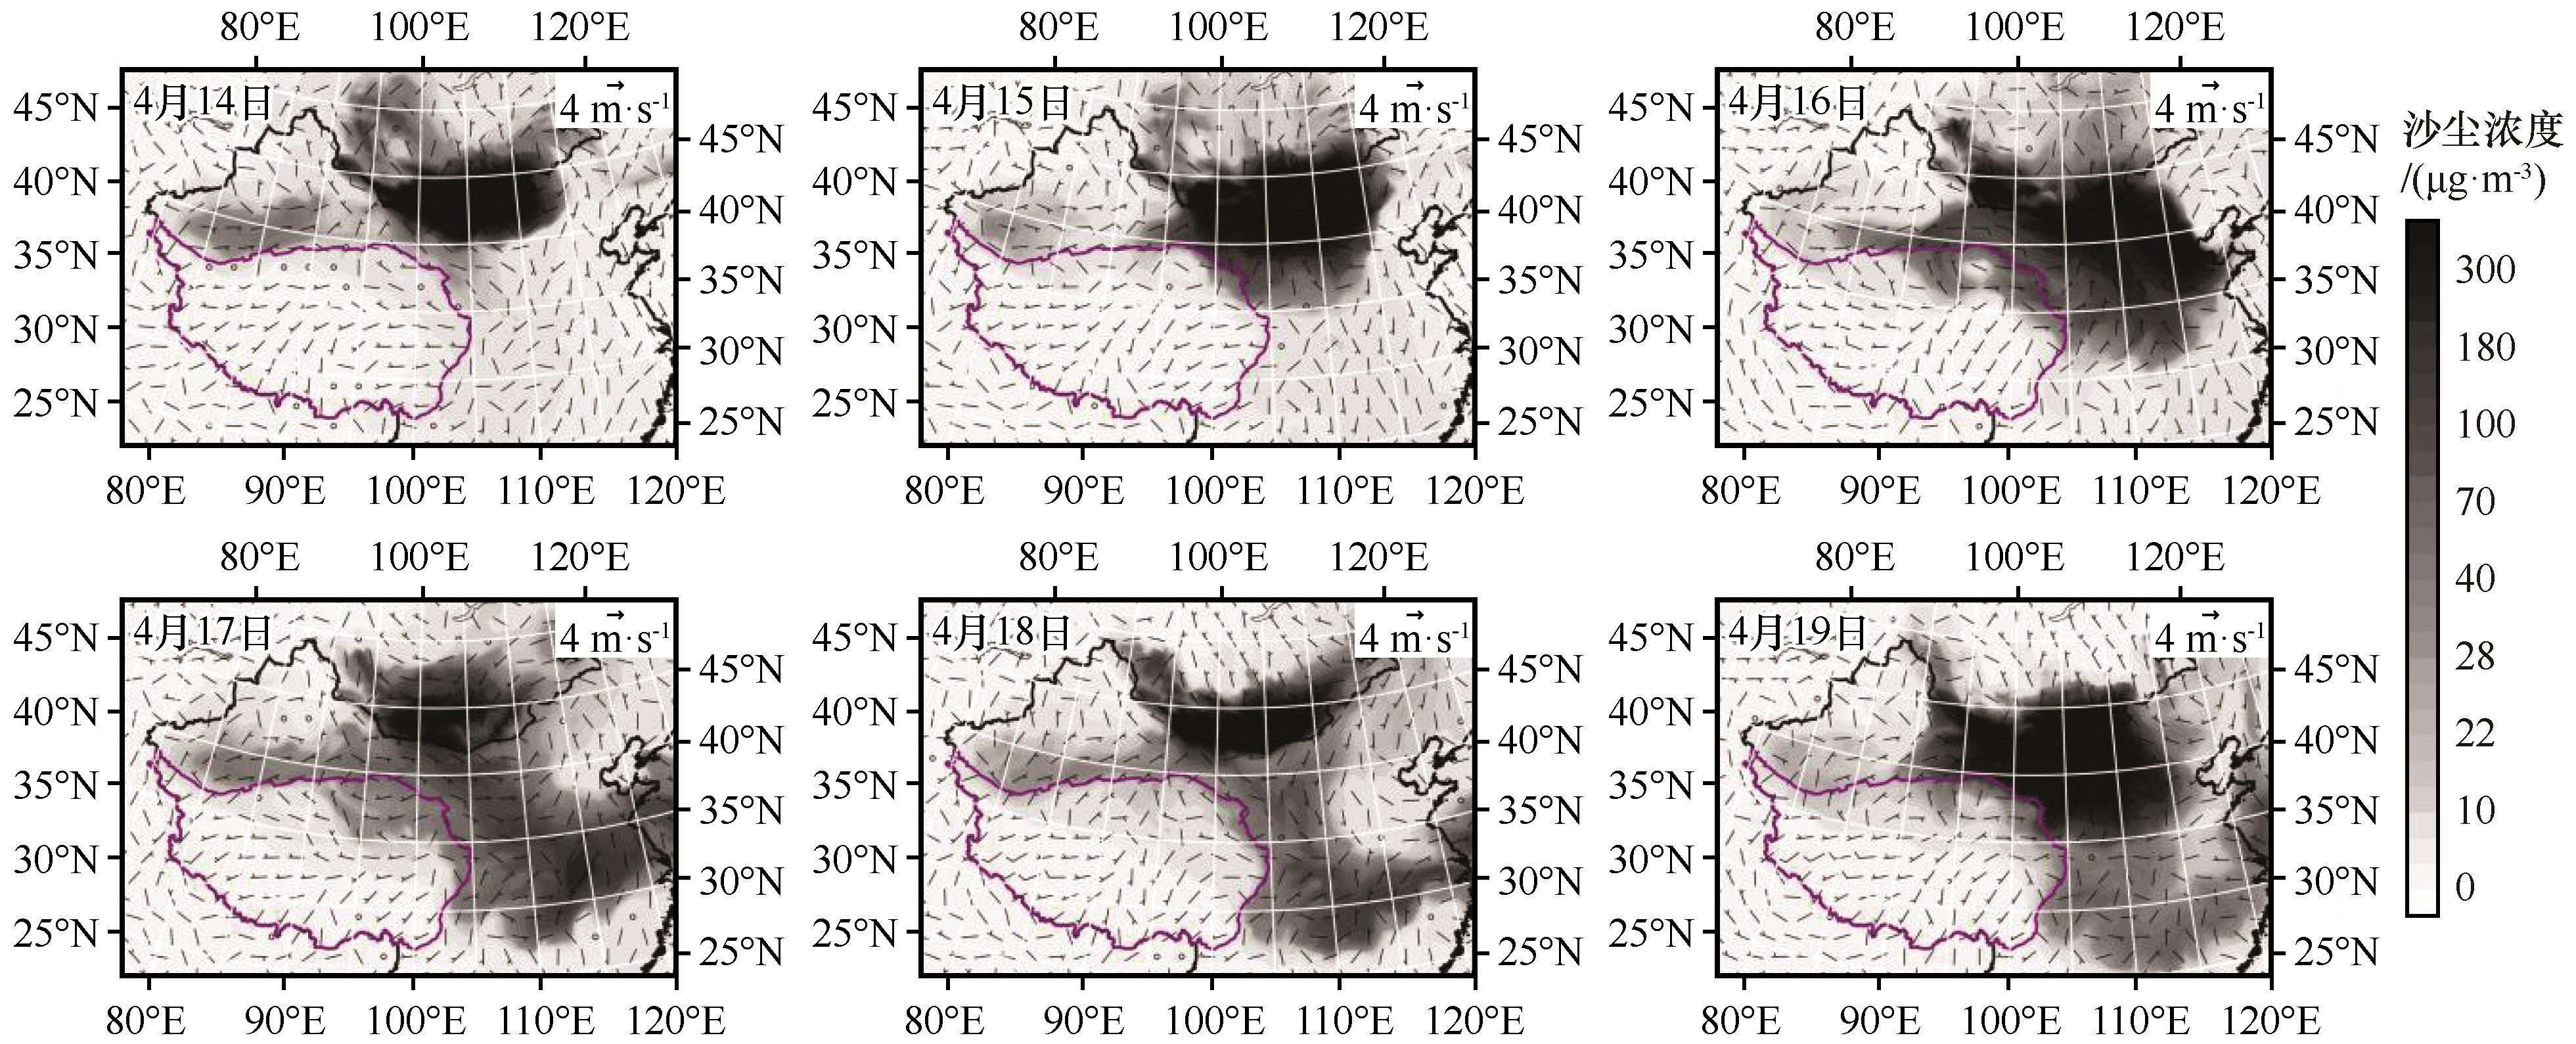
图4 2020年4月14—19日近地面沙尘浓度和风场的空间分布注:基于自然资源部标准地图服务网站标准地图(审图号:GS(2023)2762号)制作,底图边界无修改
Fig.4 Spatial distribution of near-surface dust concentration and wind field during April 14-19, 2020
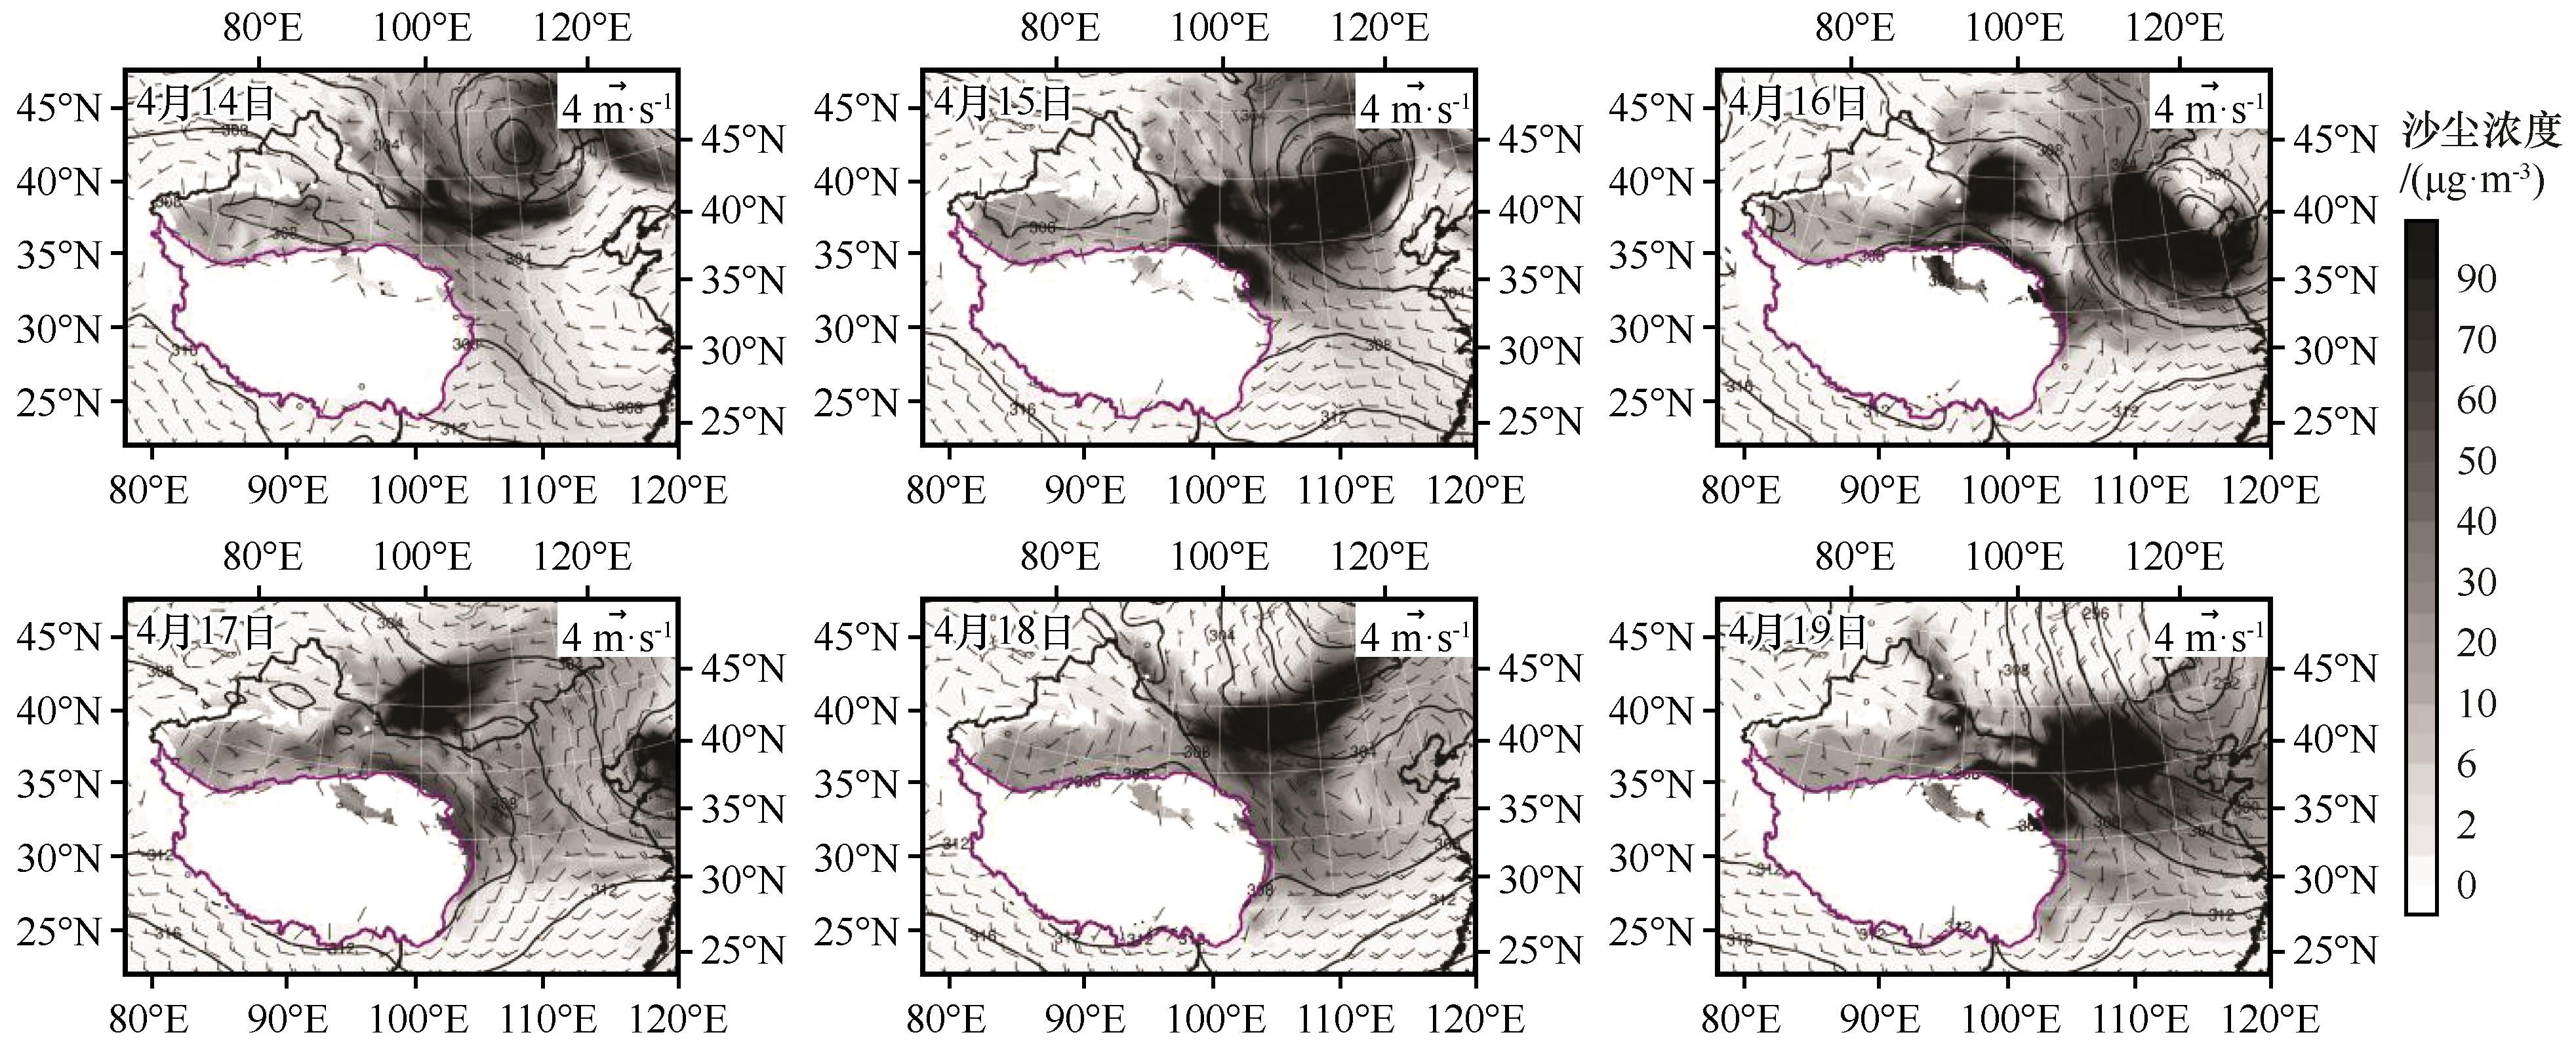
图5 2020年4月14—19日700 hPa沙尘浓度和风场的空间分布注:基于自然资源部标准地图服务网站标准地图(审图号:GS(2023)2762号)制作,底图边界无修改
Fig.5 Spatial distribution of dust concentration and wind field at 700 hPa during April 14-19, 2020
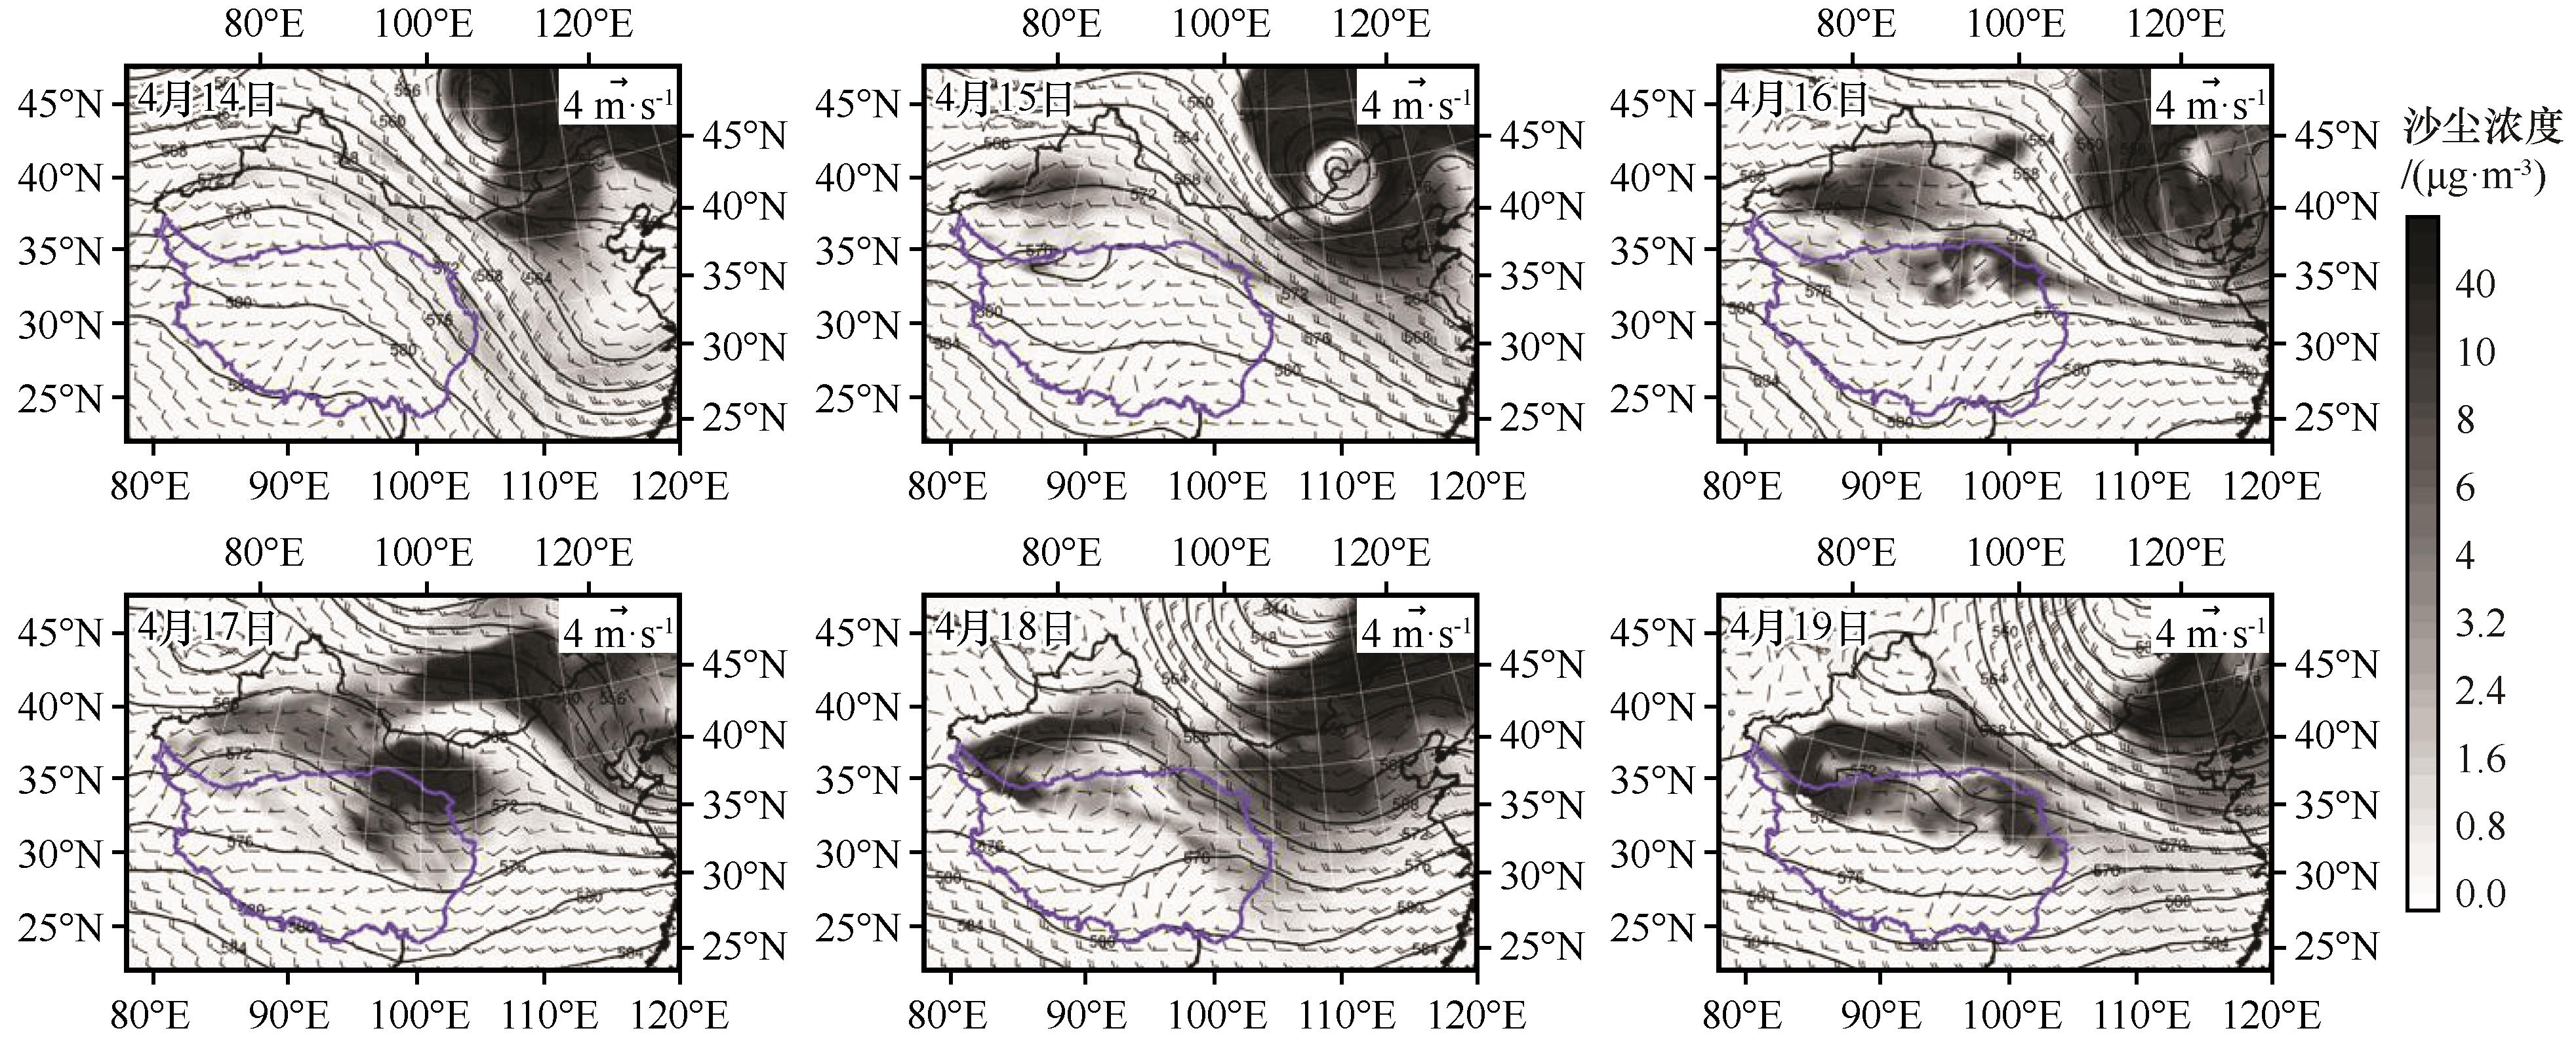
图6 2020年4月14—19日500 hPa沙尘浓度和风场的空间分布注:基于自然资源部标准地图服务网站标准地图(审图号:GS(2023)2762号)制作,底图边界无修改
Fig.6 Spatial distribution of dust concentration and wind field at 500 hPa during April 14-19, 2020
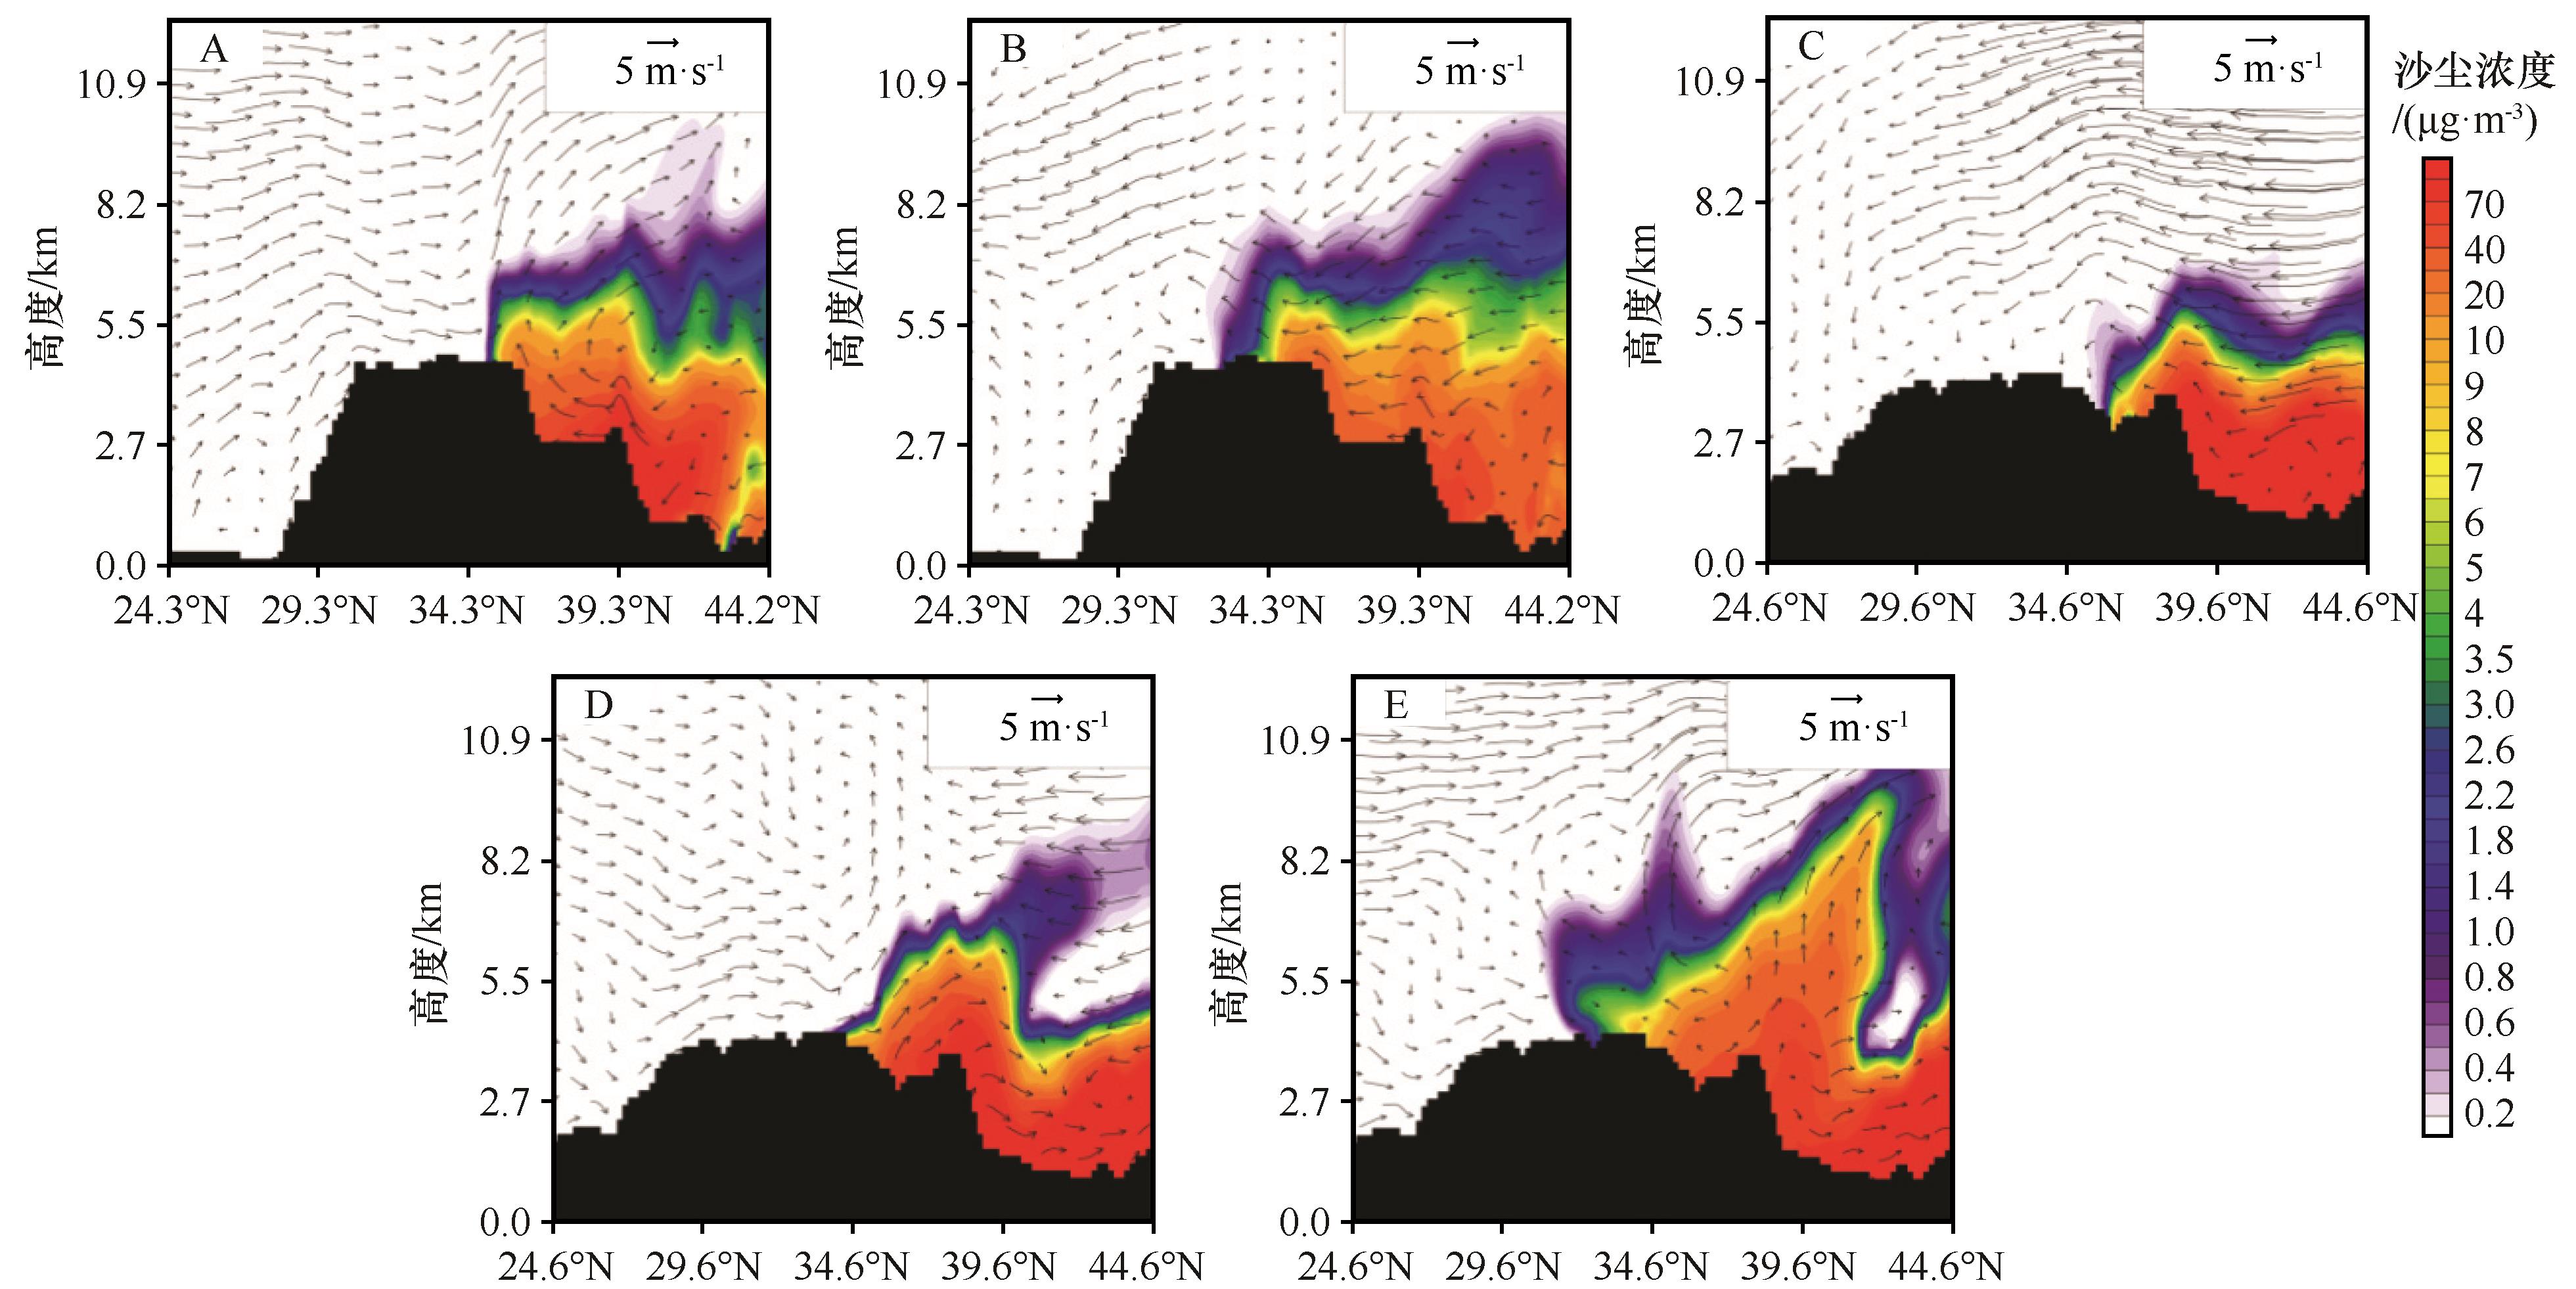
图7 2020年4月16日(A)、17日(B)青藏高原北坡及15日(C)、16日(D)、17日(E)青藏高原东坡戈壁沙漠沙尘向青藏高原传输的经向剖面
Fig.7 The meridional section of Gobi Desert dust transport to the Tibet Plateau over the north slope of the Tibetan Plateau on April 16th (A), 17th (B), and over the east slope of the Tibetan Plateau on April 15th (C), 16th (D), 17th (E)
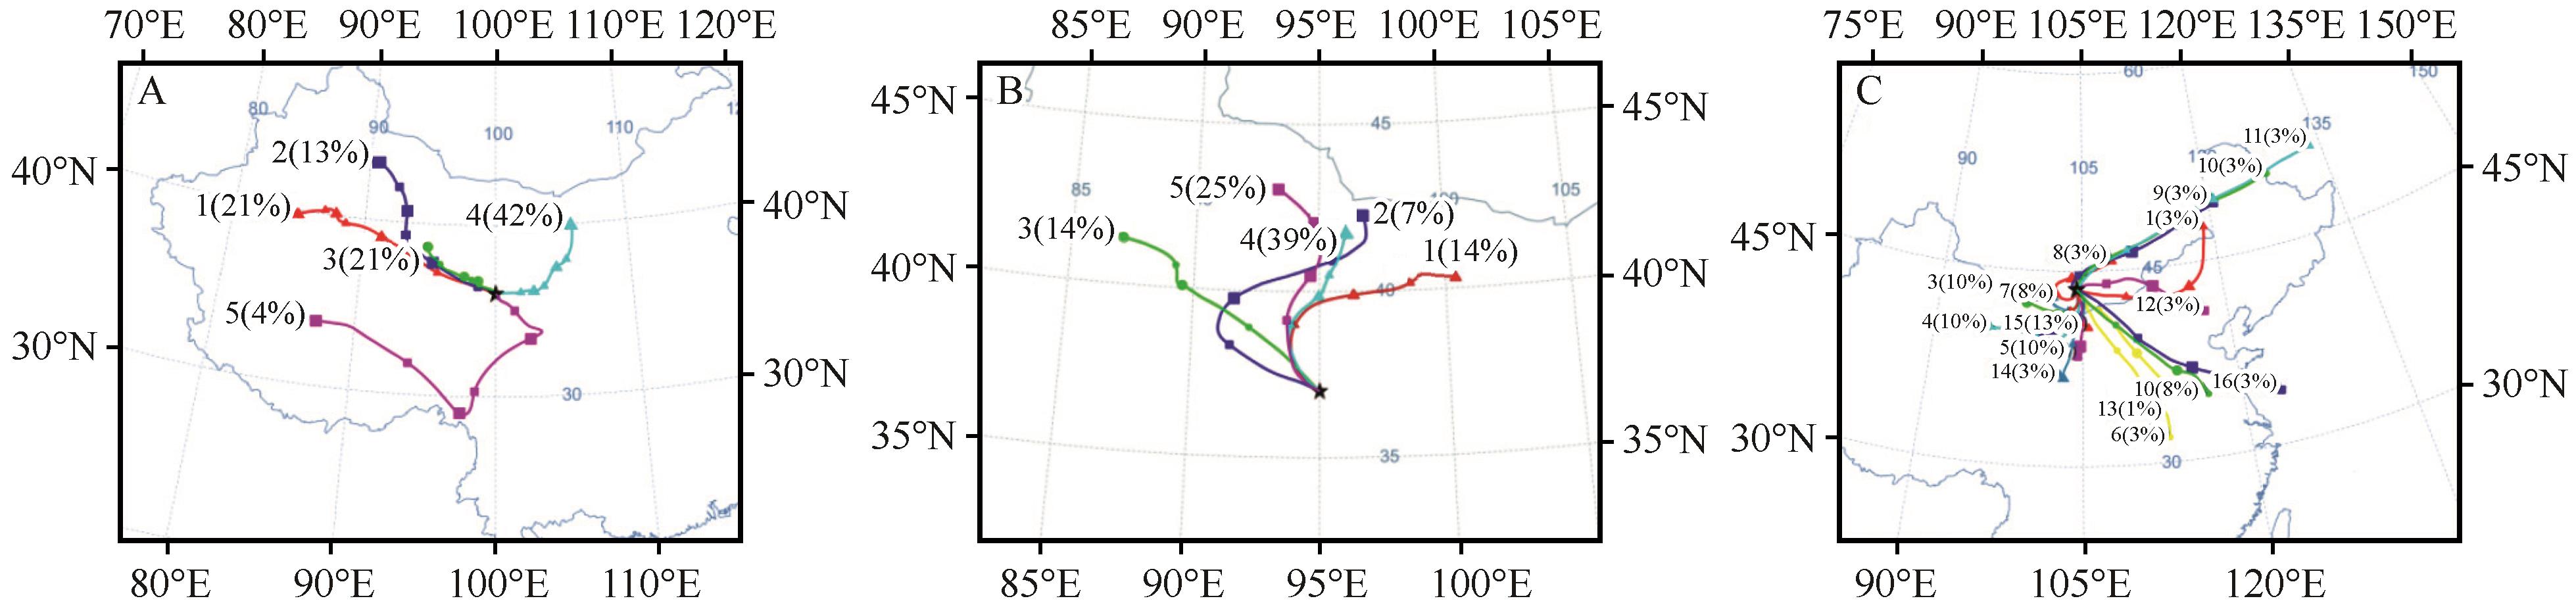
图8 2020年4月17日00:00(UTC)青藏高原东坡(36°N、100°E,A)和青藏高原北坡(37°N、95°E,B)96 h HYSPLIT沙尘后向轨迹,及4月14日蒙古国达兰扎德嘎德(43.57°N、104.43°E)120 h HYSPLIT沙尘前向轨迹注:基于自然资源部标准地图服务网站标准地图(审图号:GS(2023)2762号)制作,底图边界无修改
Fig.8 The 96 h dust HYSPLIT backward trajectories at 00:00 on April 17, 2020 (UTC) of the east (36°N, 100°E, A) and north (37°N, 95°E, B) slopes of the Tibetan Plateau affected by dust this time, and the 120 h dust HYSPLIT forward trajectories of Daranzadegade station (43.57°N, 104.43°E) on April 14th, 2020
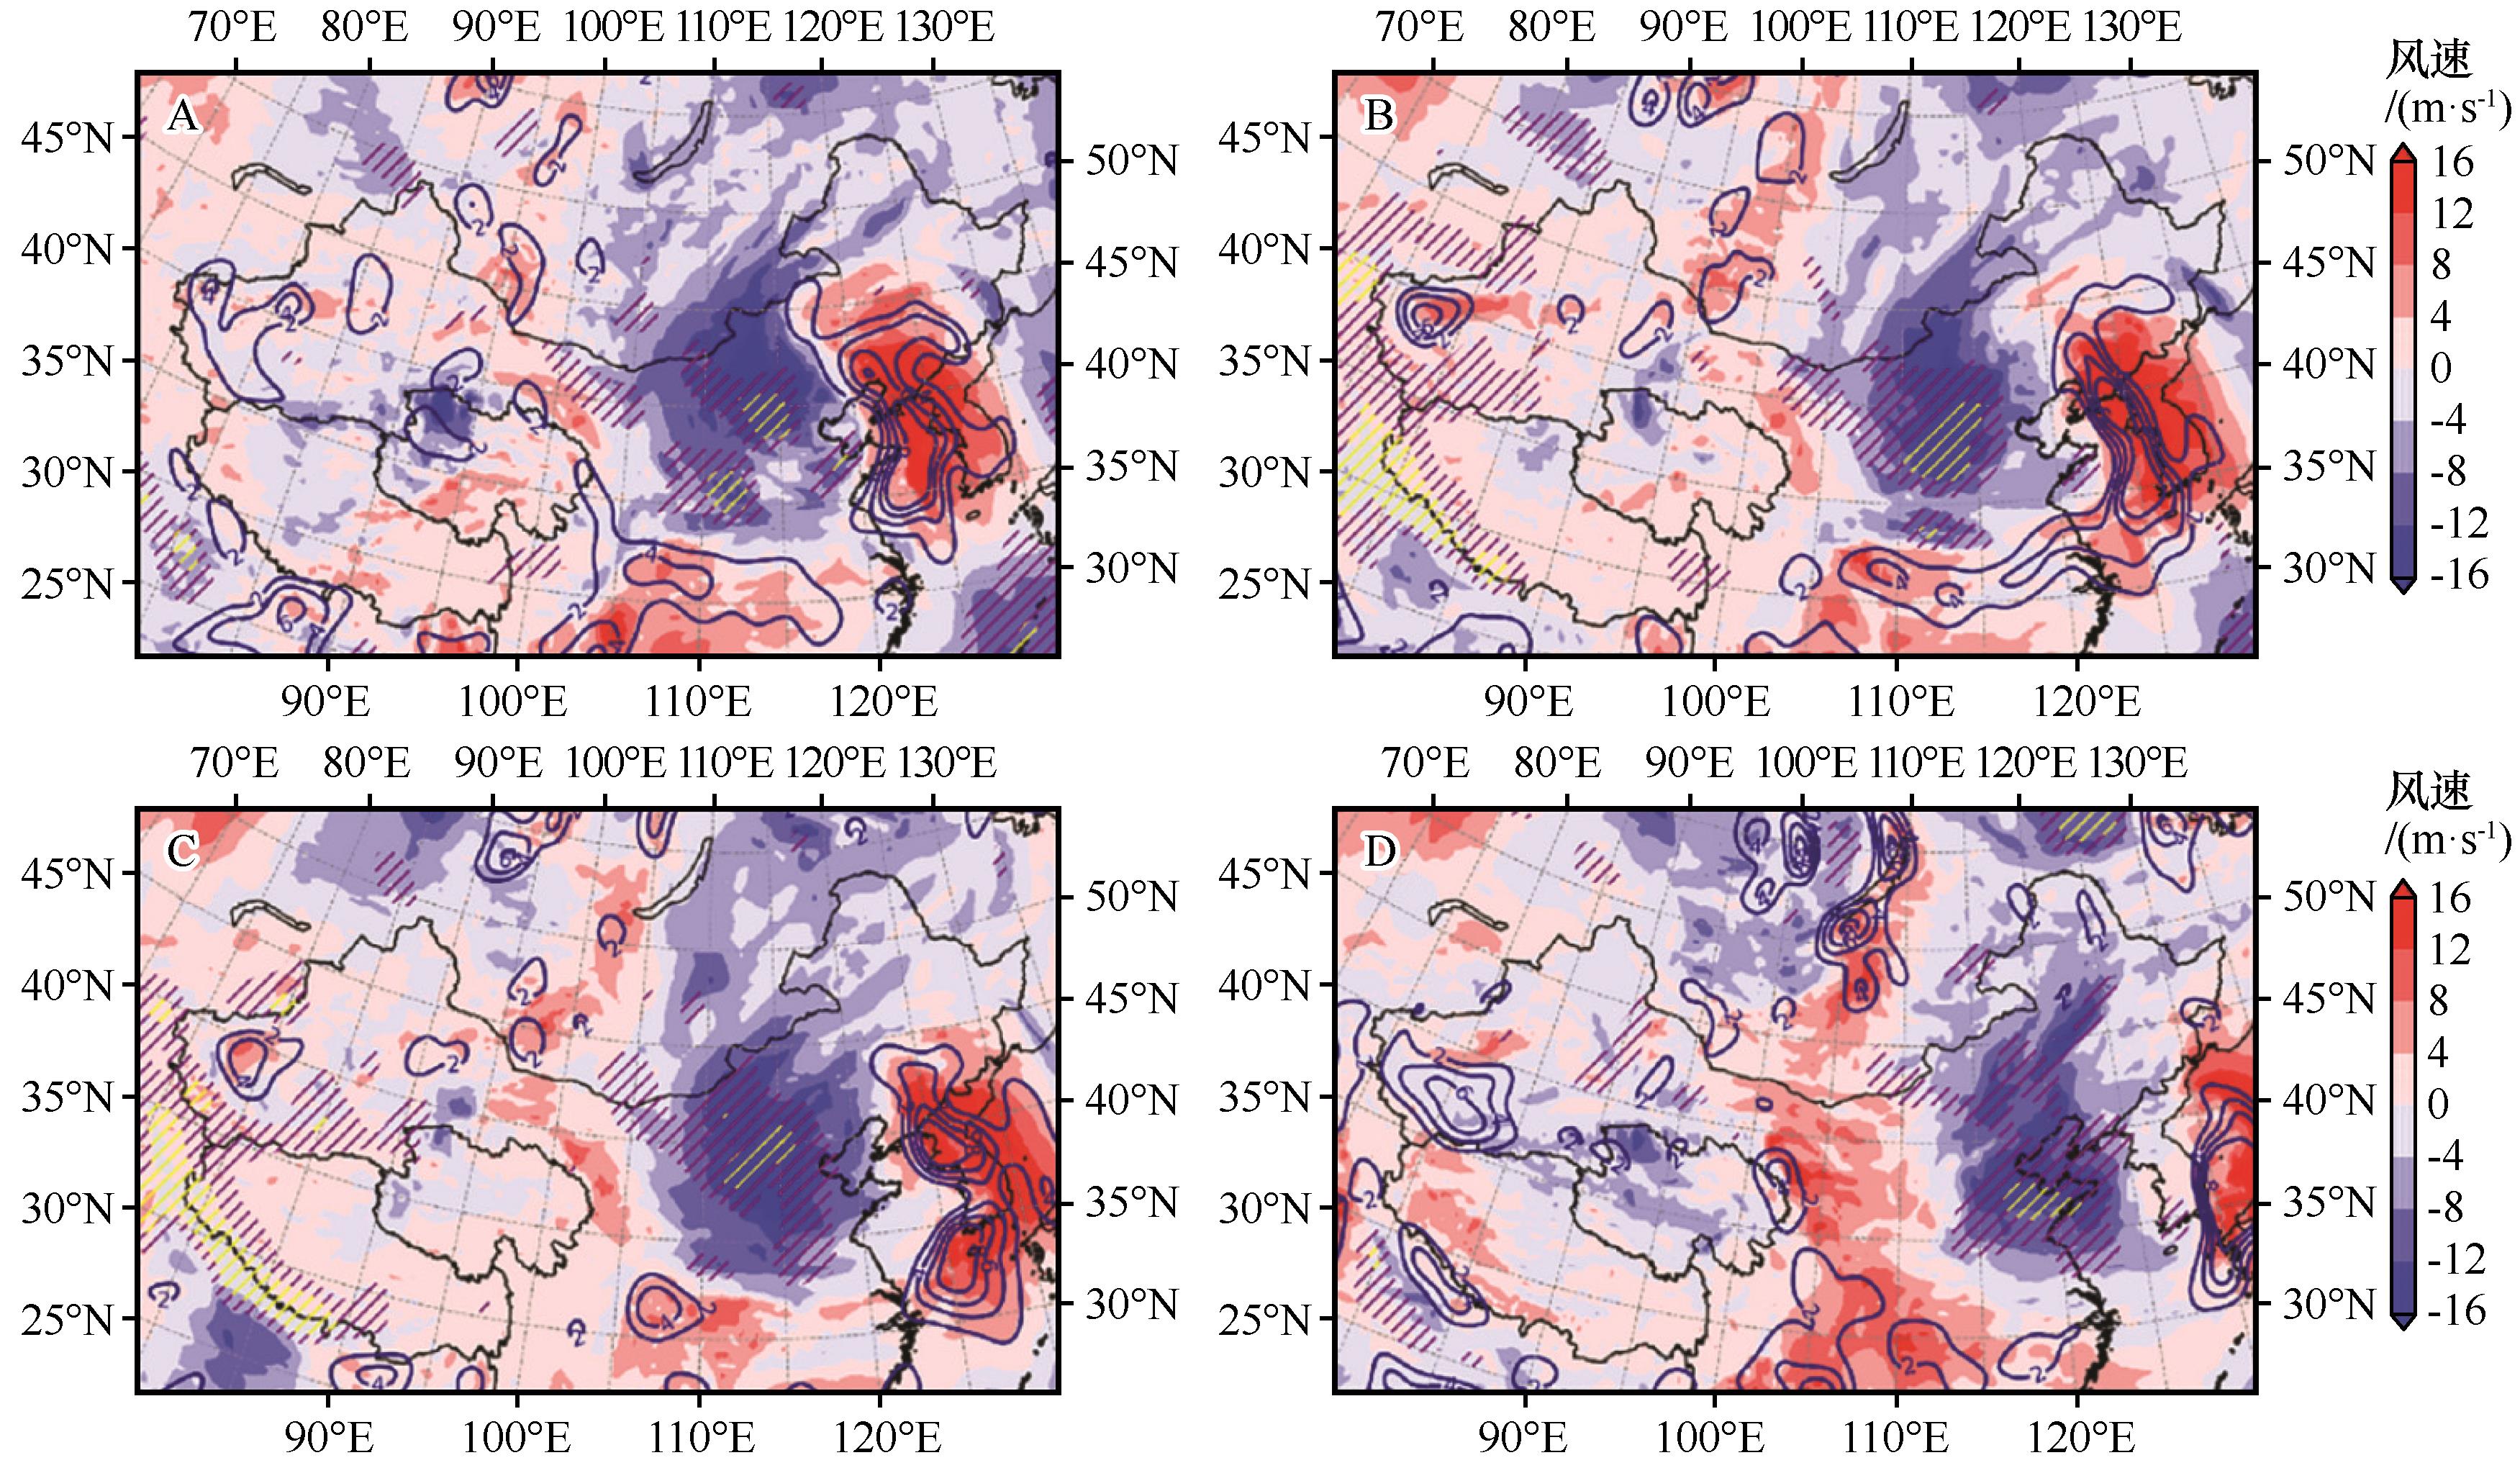
图9 4月16日12:00(A)、18:00(B)和17日00:00(C)、06:00(D)经向风速场(蓝色表示北风,红色表示南风,单位m·s-1,水平分辨率0.25°×0.25°。蓝色等值线表示垂直速度≥0.02 m·s-1的上升区域,等值线间隔为0.02 m·s-1,斜杠为下沉区域,紫色表示垂直速度-0.04~-0.02 m·s-1,黄色表示垂直速度-0.08~-0.04 m·s-1)注:基于自然资源部标准地图服务网站标准地图(审图号:GS(2023)2762号)制作,底图边界无修改
Fig.9 Meridional wind speed field at 12:00 (A) and 18:00 (B) on April 16th, and at 00:00 (C) and 06:00(D) on April 17th (blue indicates north wind, red indicates south wind, unit m·s-1, horizontal resolution 0.25°×0.25°. The blue contour line indicates the rising area with a vertical velocity greater than or equal to 0.02 m·s-1, the contour interval is 0.02 m·s-1, the slash is the sinking area, the purple indicates the vertical velocity from -0.04 m·s-1 to -0.02 m·s-1, and the yellow indicates vertical speed from -0.08 m·s-1 to -0.04 m·s-1
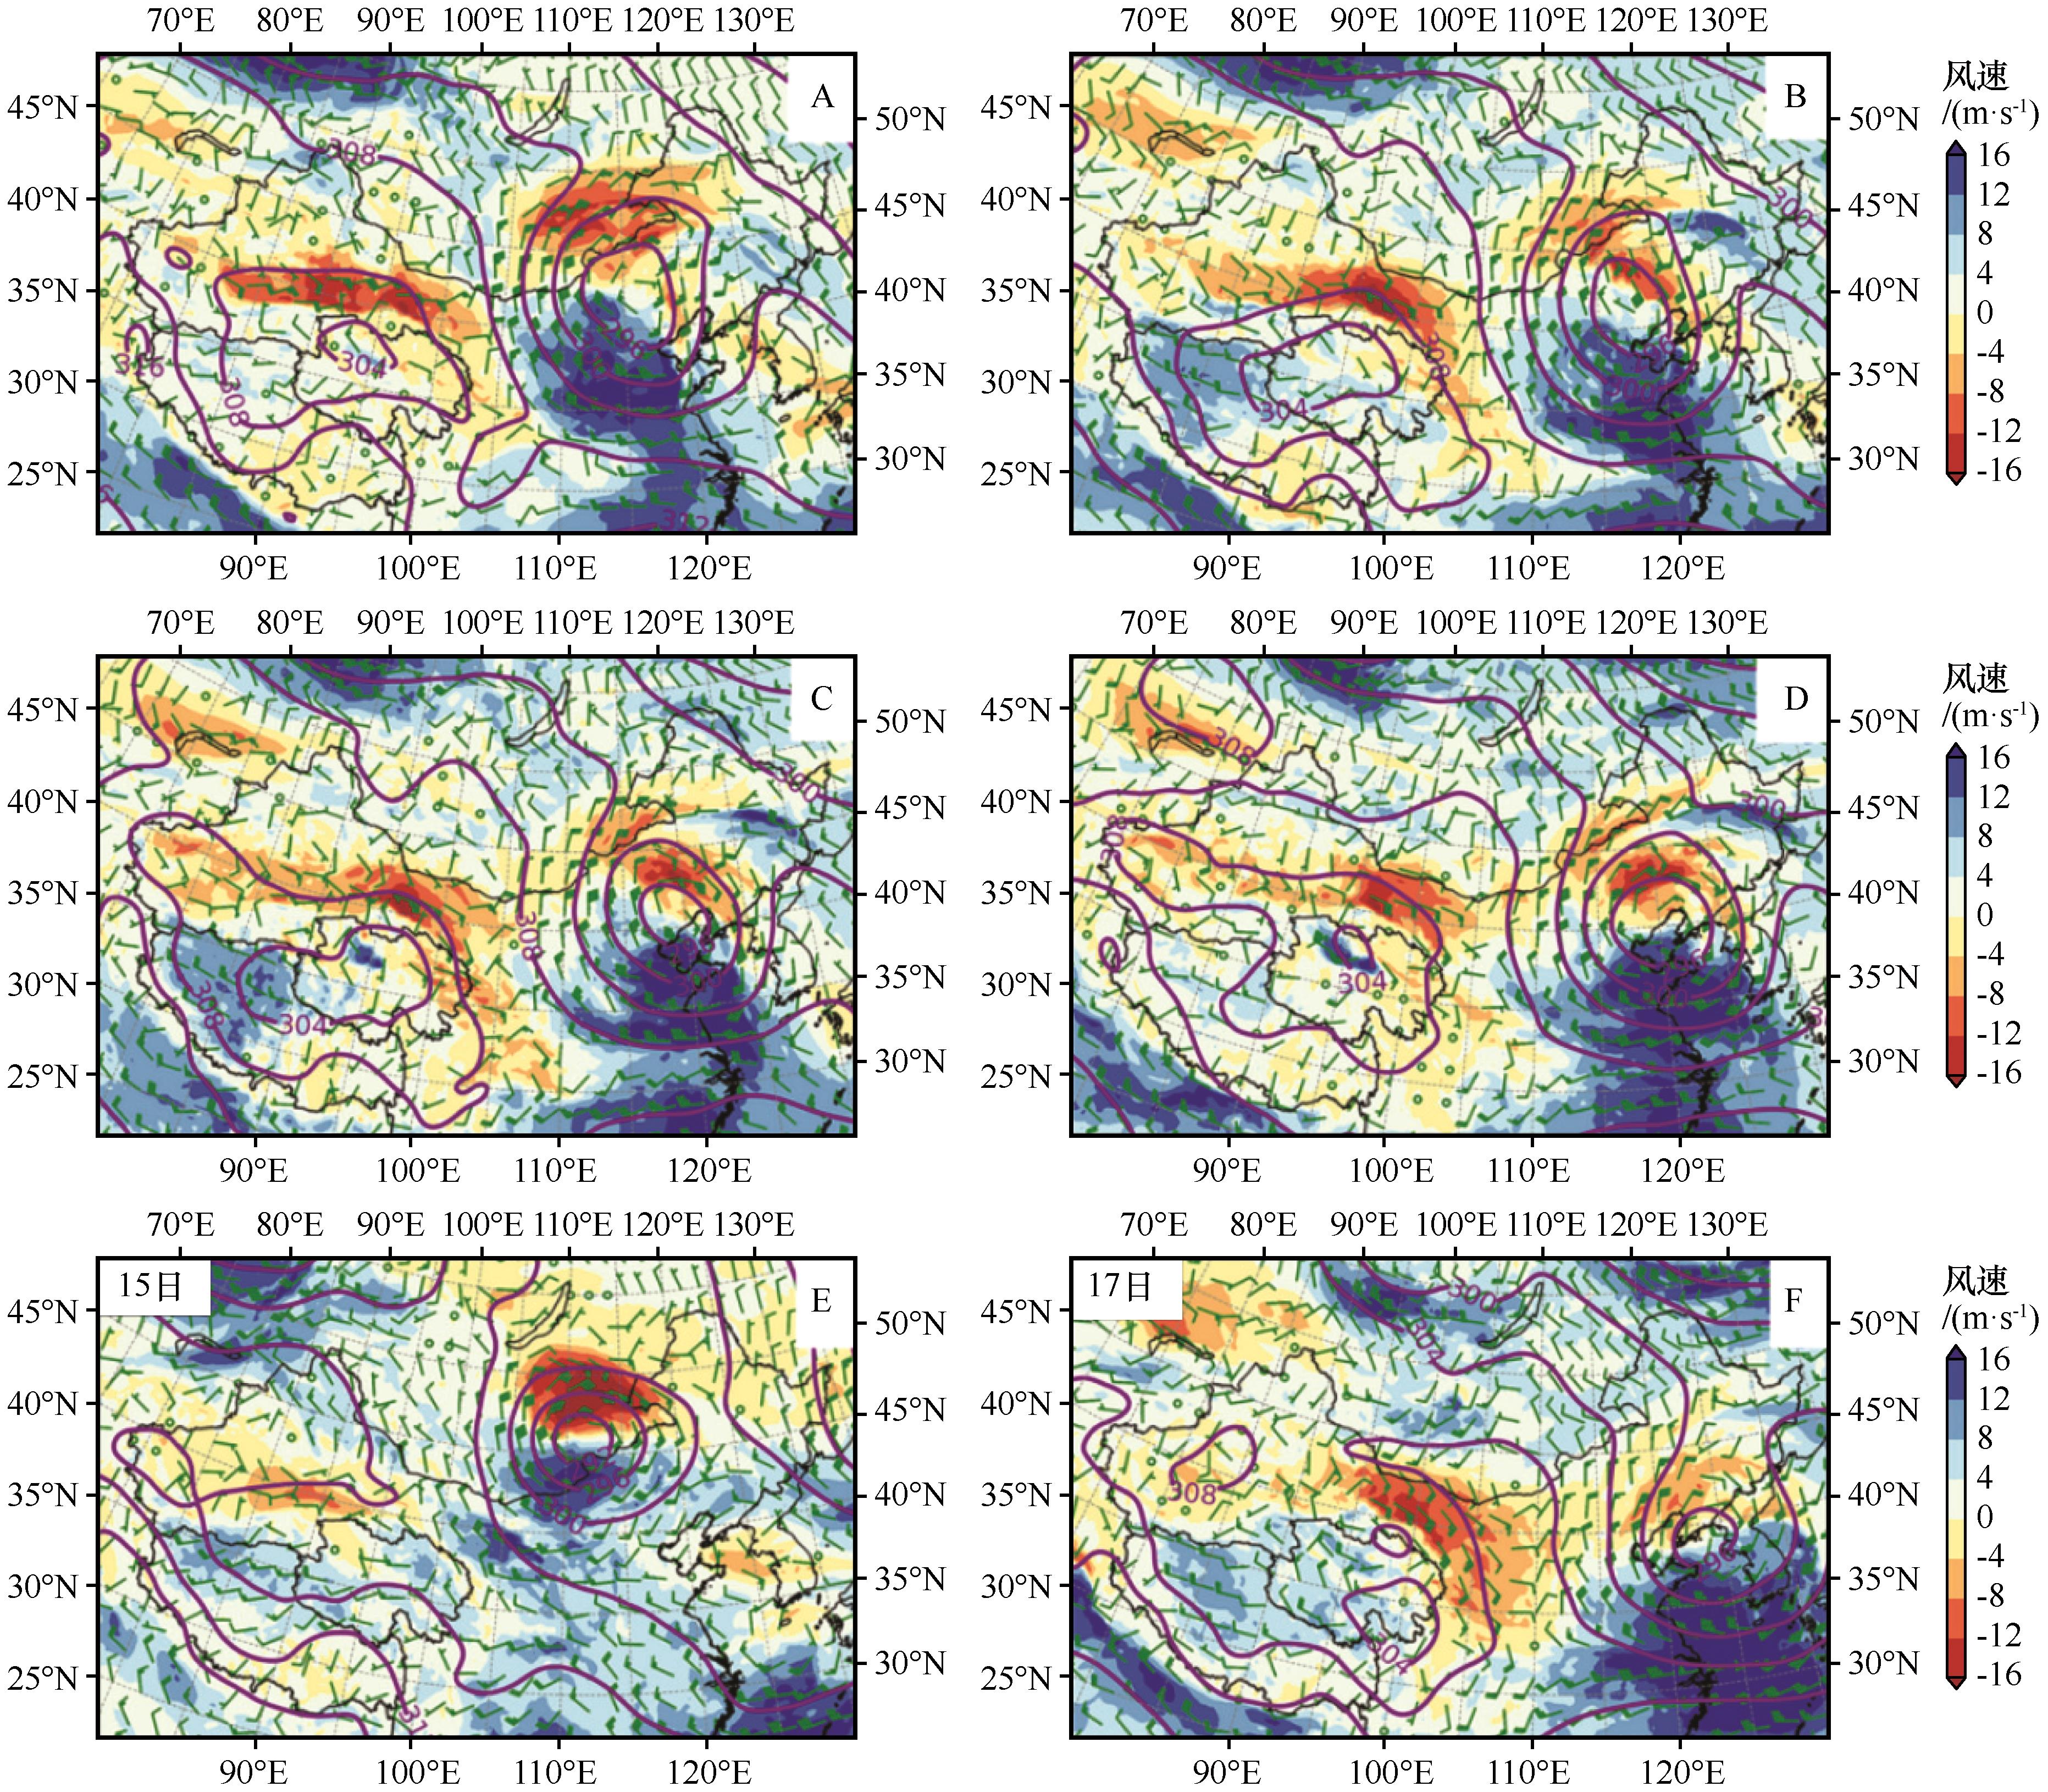
图10 4月16日00:00(A)、06:00(B)、12:00(C)、18:00(D),15日(E)与17日(F)700 hPa位势高度(紫色线条,单位dagpm)与纬向风速(蓝色表示西风,红色表示东风,单位m·s-1,水平分辨率0.25°×0.25°)注:基于自然资源部标准地图服务网站标准地图(审图号:GS(2023)2762号)制作,底图边界无修改
Fig.10 The 700 hPa geopotential height (purple line, unit dagpm) and zonal wind speed (blue indicates west wind, red indicates east wind, unit m·s-1, horizontal resolution 0.25°× 0.25°) at 00:00 (A), 06:00 (B), 12:00 (C), 18:00 (D) on April 16th, 15th (E) and 17th (F)
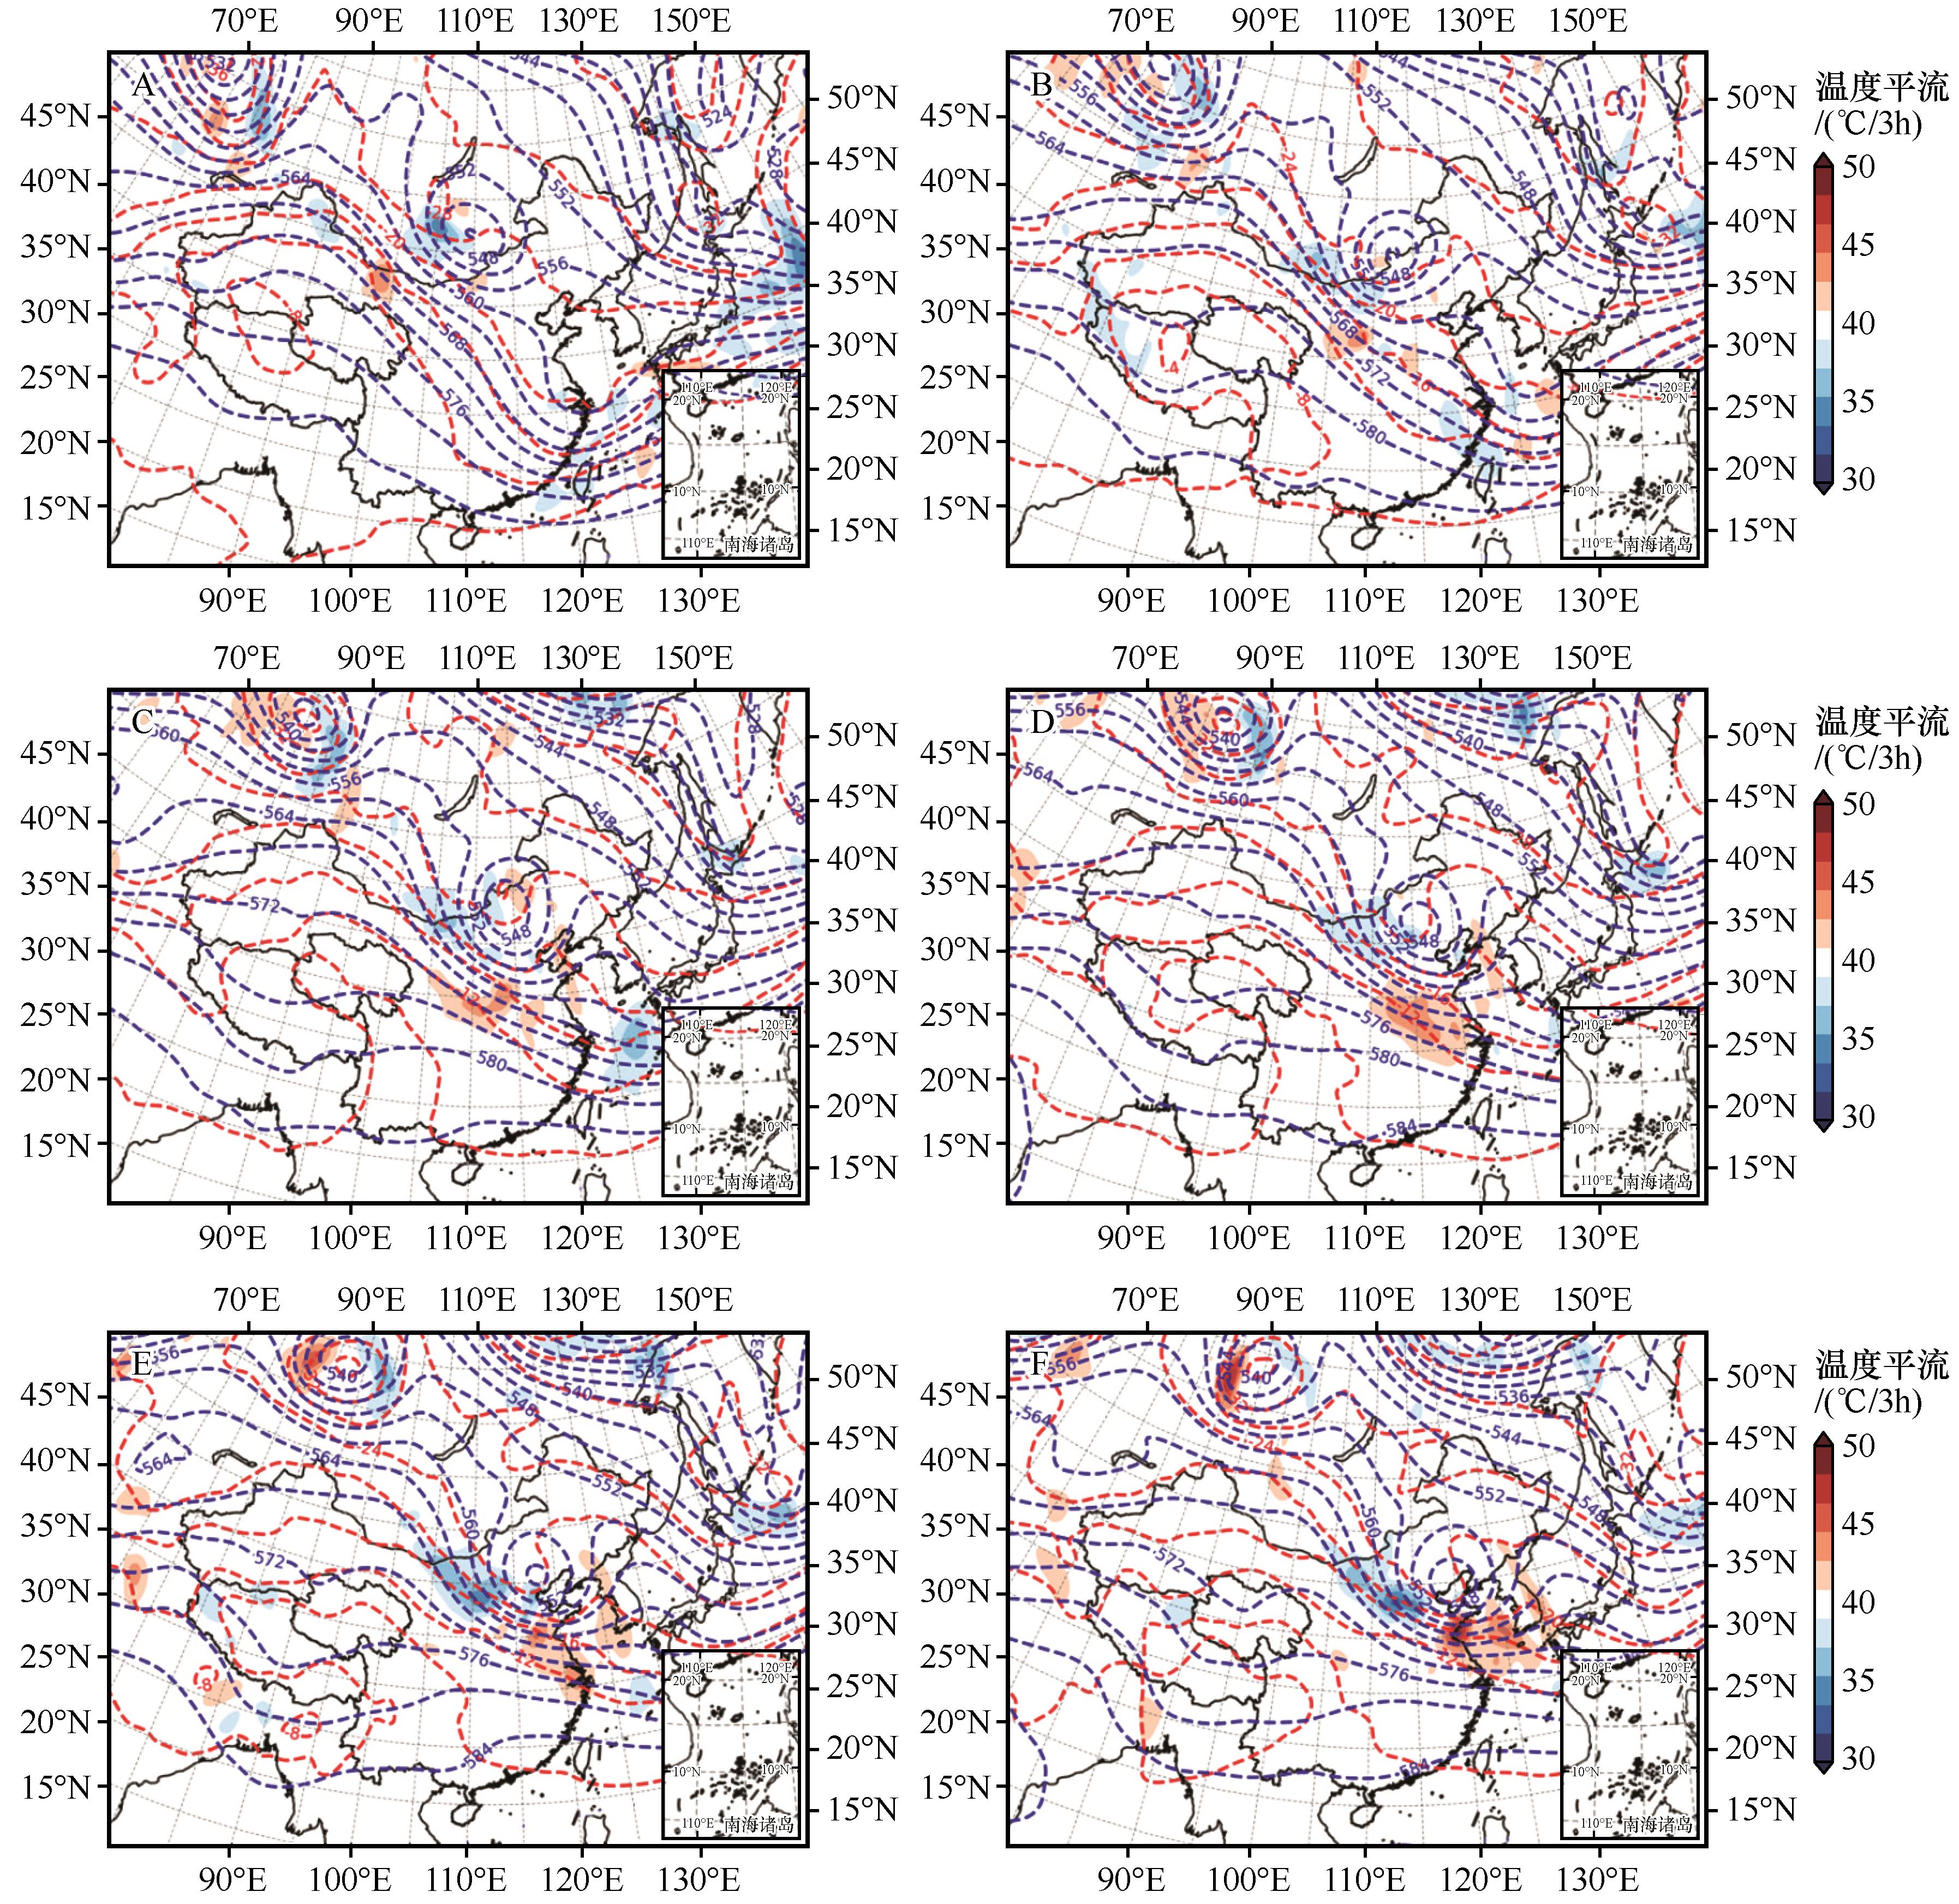
图11 4月15日00:00(A)、12:00(B)和16日00:00(C)、06:00(D)、12:00(E)、18:00 (F)500 hPa位势高度(蓝色等值线,单位dagpm)与温度平流(红色区域为暖平流,蓝色区域冷平流,单位℃/3h)注:基于自然资源部标准地图服务网站标准地图(审图号:GS(2023)2762号)制作,底图边界无修改
Fig.11 The 500 hPa geopotential height (blue contour, unit is dagpm) and temperature advection (the red area is warm advection, and the blue area is cold advection, unit ℃/3h) at 00:00 (A), 12:00 on April 15th (B) and 00:00 (C), 06:00 (D), 12:00 (E), 18:00 (F) on April 16th
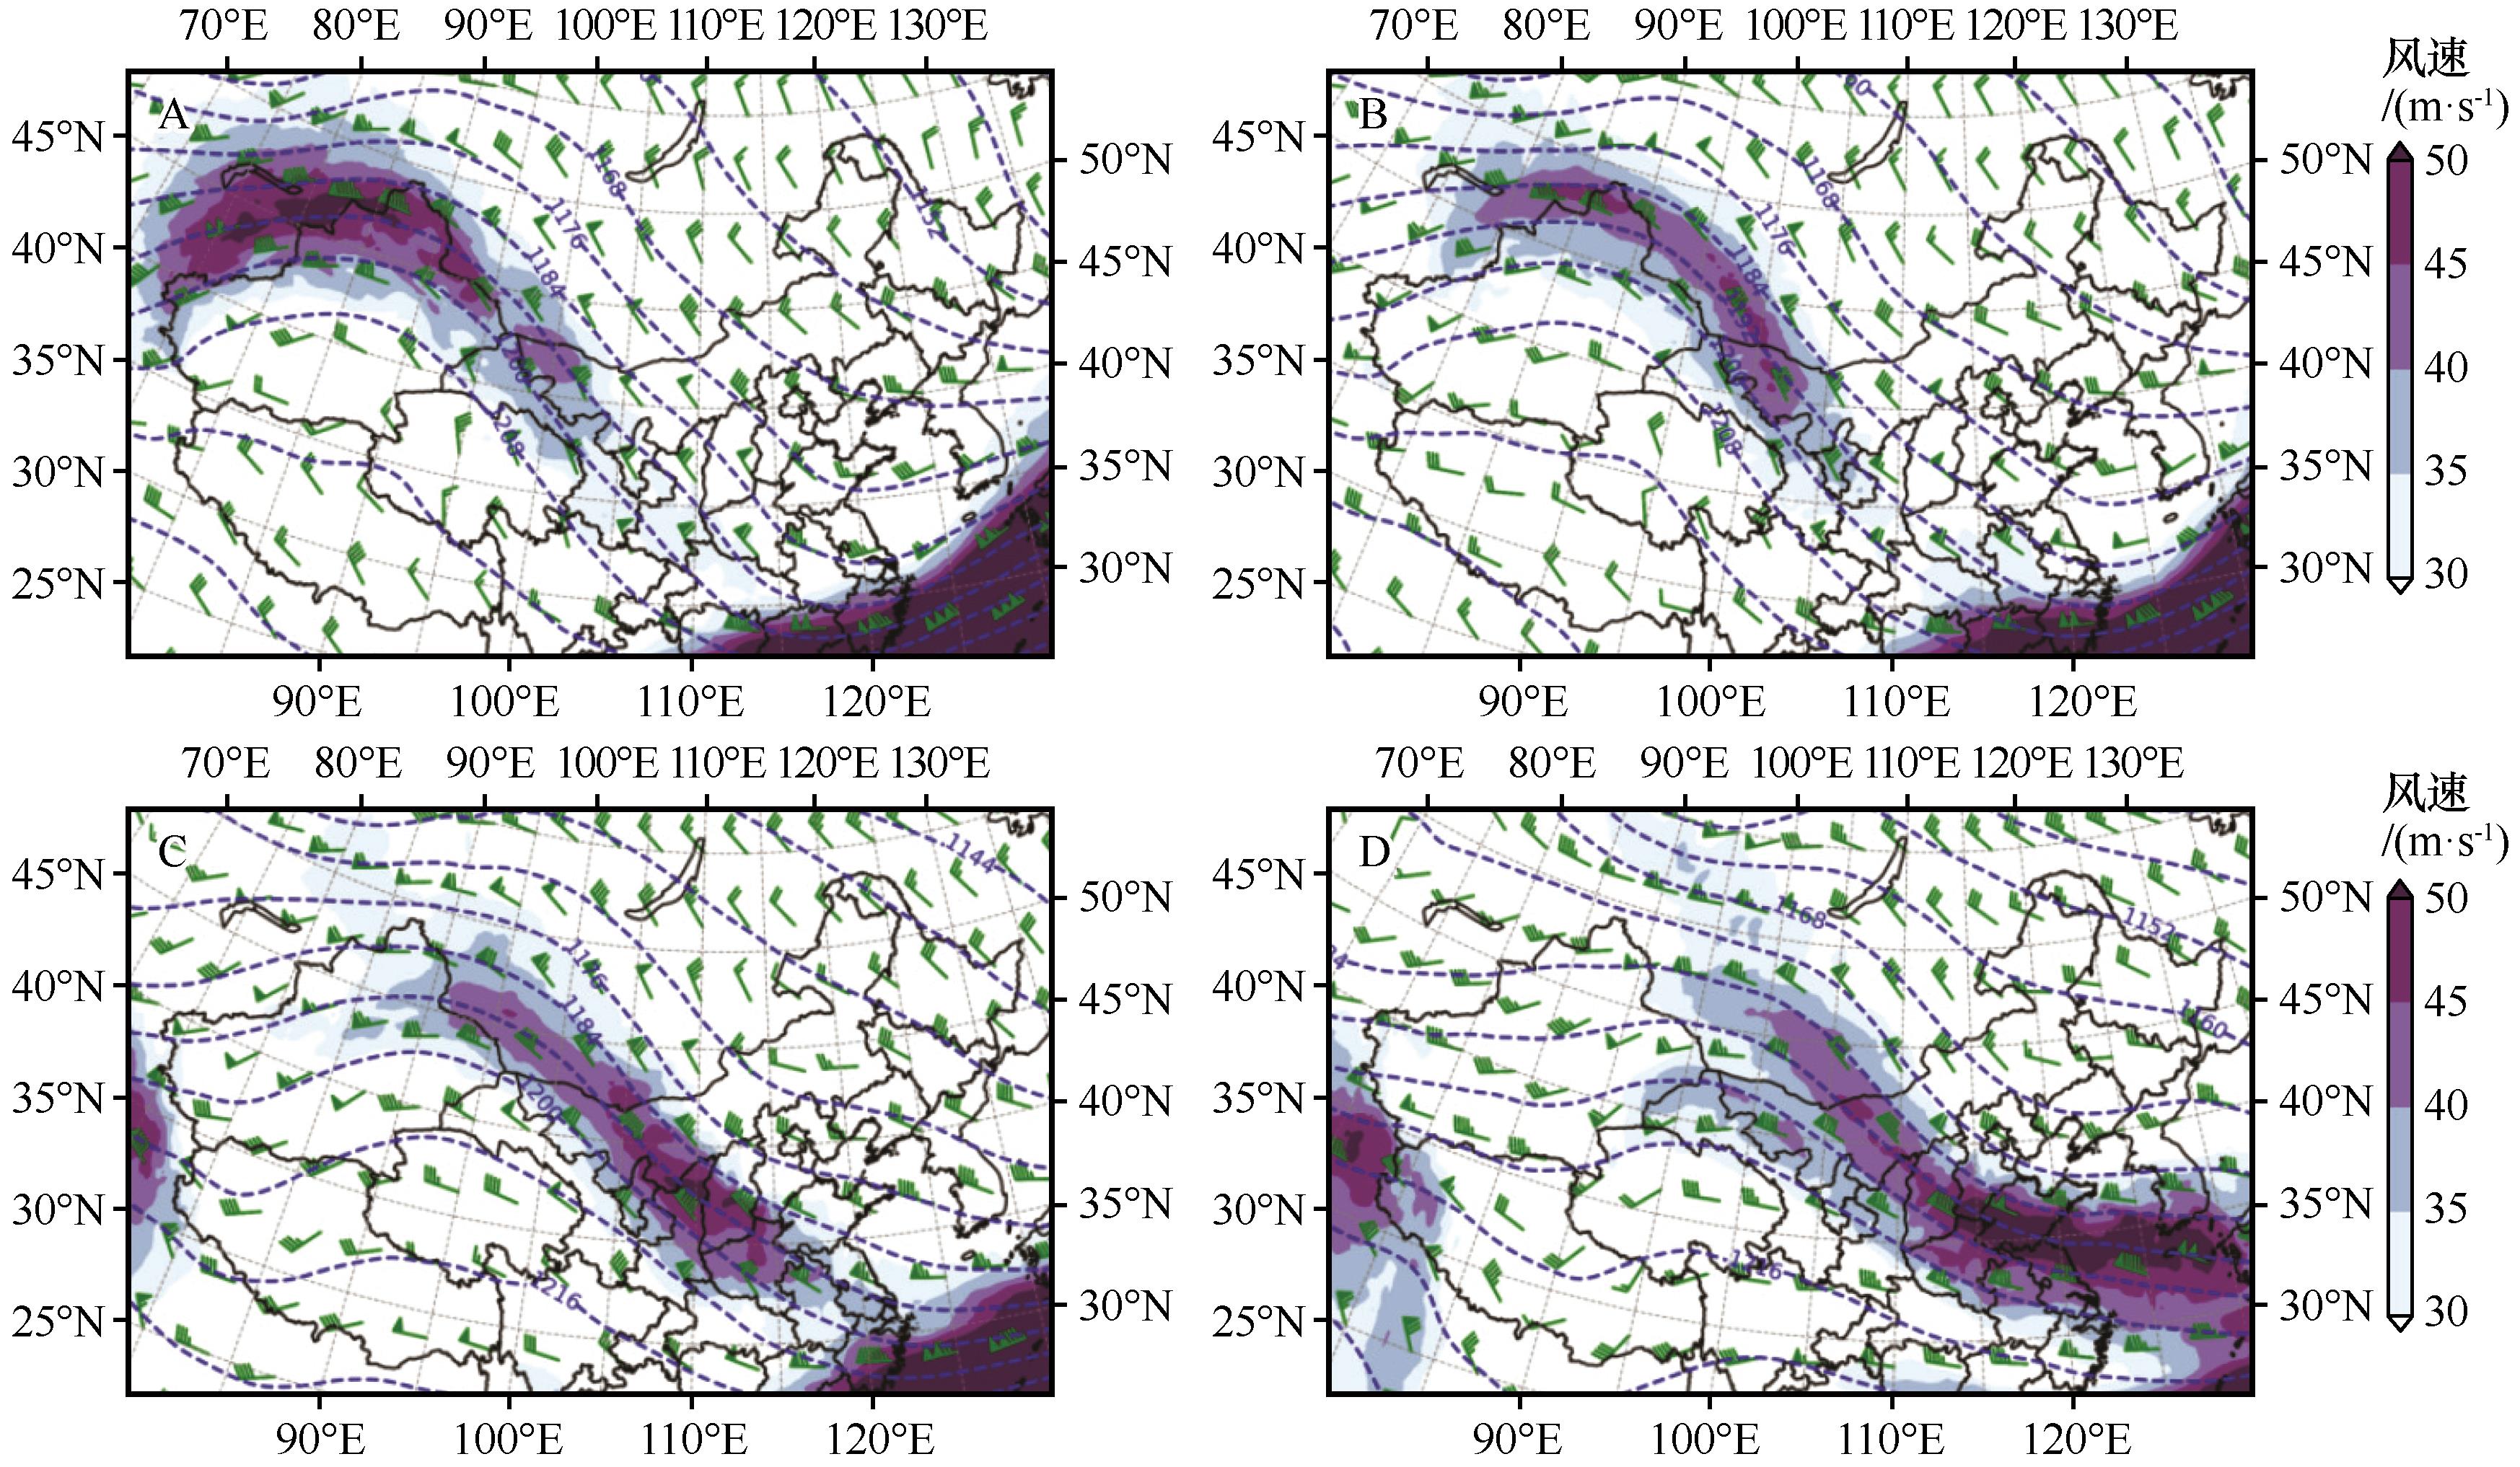
图12 4月15日00:00(A)、06:00(B)和16日00:00(C)、18:00(D) 200 hPa急流(填色区风速大于30 m·s-1)和位势高度(虚线等值线,单位dagpm)注:基于自然资源部标准地图服务网站标准地图(审图号:GS(2023)2762号)制作,底图边界无修改
Fig.12 The 200 hPa jet stream (wind speed in the colored area is greater than 30 m·s-1) and geopotential height (blue dotted contour line, unit dagpm) at 00:00 (A), 06:00 (B) on April 15th, 06:00 (C), 18:00 (D) on April 16th
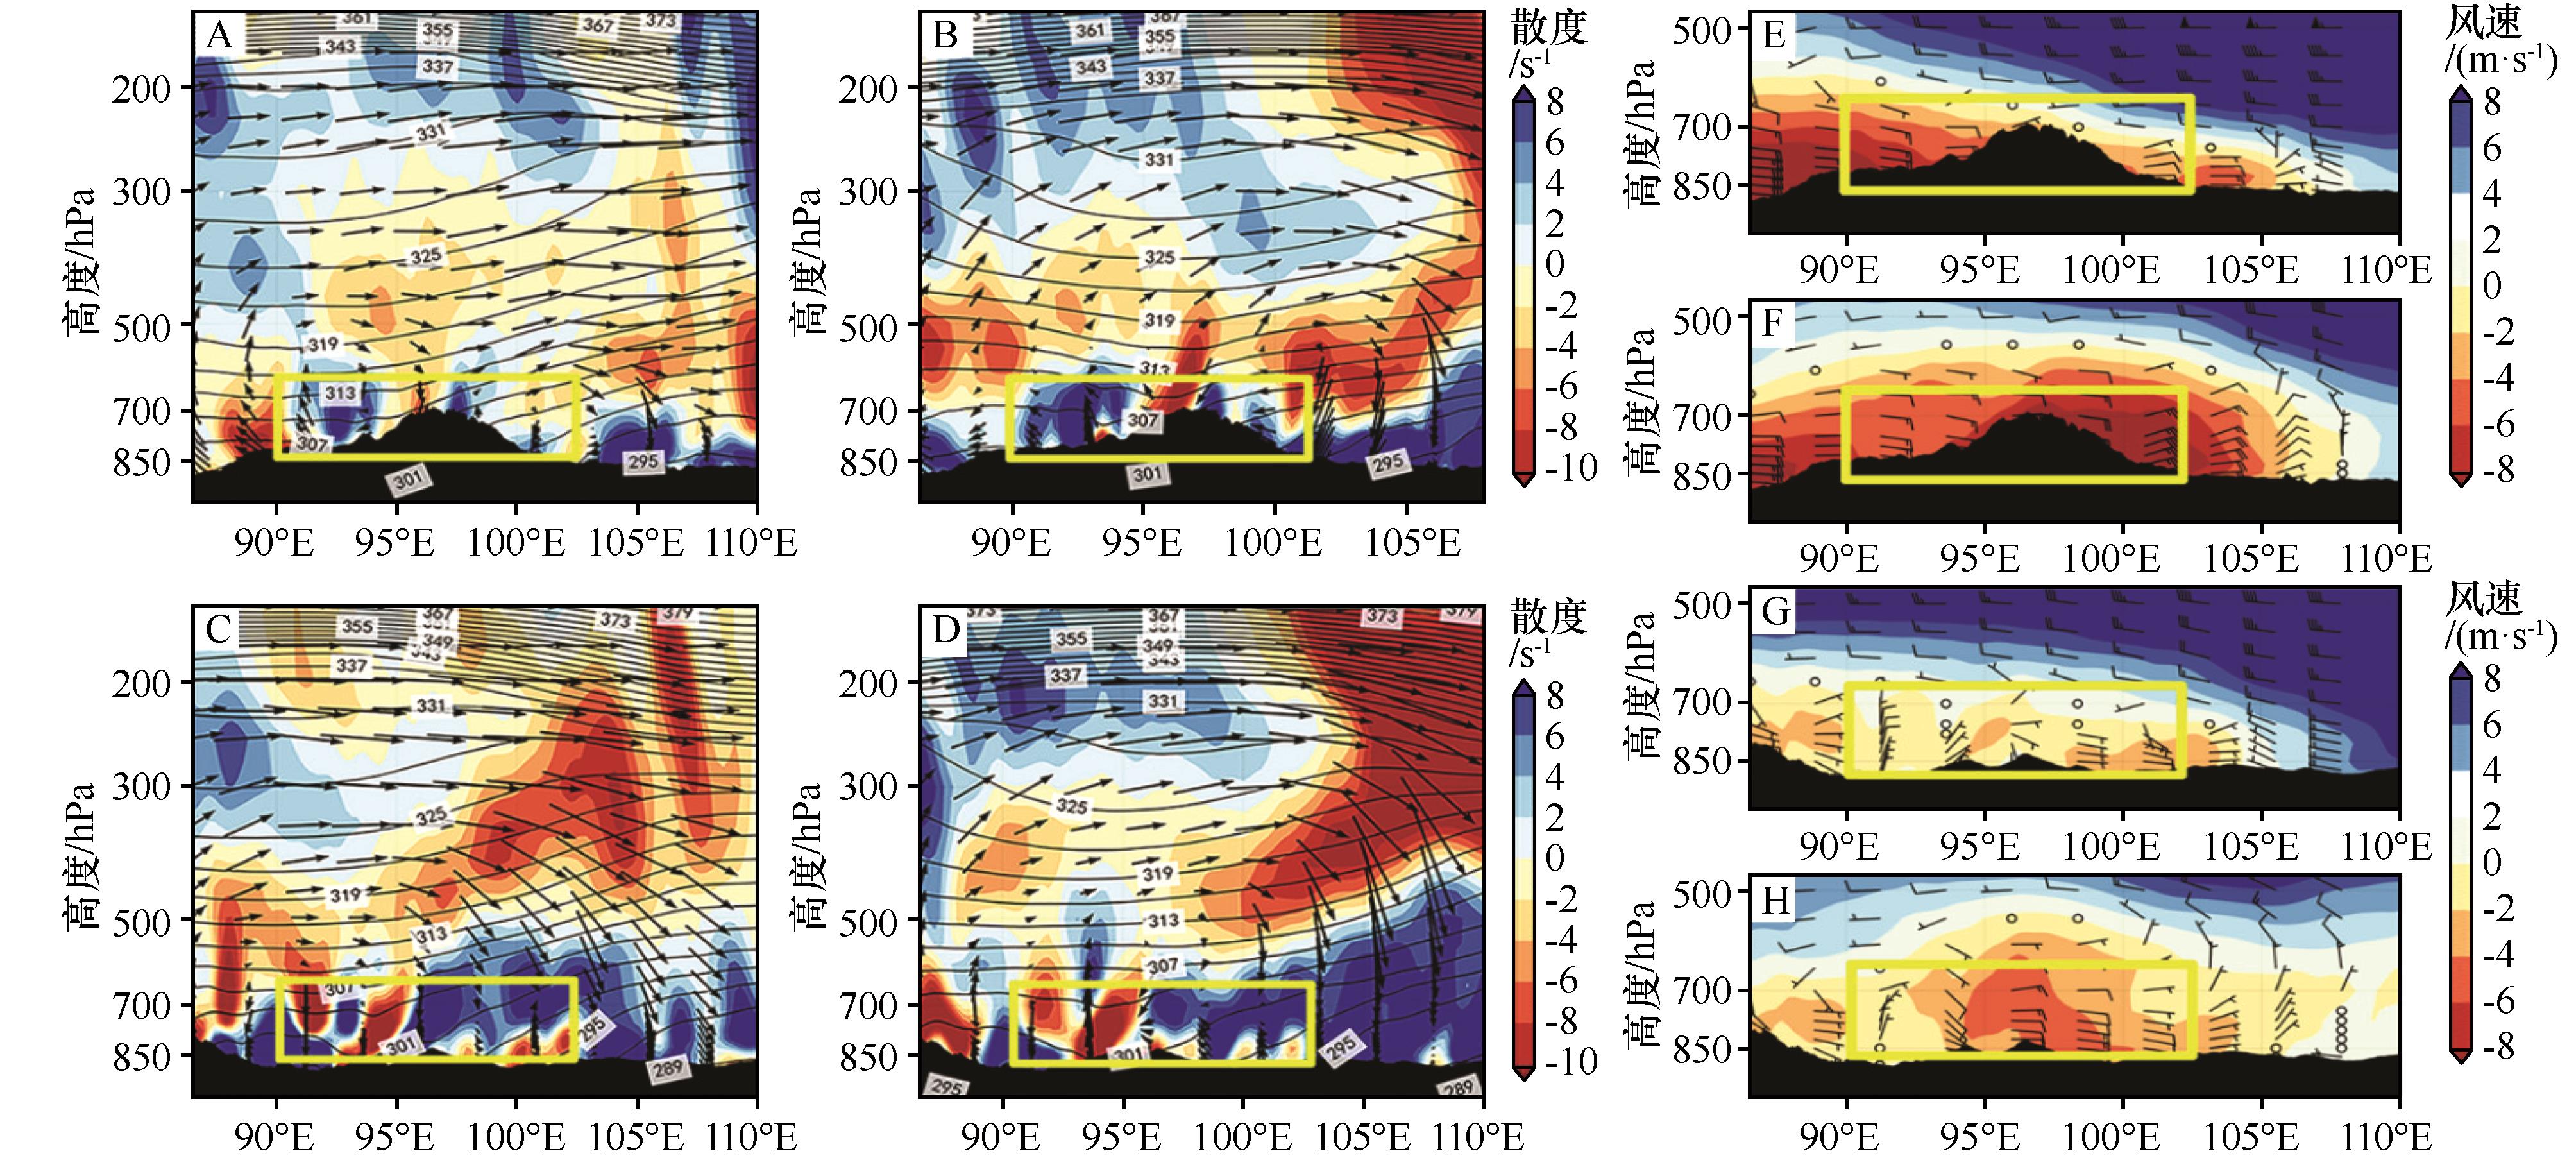
图13 河西走廊-祁连山脉(38°—41°N)上空在4月15日(A)与16日(B)的经向平均位温(黑色线条)、散度(红色表示辐合区,单位为s-1)与流场(矢量箭头)的垂直剖面,在15日(E)与16日(F)的风速(红色区为东风,单位为m·s-1)与合成风矢的经向剖面。戈壁沙漠西部(41°—44°N)上空在4月15日(C)与16日(D)的经向平均位温、散度与流场的垂直剖面,在15日(G)与16日(H)的风速与合成风矢的经向剖面。黄色线框为此次沙尘传输至青藏高原东北部的主要范围
Fig.13 The vertical profiles of the average potential temperature (black lines), divergence (red indicates the convergence area, unit is s-1), the flow field (vector arrow) on April 15th (A) and 16th (B), and the wind speed (the red area is easterly, unit is m·s-1) and the synthetic wind vector on April 15th (E) and 16th (F) over the Hexi Corridor-Qilian Mountains (38°-41°N); The vertical profiles of the average potential temperature (black lines), divergence (red indicates the convergence area, unit is s-1), the flow field (vector arrow) on April 15th (C) and 16th (D), and the wind speed (the red area is easterly, unit is m·s-1) and the synthetic wind vector on April 15th (G) and 16th (H) over the western Gobi Desert of Mongolia (41°-44°N)
| 1 | Huang J, Yu H, Guan X,et al.Accelerated dryland expansion under climate change[J].Nature Climate Change,2016,6(2):166-171. |
| 2 | Huang J, Yu H, Dai A,et al.Drylands face potential threat under 2 C global warming target[J].Nature Climate Change,2017,7(6):417-422. |
| 3 | Gillette D.Soil derived dust as a source of silica:aerosol properties,emissions,deposition,and transport[J].Journal of Exposure Analysis and Environmental Epidemiology,1997,7(3):303-311. |
| 4 | Houser C A, Nickling W G.The emission and vertical flux of particulate matter <10 μm from a disturbed clay‐crusted surface[J].Sedimentology,2001,48(2):255-267. |
| 5 | Middleton N J.Desert dust hazards:a global review[J].Aeolian Research,2017,24:53-63. |
| 6 | Miller O L, Solomon D K, Fernandez D P,et al.Evaluating the use of strontium isotopes in tree rings to record the isotopic signal of dust deposited on the Wasatch Mountains[J].Applied Geochemistry,2014,50:53-65. |
| 7 | Schepanski K.Transport of mineral dust and its impact on climate[J].Geosciences,2018,8(5):151. |
| 8 | Schulz M, Prospero J M, Baker A R,et al.Atmospheric transport and deposition of mineral dust to the ocean:implications for research needs[J].Environmental Science & Technology,2012,46(19):10390-10404. |
| 9 | Kurt-Karakus P B.Determination of heavy metals in indoor dust from Istanbul,Turkey:estimation of the health risk[J].Environment International,2012,50:47-55. |
| 10 | Zhang X Y, Gong S L, Zhao T L,et al.Sources of Asian dust and role of climate change versus desertification in Asian dust emission[J].Geophysical Research Letters,2003,30(24):018206. |
| 11 | Zhang X Y, Arimoto R, An Z S.Dust emission from Chinese desert sources linked to variations in atmospheric circulation[J].Journal of Geophysical Research:Atmospheres,1997,102(D23):28041-28047. |
| 12 | Huang J, Minnis P, Chen B,et al.Long‐range transport and vertical structure of Asian dust from CALIPSO and surface measurements during PACDEX[J].Journal of Geophysical Research:Atmospheres,2008,113(D23):010620. |
| 13 | Huang J, Minnis P, Lin B,et al.Possible influences of Asian dust aerosols on cloud properties and radiative forcing observed from MODIS and CERES[J].Geophysical Research Letters,2006,33(6):024724. |
| 14 | Qian Y, Flanner M, Leung L R,et al.Sensitivity studies on the impacts of Tibetan Plateau snowpack pollution on the Asian hydrological cycle and monsoon climate[J].Atmospheric Chemistry and Physics,2011,11:1929-1948. |
| 15 | Chen S, Huang J, Kang L,et al.Emission,transport and radiative effects of mineral dust from Taklimakan and Gobi Deserts:comparison of measurements and model results[J].Atmospheric Chemistry and Physics,2017,17(3):1-43. |
| 16 | Vova O, Kappas M, Renchin T,et al.Land degradation assessment in Gobi-Altai province[J].Building Resilience of Mongolian Rangelands,2015,2(1):54. |
| 17 | 李晓岚,张宏升.2010年春季北京地区强沙尘暴过程的微气象学特征[J].气候与环境研究,2012,17(4):400-408. |
| 18 | Dagvadorj D.Mongolia second national communication under the United Nations framework convention on climate change[R].Ulaanbaatar,Mongolia:Ministry of Nature,Environment and Tourism,2010. |
| 19 | 张凯,高会旺,张仁健,等.我国沙尘的来源、移动路径及对东部海域的影响[J].地球科学进展,2005,20(6):627-636. |
| 20 | Kai Z, Huiwang G.The characteristics of Asian-dust storms during 2000-2002:from the source to the sea[J].Atmospheric Environment,2007,41(39):9136-9145. |
| 21 | 罗勇.青藏高原冬春季雪盖对东亚夏季大气环流影响的研究[J].高原气象,1995,14(4):505-512. |
| 22 | Shichang K, Wake C P, Dahe Q,et al.Monsoon and dust signals recorded in Dasuopu glacier,Tibetan Plateau[J].Journal of Glaciology,2000,46(153):222-226. |
| 23 | Kang S, Xu Y, You Q,et al.Review of climate and cryospheric change in the Tibetan Plateau[J].Environmental Research Letters,2010,5(1):015101. |
| 24 | Chen S Y, Zhao C, Qian Y,et al.Regional modeling of dust mass balance and radiative forcing over East Asia using WRFChem[J].Aeolian Research,2014,15:15-30. |
| 25 | Chen S, Huang J, Qian Y,et al.An overview of mineral dust modeling over East Asia[J].Journal of Meteorological Research,2017,31(4):633-653. |
| 26 | 韩永翔,奚晓霞,宋连春,等.青藏高原沙尘及其可能的气候意义[J].中国沙漠,2004,24(5):588-592. |
| 27 | 马耀明,胡泽勇,田立德,等.青藏高原气候系统变化及其对东亚区域的影响与机制研究进展[J].地球科学进展,2014,29(2):207-215. |
| 28 | Huang J, Ge J, Weng F.Detection of Asia dust storms using multisensor satellite measurements[J].Remote Sensing of Environment,2007,110(2):186-191. |
| 29 | Chen Y, Chen S, Zhao D,et al.The role of boundary layer height in India on transboundary pollutions to the Tibetan Plateau[J].Science of The Total Environment,2022,837:155816. |
| 30 | Chen S, Huang J, Zhao C,et al.Modeling the transport and radiative forcing of Taklimakan dust over the Tibetan Plateau:a case study in the summer of 2006[J].Journal of Geophysical Research:Atmospheres,2013,118(2):797-812. |
| 31 | Feng X, Mao R, Gong D Y,et al.Increased dust aerosols in the high troposphere over the Tibetan Plateau from 1990s to 2000s[J].Journal of Geophysical Research:Atmospheres,2020,125(13):032807. |
| 32 | DeFries R S, Townshend J R G.NDVI-derived land cover classifications at a global scale[J].International Journal of Remote Sensing,1994,15(17):3567-3586. |
| 33 | Kim D, Chin M, Bian H,et al.The effect of the dynamic surface bareness on dust source function,emission,and distribution[J].Journal of Geophysical Research:Atmospheres,2013,118(2):871-886. |
| 34 | Kim D, Chin M, Remer L A,et al.Role of surface wind and vegetation cover in multi-decadal variations of dust emission in the Sahara and Sahel[J].Atmospheric Environment,2017,148:282-296. |
| 35 | Ginoux P, Chin M, Tegen I,et al.Sources and distributions of dust aerosols simulated with the GOCART model[J].Journal of Geophysical Research:Atmospheres,2001,106(D17):20255-20273. |
| 36 | Grell G A, Peckham S E, Schmitz R,et al.Fully coupled “online” chemistry within the WRF model[J].Atmospheric Environment,2005,39(37):6957-6975. |
| 37 | Chen F, Dudhia J.Coupling an advanced land surface-hydrology model with the Penn State-NCAR MM5 modeling system.Part I:model implementation and sensitivity[J].Monthly Weather Review,2001,129(4):569-585. |
| 38 | Hong S Y, Noh Y, Dudhia J.A new vertical diffusion package with an explicit treatment of entrainment processes[J].Monthly Weather Review,2006,134(9):2318-2341. |
| 39 | Grell G A, Dévényi D.A generalized approach to parameterizing convection combining ensemble and data assimilation techniques[J].Geophysical Research Letters,2002,29(14):38-1-38-4. |
| 40 | Thompson G, Rasmussen R M, Manning K.Explicit forecasts of winter precipitation using an improved bulk microphysics scheme.Part I:description and sensitivity analysis[J].Monthly Weather Review,2004,132(2):519-542. |
| 41 | Iacono M J, Delamere J S, Mlawer E J,et al.Radiative forcing by long‐lived greenhouse gases:calculations with the AER radiative transfer models[J].Journal of Geophysical Research:Atmospheres,2008,113(D13):009944. |
| [1] | 曹佳慧, 陈思宇, 张潮, 连露露, 赵丹, 杜世康. 青藏高原沙尘的外源贡献[J]. 中国沙漠, 2024, 44(2): 57-65. |
| [2] | 莫皓焜, 胡光印, 孟惠聪. 青海湖地区风沙活动研究进展[J]. 中国沙漠, 2023, 43(6): 197-209. |
| [3] | 董祝雷, 姜学恭, 衣娜娜, 许志丽, 杭月荷, 于水燕. 风速和植被对内蒙古地区沙尘天气影响的数值模拟[J]. 中国沙漠, 2023, 43(6): 29-39. |
| [4] | 李亚云, 成巍, 王宁, 李欣, 高睿. 塔克拉玛干沙漠和戈壁沙漠春季沙尘暴特征及其气象影响因素对比[J]. 中国沙漠, 2023, 43(4): 1-9. |
| [5] | 胡梦珺, 庄静, 孙文丽, 郑登友, 吉天琪, 许澳康. 青藏高原东北部全新世常量元素地球化学特征及环境演变[J]. 中国沙漠, 2023, 43(2): 11-20. |
| [6] | 郝爱华, 薛娴, 尤全刚, 勾朝阳. 青藏高原近60年降水变化研究进展[J]. 中国沙漠, 2023, 43(2): 43-52. |
| [7] | 胡菁菁, 胡光印, 董治宝. 黄河源区玛多盆地沙漠化土地粒度特征[J]. 中国沙漠, 2022, 42(4): 242-252. |
| [8] | 陈思宇, 贯雅雯, 赵丹, 娄高僮, 陈渔. 东亚沙尘气候效应对地面温度日较差影响的数值模拟[J]. 中国沙漠, 2022, 42(3): 127-138. |
| [9] | 曾方明, 薛红盼. 青藏高原东北部晚第四纪黄土-古土壤元素组成数据集[J]. 中国沙漠, 2021, 41(6): 262-264. |
| [10] | 曾方明, 薛红盼. 青藏高原东北部晚第四纪黄土-古土壤的元素组成及其物源指示[J]. 中国沙漠, 2020, 40(6): 105-117. |
| [11] | 胡光印, 董治宝, 张正偲, 周明, 尚伦宇. 若尔盖盆地起沙风风况与输沙势特征[J]. 中国沙漠, 2020, 40(5): 20-24. |
| [12] | 衣娜娜, 姜学恭, 董祝雷, 于水燕, 康晟炜. 内蒙古一次沙尘过程的数值模拟[J]. 中国沙漠, 2020, 40(3): 115-126. |
| [13] | 张芝娟, 衣育红, 陈斌, 杜晖. 2018年春季中国北方大范围沙尘天气对城市空气质量的影响及其天气学分析[J]. 中国沙漠, 2019, 39(6): 13-22. |
| [14] | 贾瑞, 刘玉芝, 吴楚樵, 祝清哲, 汪兵. 2007-2017年中国沙尘气溶胶的三维分布特征及输送过程[J]. 中国沙漠, 2019, 39(6): 108-117. |
| [15] | 蒋盈沙, 高艳红, 潘永洁, 李霞. 青藏高原及其周边区域沙尘天气的时空分布特征[J]. 中国沙漠, 2019, 39(4): 83-91. |
| 阅读次数 | ||||||
|
全文 |
|
|||||
|
摘要 |
|
|||||
©2018中国沙漠 编辑部
地址: 兰州市天水中路8号 (730000)
电话:0931-8267545
Email:caiedit@lzb.ac.cn;desert@lzb.ac.cn

 甘公网安备 62010202000688号