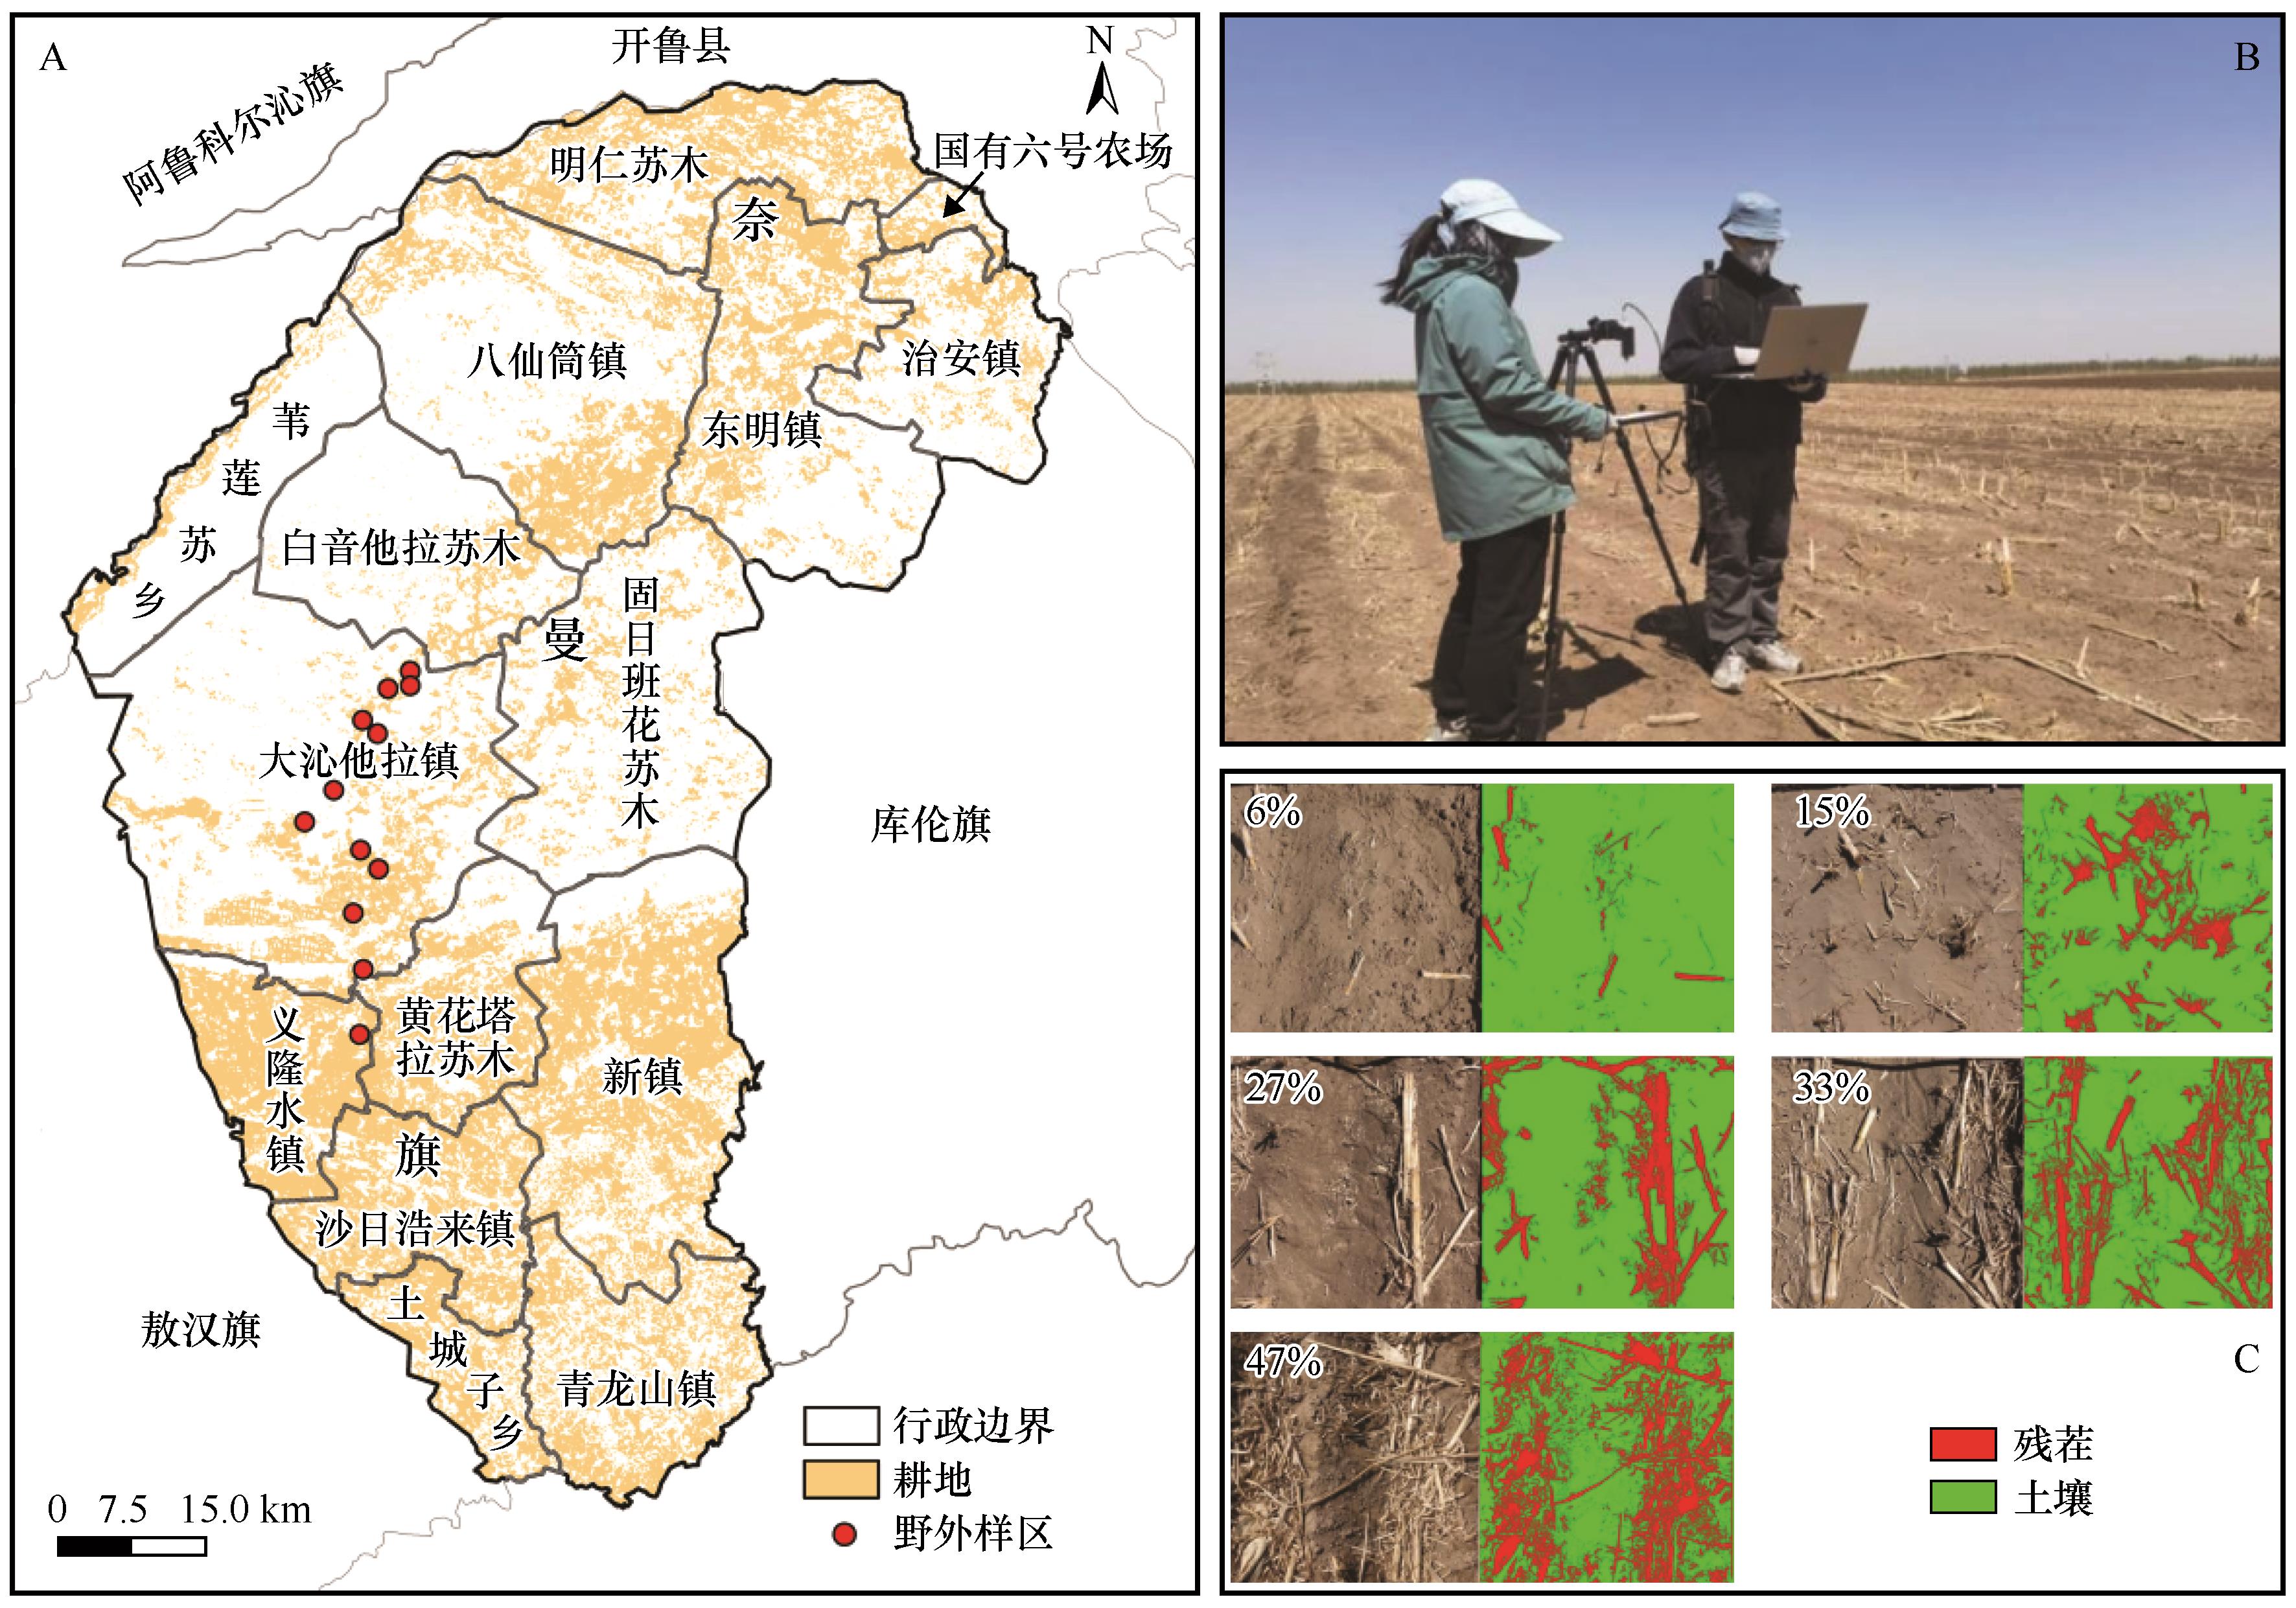
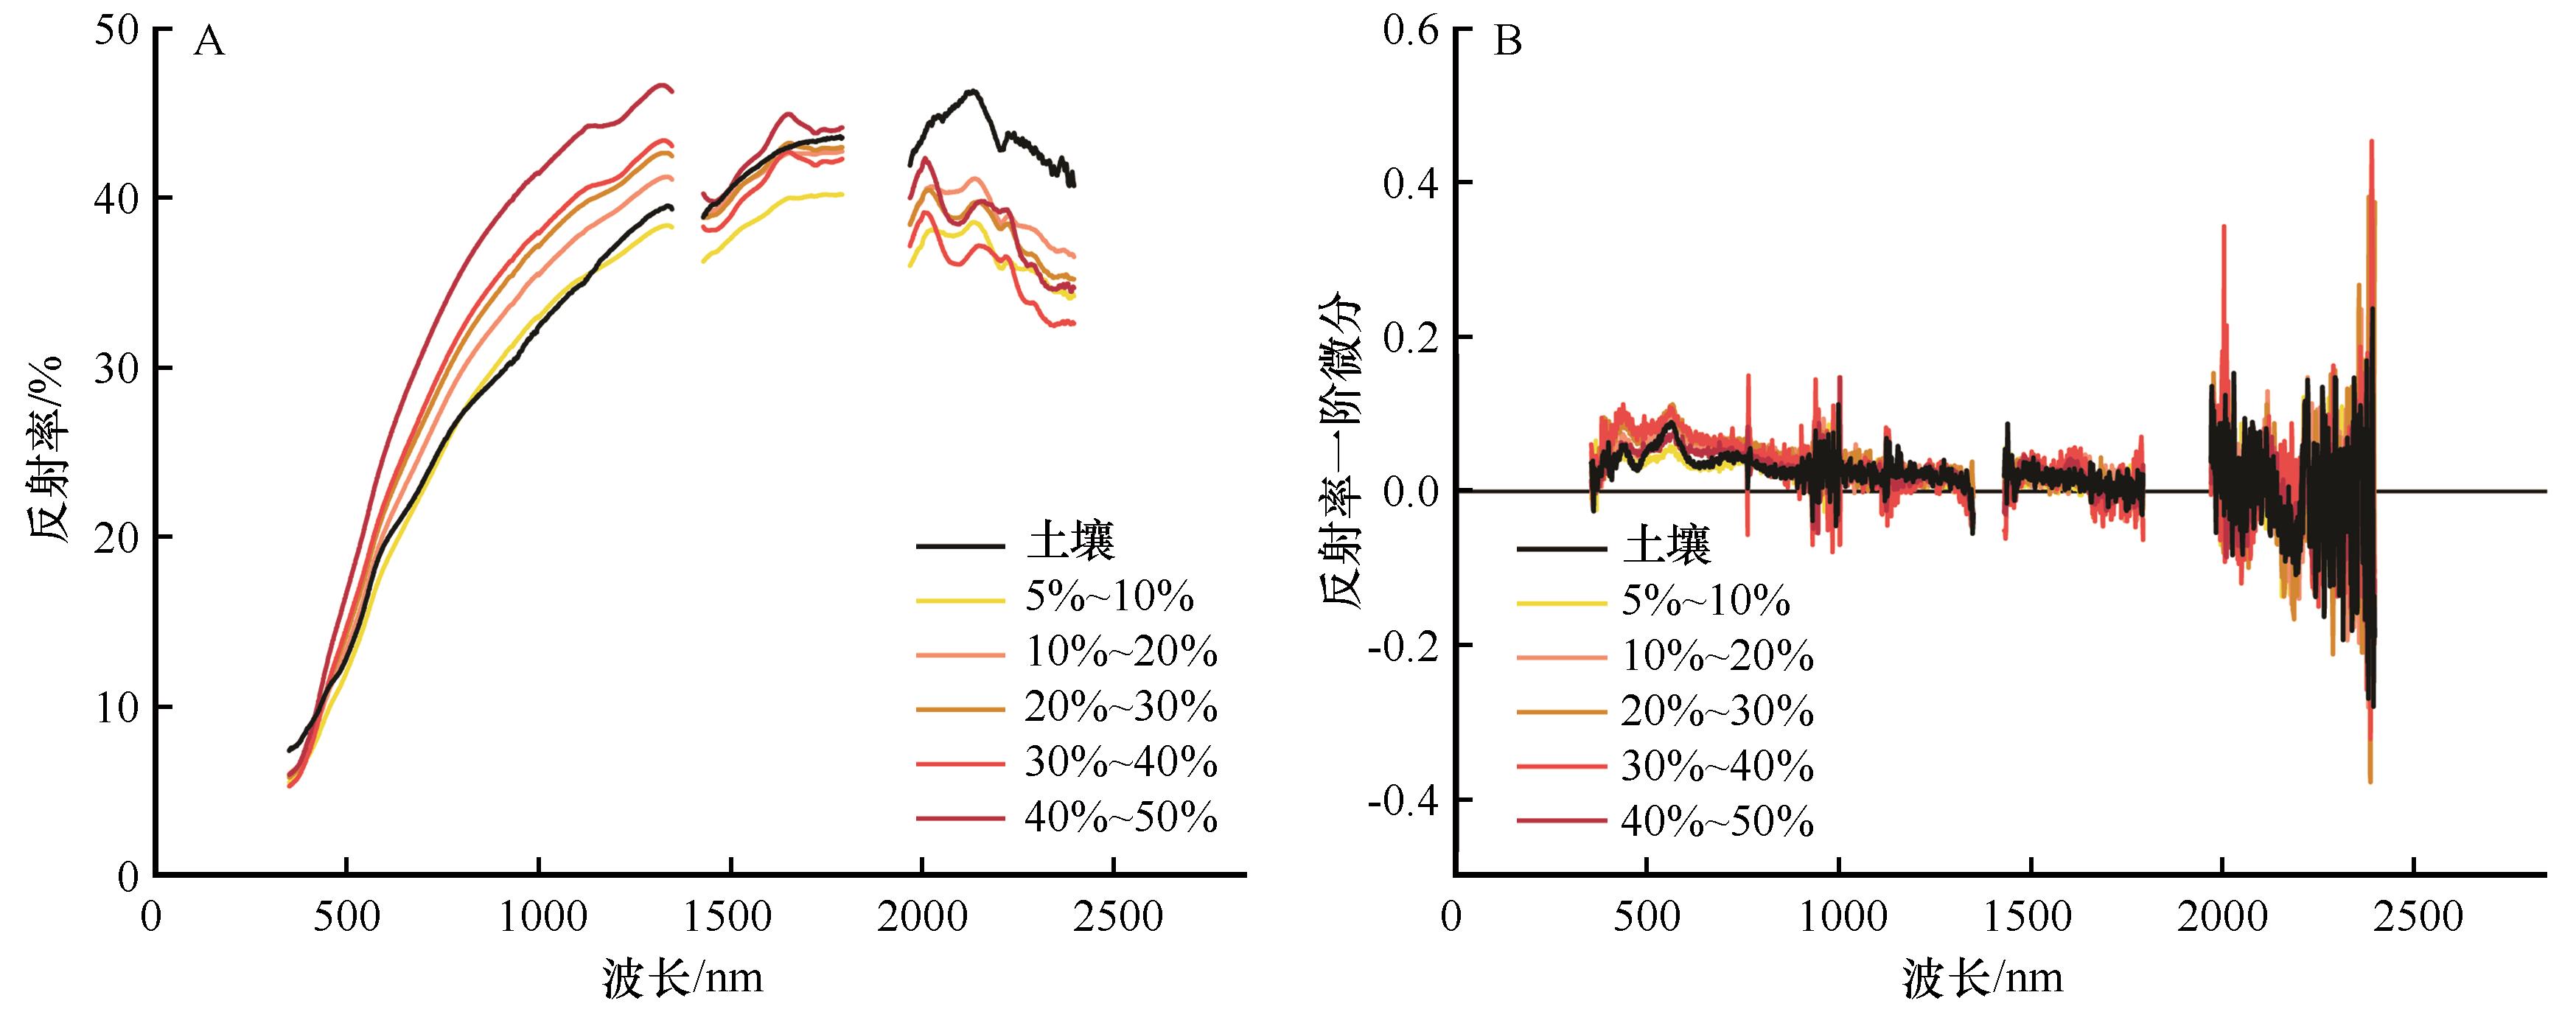
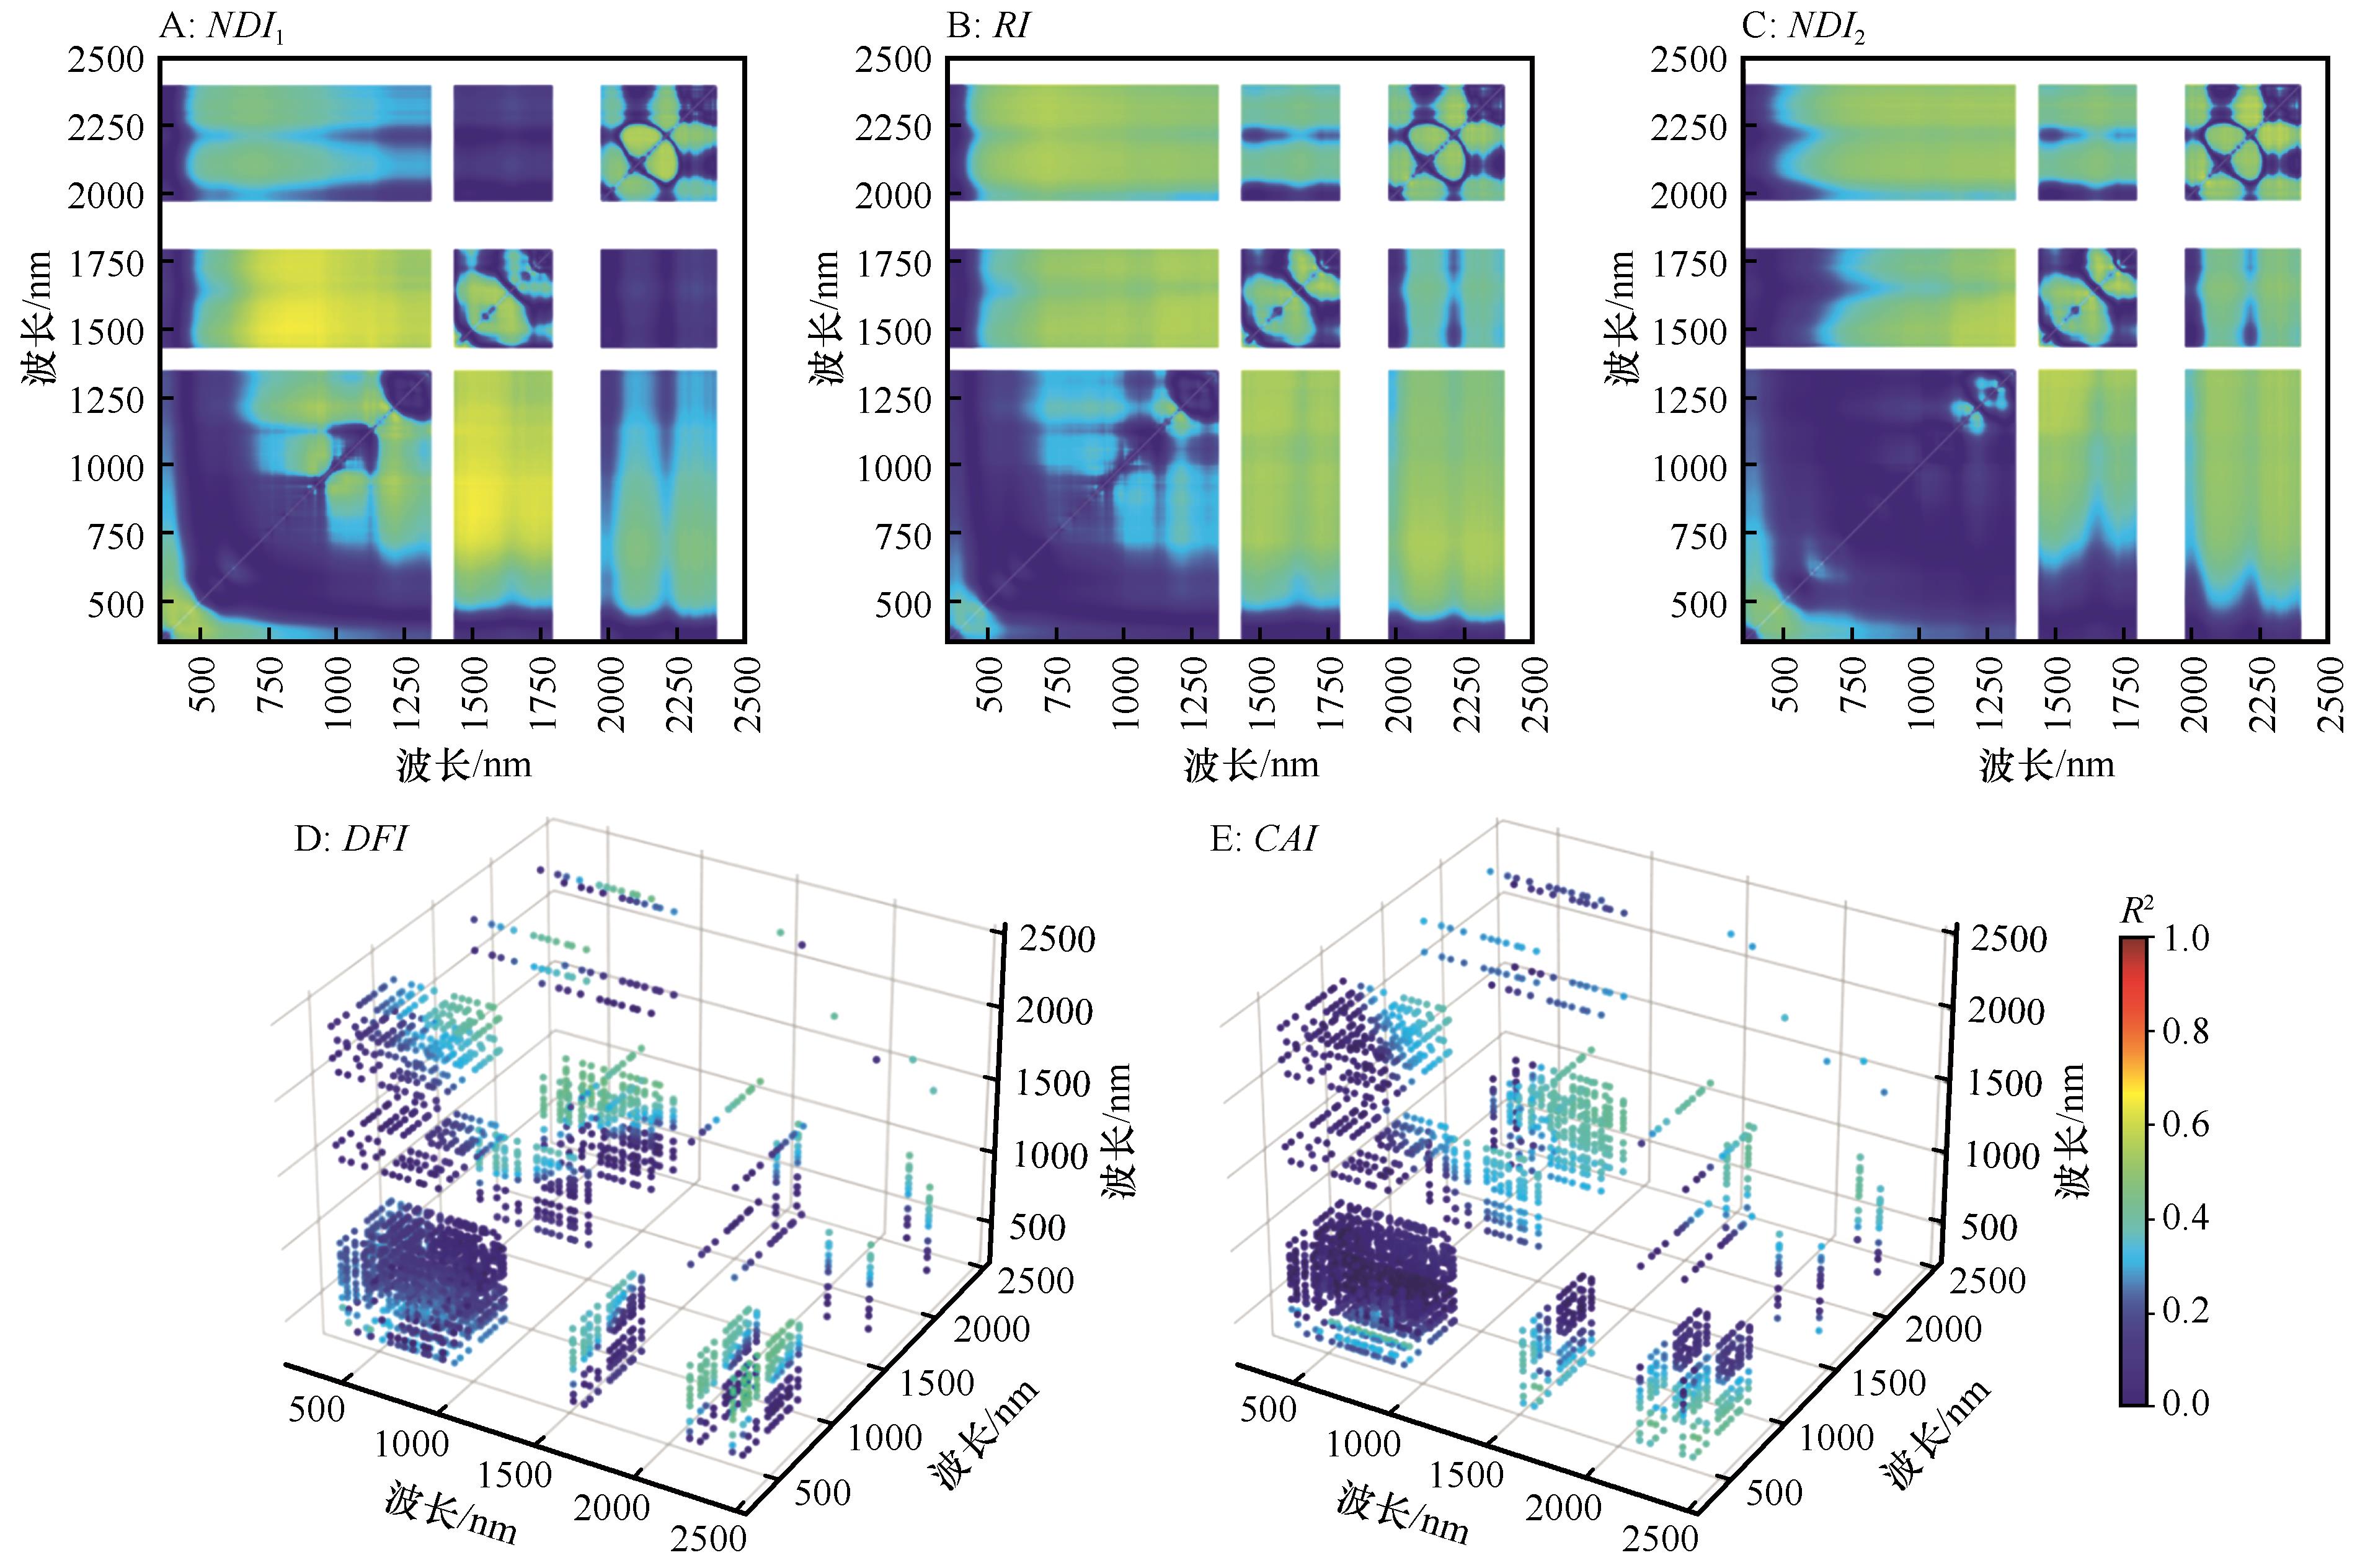
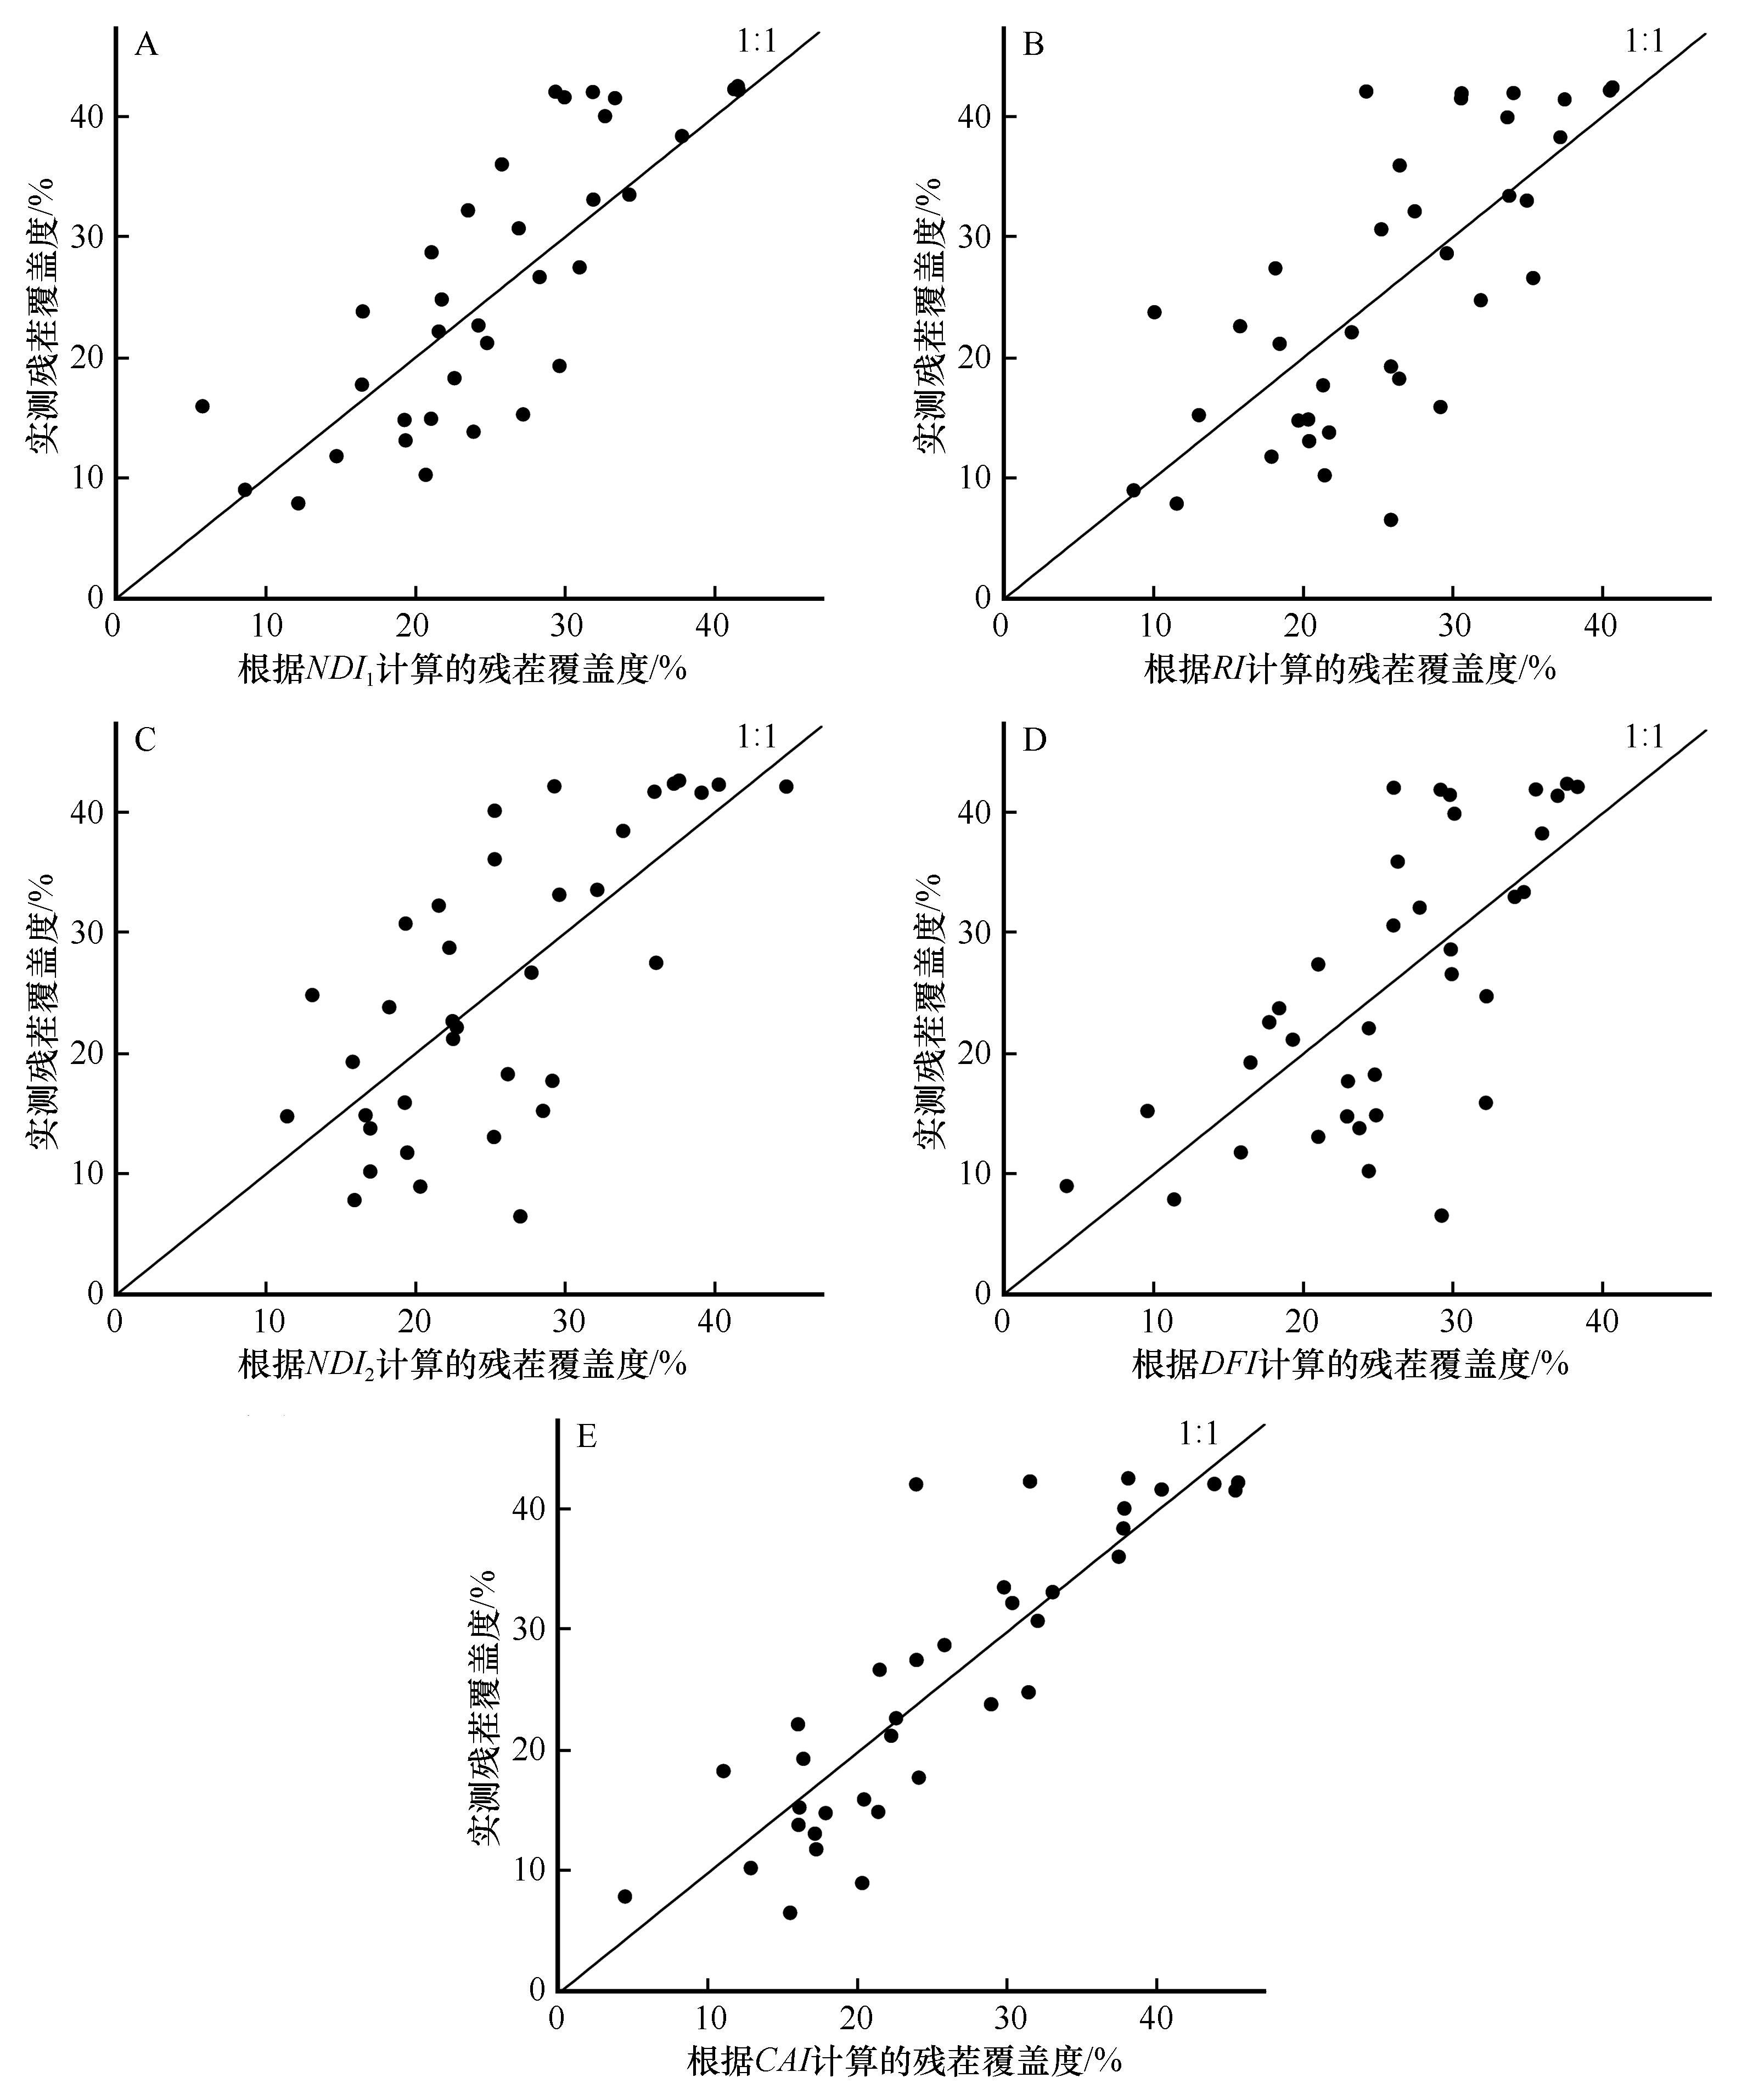
| [1] |
刘红,王卫,郝彦莉,等.基于风蚀模型的河北省土壤风蚀风险评价[J].水土保持通报,2016,36(2):12-17.
|
| [2] |
王涛,吴薇,薛娴,等.近50年来中国北方沙漠化土地的时空变化[J].地理学报,2004(2):203-212.
|
| [3] |
邹学勇,张春来,程宏,等.土壤风蚀模型中的影响因子分类与表达[J].地球科学进展,2014,29(8):875-889.
|
| [4] |
蔺阿荣,周冬梅,马静,等.基于RWEQ模型的疏勒河流域防风固沙功能价值评估[J].干旱区地理,2024,47(1):58-67.
|
| [5] |
谭锦,吴秀芹,阮永健,等.油莎豆(Cyperus esculentus)耕作区作物残茬对农田风蚀的影响[J].干旱区地理,2022,45(2):546-556.
|
| [6] |
刘玉璋,董光荣,李长治.影响土壤风蚀主要因素的风洞实验研究[J].中国沙漠,1992,12(4):44-52.
|
| [7] |
董治宝,高尚玉, Fryrear D W.直立植物-砾石覆盖组合措施的防风蚀作用[J].水土保持学报,2000,14(1):7-11.
|
| [8] |
赵永来,陈智,孙悦超,等.作物残茬覆盖农田地表风沙流分布规律[J].中国农业大学学报,2013,18(2):38-44.
|
| [9] |
Dao T H.Tillage and winter wheat residue management effects on water infiltration and storage[J].Soil Science Society of America Journal,1993,57(57):1586-1595.
|
| [10] |
Gausman H W, Gerbermann A H, Wiegand C L,et al.Reflectance differences between crop residues and bare soils[J].Soil Science Society of America Journal,1975,39(4):752-755.
|
|
Mcmurtrey Iii J E, Narayanan R M, Kalshoven J E,et al.Fluorescence of crop residue:postmortem analysis of crop conditions[J].Proceedings of SPIE-The International Society for Optical Engineering,1997,3059:76-86.
|
| [11] |
Daughtry C S T, Mcmurtrey J E, Chappelle E W,et al.Potential for discriminating crop residues from soil by reflectance and fluorescence[J].Agronomy Journal,1995,87(2):165-171.
|
| [12] |
Daughtry C S T, Mcmurtrey J E, Chappelle E W,et al.Measuring crop residue cover using remote sensing techniques[J].Theoretical and Applied Climatology,1996,54(1/2):17-26.
|
| [13] |
Elvidge C D.Visible and near-infrared reflectance characteristics of dry plant materials[J].International Journal of Remote Sensing,1990,11(10):1775-1795.
|
| [14] |
Kokaly R F, Asner G P, Ollinger S V,et al.Characterizing canopy biochemistry from imaging spectroscopy and its application to ecosystem studies[J].Remote Sensing of Environment,2009,113(S1):78-91.
|
| [15] |
V De Ven, Fryrear T V, Spaan W P,et al.Vegetation characteristics and soil loss by wind[J].Journal of Soil and Water Conservation,1989,44(4):347-349.
|
| [16] |
Qi J, Marsett R, Heilman P,et al.Ranges improves satellite-based information and land cover assessments in southwest United States[J].Eos,Transactions American Geophysical Union,2002,83(51):601-606.
|
| [17] |
Gelder B K, Kaleita A L, Cruse R M.Estimating mean field residue cover on midwestern soils using satellite imagery[J].Agronomy Journal,2009,101(3):635-643.
|
| [18] |
Mcnairn H, Duguay C, Boisvert J,et al.Defining the sensitivity of multi-frequency and multi-polarized radar backscatter to post-harvest crop residue[J].Canadian Journal of Remote Sensing,2002,80(2):308-320.
|
| [19] |
刘之榆,刘忠,万炜,等.SAR与光学遥感影像的玉米秸秆覆盖度估算[J].遥感学报,2021,25(6):1308-1323.
|
| [20] |
Jia J X, Gen S F, Li P Y,et al.Estimation of the relative chlorophyll content of carya illinoensis leaves using fractional order derivative of leaf and canopy scale hyperspectral data[J].Journal of Soil Science and Plant Nutrition,2024,24:1407-1423.
|
| [21] |
Dong Y, Xuan F, Li Z,et al.Modeling the corn residue coverage after harvesting and before sowing in northeast China by random forest and soil texture zoning[J].Remote Sensing,2023,15(8):2179.
|
| [22] |
Khanal S, Kushal K C, Fulton J P,et al.Remote sensing in agriculture:accomplishments,limitations,and opportunities[J].Remote Sensing,2020,12(22):3783.
|
| [23] |
Lamb B T, Dennison P E, Hively W D,et al.Optimizing Landsat next shortwave infrared bands for crop residue characterization[J].Remote Sensing,2022,14(23):6128.
|
| [24] |
Hively W D, Lamb B T, Daughtry C S T,et al.Mapping crop residue and tillage intensity using WorldView-3 satellite shortwave infrared residue indices[J].Remote Sensing,2018,10(10):1657.
|
| [25] |
Huete A, Didan K, Miura T,et al.Overview of the radiometric and biophysical performance of the MODIS vegetation indices[J].Remote Sensing of Environment,2002,83(1/2):195-213.
|
| [26] |
Rouse J W, Haas R H, Deering D W,et al.Monitoring the vernal advancement of retrogradation (green wave effect) of natural vegetation[R]. Greenbelt,MD,USA:NASA/GSFC,1974.
|
| [27] |
Serrano L, Peñuelas J, Ustin S L.Remote sensing of nitrogen and lignin in Mediterranean vegetation from AVIRIS data[J].Remote Sensing of Environment,2002,81(2/3):355-364.
|
| [28] |
Xin C, Jin C B.Matsushita,et al.Developing a MODIS-based index to discriminate dead fuel from photosynthetic vegetation and soil background in the Asian steppe area[J].International Journal of Remote Sensing,2010,31(6):1589-1604.
|
| [29] |
Liu T, Wu X, Dong Y.Analysis on vegetation coverage of grassland desertification based on TM image[J].Journal of Arid Land Resources and Environment,2010,24(1):141-144.
|
| [30] |
王旭洋.基于不同风蚀模型的中国北方农牧交错带风蚀潜力研究[D].石家庄:河北师范大学,2020.
|
| [31] |
郭中领.RWEQ模型参数修订及其在中国北方应用研究[D].北京:北京师范大学,2012.
|
| [32] |
刘轩,周杰,卢静,等.多源植被遥感产品应用于干旱监测的不确定性分析[J].遥感学报,2024,28(9):2383-2404.
|
| [33] |
Blanco-Canqui H, Tatarko J, Stalker A L,et al.Impacts of corn residue grazing and baling on wind erosion potential in a semiarid environment[J].Soil Science Society of America Journal,2016,80(4):1027-1037.
|
| [34] |
徐斌,刘新民,赵学勇.内蒙古奈曼旗中部农田土壤风蚀及其防治[J].水土保持学报,1993,7(2):75-80.
|
| [35] |
陈悠,李振山,王怡.半干旱区植被风沙动力过程耦合研究:Ⅲ.应用[J].中国沙漠,2009,29(1):39-45.
|
 ), 甄天乐1, 李继峰1,2(

 甘公网安备 62010202000688号