中国沙漠 ›› 2026, Vol. 46 ›› Issue (5): 300-313.DOI: 10.7522/j.issn.1000-694X.2026.00148
• • 上一篇
张雅梅1( ), 宋美垚2, 贾冬梅1()
收稿日期:2026-06-22
修回日期:2026-08-15
出版日期:2026-09-20
发布日期:2026-11-02
通讯作者:
贾冬梅
作者简介:张雅梅(1975—),女,内蒙古赤峰人,硕士,高级实验师,主要从事植物保护与宏观生理生态交叉研究。E-mail: yameizhang@jlu.edu.cn
Yamei Zhang1(), Meiyao Song2, Dongmei Jia1()
Received:2026-06-22
Revised:2026-08-15
Online:2026-09-20
Published:2026-11-02
Contact:
Dongmei Jia
摘要:
在全球气候变化加剧的背景下,探明植被光合生理信号与总初级生产力的时空分异特征及其水热驱动机制,是准确评估全球碳汇潜力的关键。本研究基于2002—2024年全球LHSIF和TRAX GPP数据,分析了全球植被日光诱导叶绿素荧光(SIF)和总初级生产力(GPP,以C计量)的时空变化及其关键水热驱动因素。结果表明:全球植被SIF和GPP的年际变化速率中位数分别为5.48×10⁻⁴ mW·m⁻²·sr⁻¹·nm⁻¹·a⁻¹和7.5×10⁻3 g·m⁻²·d⁻¹·a⁻¹;变化趋势整体以稳定和上升为主,SIF显著上升和下降区域分别占29.88%和8.64%,GPP分别占31.07%和21.56%,部分区域的光合生理信号未能同步转化为生态系统碳固定能力;SIF主要受热量或辐射因子驱动(相对贡献为57.87%),GPP则更受水分因子驱动(相对贡献为55.95%),SIF与GPP的主导驱动因子在不同植被类型和气候类型下发生系统性转变,光合生理信号向碳固定结果的转化受区域水热条件、气候背景和植被功能属性共同控制;总蒸散发、总降水量及地表向下热辐射等关键水热因子对植被光合与生产力的驱动作用呈现出非线性特征与阈值效应,且在不同的长期变化趋势下表现出非对称性。
中图分类号:
张雅梅, 宋美垚, 贾冬梅. 全球植被光合生理与总初级生产力的时空特征及其关键水热驱动因素[J]. 中国沙漠, 2026, 46(5): 300-313.
Yamei Zhang, Meiyao Song, Dongmei Jia. Spatiotemporal characteristics and key hydrothermal driving factors of global vegetation photosynthetic physiology and gross primary productivity[J]. Journal of Desert Research, 2026, 46(5): 300-313.
| 水热驱动因子 | 类别 | 单位 | ERA5-Land变量名 |
|---|---|---|---|
| 总降水量(tp) | 水 | m | Total precipitation |
| 地下径流(ssro) | 水 | m | Sub-surface runoff |
| 地表径流(sro) | 水 | m | Surface runoff |
| 植被蒸腾蒸发(evavt) | 水 | m(水当量) | Evaporation from vegetation transpiration |
| 潜在蒸散发(pev) | 水 | m | Potential evaporation |
| 总蒸散发(e) | 水 | m(水当量) | Total evaporation |
| 地表储水量(src) | 水 | m(水当量) | Skin reservoir content |
| 土壤体积含水量1(swvl1) | 水 | m3·m-3 | Volumetric soil water (layer 1) |
| 土壤体积含水量2(swvl2) | 水 | m3·m-3 | Volumetric soil water (layer 2) |
| 土壤体积含水量3(swvl3) | 水 | m3·m-3 | Volumetric soil water (layer 3) |
| 土壤体积含水量4(swvl4) | 水 | m3·m-3 | Volumetric soil water (layer 4) |
| 气温(t2m) | 热 | K | 2 metre temperature |
| 土壤温度1(stl1) | 热 | K | Soil temperature (layer 1) |
| 土壤温度2(stl2) | 热 | K | Soil temperature (layer 2) |
| 土壤温度3(stl3) | 热 | K | Soil temperature (layer 3) |
| 土壤温度4(stl4) | 热 | K | Soil temperature (layer 4) |
| 地表净太阳辐射(ssr) | 热 | J·m-2 | Surface net solar radiation |
| 地表向下太阳辐射(ssrd) | 热 | J·m-2 | Surface solar radiation downwards |
| 地表净热辐射(str) | 热 | J·m-2 | Surface net thermal radiation |
| 地表向下热辐射(strd) | 热 | J·m-2 | Surface thermal radiation downwards |
| 地表潜热通量(slhf) | 热 | J·m-2 | Surface latent heat flux |
| 地表感热通量(sshf) | 热 | J·m-2 | Surface sensible heat flux |
表1 水热驱动因子变量
Table 1 Hydrothermal driving factor variables
| 水热驱动因子 | 类别 | 单位 | ERA5-Land变量名 |
|---|---|---|---|
| 总降水量(tp) | 水 | m | Total precipitation |
| 地下径流(ssro) | 水 | m | Sub-surface runoff |
| 地表径流(sro) | 水 | m | Surface runoff |
| 植被蒸腾蒸发(evavt) | 水 | m(水当量) | Evaporation from vegetation transpiration |
| 潜在蒸散发(pev) | 水 | m | Potential evaporation |
| 总蒸散发(e) | 水 | m(水当量) | Total evaporation |
| 地表储水量(src) | 水 | m(水当量) | Skin reservoir content |
| 土壤体积含水量1(swvl1) | 水 | m3·m-3 | Volumetric soil water (layer 1) |
| 土壤体积含水量2(swvl2) | 水 | m3·m-3 | Volumetric soil water (layer 2) |
| 土壤体积含水量3(swvl3) | 水 | m3·m-3 | Volumetric soil water (layer 3) |
| 土壤体积含水量4(swvl4) | 水 | m3·m-3 | Volumetric soil water (layer 4) |
| 气温(t2m) | 热 | K | 2 metre temperature |
| 土壤温度1(stl1) | 热 | K | Soil temperature (layer 1) |
| 土壤温度2(stl2) | 热 | K | Soil temperature (layer 2) |
| 土壤温度3(stl3) | 热 | K | Soil temperature (layer 3) |
| 土壤温度4(stl4) | 热 | K | Soil temperature (layer 4) |
| 地表净太阳辐射(ssr) | 热 | J·m-2 | Surface net solar radiation |
| 地表向下太阳辐射(ssrd) | 热 | J·m-2 | Surface solar radiation downwards |
| 地表净热辐射(str) | 热 | J·m-2 | Surface net thermal radiation |
| 地表向下热辐射(strd) | 热 | J·m-2 | Surface thermal radiation downwards |
| 地表潜热通量(slhf) | 热 | J·m-2 | Surface latent heat flux |
| 地表感热通量(sshf) | 热 | J·m-2 | Surface sensible heat flux |
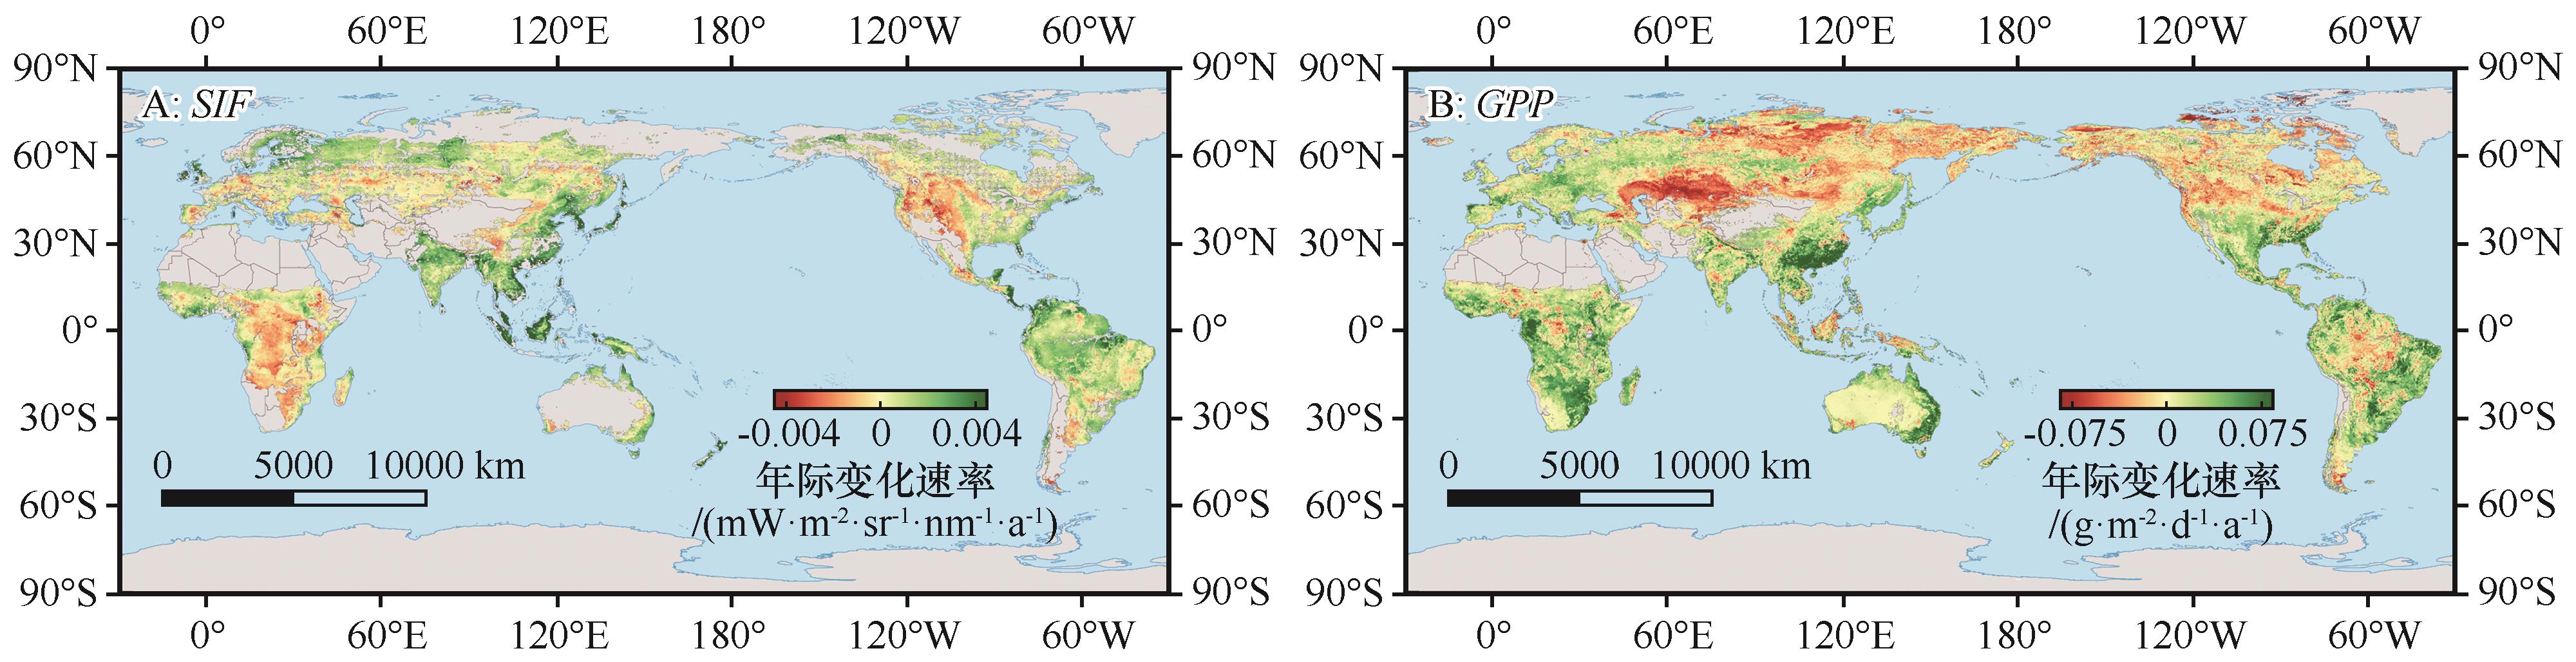
图1 2002—2024年 SIF和GPP年际变化速率的空间分布注:基于自然资源部标准地图服务网站审图号GS(2016)1665号标准地图制作,底图边界无修改
Fig.1 Spatial distribution of interannual change in SIF and GPP from 2002 to 2024
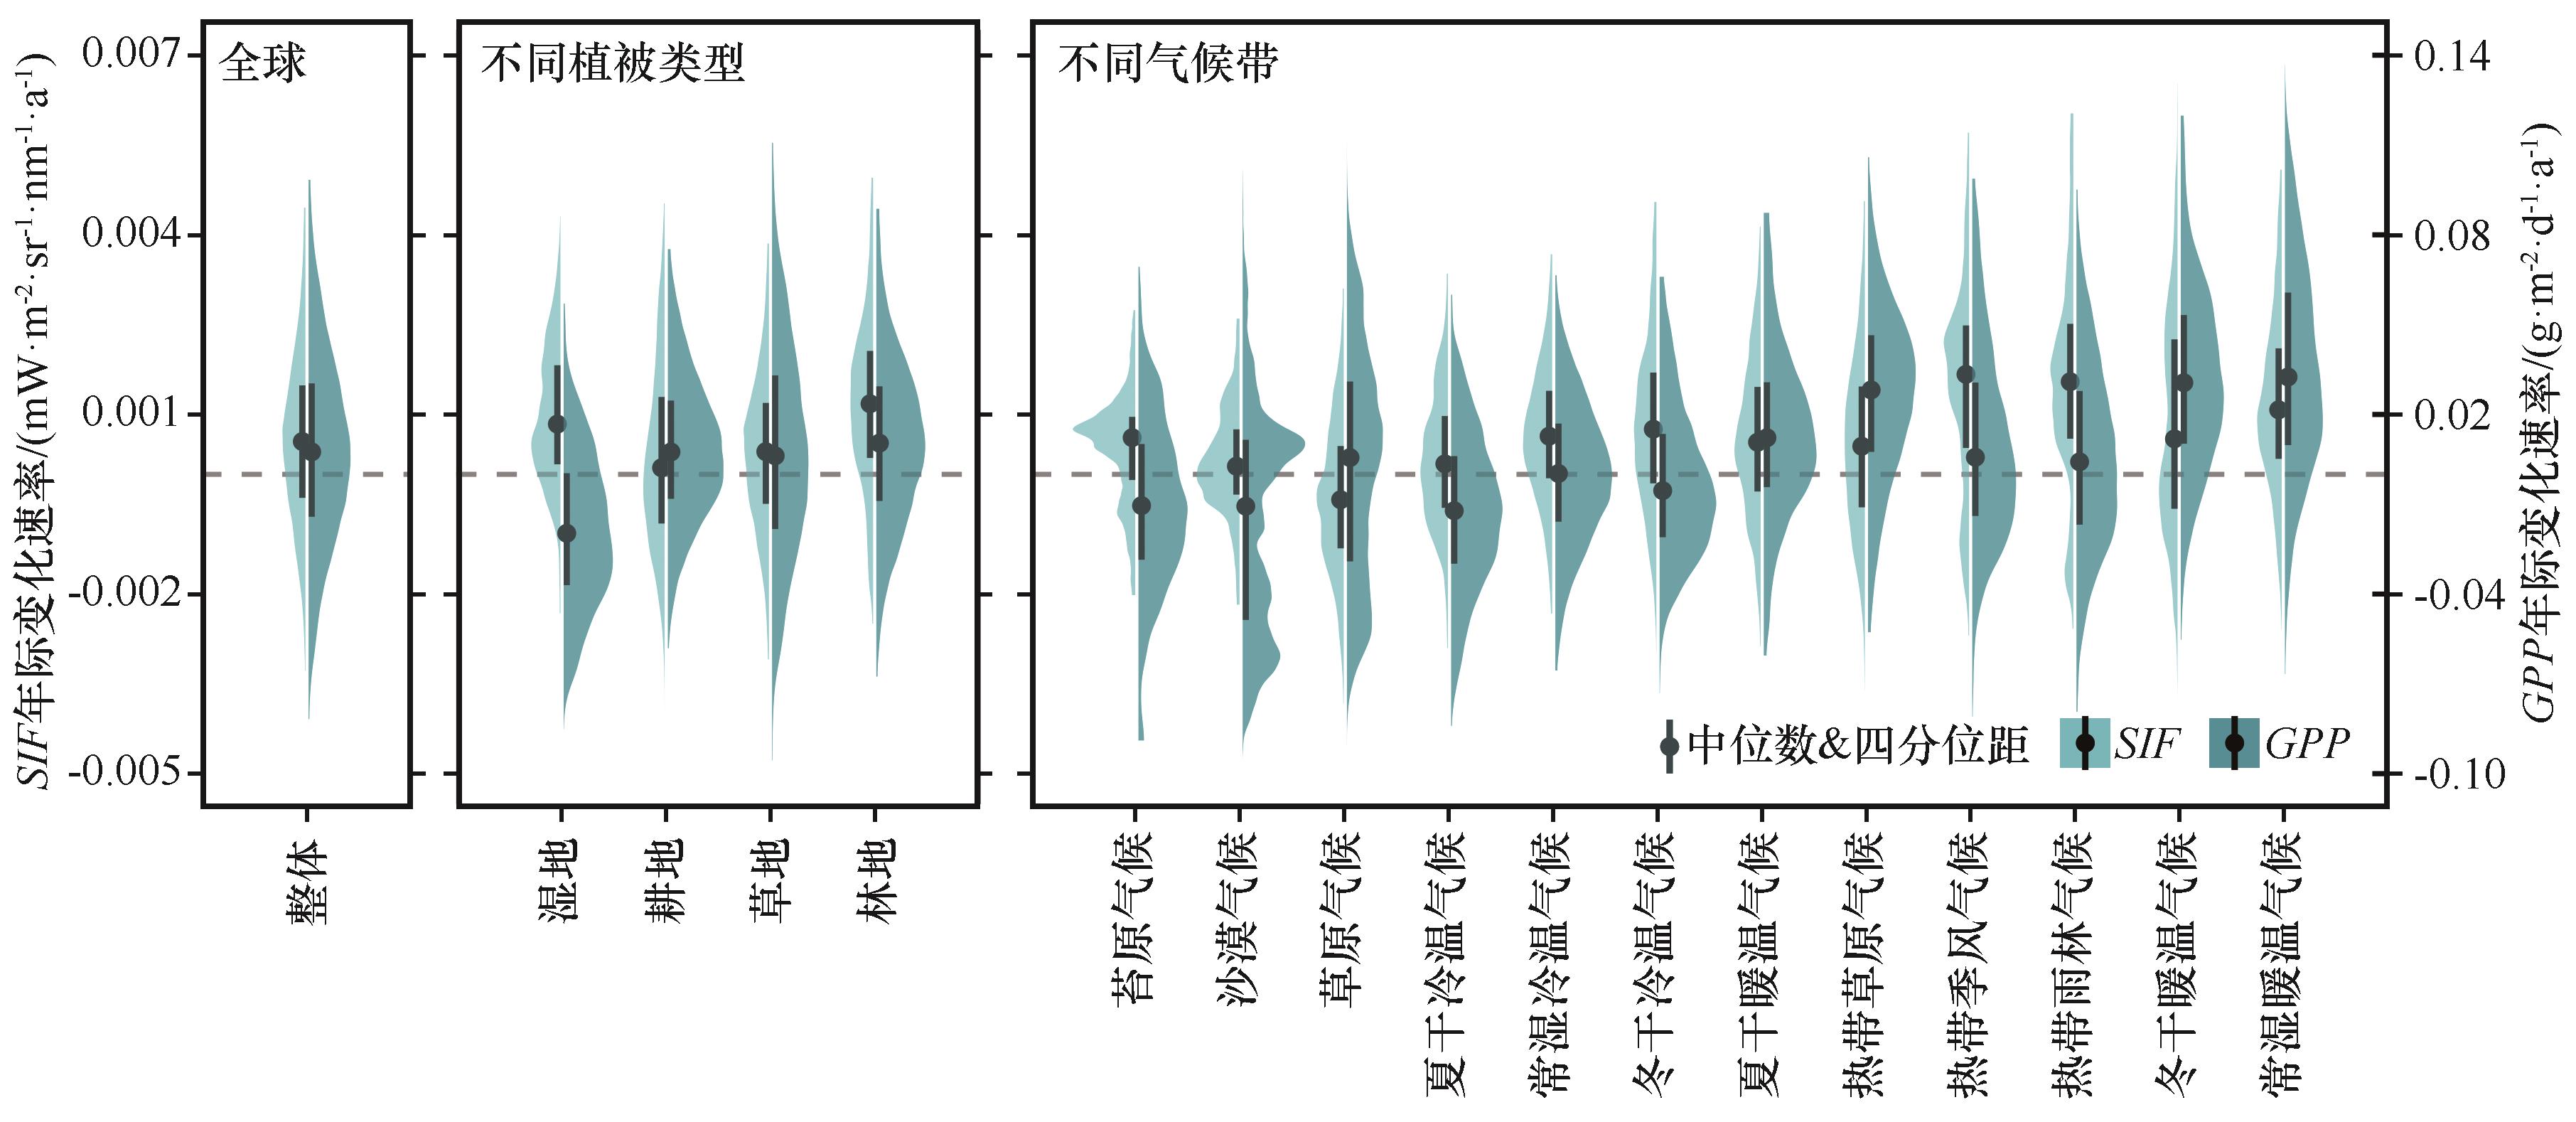
图2 不同植被类型和气候类型下SIF和GPP的年际变化速率注:不同植被类型、不同气候类型之间的SIF与GPP年际变化速率均存在显著性差异(P<0.05)。为保证图面清晰整洁,图中省略了显著性星号标记
Fig.2 Rates of interannual change in SIF and GPP across different vegetation types and climate zones
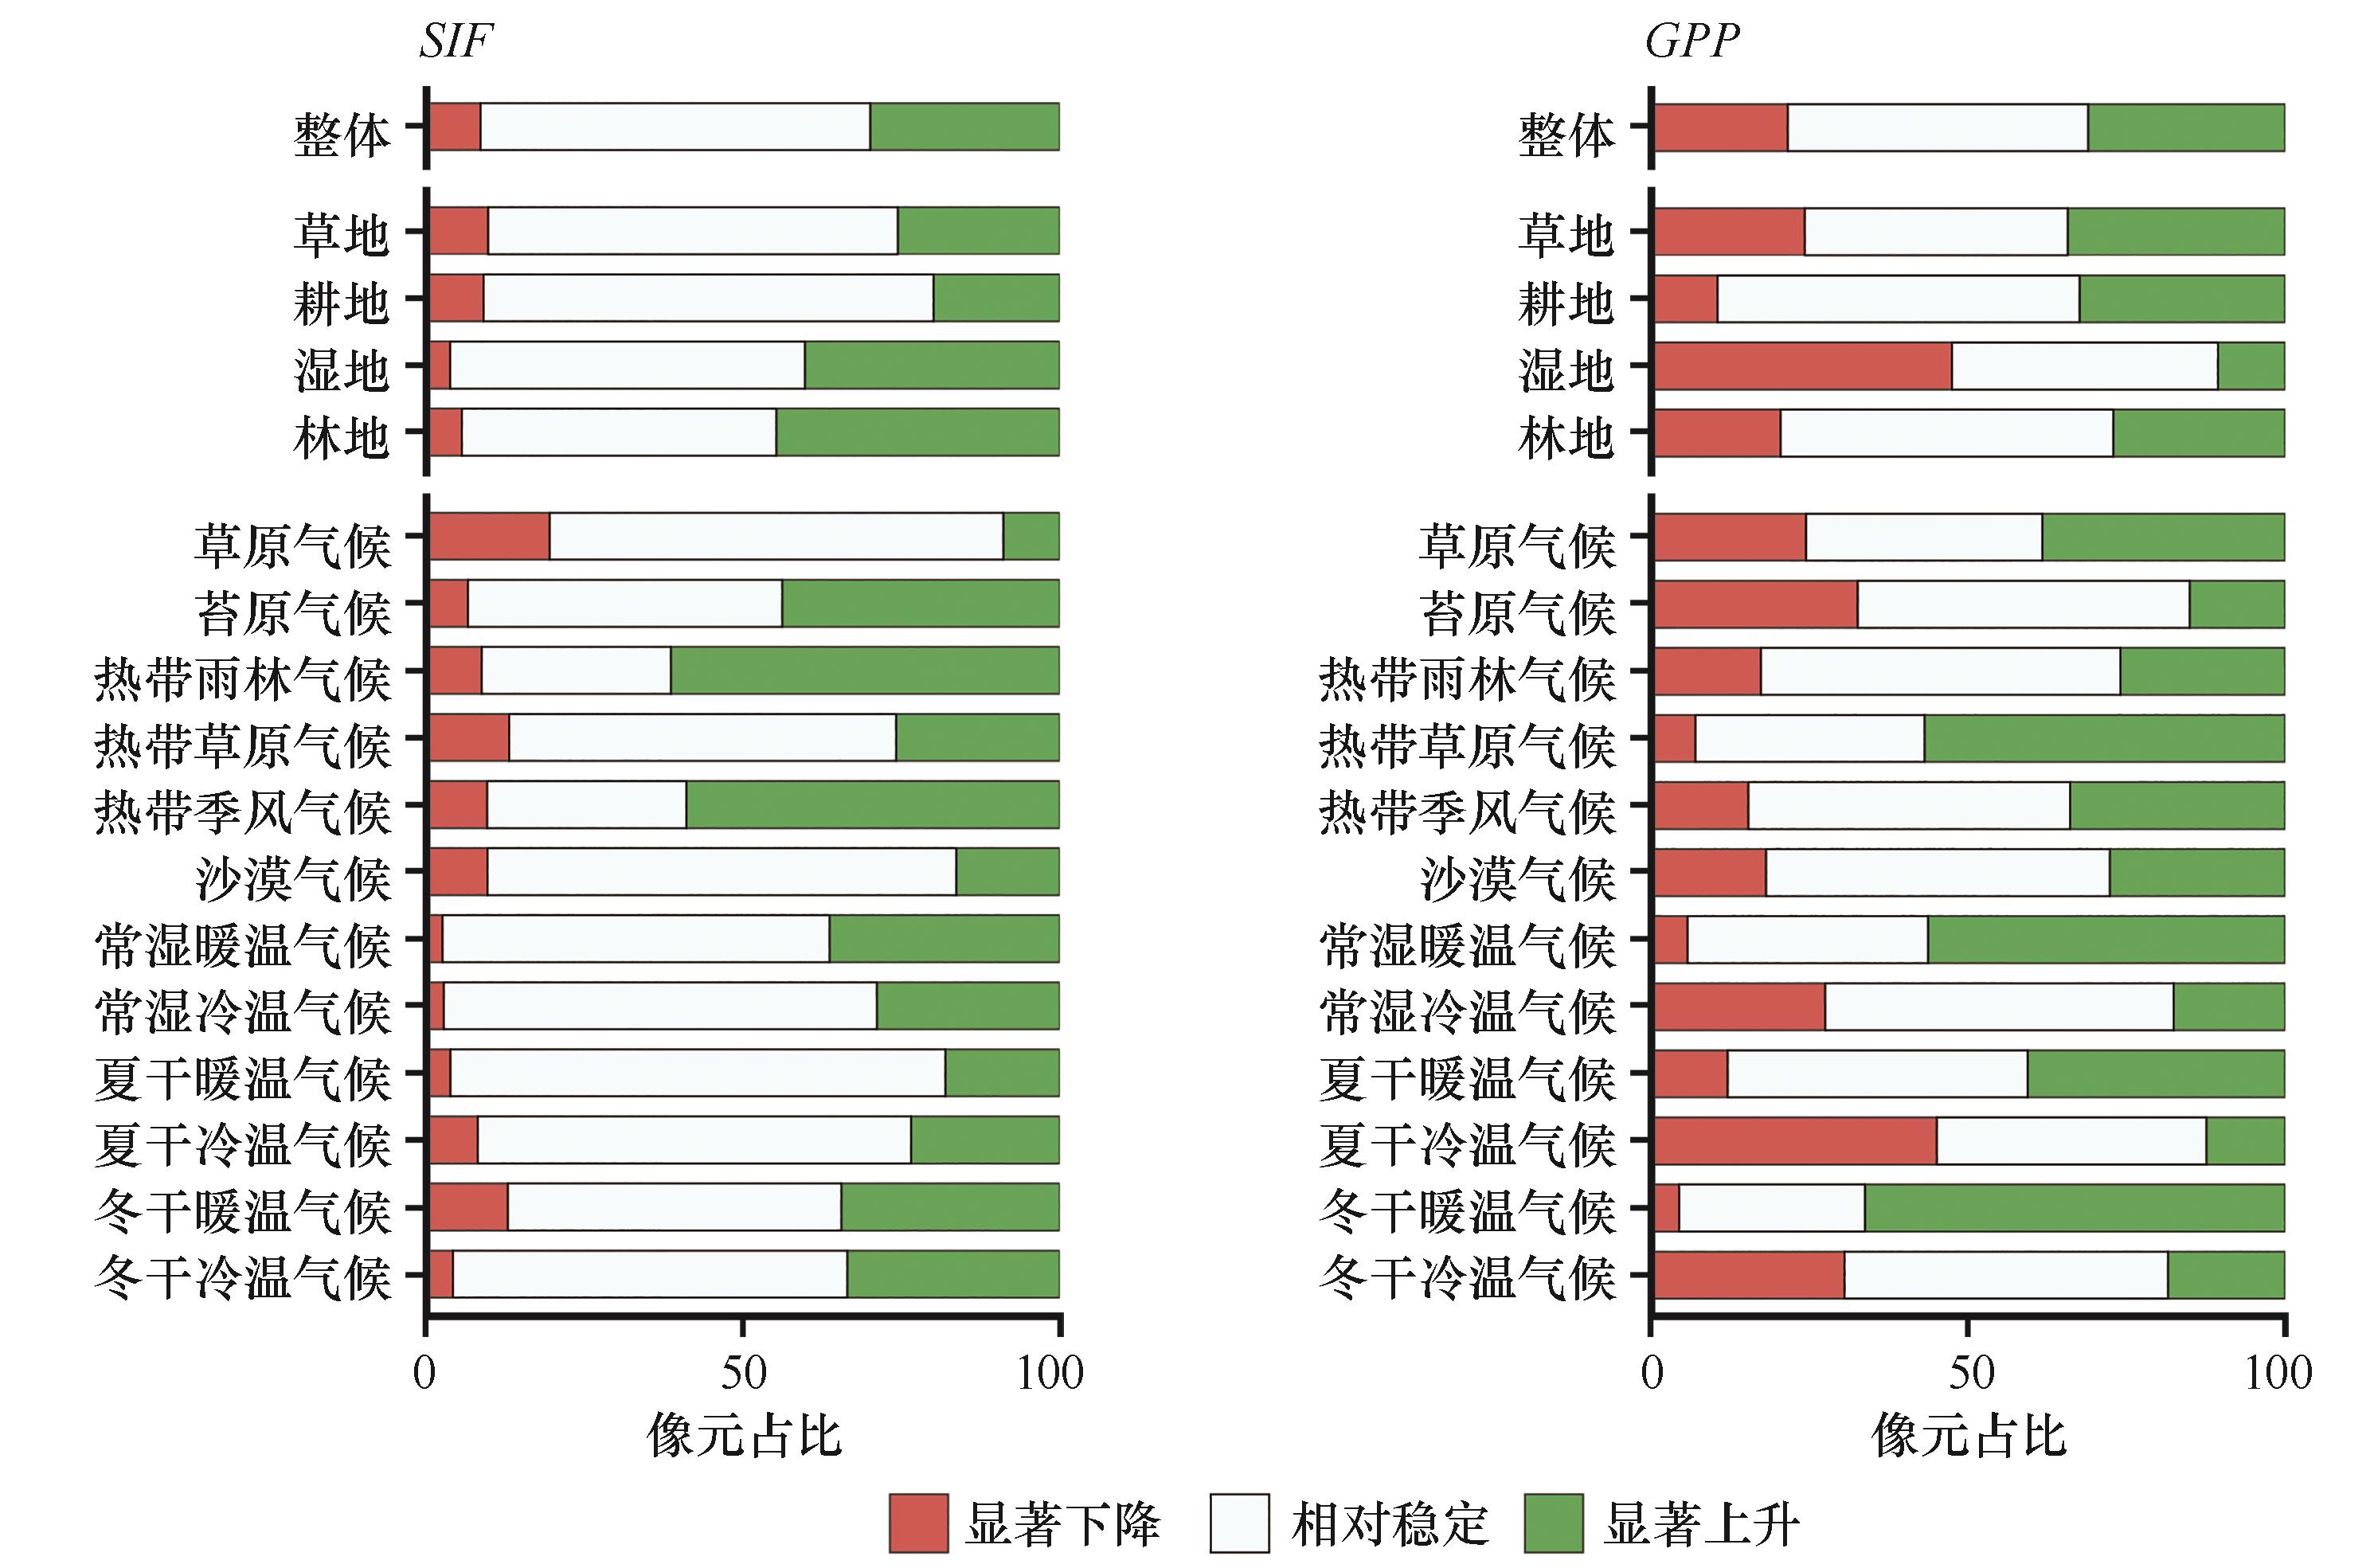
图3 不同植被类型和气候类型下SIF和GPP年际变化趋势的占比
Fig.3 Proportions of interannual trends in SIF and GPP across different vegetation types and climate zones
| 气候类型 | 占比 | 气候类型 | 占比 | 气候类型 | 占比 |
|---|---|---|---|---|---|
| 热带雨林气候 | 21.61% | 常湿冷温气候 | 7.17% | 热带草原气候 | 2.87% |
| 苔原气候 | 18.27% | 冬干冷温气候 | 6.65% | 冬干暖温气候 | 2.01% |
| 热带季风气候 | 17.12% | 沙漠气候 | 5.55% | 常湿暖温气候 | 1.81% |
| 夏干冷温气候 | 13.11% | 夏干暖温气候 | 3.19% | 草原气候 | 0.64% |
表2 不同气候类型下 SIF 显著上升且 GPP 显著下降区域的占比
Table 2 Proportions of regions with significant SIF increase and GPP decrease across different climate zones
| 气候类型 | 占比 | 气候类型 | 占比 | 气候类型 | 占比 |
|---|---|---|---|---|---|
| 热带雨林气候 | 21.61% | 常湿冷温气候 | 7.17% | 热带草原气候 | 2.87% |
| 苔原气候 | 18.27% | 冬干冷温气候 | 6.65% | 冬干暖温气候 | 2.01% |
| 热带季风气候 | 17.12% | 沙漠气候 | 5.55% | 常湿暖温气候 | 1.81% |
| 夏干冷温气候 | 13.11% | 夏干暖温气候 | 3.19% | 草原气候 | 0.64% |
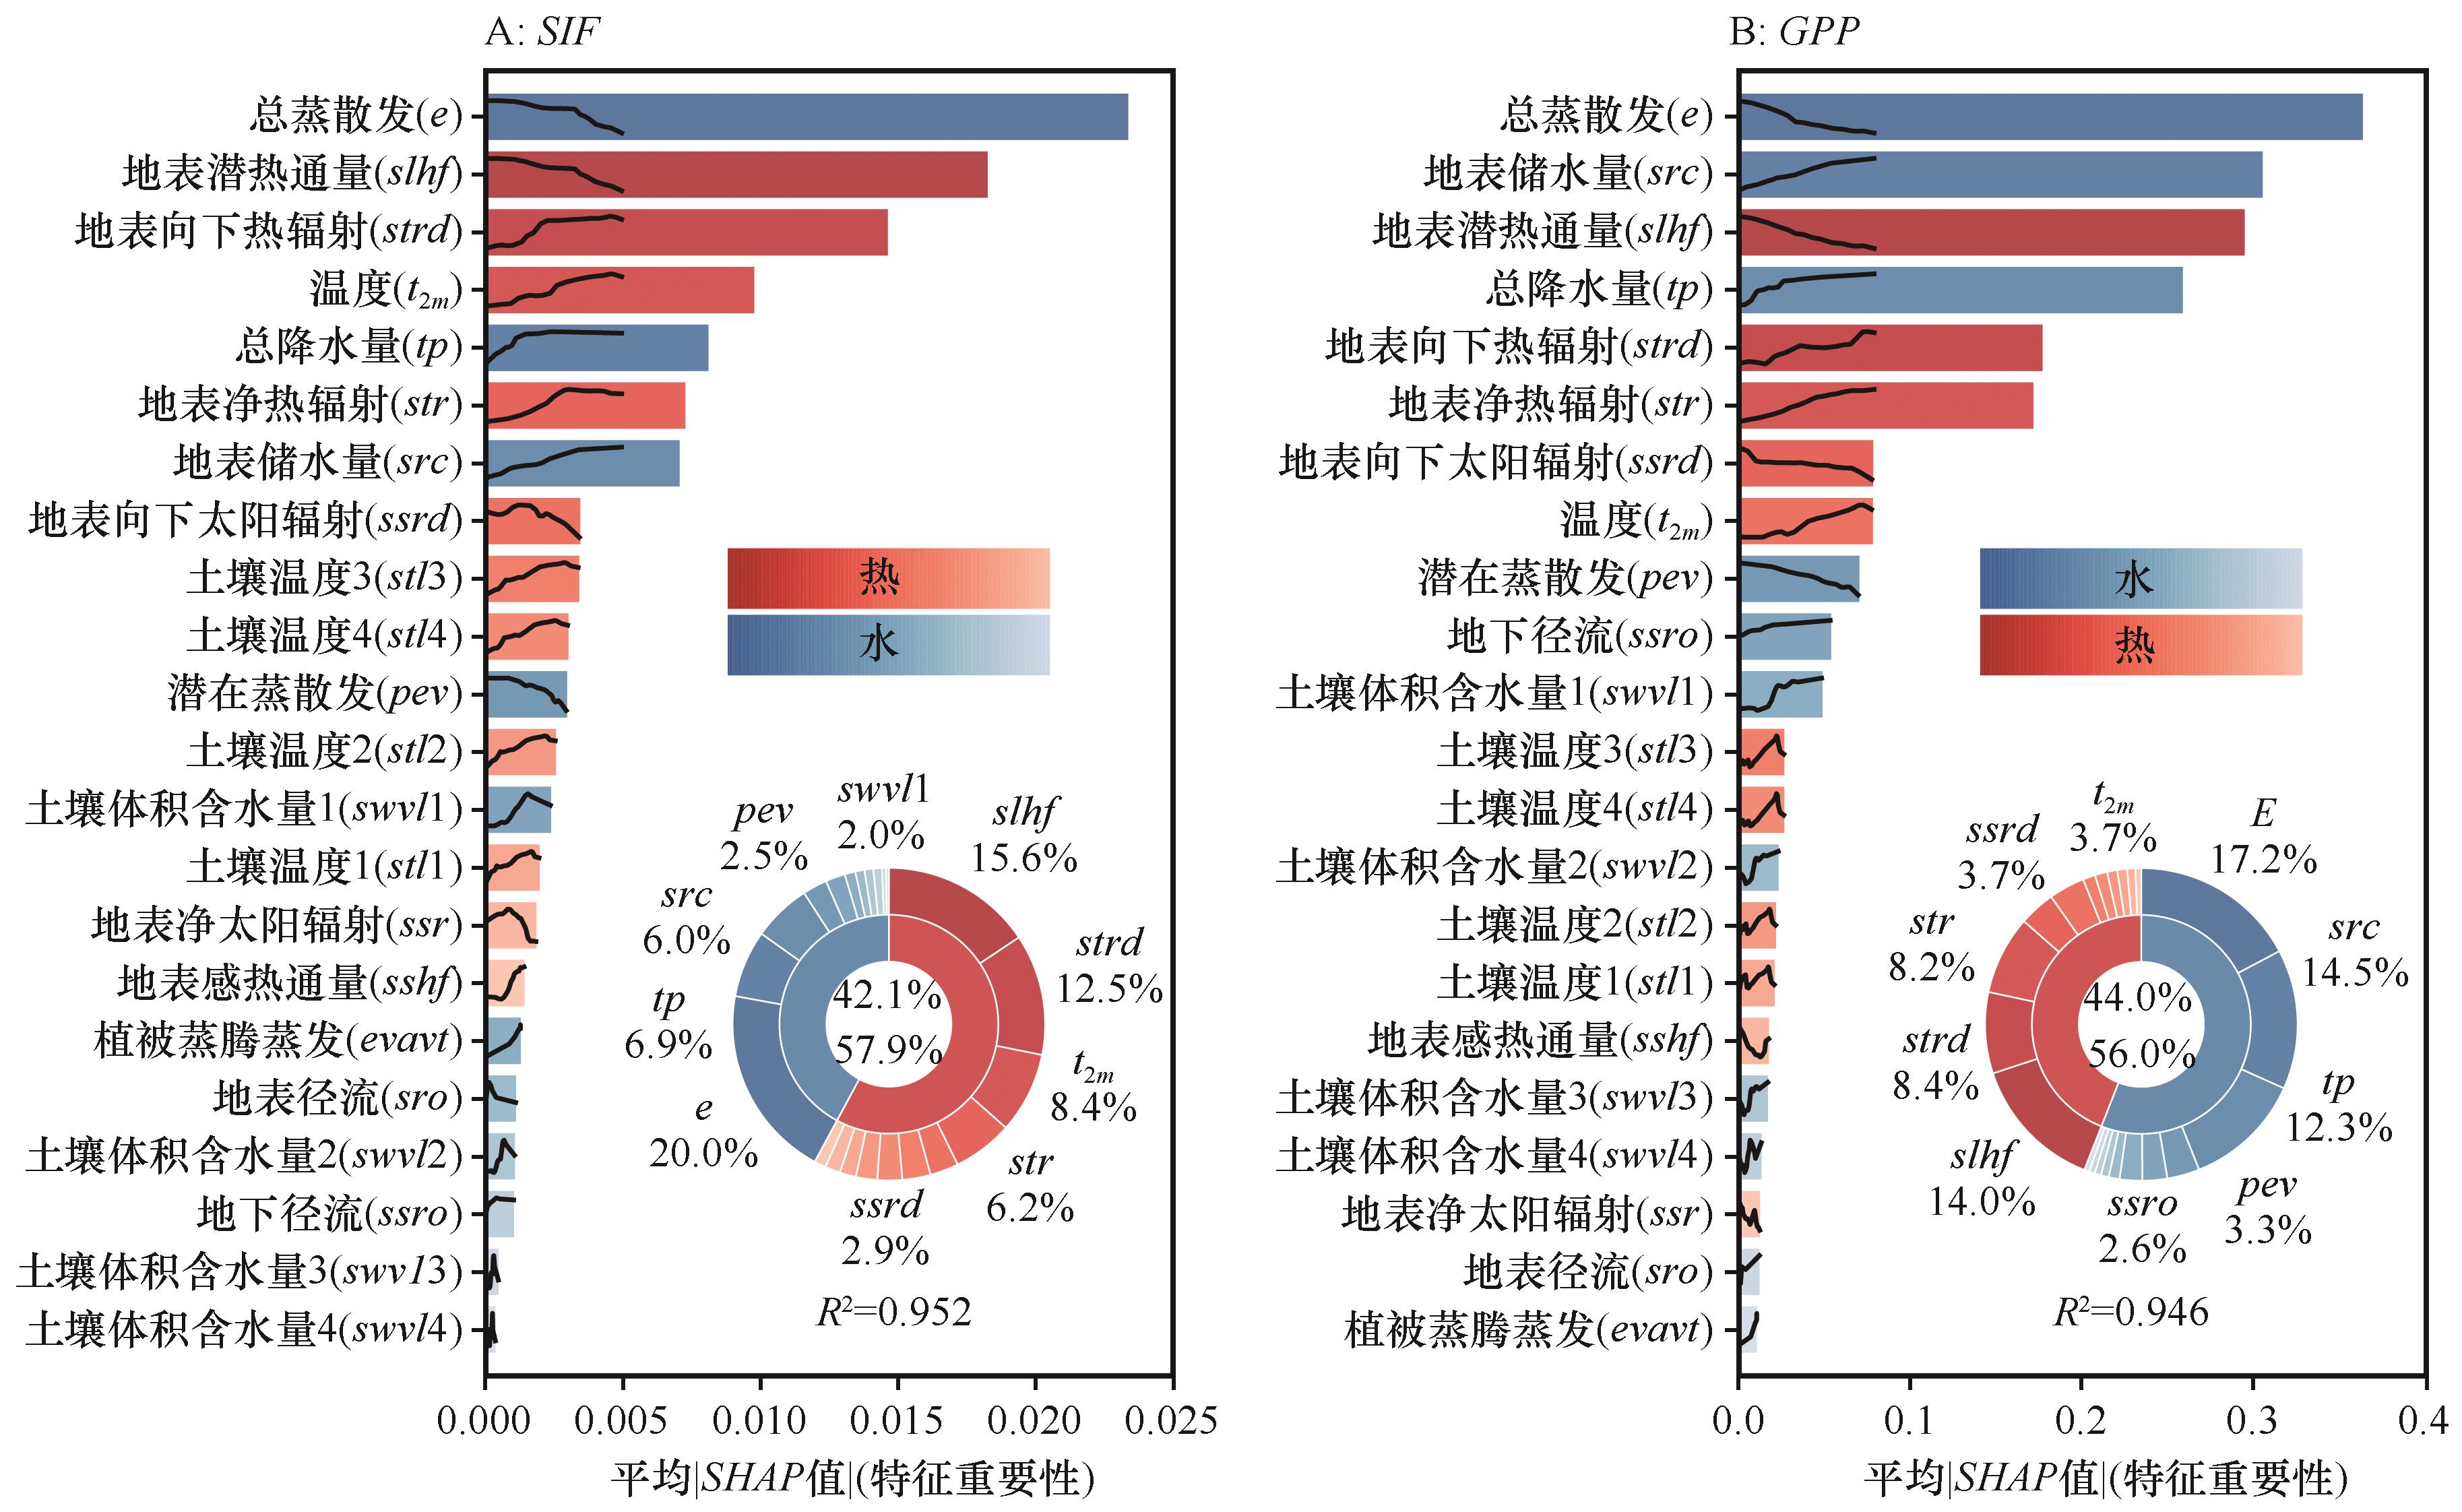
图4 水热驱动因子对SIF和GPP空间异质性的相对贡献注:条形图内部镶嵌的黑色曲线表示该特征的真实值与SHAP值的依赖关系
Fig.4 Relative contributions of hydrothermal driving factors to the spatial heterogeneity of SIF and GPP
| 气候类型 | 有效像元数(n) | SIF | GPP | ||||||
|---|---|---|---|---|---|---|---|---|---|
| 主导因子 | 主导因子的贡献度 | R2 | CVR2 | 主导因子 | 主导因子的贡献度 | R2 | CV R2 | ||
| 冬干冷温气候 | 52 982 | 地表向下热辐射(strd) | 32.44% | 0.95 | 0.76 | 地下径流(ssro) | 20.64% | 0.92 | 0.78 |
| 冬干暖温气候 | 43 405 | 地表净热辐射(str) | 17.32% | 0.90 | 0.68 | 地表储水量(src) | 40.79% | 0.90 | 0.75 |
| 夏干冷温气候 | 13 510 | 地表向下热辐射(strd) | 27.79% | 0.94 | 0.76 | 地表向下太阳辐射(ssrd) | 33.38% | 0.94 | 0.72 |
| 夏干暖温气候 | 11 606 | 地表净热辐射(str) | 20.72% | 0.89 | 0.62 | 地表储水量(src) | 23.38% | 0.89 | 0.53 |
| 常湿冷温气候 | 219 662 | 总蒸散发(e) | 31.46% | 0.96 | 0.89 | 地表向下热辐射(strd) | 17.22% | 0.87 | 0.66 |
| 常湿暖温气候 | 51 824 | 地表感热通量(sshf) | 19.51% | 0.87 | 0.58 | 地表储水量(src) | 35.06% | 0.90 | 0.66 |
| 沙漠气候 | 22 836 | 地表向下热辐射(strd) | 23.78% | 0.96 | 0.69 | 地表向下热辐射(strd) | 17.07% | 0.92 | 0.28 |
| 热带季风气候 | 32 953 | 地表储水量(src) | 26.23% | 0.82 | 0.34 | 地表储水量(src) | 44.23% | 0.85 | 0.54 |
| 热带草原气候 | 117 187 | 地表储水量(src) | 37.35% | 0.88 | 0.69 | 地表储水量(src) | 43.10% | 0.88 | 0.74 |
| 热带雨林气候 | 43 951 | 地表感热通量(sshf) | 10.86% | 0.65 | 0.09 | 地表储水量(src) | 29.45% | 0.70 | 0.37 |
| 苔原气候 | 27 811 | 总降水量(tp) | 28.93% | 0.95 | 0.87 | 地表向下热辐射(strd) | 24.66% | 0.92 | 0.78 |
| 草原气候 | 105 007 | 地表向下热辐射(strd) | 28.26% | 0.94 | 0.80 | 总蒸散发(e) | 21.95% | 0.90 | 0.67 |
表3 不同气候类型下 SIF 和 GPP 的主导驱动因子及其贡献度
Table 3 Dominant driving factors and their contributions to SIF and GPP across different climate zones
| 气候类型 | 有效像元数(n) | SIF | GPP | ||||||
|---|---|---|---|---|---|---|---|---|---|
| 主导因子 | 主导因子的贡献度 | R2 | CVR2 | 主导因子 | 主导因子的贡献度 | R2 | CV R2 | ||
| 冬干冷温气候 | 52 982 | 地表向下热辐射(strd) | 32.44% | 0.95 | 0.76 | 地下径流(ssro) | 20.64% | 0.92 | 0.78 |
| 冬干暖温气候 | 43 405 | 地表净热辐射(str) | 17.32% | 0.90 | 0.68 | 地表储水量(src) | 40.79% | 0.90 | 0.75 |
| 夏干冷温气候 | 13 510 | 地表向下热辐射(strd) | 27.79% | 0.94 | 0.76 | 地表向下太阳辐射(ssrd) | 33.38% | 0.94 | 0.72 |
| 夏干暖温气候 | 11 606 | 地表净热辐射(str) | 20.72% | 0.89 | 0.62 | 地表储水量(src) | 23.38% | 0.89 | 0.53 |
| 常湿冷温气候 | 219 662 | 总蒸散发(e) | 31.46% | 0.96 | 0.89 | 地表向下热辐射(strd) | 17.22% | 0.87 | 0.66 |
| 常湿暖温气候 | 51 824 | 地表感热通量(sshf) | 19.51% | 0.87 | 0.58 | 地表储水量(src) | 35.06% | 0.90 | 0.66 |
| 沙漠气候 | 22 836 | 地表向下热辐射(strd) | 23.78% | 0.96 | 0.69 | 地表向下热辐射(strd) | 17.07% | 0.92 | 0.28 |
| 热带季风气候 | 32 953 | 地表储水量(src) | 26.23% | 0.82 | 0.34 | 地表储水量(src) | 44.23% | 0.85 | 0.54 |
| 热带草原气候 | 117 187 | 地表储水量(src) | 37.35% | 0.88 | 0.69 | 地表储水量(src) | 43.10% | 0.88 | 0.74 |
| 热带雨林气候 | 43 951 | 地表感热通量(sshf) | 10.86% | 0.65 | 0.09 | 地表储水量(src) | 29.45% | 0.70 | 0.37 |
| 苔原气候 | 27 811 | 总降水量(tp) | 28.93% | 0.95 | 0.87 | 地表向下热辐射(strd) | 24.66% | 0.92 | 0.78 |
| 草原气候 | 105 007 | 地表向下热辐射(strd) | 28.26% | 0.94 | 0.80 | 总蒸散发(e) | 21.95% | 0.90 | 0.67 |
| 植被类型 | 有效像 元数(n) | SIF | GPP | ||||||
|---|---|---|---|---|---|---|---|---|---|
| 主导因子 | 主导因子的贡献度 | R2 | CVR2 | 主导因子 | 主导因子的贡献度 | R2 | CV R2 | ||
| 林地 | 194 593 | 总蒸散发(e) | 39.58% | 0.96 | 0.90 | 总蒸散发(e) | 40.18% | 0.97 | 0.95 |
| 湿地 | 5 621 | 地表向下热辐射(strd) | 35.04% | 0.96 | 0.71 | 地表向下热辐射(strd) | 27.36% | 0.90 | 0.71 |
| 耕地 | 99 638 | 总降水量(tp) | 23.66% | 0.92 | 0.76 | 总降水量(tp) | 25.54% | 0.88 | 0.69 |
| 草地 | 442 882 | 总蒸散发(e) | 37.82% | 0.95 | 0.91 | 地表潜热通量(slhf) | 27.43% | 0.93 | 0.86 |
表4 不同植被类型下 SIF 和 GPP 的主导驱动因子及其贡献度
Table 4 Dominant driving factors and their contributions to SIF and GPP across different vegetation types
| 植被类型 | 有效像 元数(n) | SIF | GPP | ||||||
|---|---|---|---|---|---|---|---|---|---|
| 主导因子 | 主导因子的贡献度 | R2 | CVR2 | 主导因子 | 主导因子的贡献度 | R2 | CV R2 | ||
| 林地 | 194 593 | 总蒸散发(e) | 39.58% | 0.96 | 0.90 | 总蒸散发(e) | 40.18% | 0.97 | 0.95 |
| 湿地 | 5 621 | 地表向下热辐射(strd) | 35.04% | 0.96 | 0.71 | 地表向下热辐射(strd) | 27.36% | 0.90 | 0.71 |
| 耕地 | 99 638 | 总降水量(tp) | 23.66% | 0.92 | 0.76 | 总降水量(tp) | 25.54% | 0.88 | 0.69 |
| 草地 | 442 882 | 总蒸散发(e) | 37.82% | 0.95 | 0.91 | 地表潜热通量(slhf) | 27.43% | 0.93 | 0.86 |
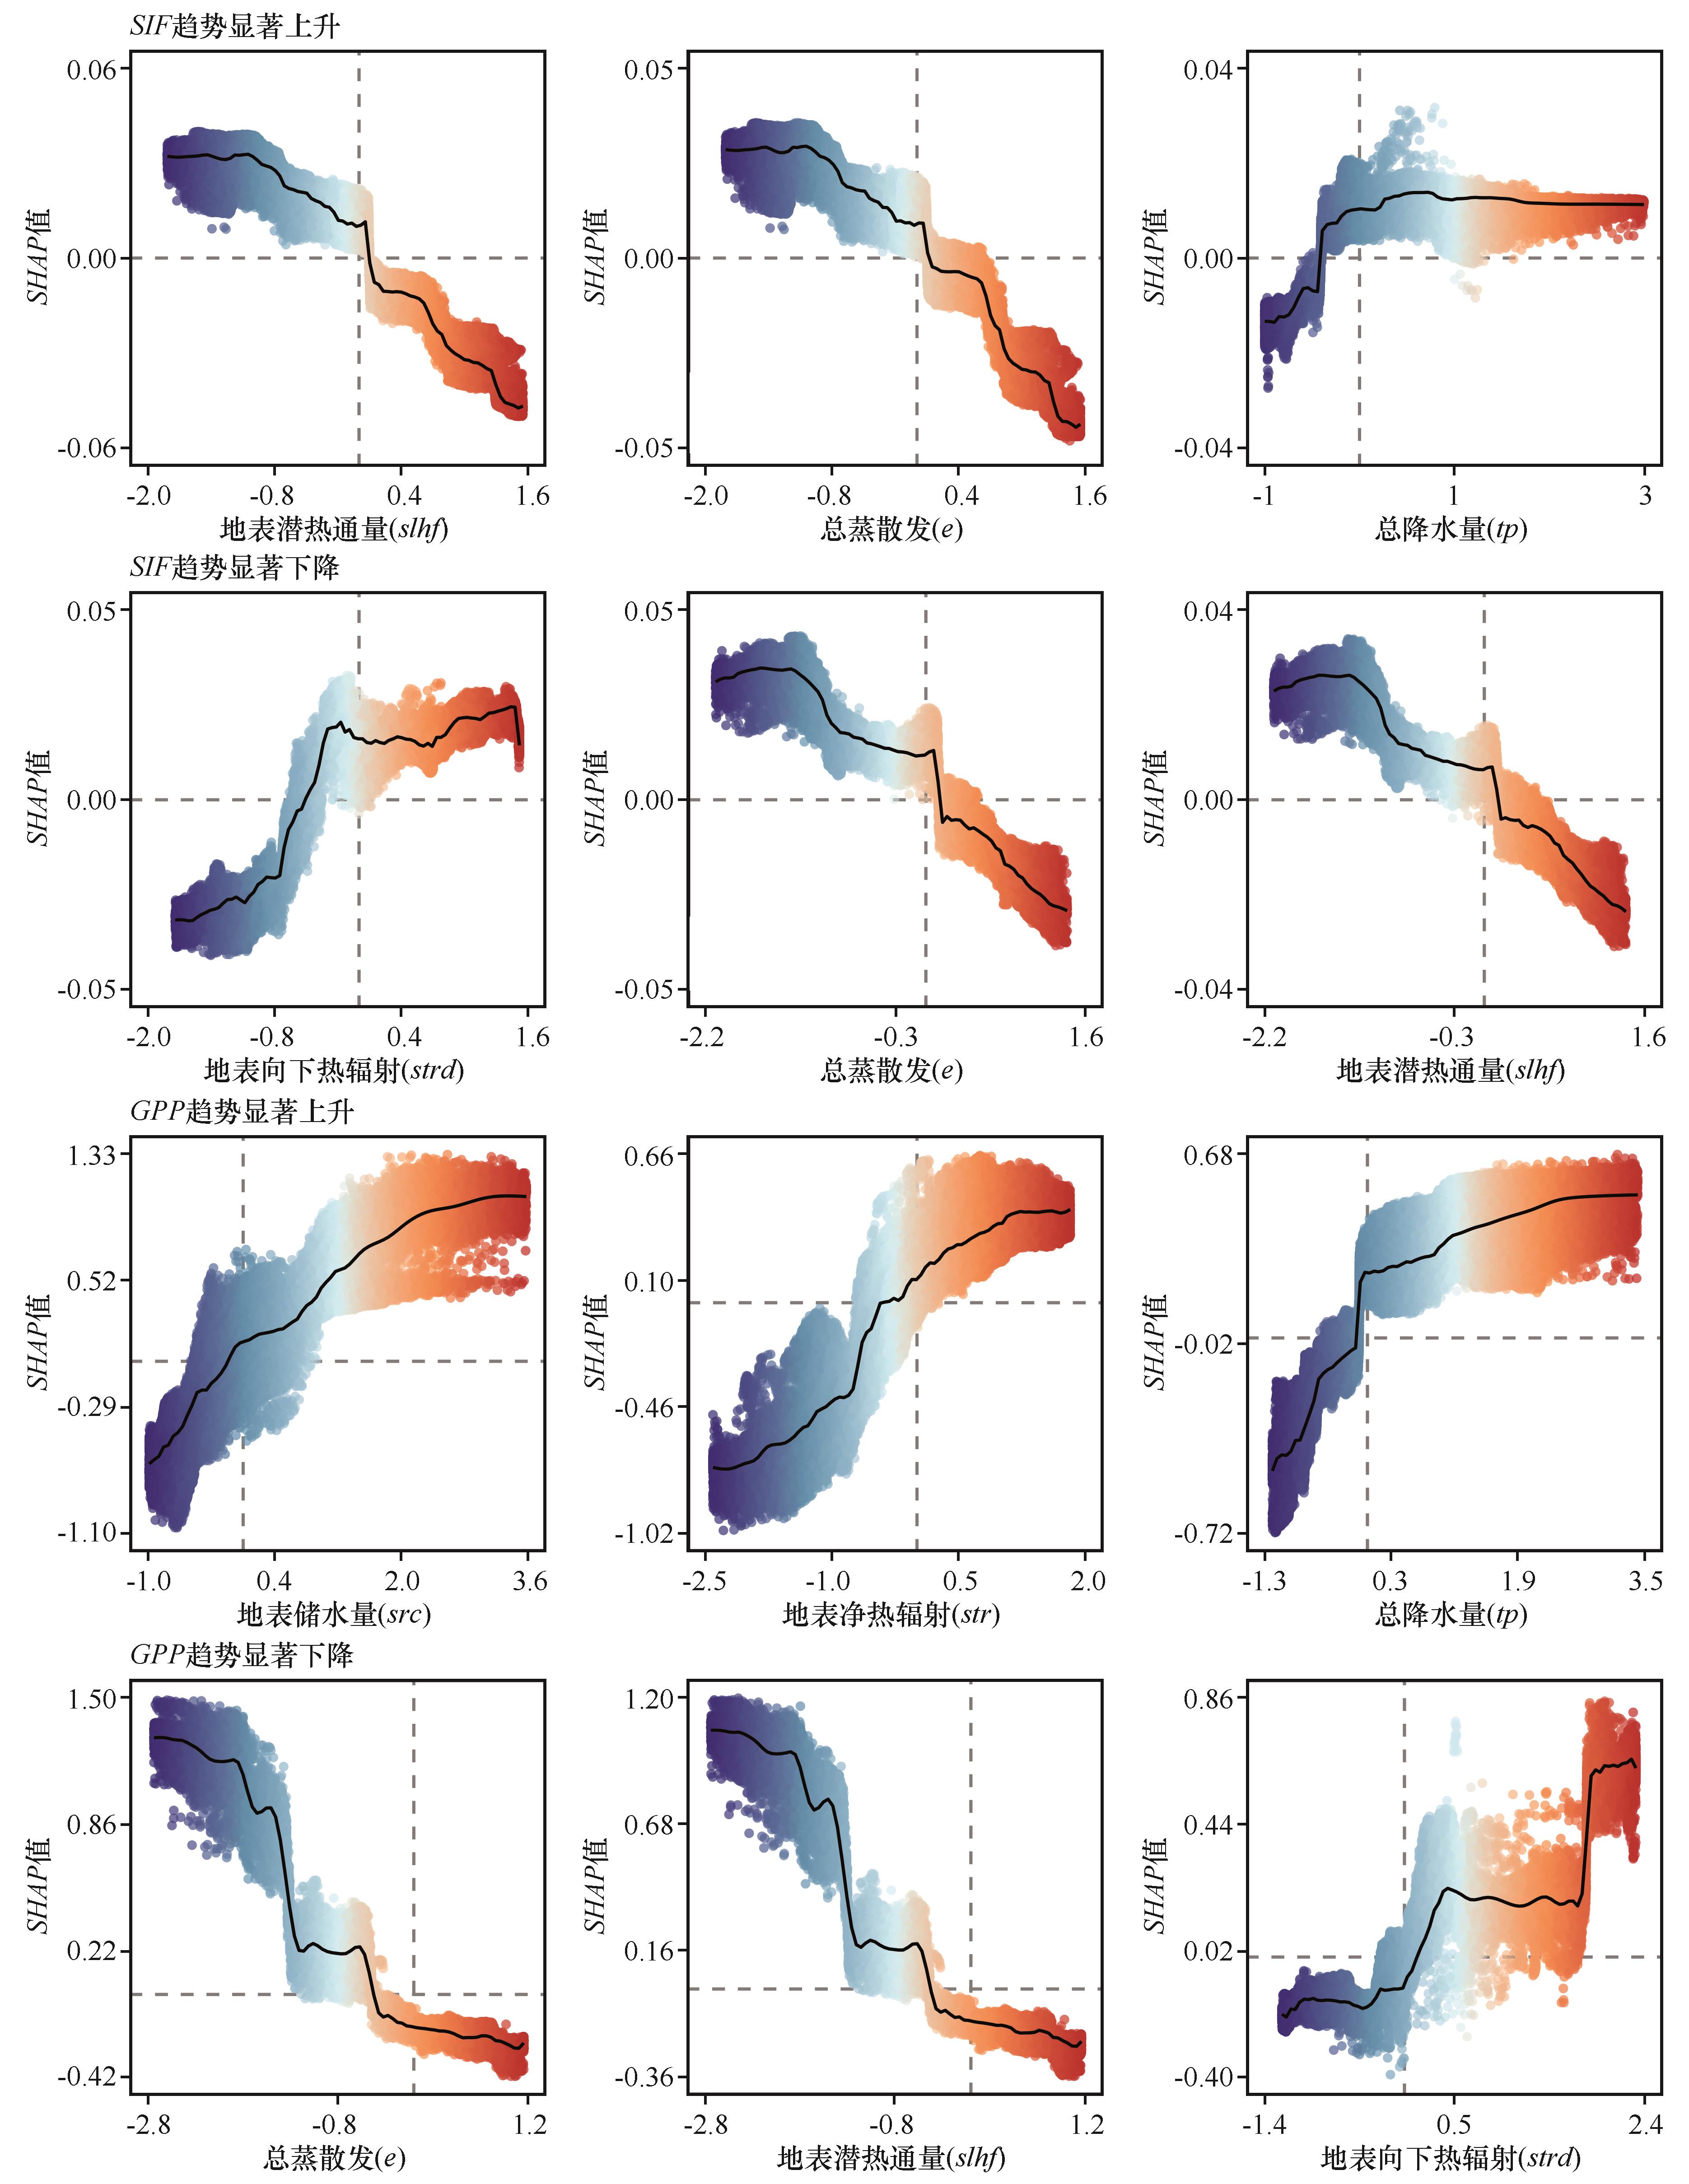
图5 不同变化趋势下关键水热驱动因子对SIF和GPP的局部依赖关系注:第一、二、三列分别为相对贡献排名前三的关键水热驱动因子的SHAP依赖图;横坐标为经过标准化处理后的驱动因子数值;黑色实线为基于GAM拟合的平滑趋势线
Fig.5 Partial dependence of SIF and GPP on key hydrothermal driving factors under different variation trends
| [1] | Intergovernmental Panel on Climate Change (IPCC).Climate Change and Land:IPCC Special Report on Climate Change,Desertification,Land Degradation,Sustainable Land Management,Food Security,and Greenhouse Gas Fluxes in Terrestrial Ecosystems[M].Cambridge,UK:Cambridge University Press,2022. |
| [2] | Beer C, Reichstein M, Tomelleri E,et al.Terrestrial gross carbon dioxide uptake:global distribution and covariation with climate[J].Science,2010,329(5993):834-838. |
| [3] | Myneni R B, Keeling C D, Tucker C J,et al.Increased plant growth in the northern high latitudes from 1981 to 1991[J].Nature,1997,386(6626):698-702. |
| [4] | Piao S L, Wang X H, Park T,et al.Characteristics,drivers and feedbacks of global greening[J].Nature Reviews Earth & Environment,2019,1(1):14-27. |
| [5] | Zhu W Q, Xie Z Y, Zhao C L,et al.Remote sensing of terrestrial gross primary productivity:a review of advances in theoretical foundation,key parameters and methods[J].GIScience & Remote Sensing,2024,61(1):2318846. |
| [6] | Mohammed G H, Colombo R, Middleton E M,et al.Remote sensing of solar-induced chlorophyll fluorescence (SIF) in vegetation:50 years of progress[J].Remote Sensing of Environment,2019,231:111177. |
| [7] | 刘良云,杜珊珊,刘新杰,等.日光诱导叶绿素荧光卫星遥感:原理、进展与展望[J].遥感技术与应用,2026,41(1):1-22. |
| [8] | Li X, Xiao J F, He B B,et al.Solar-induced chlorophyll fluorescence is strongly correlated with terrestrial photosynthesis for a wide variety of biomes:first global analysis based on OCO-2 and flux tower observations[J].Global Change Biology,2018,24(9):3991-4008. |
| [9] | Zhang Y G, Guanter L, Berry J A,et al.Model-based analysis of the relationship between sun-induced chlorophyll fluorescence and gross primary production for remote sensing applications[J].Remote Sensing of Environment,2016,187:145-155. |
| [10] | Madani N, Parazoo N C, Kimball J S,et al.Recent amplified global gross primary productivity due to temperature increase is offset by reduced productivity due to water constraints[J].AGU Advances,2020,1(4):e2020AV000180. |
| [11] | Lu H B, Qin Z C, Lin S R,et al.Large influence of atmospheric vapor pressure deficit on ecosystem production efficiency[J].Nature Communications,2022,13(1):1653. |
| [12] | 佀海翔,王瑞燕,王秋红.黄河流域植被光合动态时空演变及归因分析:基于日光诱导叶绿素荧光数据[J].生态学报,2024,44(13):5695-5705. |
| [13] | 季永月,曾思栋,吴涵,等.全球植被总初级生产力时空演变及其关键环境因素[J].水土保持研究,2026,33(4):212-221. |
| [14] | Pickering M, Cescatti A, Duveiller G.Sun-induced fluorescence as a proxy for primary productivity across vegetation types and climates[J].Biogeosciences,2022,19(20):4833-4864. |
| [15] | Martini D, Sakowska K, Wohlfahrt G,et al.Heatwave breaks down the linearity between sun-induced fluorescence and gross primary production[J].New Phytologist,2022,233(6):2415-2428. |
| [16] | Zou C, Liu L Y, Du S S,et al.LHSIF:the long-term harmonized multi-satellite SIF dataset with a resolution of 0.05° spanning 1995 to 2024[DS/OL].Zenodo,2025.. |
| [17] | Zou C, Du S S, Liu X J,et al.Development of the long-term harmonized multi-satellite SIF (LHSIF) dataset at 0.05° resolution (1995-2024)[J].Earth System Science Data,2026,18(1):55-75. |
| [18] | Chen S Y, Liu X J, Han Q Z,et al.TRAX GPP:global 0.05° monthly GPP dataset (2001-2024) derived from a hybrid LSTM framework[DS/OL].Zenodo,2026.. |
| [19] | Chen S Y, Liu X J, Han Q Z,et al.A global 0.05° gross primary production dataset from 2001 to 2024 generated using a hybrid LSTM framework[J].Scientific Data,2026,13(1):882. |
| [20] | Copernicus Climate Change Service.ERA5-land monthly averaged data from 1950 to present[DS/OL].Copernicus Climate Change Service (C3S) Climate Data Store (CDS),2019.. |
| [21] | Friedl M, Sulla-Menashe D.MODIS/terra+aqua land cover type yearly L3 global 0.05Deg CMG V061[DS/OL].NASA Land Processes Distributed Active Archive Center,2022.. |
| [22] | Beck H E, Zimmermann N E, McVicar T R,et al.Present and future Köppen-Geiger climate classification maps at 1-km resolution[DS/OL].Figshare,2018.. |
| [23] | 王婷,周道玮,神祥金,等.中国柯本气候分类[J].气象科学,2020,40(6):752-760. |
| [24] | Lillesand T M, Kiefer R W, Chipman J W.Remote Sensing and Image Interpretation[M]. Hoboken,NJ,USA:Wiley,2015. |
| [25] | Theil H.A rank-invariant method of linear and polynomial regression analysis[J].Indagationes Mathematicae,1950,12(85):173. |
| [26] | Sen P K.Estimates of the regression coefficient based on Kendall’s tau[J].Journal of the American Statistical Association,1968,63(324):1379-1389. |
| [27] | Mann H B.Nonparametric tests against trend[J].Econometrica,1945,13(3):245-260. |
| [28] | Kendall M G.Rank Correlation Methods[M].London,UK:Griffin,1975. |
| [29] | Gocic M, Trajkovic S.Analysis of changes in meteorological variables using mann-kendall and sen's slope estimator statistical tests in Serbia[J].Global and Planetary Change,2013,100:172-182. |
| [30] | Nemani R R, Keeling C D, Hashimoto H,et al.Climate-driven increases in global terrestrial net primary production from 1982 to 1999[J].Science,2003,300(5625):1561-1563. |
| [31] | Wright M N, Ziegler A.ranger:A fast implementation of random forests for high dimensional data in C++ and R[J].Journal of Statistical Software,2017,77(1):1-17. |
| [32] | Breiman L.Random forests[J].Machine Learning,2001,45(1):5-32. |
| [33] | Lundberg S M, Lee S I.A unified approach to interpreting model predictions[J].Advances in Neural Information Processing Systems,2017,30:4765-4774. |
| [34] | Lundberg S M, Erion G, Chen H,et al.From local explanations to global understanding with explainable AI for trees[J].Nature Machine Intelligence,2020,2(1):56-67. |
| [35] | Butterfield Z, Magney T, Grossmann K,et al.Accounting for changes in radiation improves the ability of SIF to track water stress-induced losses in summer GPP in a temperate deciduous forest[J].Journal of Geophysical Research:Biogeosciences,2023,128(7):e2022JG007352. |
| [36] | Chen J D, Liu X J, Yang G J,et al.Different responses of solar-induced chlorophyll fluorescence at the red and far-red bands and gross primary productivity to air temperature for winter wheat[J].Remote Sensing,2022,14(13):3076. |
| [37] | Peng J L, Tang J W, Xie S D,et al.Evidence for the acclimation of ecosystem photosynthesis to soil moisture[J].Nature Communications,2024,15(1):9795. |
| [38] | Chen C, Park T, Wang X H,et al.China and India lead in greening of the world through land-use management[J].Nature Sustainability,2019,2(2):122-129. |
| [39] | Konings A G, Williams A P, Gentine P.Sensitivity of grassland productivity to aridity controlled by stomatal and xylem regulation[J].Nature Geoscience,2017,10(4):284-288. |
| [40] | Forkel M, Carvalhais N, Rödenbeck C,et al.Enhanced seasonal CO2 exchange caused by amplified plant productivity in northern ecosystems[J].Science,2016,351(6274):696-699. |
| [41] | Zhao M S, Running S W.Drought-induced reduction in global terrestrial net primary production from 2000 through 2009[J].Science,2010,329(5994):941-943. |
| [42] | Jung M, Reichstein M, Ciais P,et al.Recent decline in the global land evapotranspiration trend due to limited moisture supply[J].Nature,2010,467(7318):951-954. |
| [43] | Porcar-Castell A, Tyystjärvi E, Atherton J,et al.Linking chlorophyll a fluorescence to photosynthesis for remote sensing applications:mechanisms and challenges[J].Journal of Experimental Botany,2014,65(15):4065-4095. |
| [44] | Wohlfahrt G, Gerdel K, Migliavacca M,et al.Sun-induced fluorescence and gross primary productivity during a heat wave[J].Scientific Reports,2018,8(1):14169. |
| [45] | Jung M, Reichstein M, Schwalm C R,et al.Compensatory water effects link yearly global land CO2 sink changes to temperature[J].Nature,2017,541(7638):516-520. |
| [46] | Grossiord C, Buckley T N, Cernusak L A,et al.Plant responses to rising vapor pressure deficit[J].New Phytologist,2020,226(6):1551-1566. |
| [47] | Yuan W P, Zheng Y, Piao S L,et al.Increased atmospheric vapor pressure deficit reduces global vegetation growth[J].Science Advances,2019,5(8):eaax1396. |
| [1] | 鹿晨昱, 段庄慧, 张劲松, 赵文婧. 黄河流域甘肃段农业绿色发展效率综合测度及影响因素[J]. 中国沙漠, 2026, 46(4): 147-159. |
| [2] | 王浩伊, 俞潇, 辛智鸣, 马媛, 罗凤敏, 李星, 崔健, 卢嘉华. 荒漠草原典型灌木群落土壤养分多年变化与驱动因子[J]. 中国沙漠, 2026, 46(4): 250-265. |
| [3] | 钟文, 王让会, 孙茂森. 基于SNIC分割的干旱区光伏场植被响应识别[J]. 中国沙漠, 2026, 46(4): 354-364. |
| [4] | 石瑾, 李港滩, 尚凤仪. 甘肃省县域农业高质量发展的时空演变及驱动机制[J]. 中国沙漠, 2026, 46(4): 77-88. |
| [5] | 李晓鹏, 李康, 徐静, 贾富贵, 雷双. 基于XGBoost-SHAP方法的黄土高原生态质量演变及驱动因素分析[J]. 中国沙漠, 2026, 46(3): 175-186. |
| [6] | 杜会石, 吴兴耀, 哈斯额尔敦. 1980—2024年中国沙漠地区景观演变特征[J]. 中国沙漠, 2026, 46(2): 201-210. |
| [7] | 朱前涛, 刘人宁, 任珩. 2004—2023年祁连山草地畜牧业生态效率及收敛性[J]. 中国沙漠, 2026, 46(1): 95-104. |
| [8] | 李思琪, 王海兵, 袁晓飞, 敖胡日查, 杨皓钦. 毛乌素沙地景观生态风险时空演变及驱动力[J]. 中国沙漠, 2025, 45(5): 230-240. |
| [9] | 胡昕, 买买提·沙吾提, 张峰, 崔锦涛, 艾尼玩·艾买尔, 阿斯娅·曼力克. 基于蒲公英优化随机森林模型的沙漠土壤Fe2O3 含量高光谱遥感反演[J]. 中国沙漠, 2025, 45(2): 191-204. |
| [10] | 李彬, 孙小龙, 赵悦晨, 江琪, 卢士庆, 唐家琦. 基于随机森林的局地起沙量预测评估模型[J]. 中国沙漠, 2025, 45(1): 292-303. |
| [11] | 史利江, 李前锦, 高杉, 李永宁, 姚晓军, 张晓龙, 张殷波, 高峰. 黄河中游城市群绿色技术创新能力的时空演变与影响因素[J]. 中国沙漠, 2024, 44(6): 122-134. |
| [12] | 周虹吉, 梅凡民, 蒲梦洁, 林川, 苏进, 陈金广. 基于集成学习的风沙跃移轨迹自动识别模型[J]. 中国沙漠, 2024, 44(6): 70-78. |
| [13] | 宁婷, 张定海, 赵有益, 江晶. 腾格里沙漠土壤水分含量与地形、植被的关系[J]. 中国沙漠, 2024, 44(5): 133-142. |
| [14] | 张腾, 苗运法, 邹亚国, 张孜越, 冯国平. 极端干旱区苏干湖湿地植被分类与变化分析[J]. 中国沙漠, 2024, 44(4): 81-90. |
| [15] | 徐晨曦, 万红莲, 何若楠, 殷鹏, 倪敬峰, 黄敏, 王晓利. 关中平原城市群脆弱性时空演变与驱动因子[J]. 中国沙漠, 2023, 43(6): 111-120. |
| 阅读次数 | ||||||
|
全文 |
|
|||||
|
摘要 |
|
|||||
©2018中国沙漠 编辑部
地址: 兰州市天水中路8号 (730000)
电话:0931-8267545
Email:caiedit@lzb.ac.cn;desert@lzb.ac.cn


 甘公网安备 62010202000688号