中国沙漠 ›› 2026, Vol. 46 ›› Issue (5): 285-299.DOI: 10.7522/j.issn.1000-694X.2026.00145
邱梦雨1( ), 张德帅1, 杜建会1,2()
收稿日期:2026-05-13
修回日期:2026-08-13
出版日期:2026-09-20
发布日期:2026-11-02
通讯作者:
杜建会
作者简介:邱梦雨(2006—),女,四川九寨沟人,研究方向为全球变化与生态水文。E-mail: qiumy23@mail2.sysu.edu.cn
基金资助:
Mengyu Qiu1(), Deshuai Zhang1, Jianhui Du1,2()
Received:2026-05-13
Revised:2026-08-13
Online:2026-09-20
Published:2026-11-02
Contact:
Jianhui Du
摘要:
青藏高原风光资源丰富,是中国重要的清洁能源战略储备基地。然而,气候变暖正显著改变高原风速和太阳辐射等关键气象要素,加剧了风光资源开发的不确定性。加之资源禀赋与人口分布存在空间错配,系统评估未来气候风险格局尤为必要。本研究基于NEX-GDDP-CMIP6多模式集合数据,在3种共享社会经济路径(Shared Socioeconomic Pathways,SSPs)下,模拟了青藏高原风能发电潜力(wind power potential,Pwind)与光伏发电潜力(solar power potential,Psolar)的未来长期平均变化,并量化了年内波动性、极端事件及日际急升骤降的多时间尺度变化特征。结果表明:(1)青藏高原风光发电潜力对温室气体排放高度敏感,低排放情景下Pwind下降4.2%、Psolar小幅上升,高排放情景下两者降幅分别达10.9%和2.8%,风电脆弱性更大。(2)排放越高,年内波动性与日际急升骤降频率越强,高排放情景下风电年内波动性增幅达8.6%,急升骤降影响月份从不足半年扩展至全年多数月份;极端事件呈现明显的季节分异,风电极端高发电事件在所有情景下均未发生。(3)风光联合开发可有效缓释单一能源的气候风险。高排放情景下风光耦合使高及极高风险区占比由单一能源的75.1%和69.5%降至4.7%。
中图分类号:
邱梦雨, 张德帅, 杜建会. 未来气候情景下青藏高原风光发电潜力的时空演变与风险评估[J]. 中国沙漠, 2026, 46(5): 285-299.
Mengyu Qiu, Deshuai Zhang, Jianhui Du. Spatiotemporal evolution and risk assessment of wind and solar power generation potential under future climate scenarios on the Qinghai-Xizang Plateau[J]. Journal of Desert Research, 2026, 46(5): 285-299.
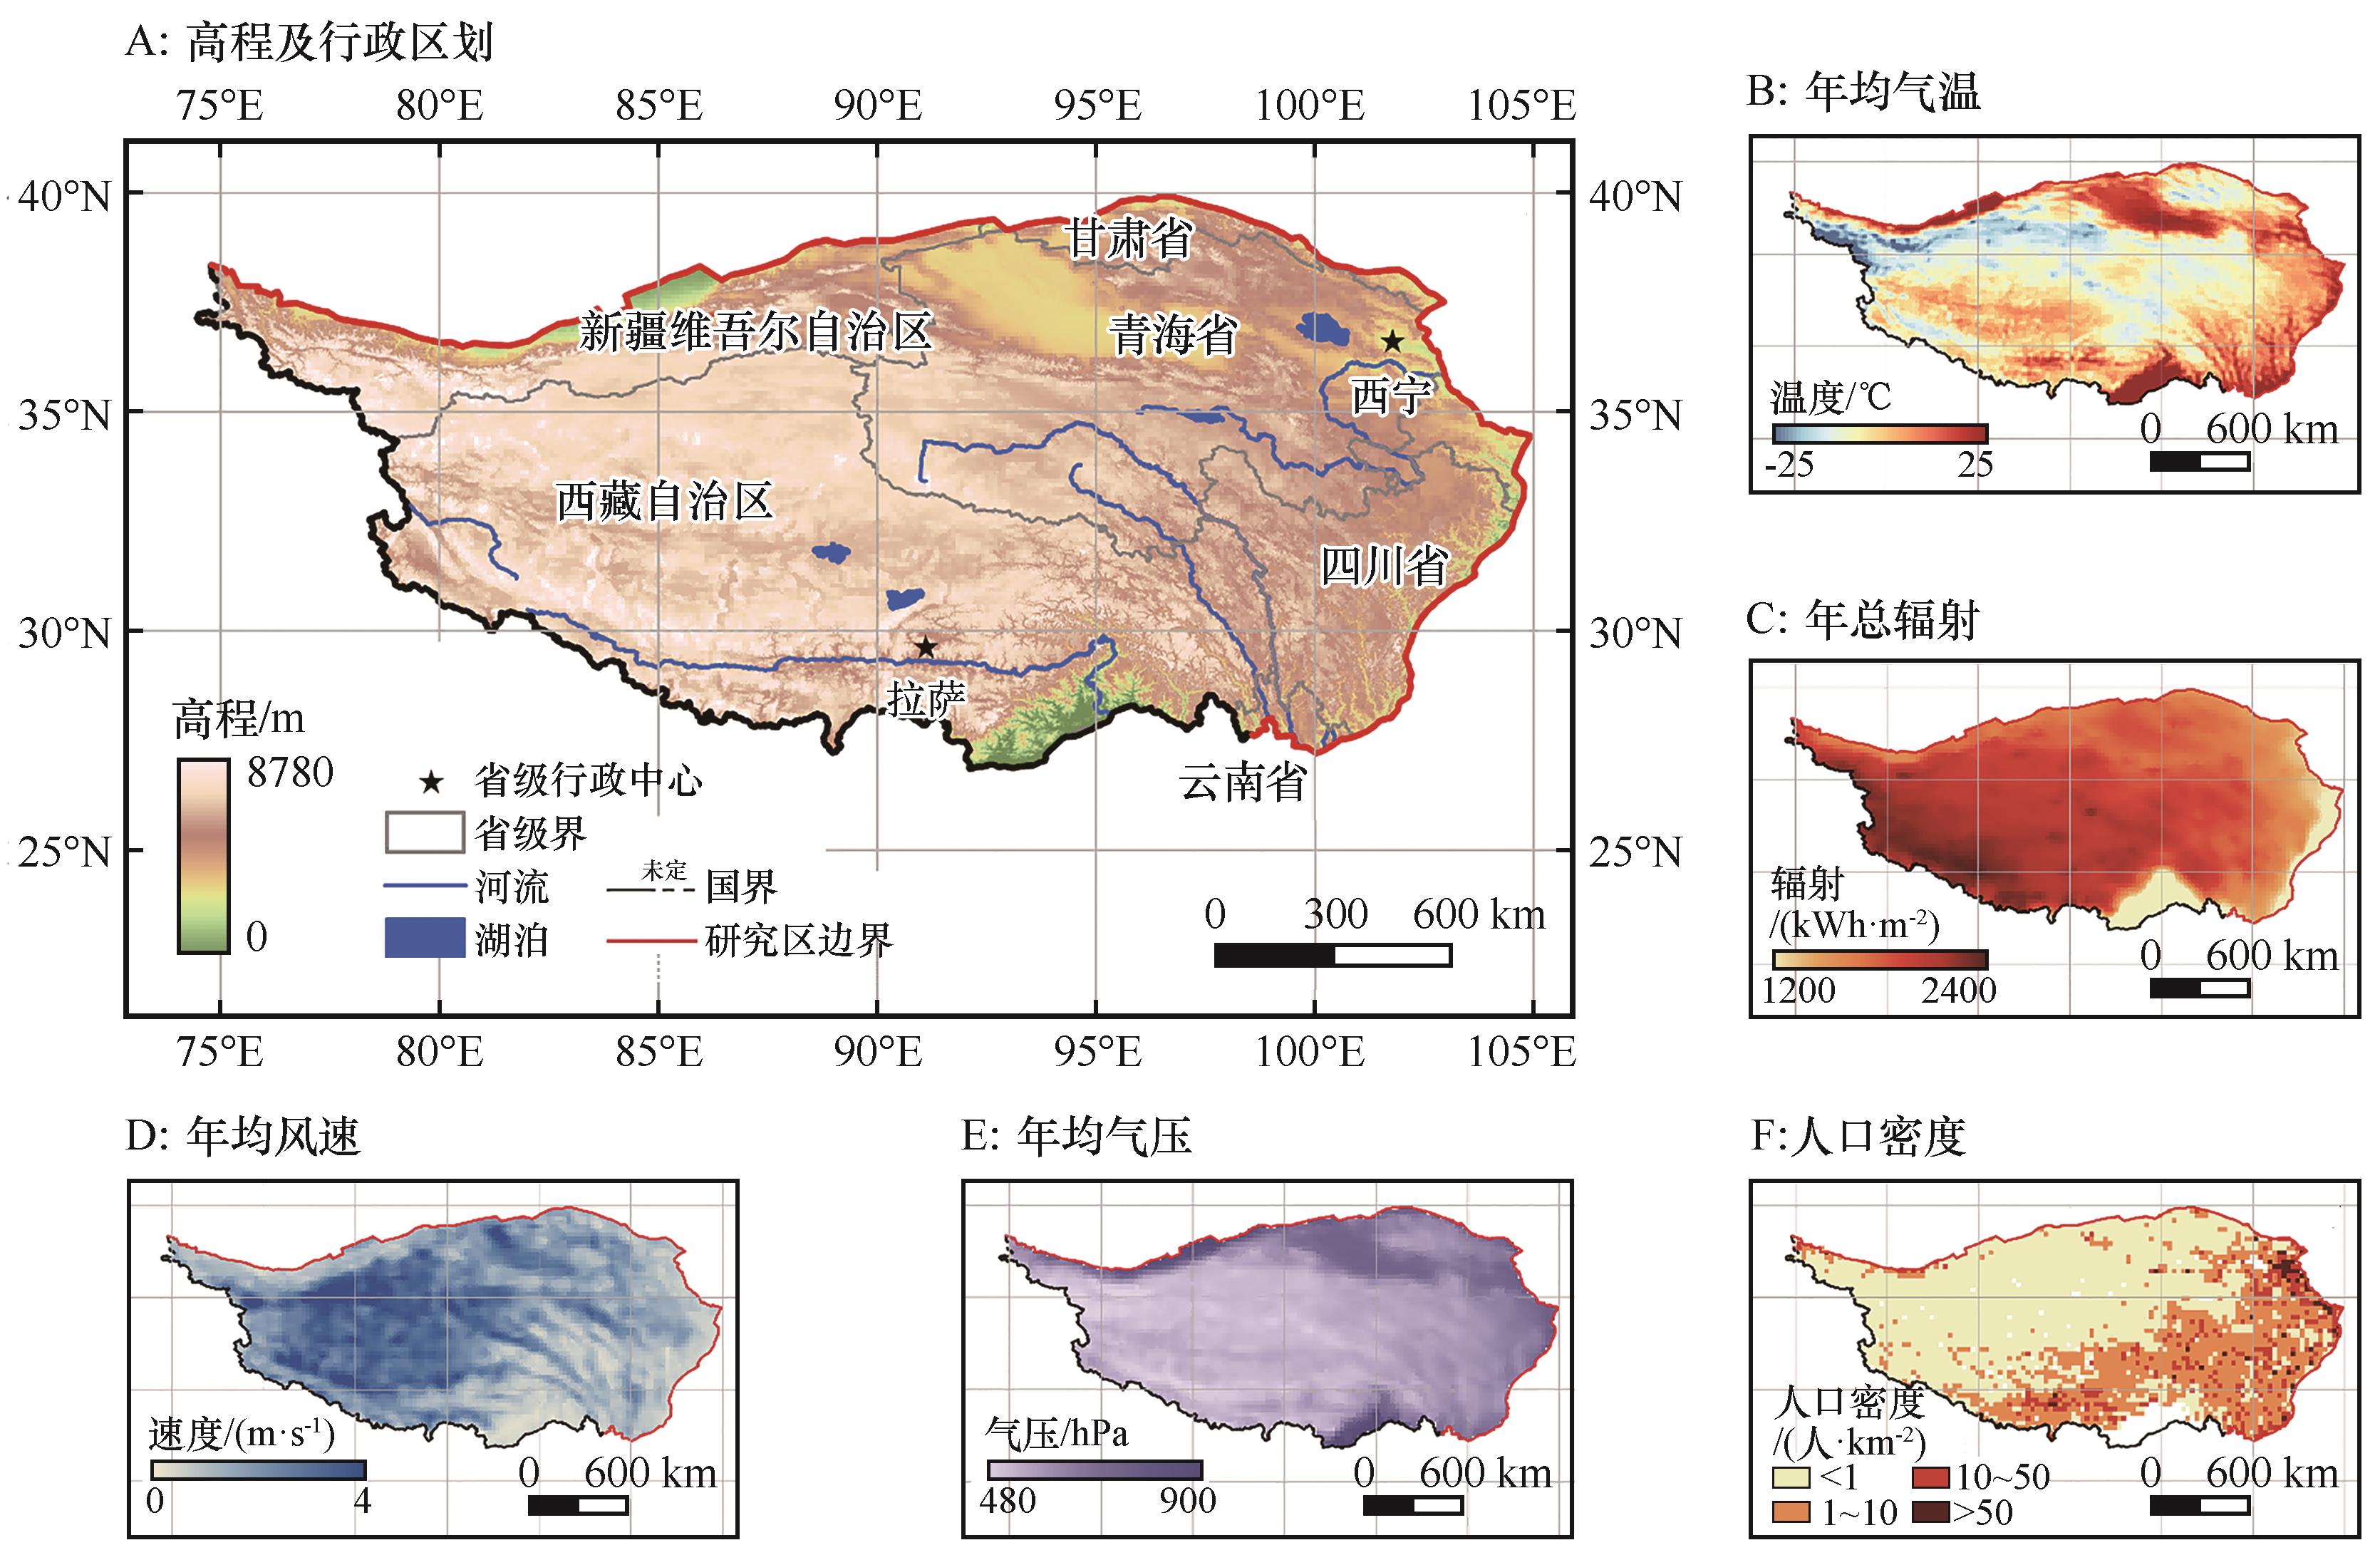
图1 研究区概况注:基于自然资源部标准地图服务网站审图号GS(2023)2767号标准地图制作,底图无修改
Fig.1 Overview of the study area
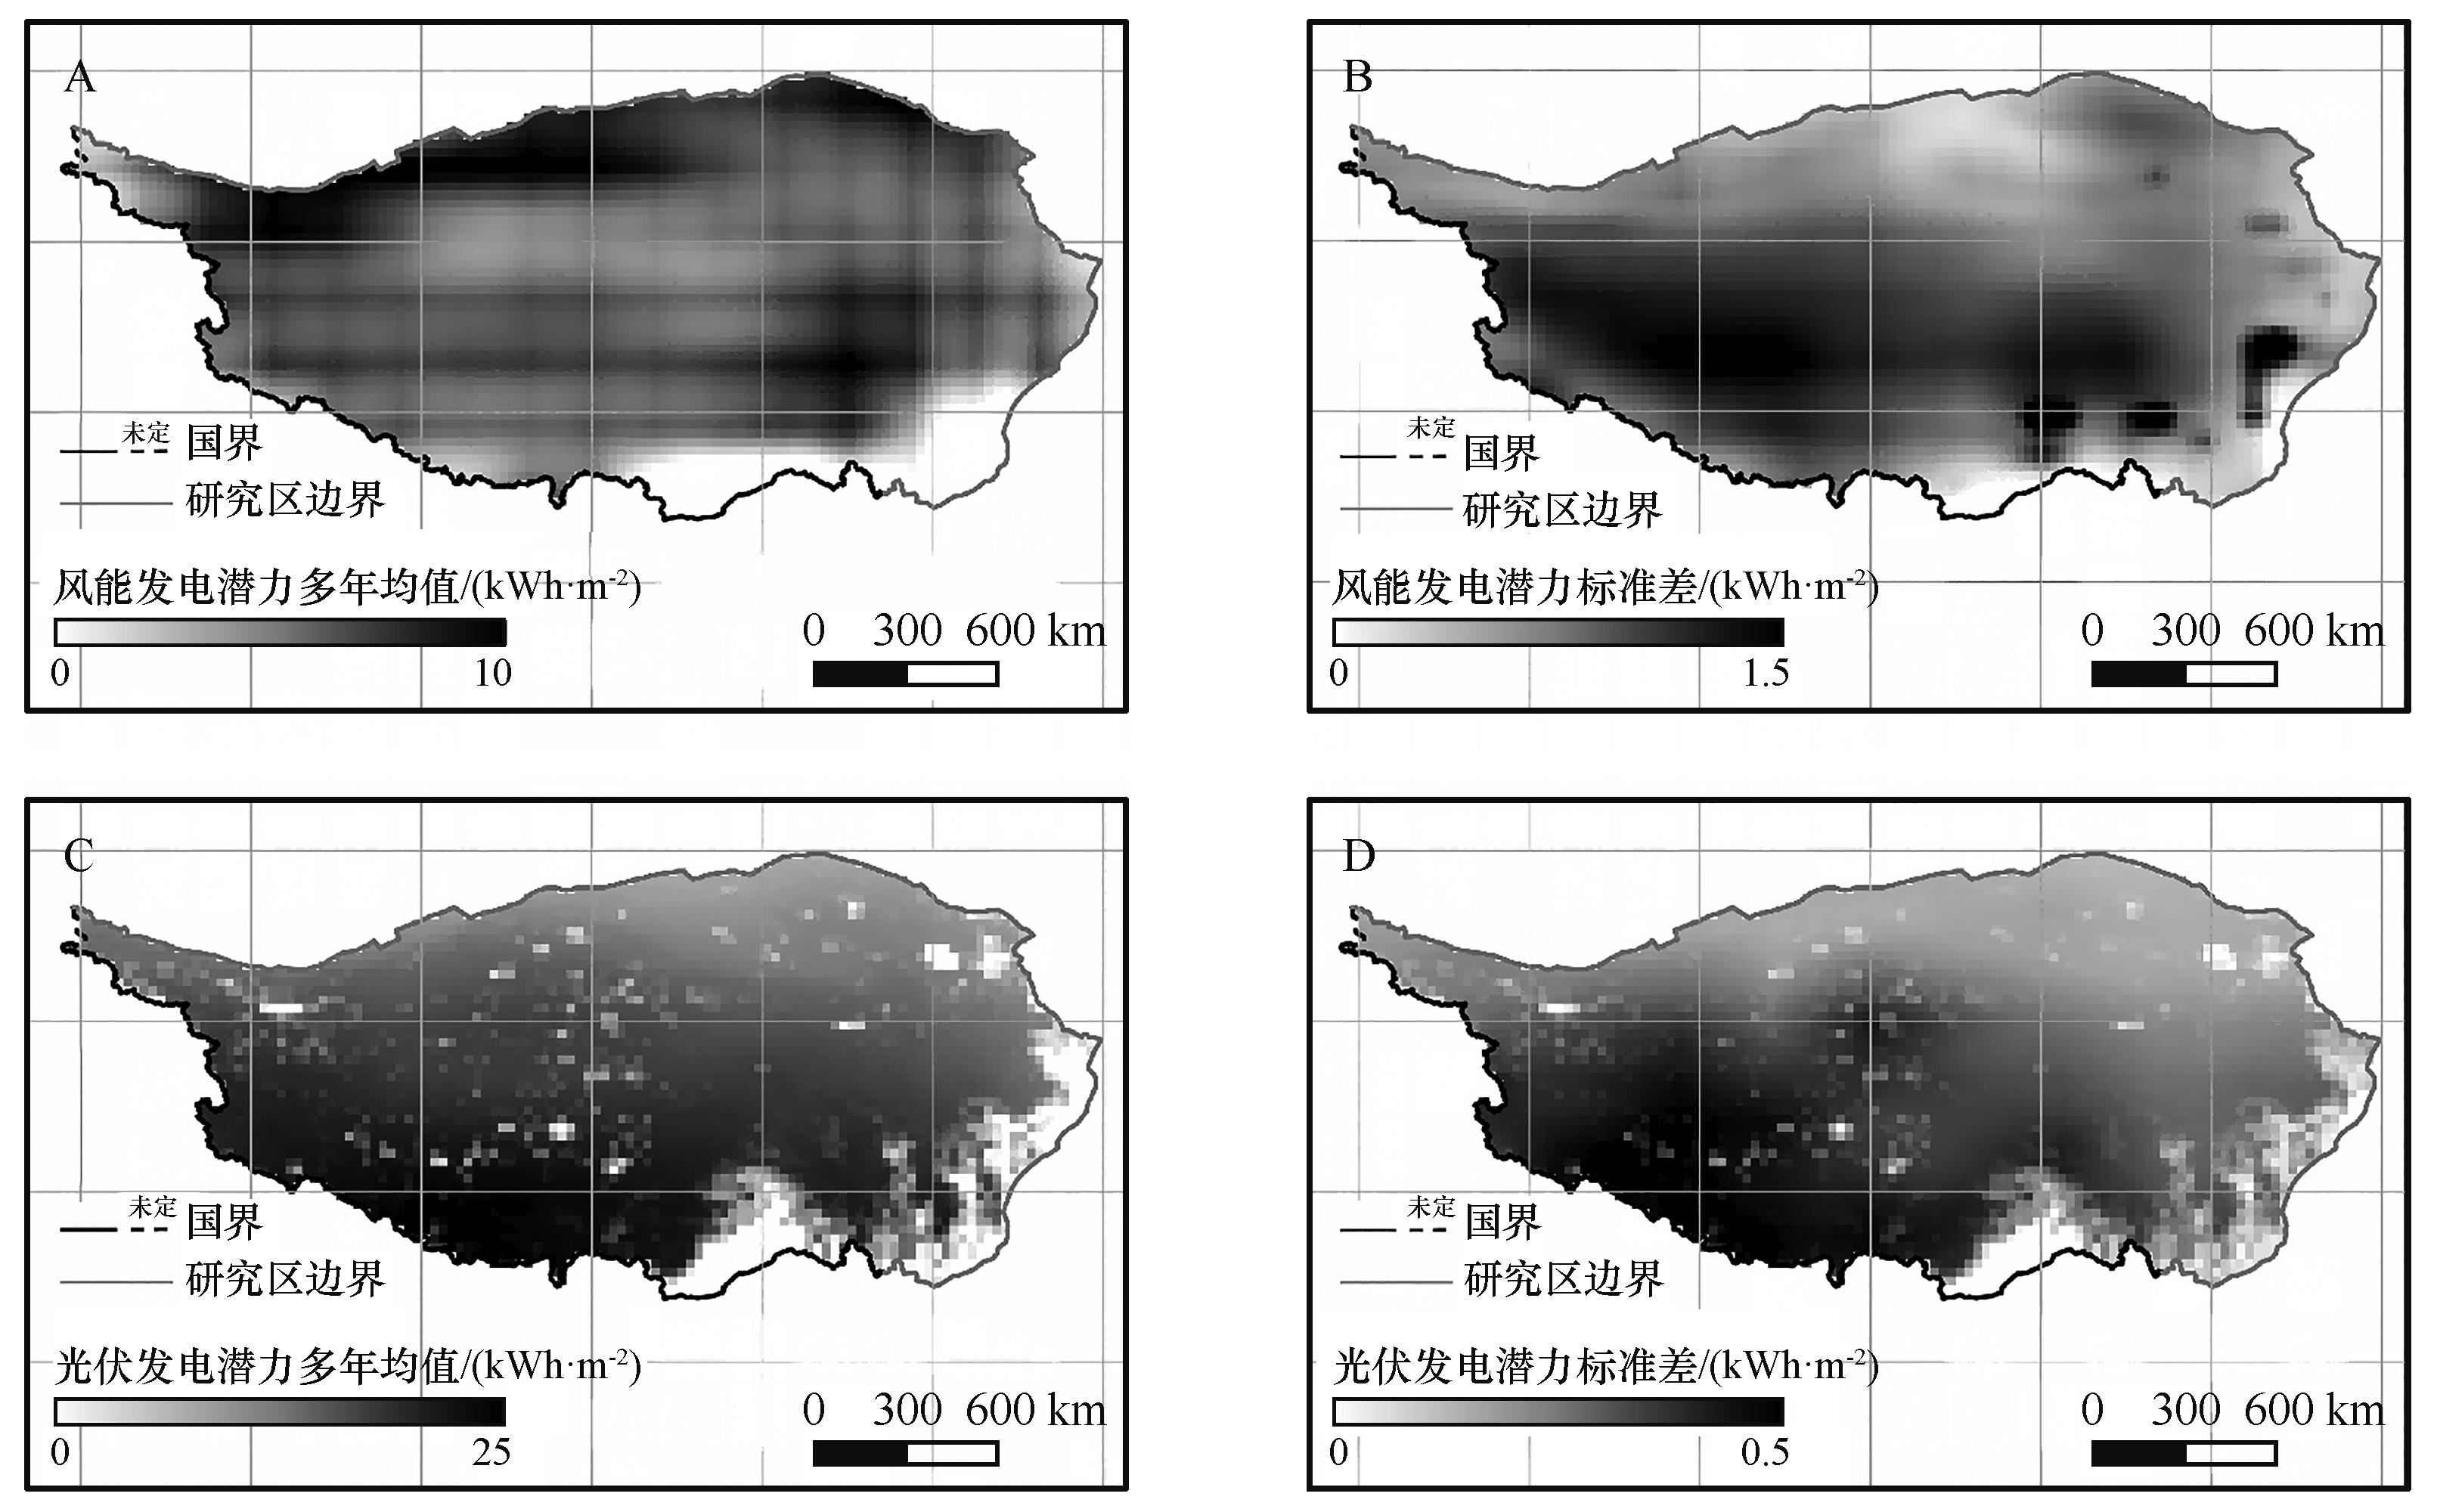
图2 2015—2024年风光发电潜力多年平均值与标准差的空间分布注:基于自然资源部标准地图服务网站审图号GS(2023)2767号标准地图制作,底图无修改
Fig.2 Spatial distribution of multi-year average wind and photovoltaic power generation potential across the Qinghai-Xizang Plateau during 2015-2024. A indicates multi-year average of wind power generation potential. B indicates standard deviation of wind power generation potential. C indicates multi-year average of solar photovoltaic power generation potential. D indicates standard deviation of solar photovoltaic power generation potential
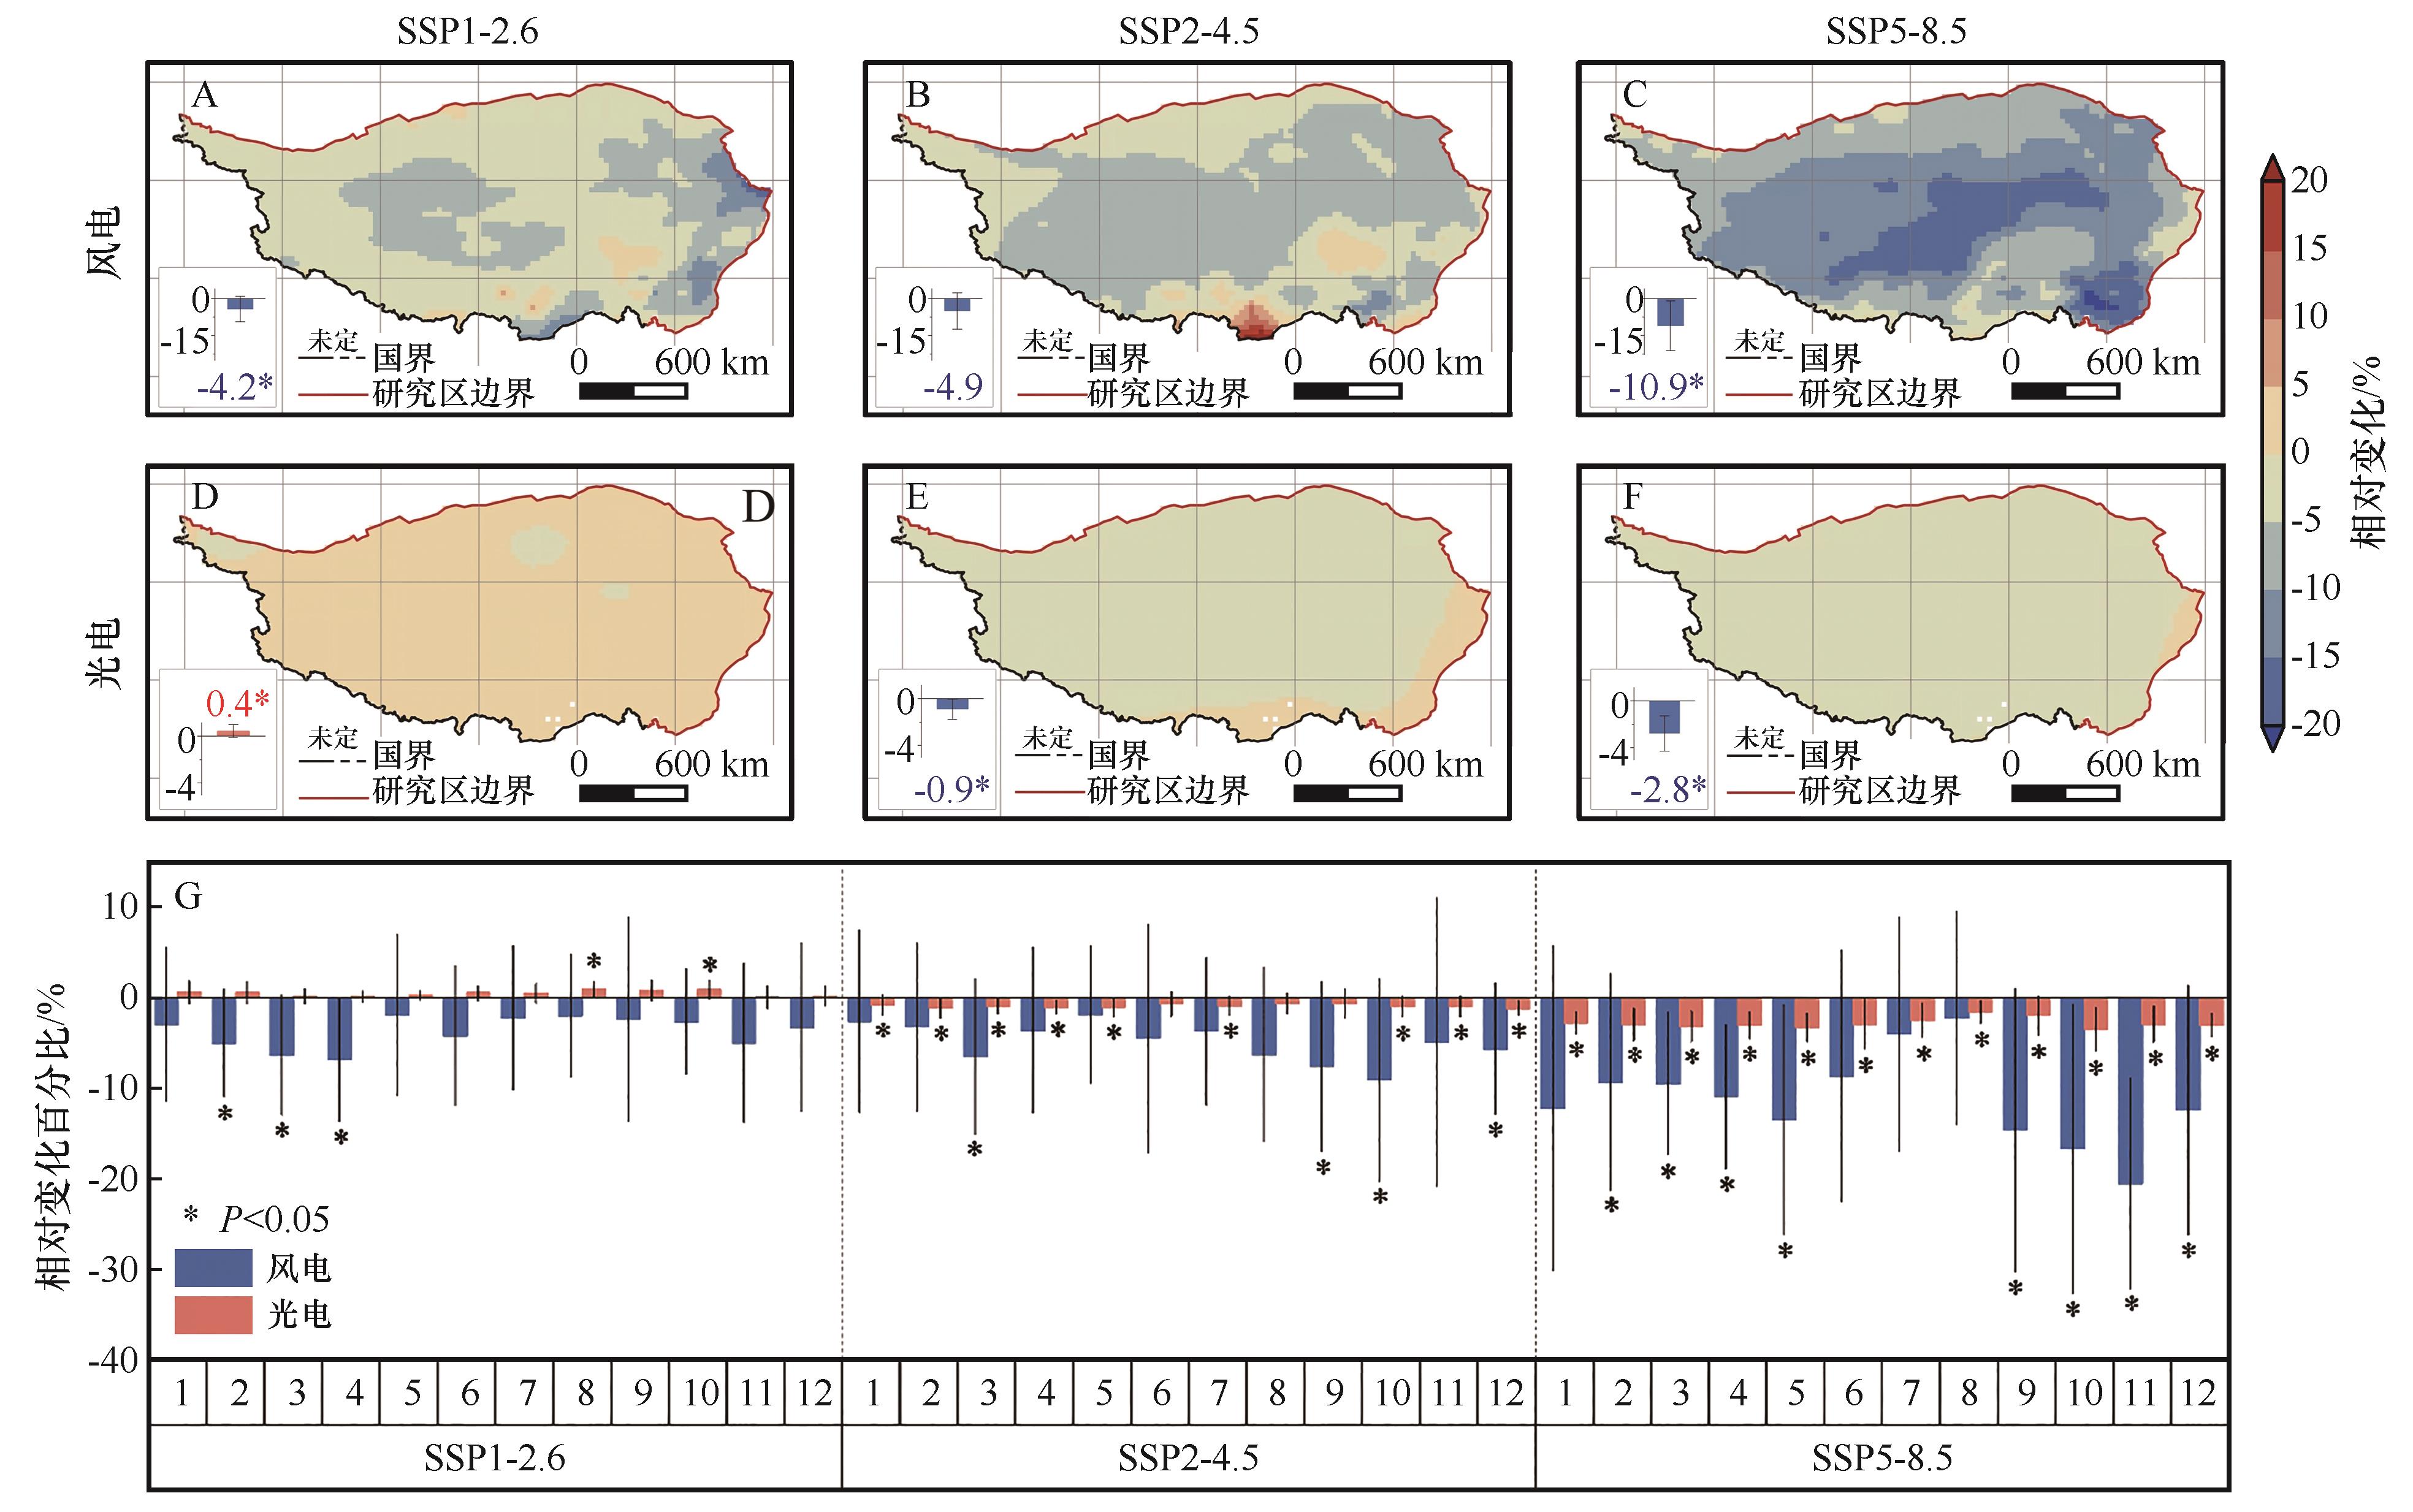
图3 未来不同排放情景下青藏高原风光发电潜力的长期平均相对变化。A~C为Pwind的年代际相对变化,D~F为Psolar的年代际相对变化,G为Pwind和Psolar的月际相对变化。误差棒表示基于多气候模式(NEX-GDDP-CMIP6)集合模拟结果的标准差,*表示每个变量变化的统计显著性(P<0.05)注:基于自然资源部标准地图服务网站审图号GS(2023)2767号标准地图制作,底图无修改
Fig.3 Relative changes in wind power generation potential and solar photovoltaic power generation potential across the Qinghai-Xizang Plateau under different GHG emission scenarios. A-C indicate relative changes in Pwind on the interannual scale. D-F indicate relative changes in Psolar on the interannual scale. G indicates relative changes in Pwind and Psolar on the seasonal scale. Error bars represent the standard deviation in the ensemble estimation of climate forcing based on different NEX-GDDP-CMIP6 models. Asterisks (*) indicate the statistical significance of changes in each variable (P<0.05)
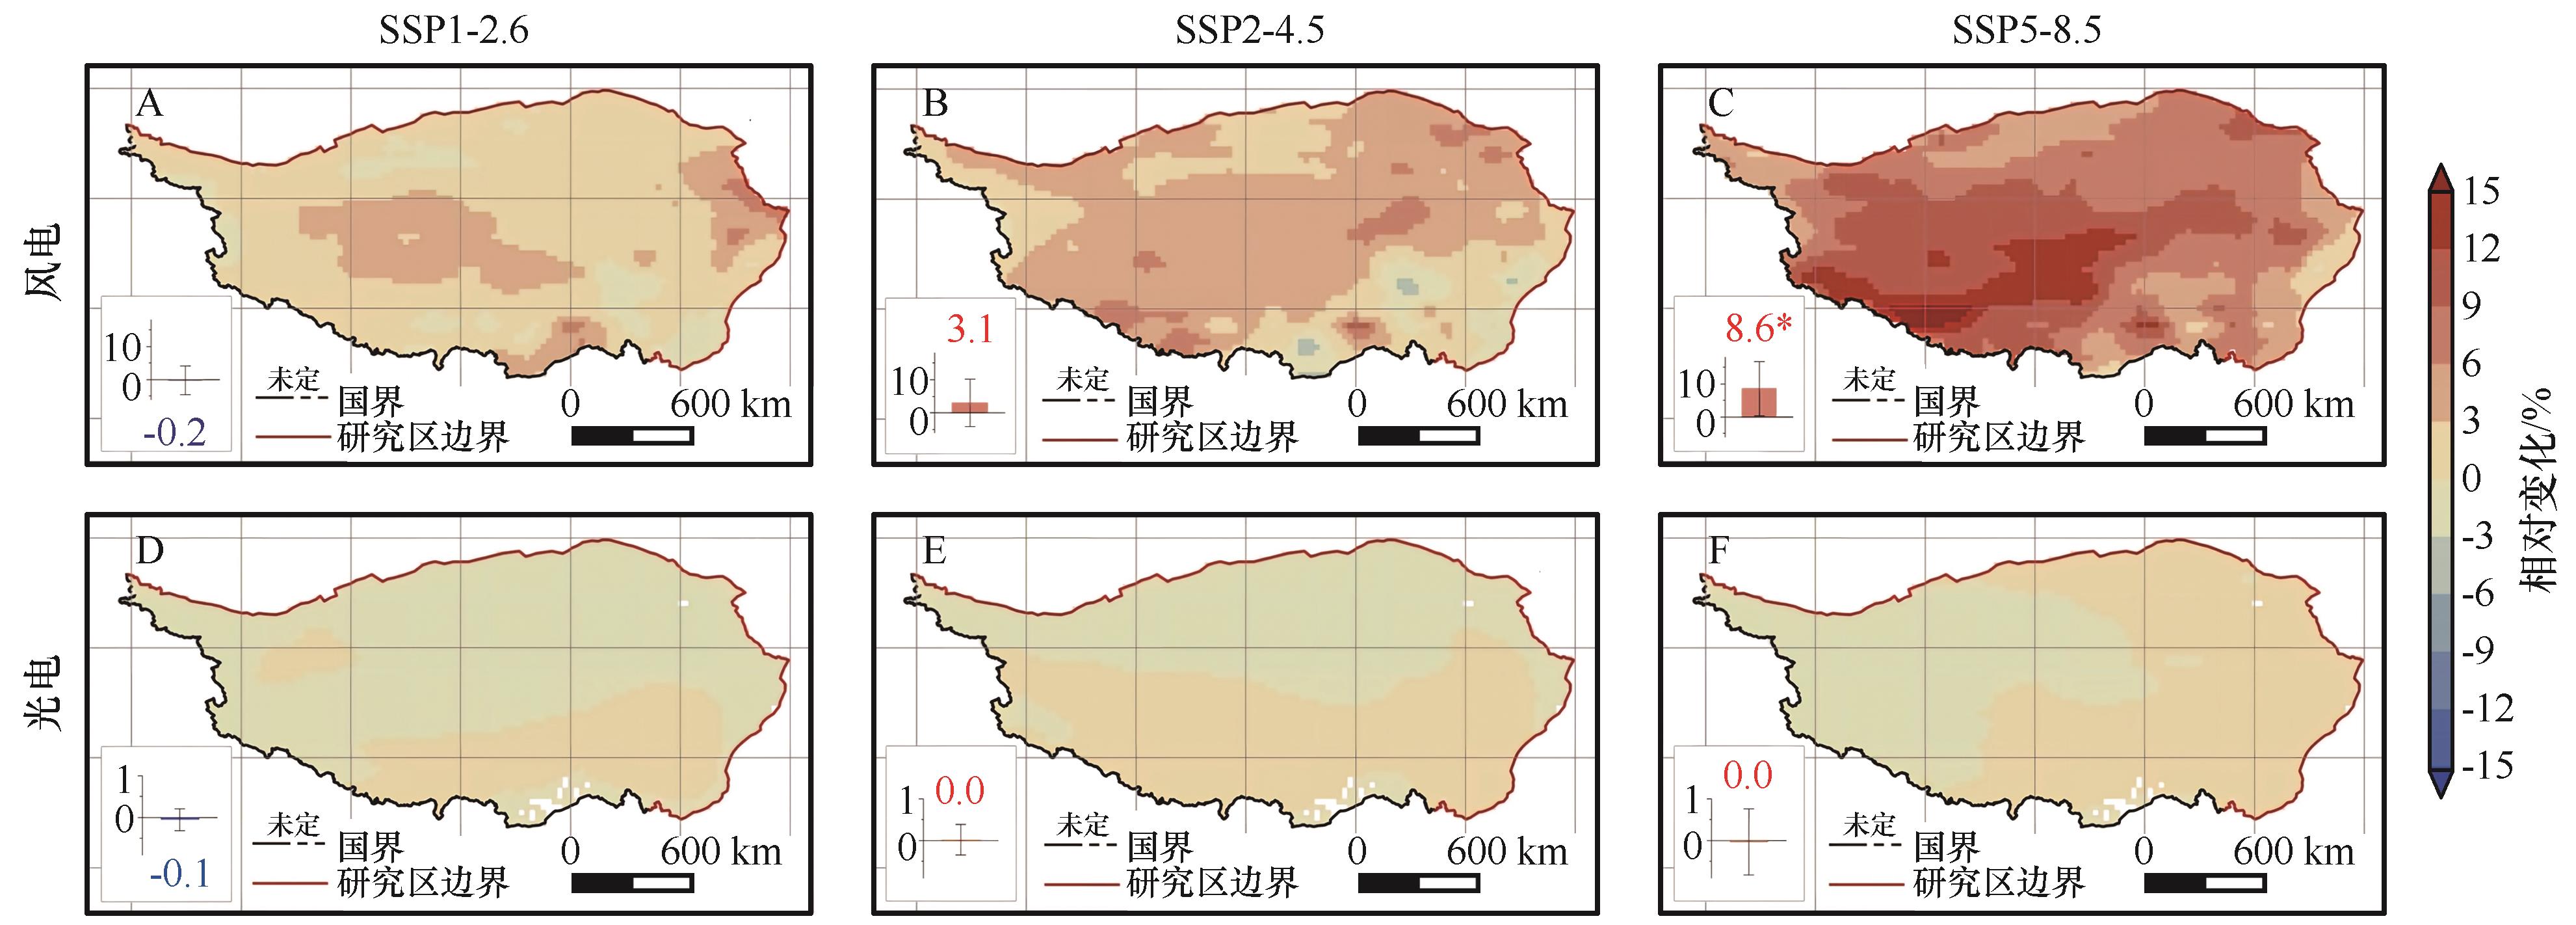
图4 未来不同排放情景下青藏高原风光发电潜力年内波动性的相对变化。A~C为Pwind年内波动性的相对变化,D~F为Psolar年内波动性的相对变化。误差棒表示基于多气候模式(NEX-GDDP-CMIP6)集合模拟结果的标准差,*表示每个变量变化的统计显著性(P<0.05)注:基于自然资源部标准地图服务网站审图号GS(2023)2767号标准地图制作,底图无修改
Fig.4 Intra-annual relative changes in wind and solar power generation potential on the Qinghai-Xizang Plateau under different future emission scenarios. A-C indicate relative changes in intra-annual variability of Pwind. D-F indicate relative changes in intra-annual variability of Psolar. Error bars represent the standard deviation across the multi-model ensemble (NEX-GDDP-CMIP6). Asterisks (*) indicate statistical significance of the change (P<0.05)
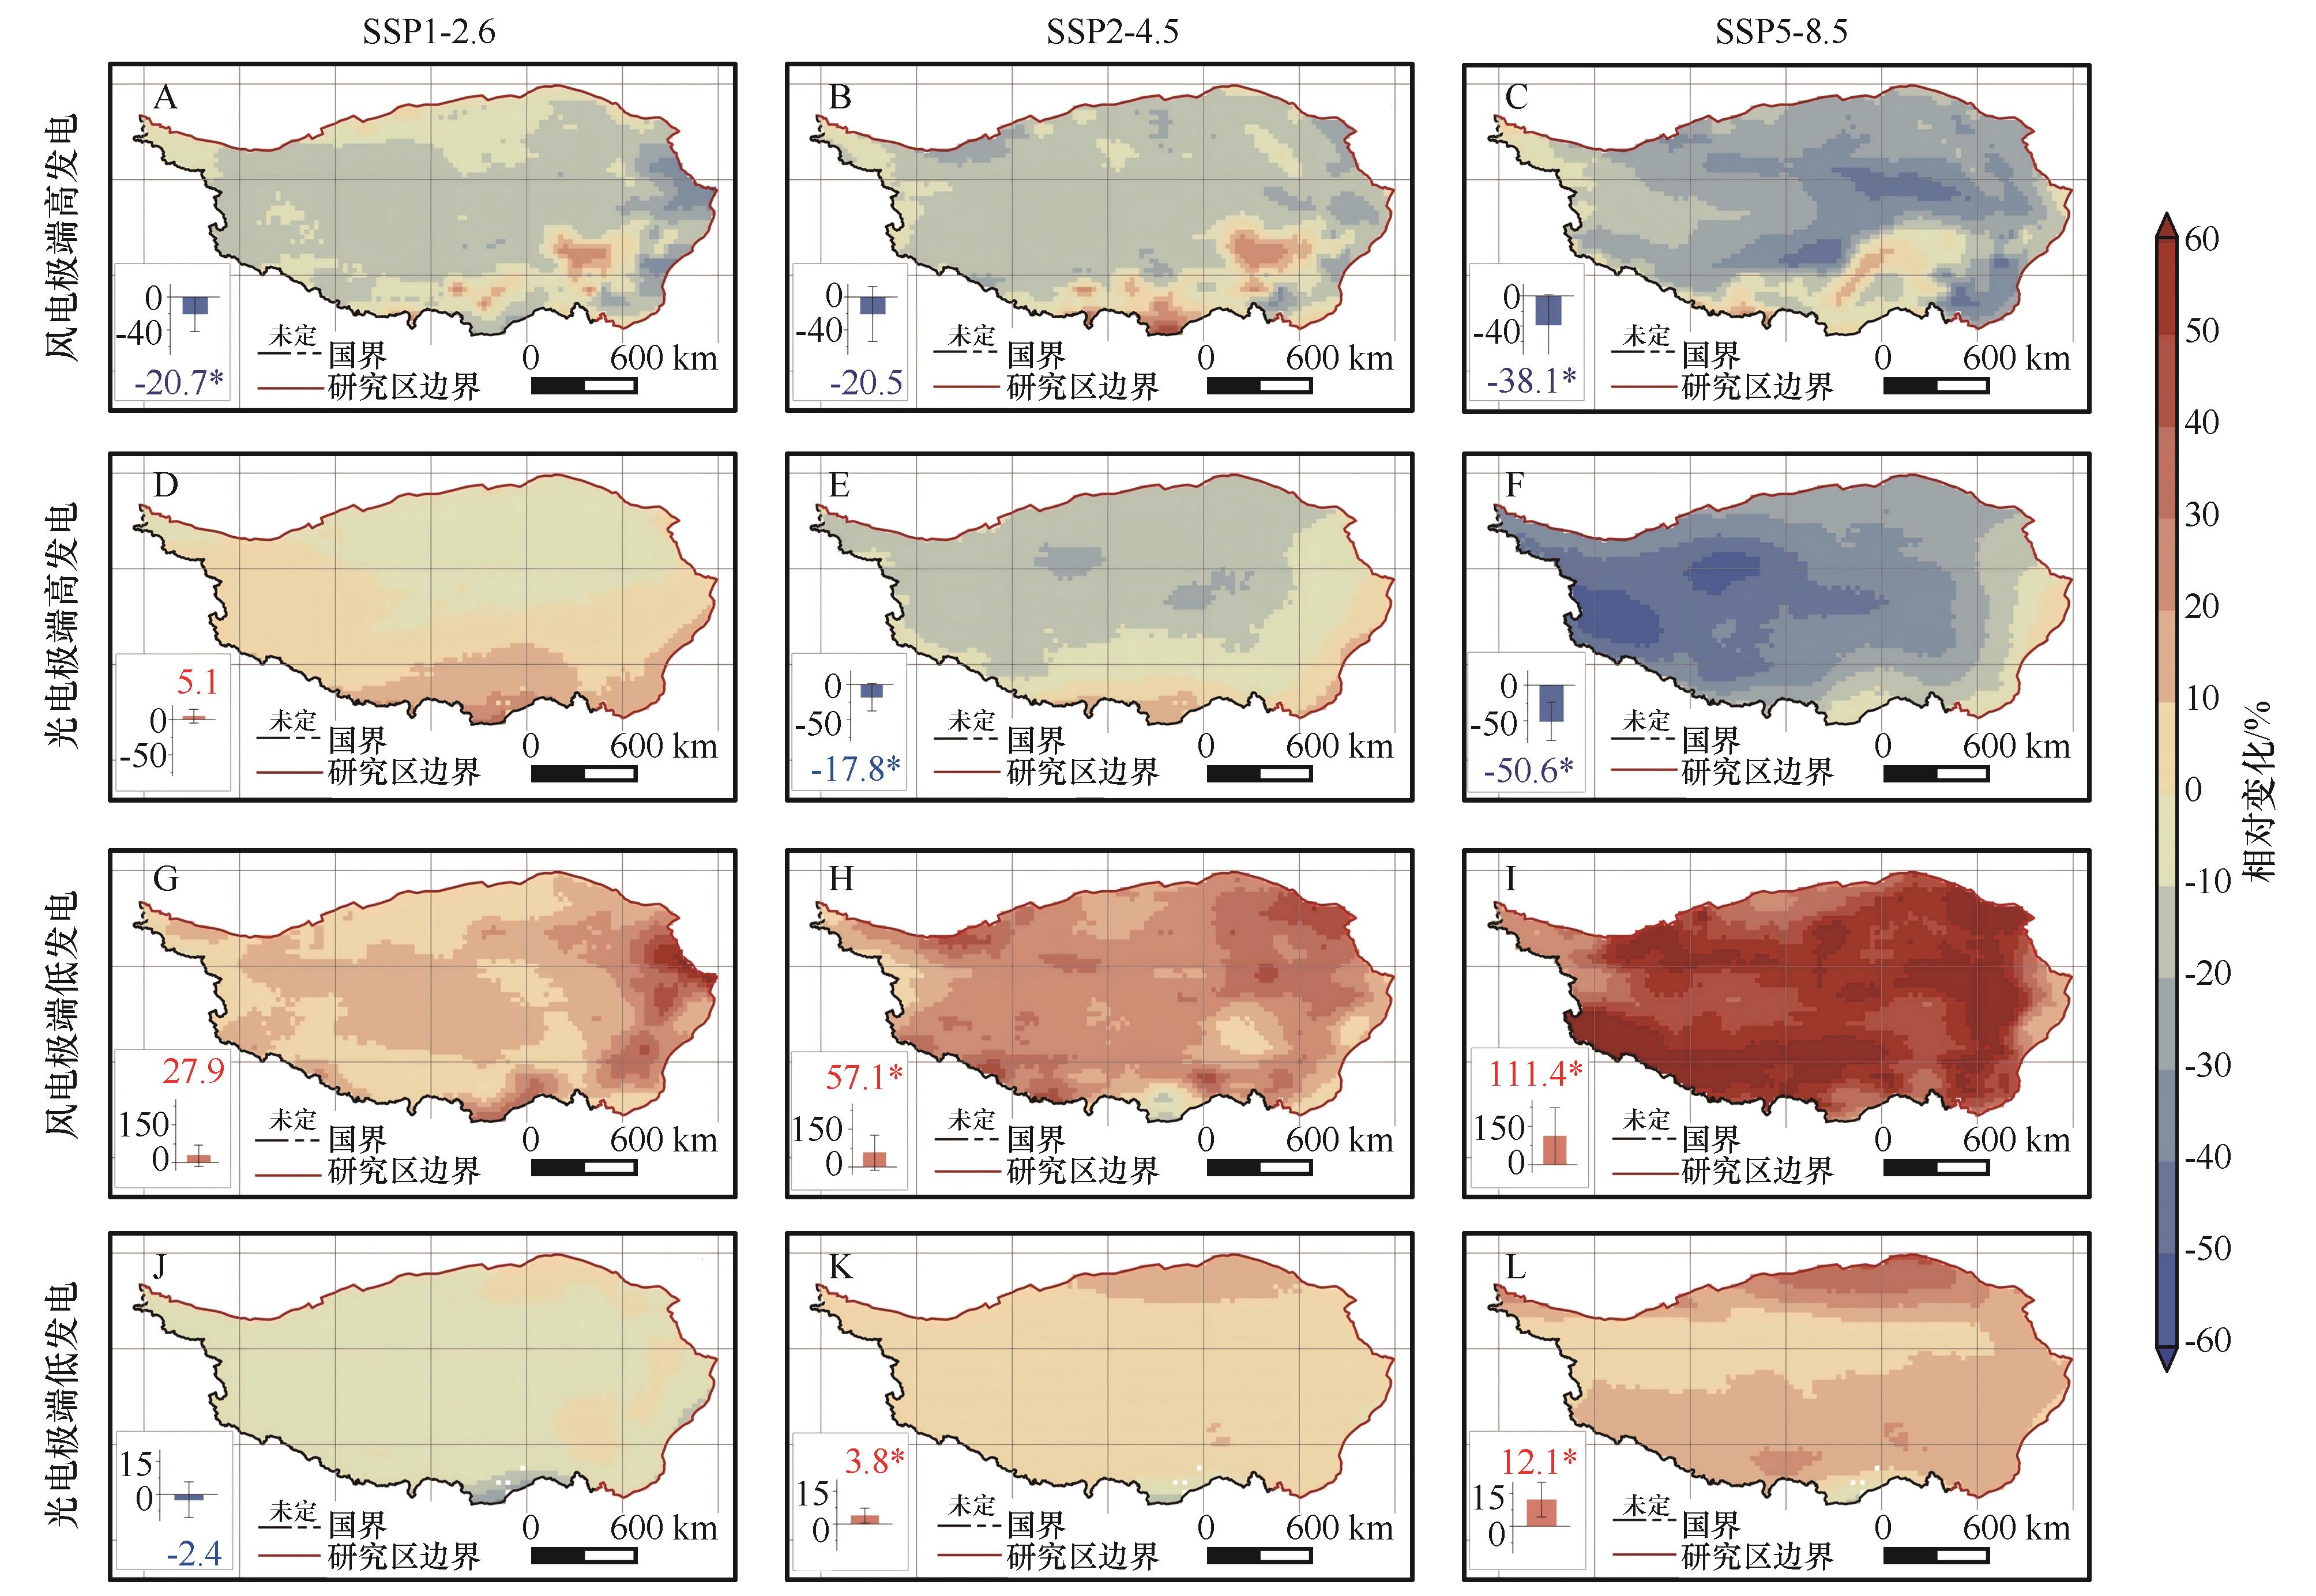
图5 未来不同排放情景下青藏高原极端发电事件的相对变化。A~C为Pwind极端高发电潜力日频率相对变化,D~F为Psolar极端高发电潜力日频率相对变化,G~I为Pwind极端低发电潜力日频率相对变化,J~L为Psolar极端低发电潜力日频率相对变化注:基于自然资源部标准地图服务网站审图号GS(2023)2767号标准地图制作,底图无修改
Fig.5 Relative changes in extreme power generation events across the Qinghai-Xizang Plateau under different future emission scenarios. A-C indicate relative changes in the frequency of days with extremely high wind power generation potential Pwind. D-F indicate relative changes in the frequency of days with extremely high solar power generation potential Psolar. G-I indicate relative changes in the frequency of days with extremely low wind power generation potential Pwind. J-L indicate relative changes in the frequency of days with extremely low solar power generation potential Psolar
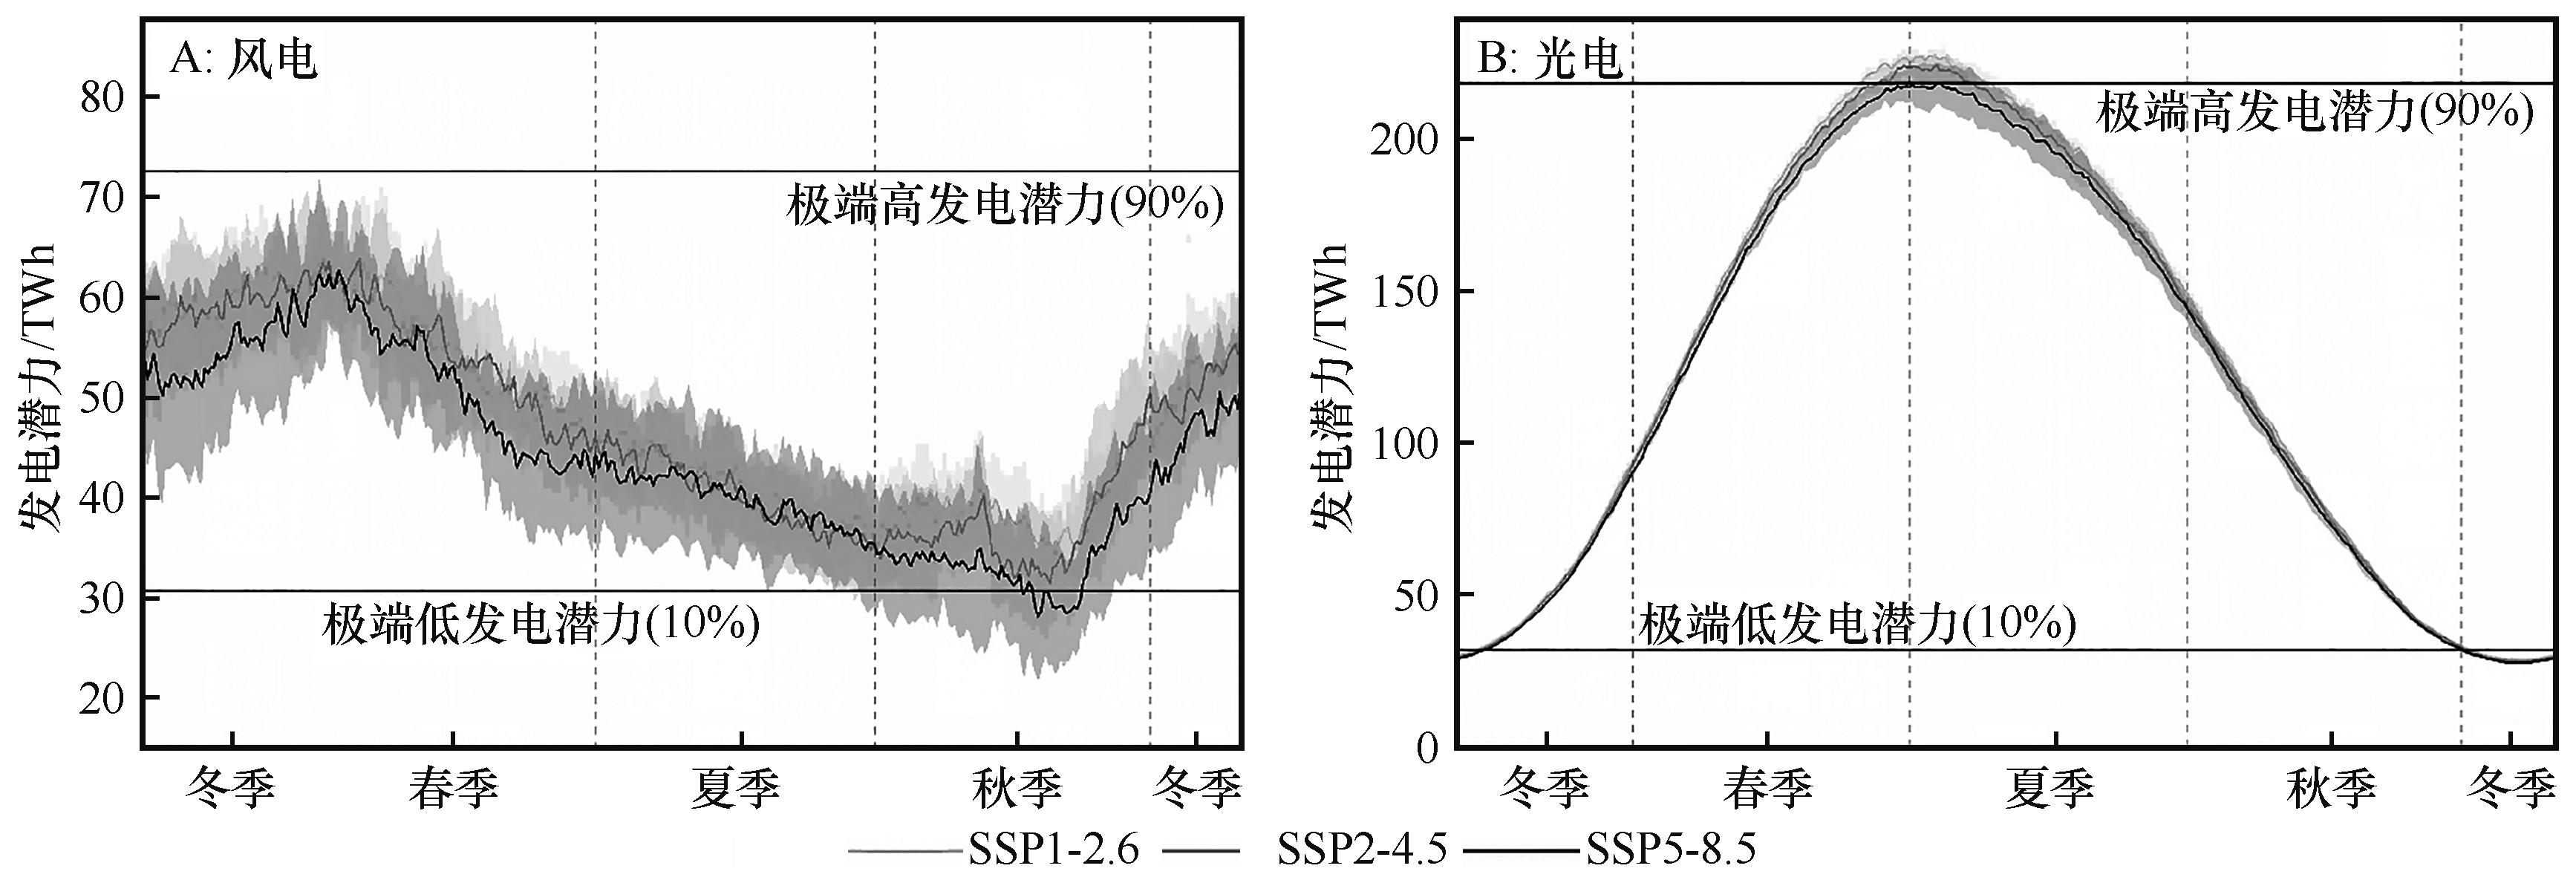
图6 未来不同排放情景下青藏高原光能和风能极端发电事件的季节演变趋势。实线表示多模型集合(NEX-GDDP-CMIP6)估计值的均值,阴影区域表示多模型集合估计值的标准差
Fig.6 Evolution trends of intra-annual extreme power generation events of wind and solar energy on the Qinghai-Xizang Plateau under different future emission scenarios. A indicates intra-annual evolution trend of extreme wind power generation events. B indicates intra-annual evolution trend of extreme photovoltaic power generation events. Solid lines represent the mean values estimated by the multi-model ensemble (NEX-GDDP-CMIP6), and shaded areas indicate the standard deviation of multi-model ensemble estimates
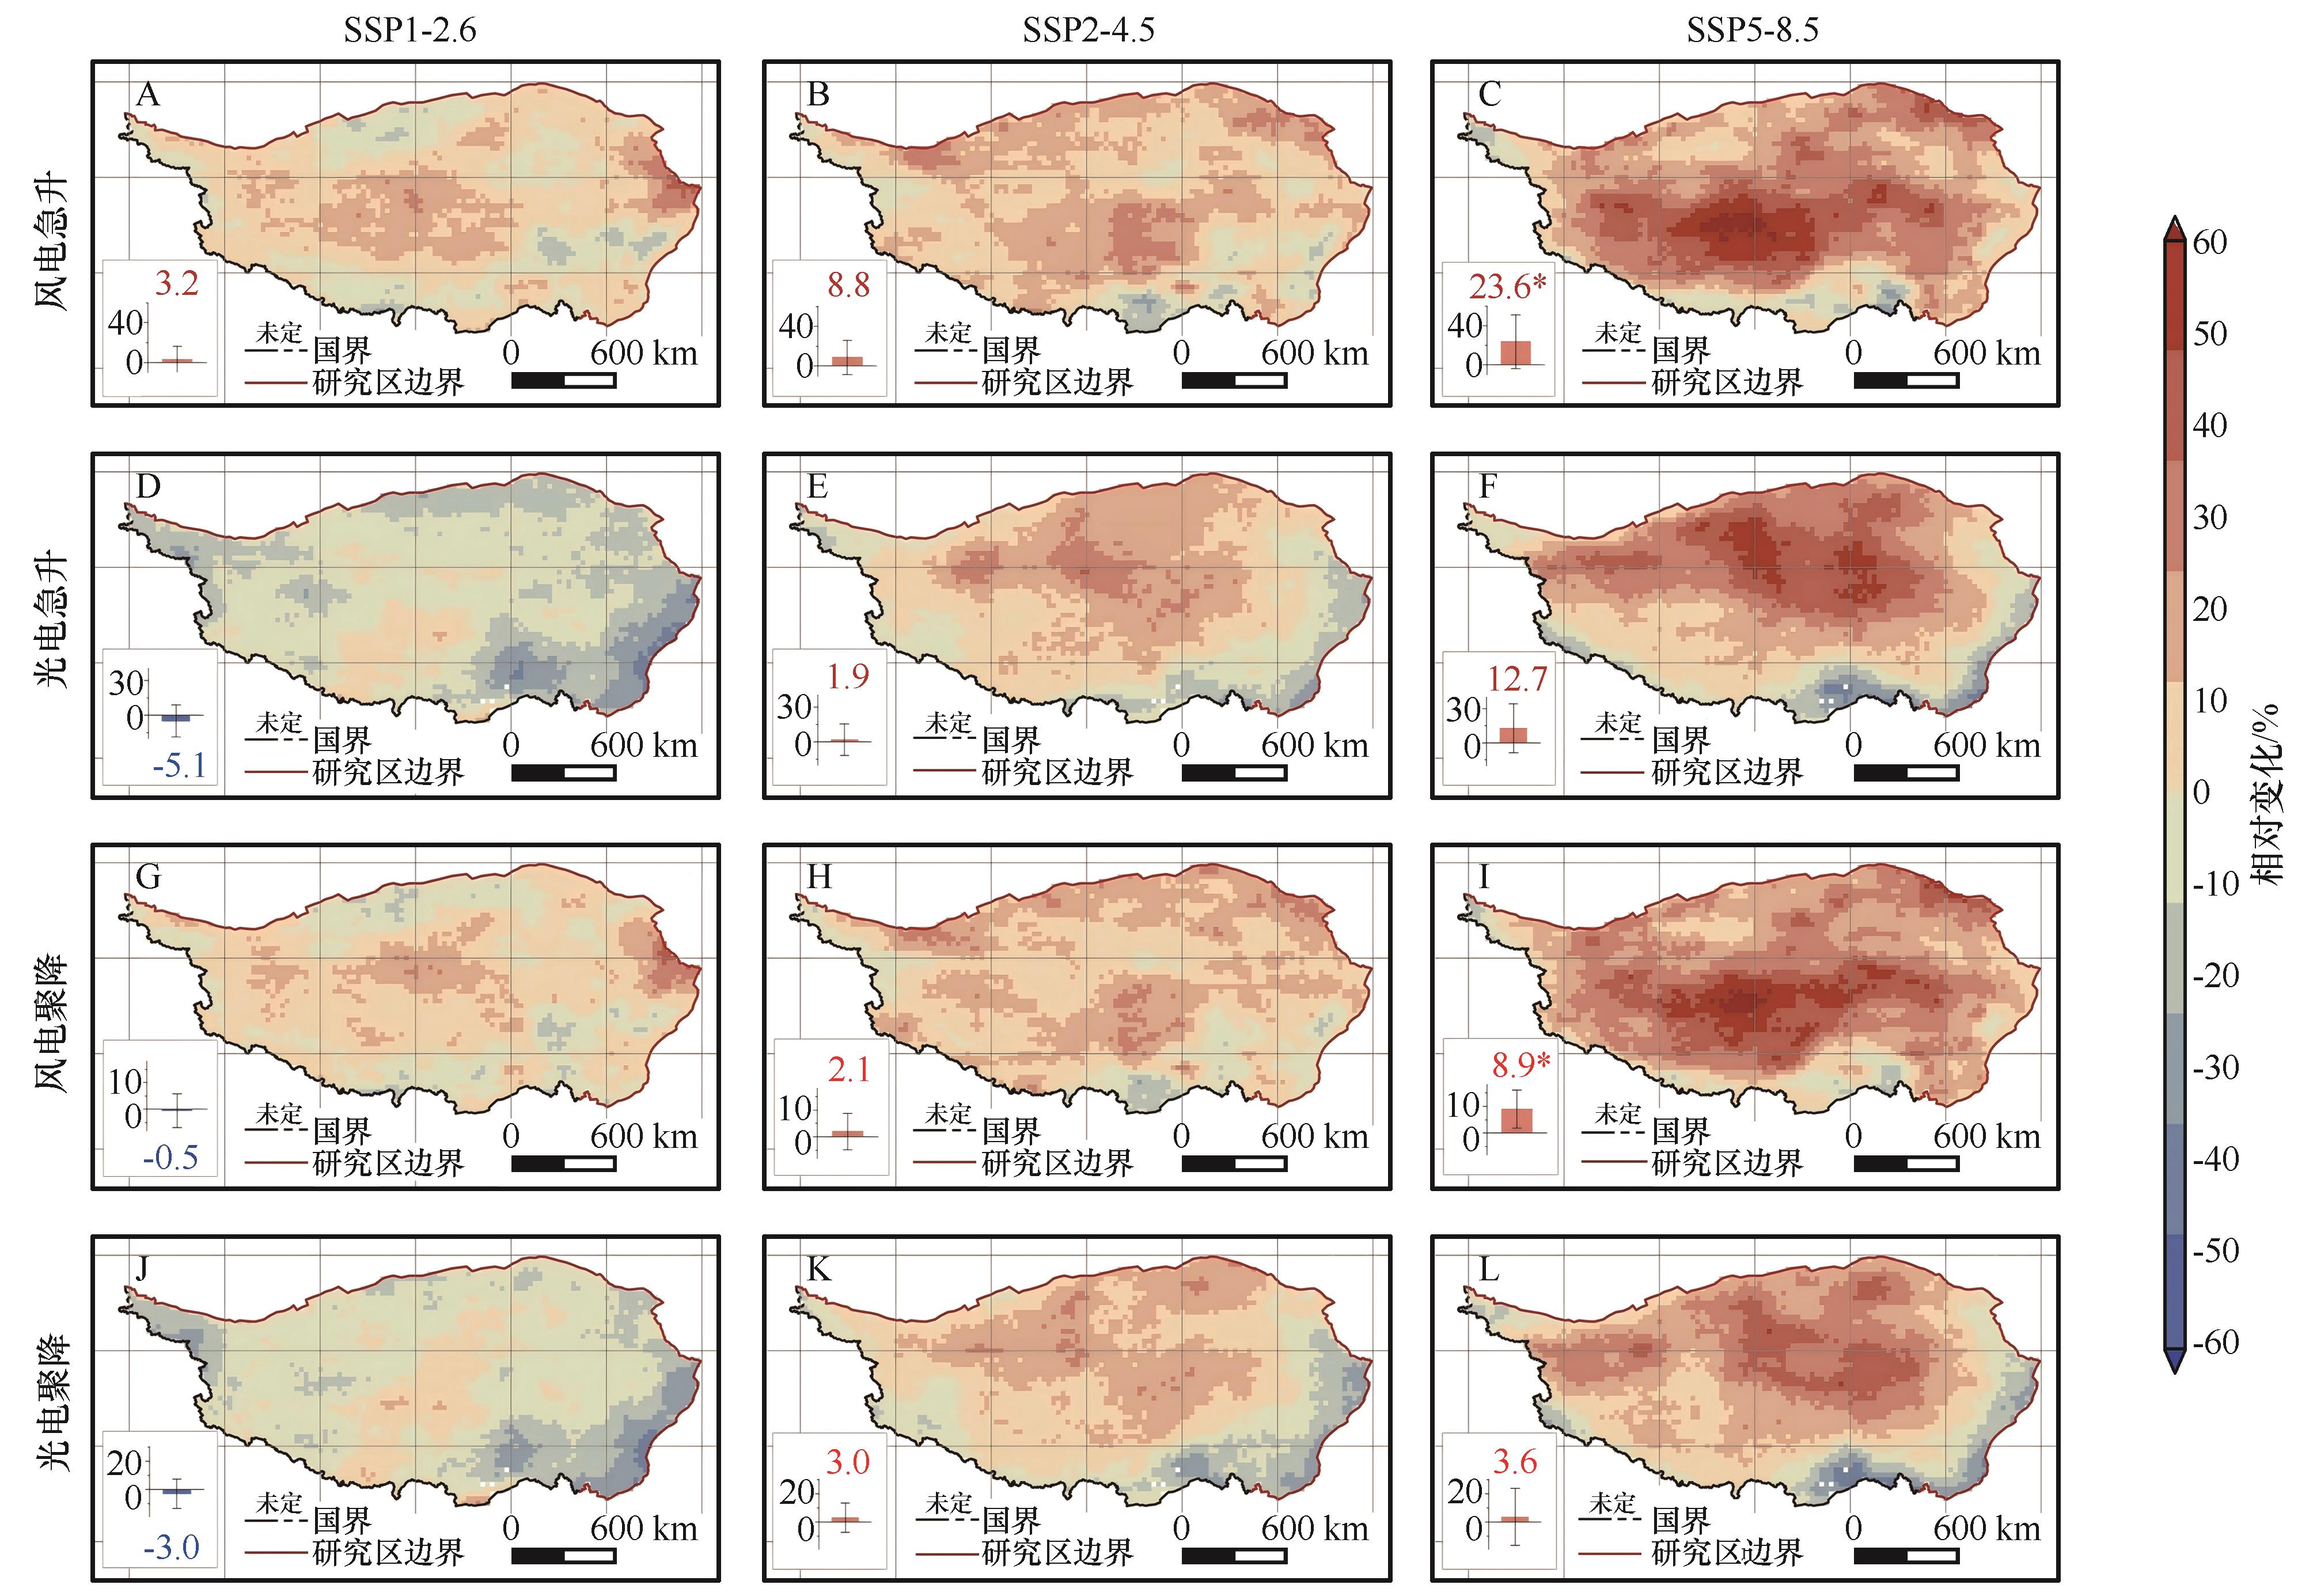
图7 未来不同排放情景下青藏高原风能与太阳能光伏发电潜力日际急升与骤降事件的相对变化。A~C为Pwind急升事件频率相对变化,D~F为Psolar急升事件频率相对变化,G~I为Pwind骤降事件频率相对变化,J~L为Psolar骤降事件频率相对变化注:基于自然资源部标准地图服务网站审图号GS(2023)2767号标准地图制作,底图无修改
Fig.7 Relative changes in sharp rise and sharp drop events of wind and solar photovoltaic power generation potential across the Qinghai-Xizang Plateau under different emission scenarios. A-C indicate relative changes in the frequency of sharp rise events for Pwind. D-F indicate relative changes in the frequency of sharp rise events for Psolar. G-I indicate relative changes in the frequency of sharp drop events for Pwind. J-L indicate relative changes in the frequency of sharp drop events for Psolar
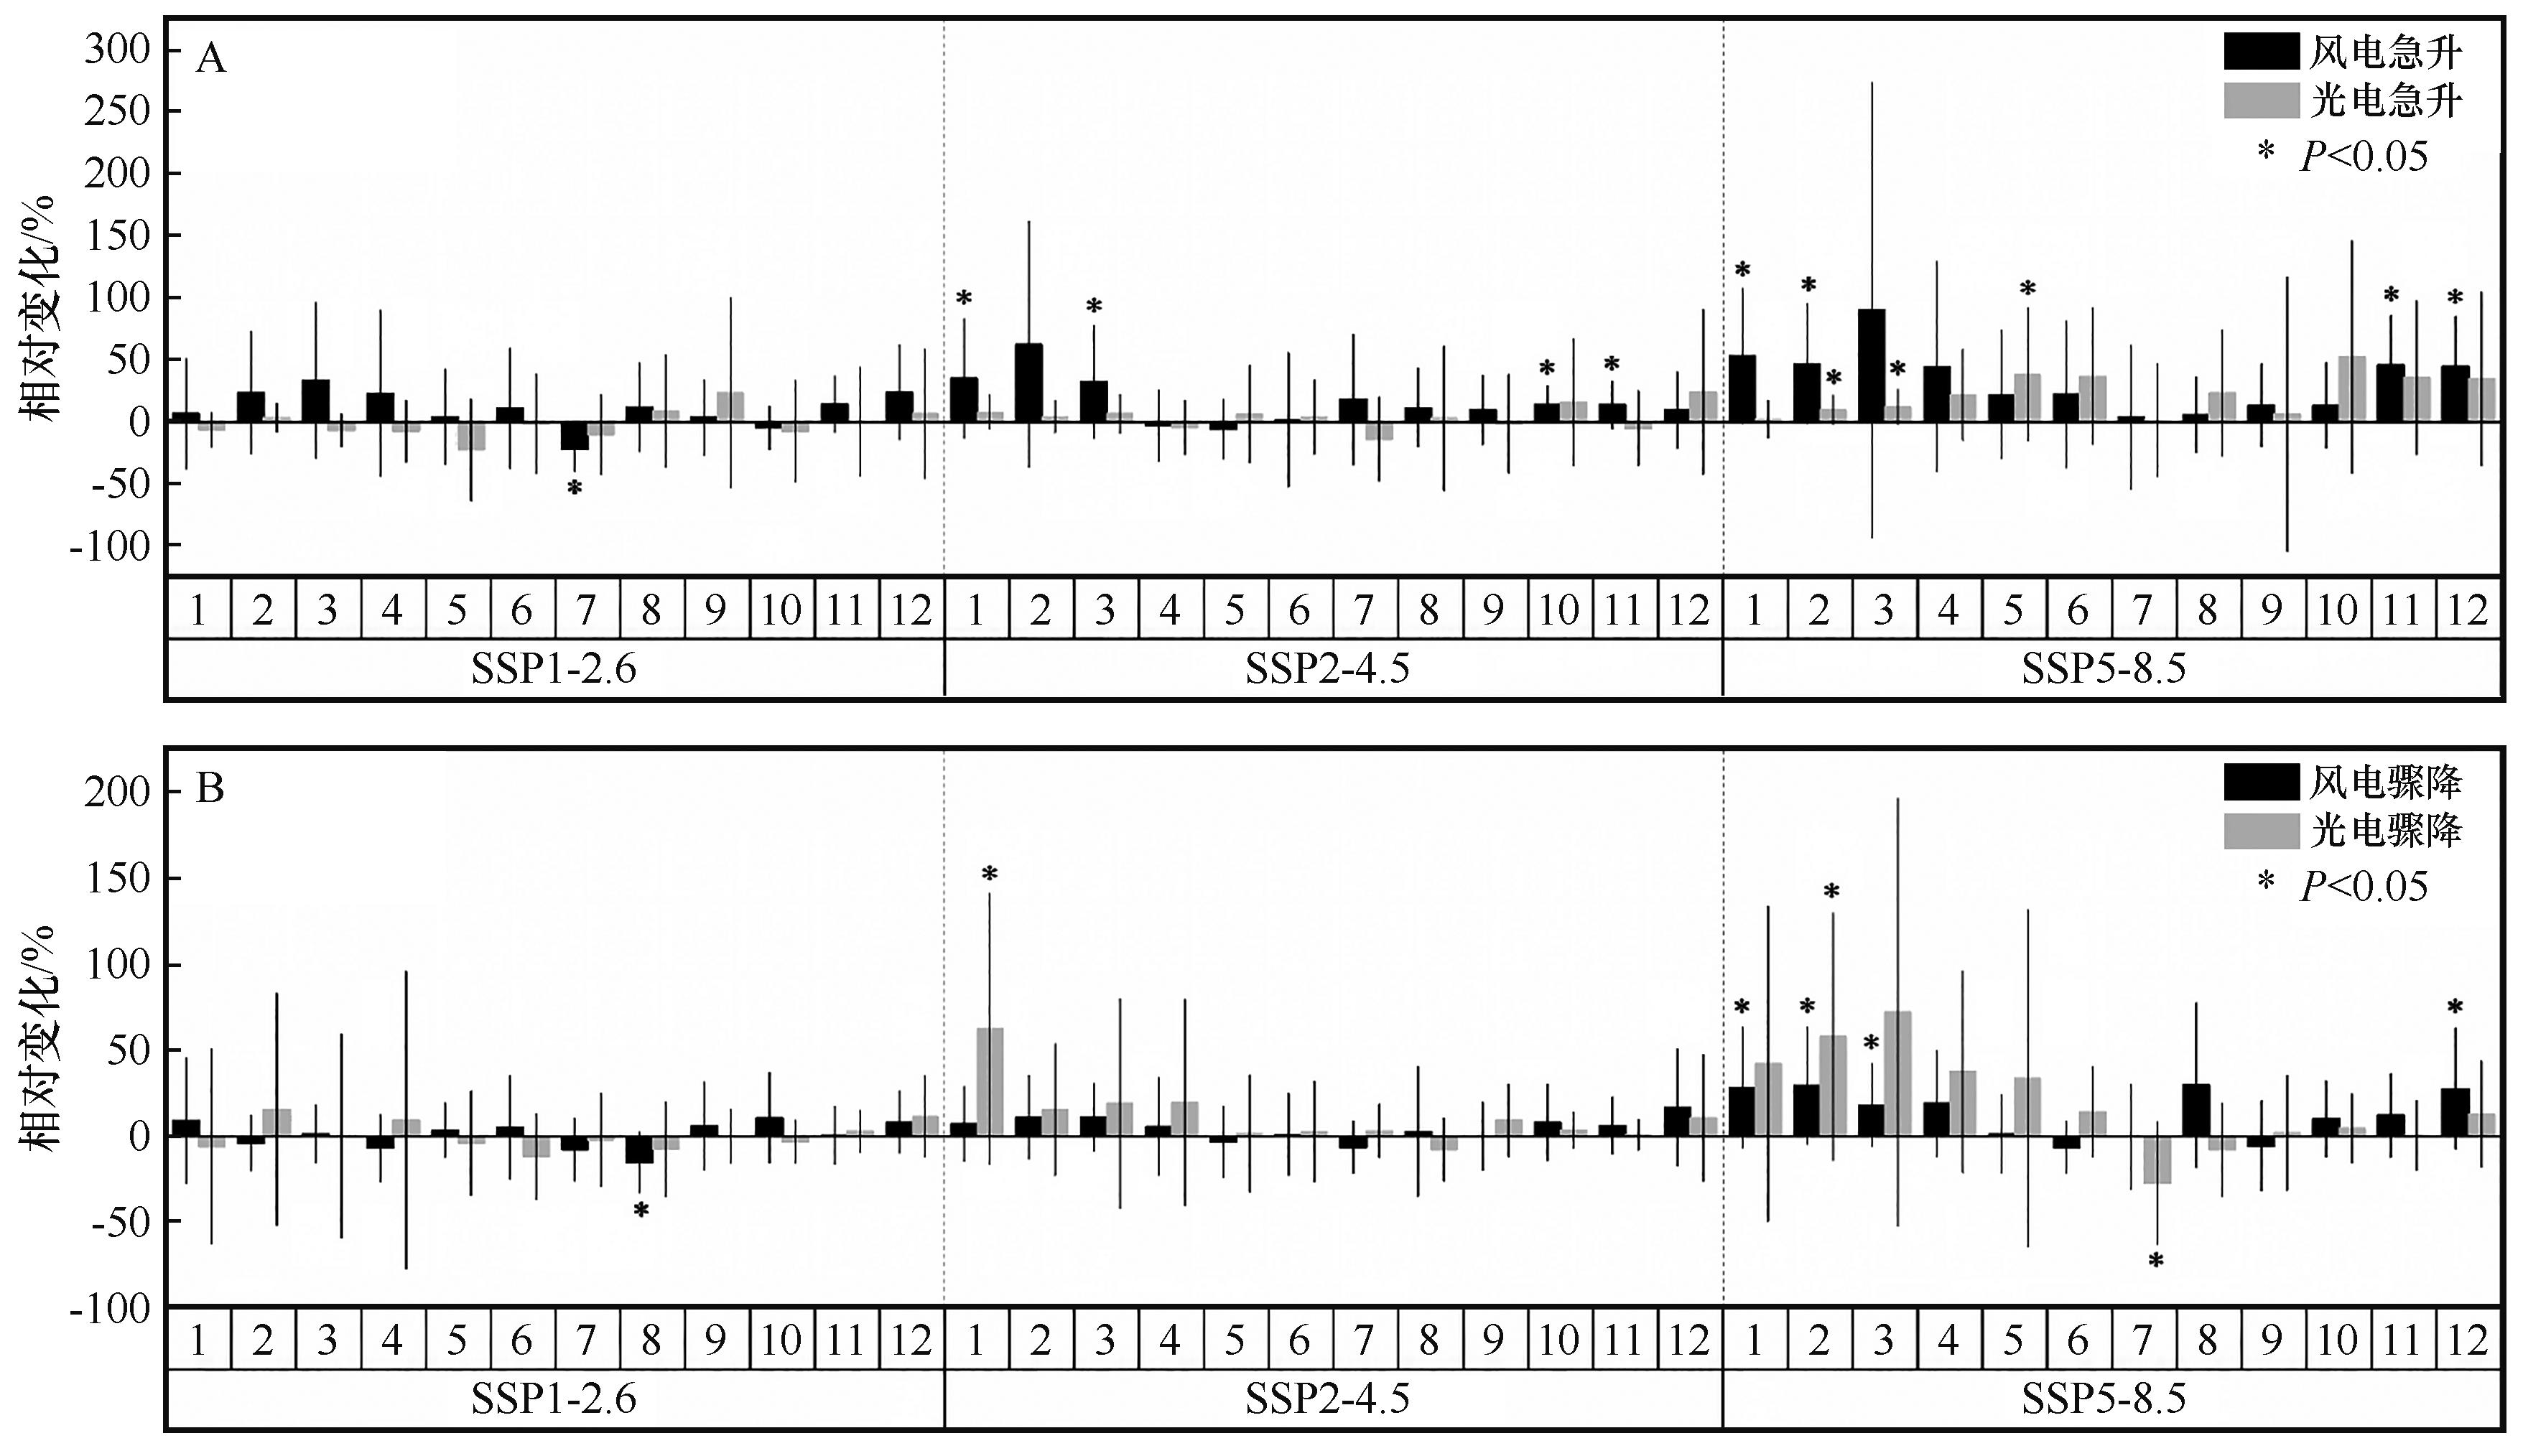
图8 未来不同排放情景下青藏高原风能与太阳能光伏发电潜力日际急升与骤降事件频率的相对变化。误差棒表示基于多气候模式(NEX-GDDP-CMIP6)集合模拟结果的标准差,*表示与历史时期相比每个变量相对变化的统计显著性(P<0.05)
Fig.8 Relative changes in the day-to-day fluctuations of wind and solar power generation potential in the Qinghai-Xizang Plateau under different emission scenarios. Error bars represent the standard deviation in ensemble estimates based on climate forcings from different NEX-GDDP-CMIP6 models. Asterisks (*) indicate statistical significance of changes in each variable (P<0.05)
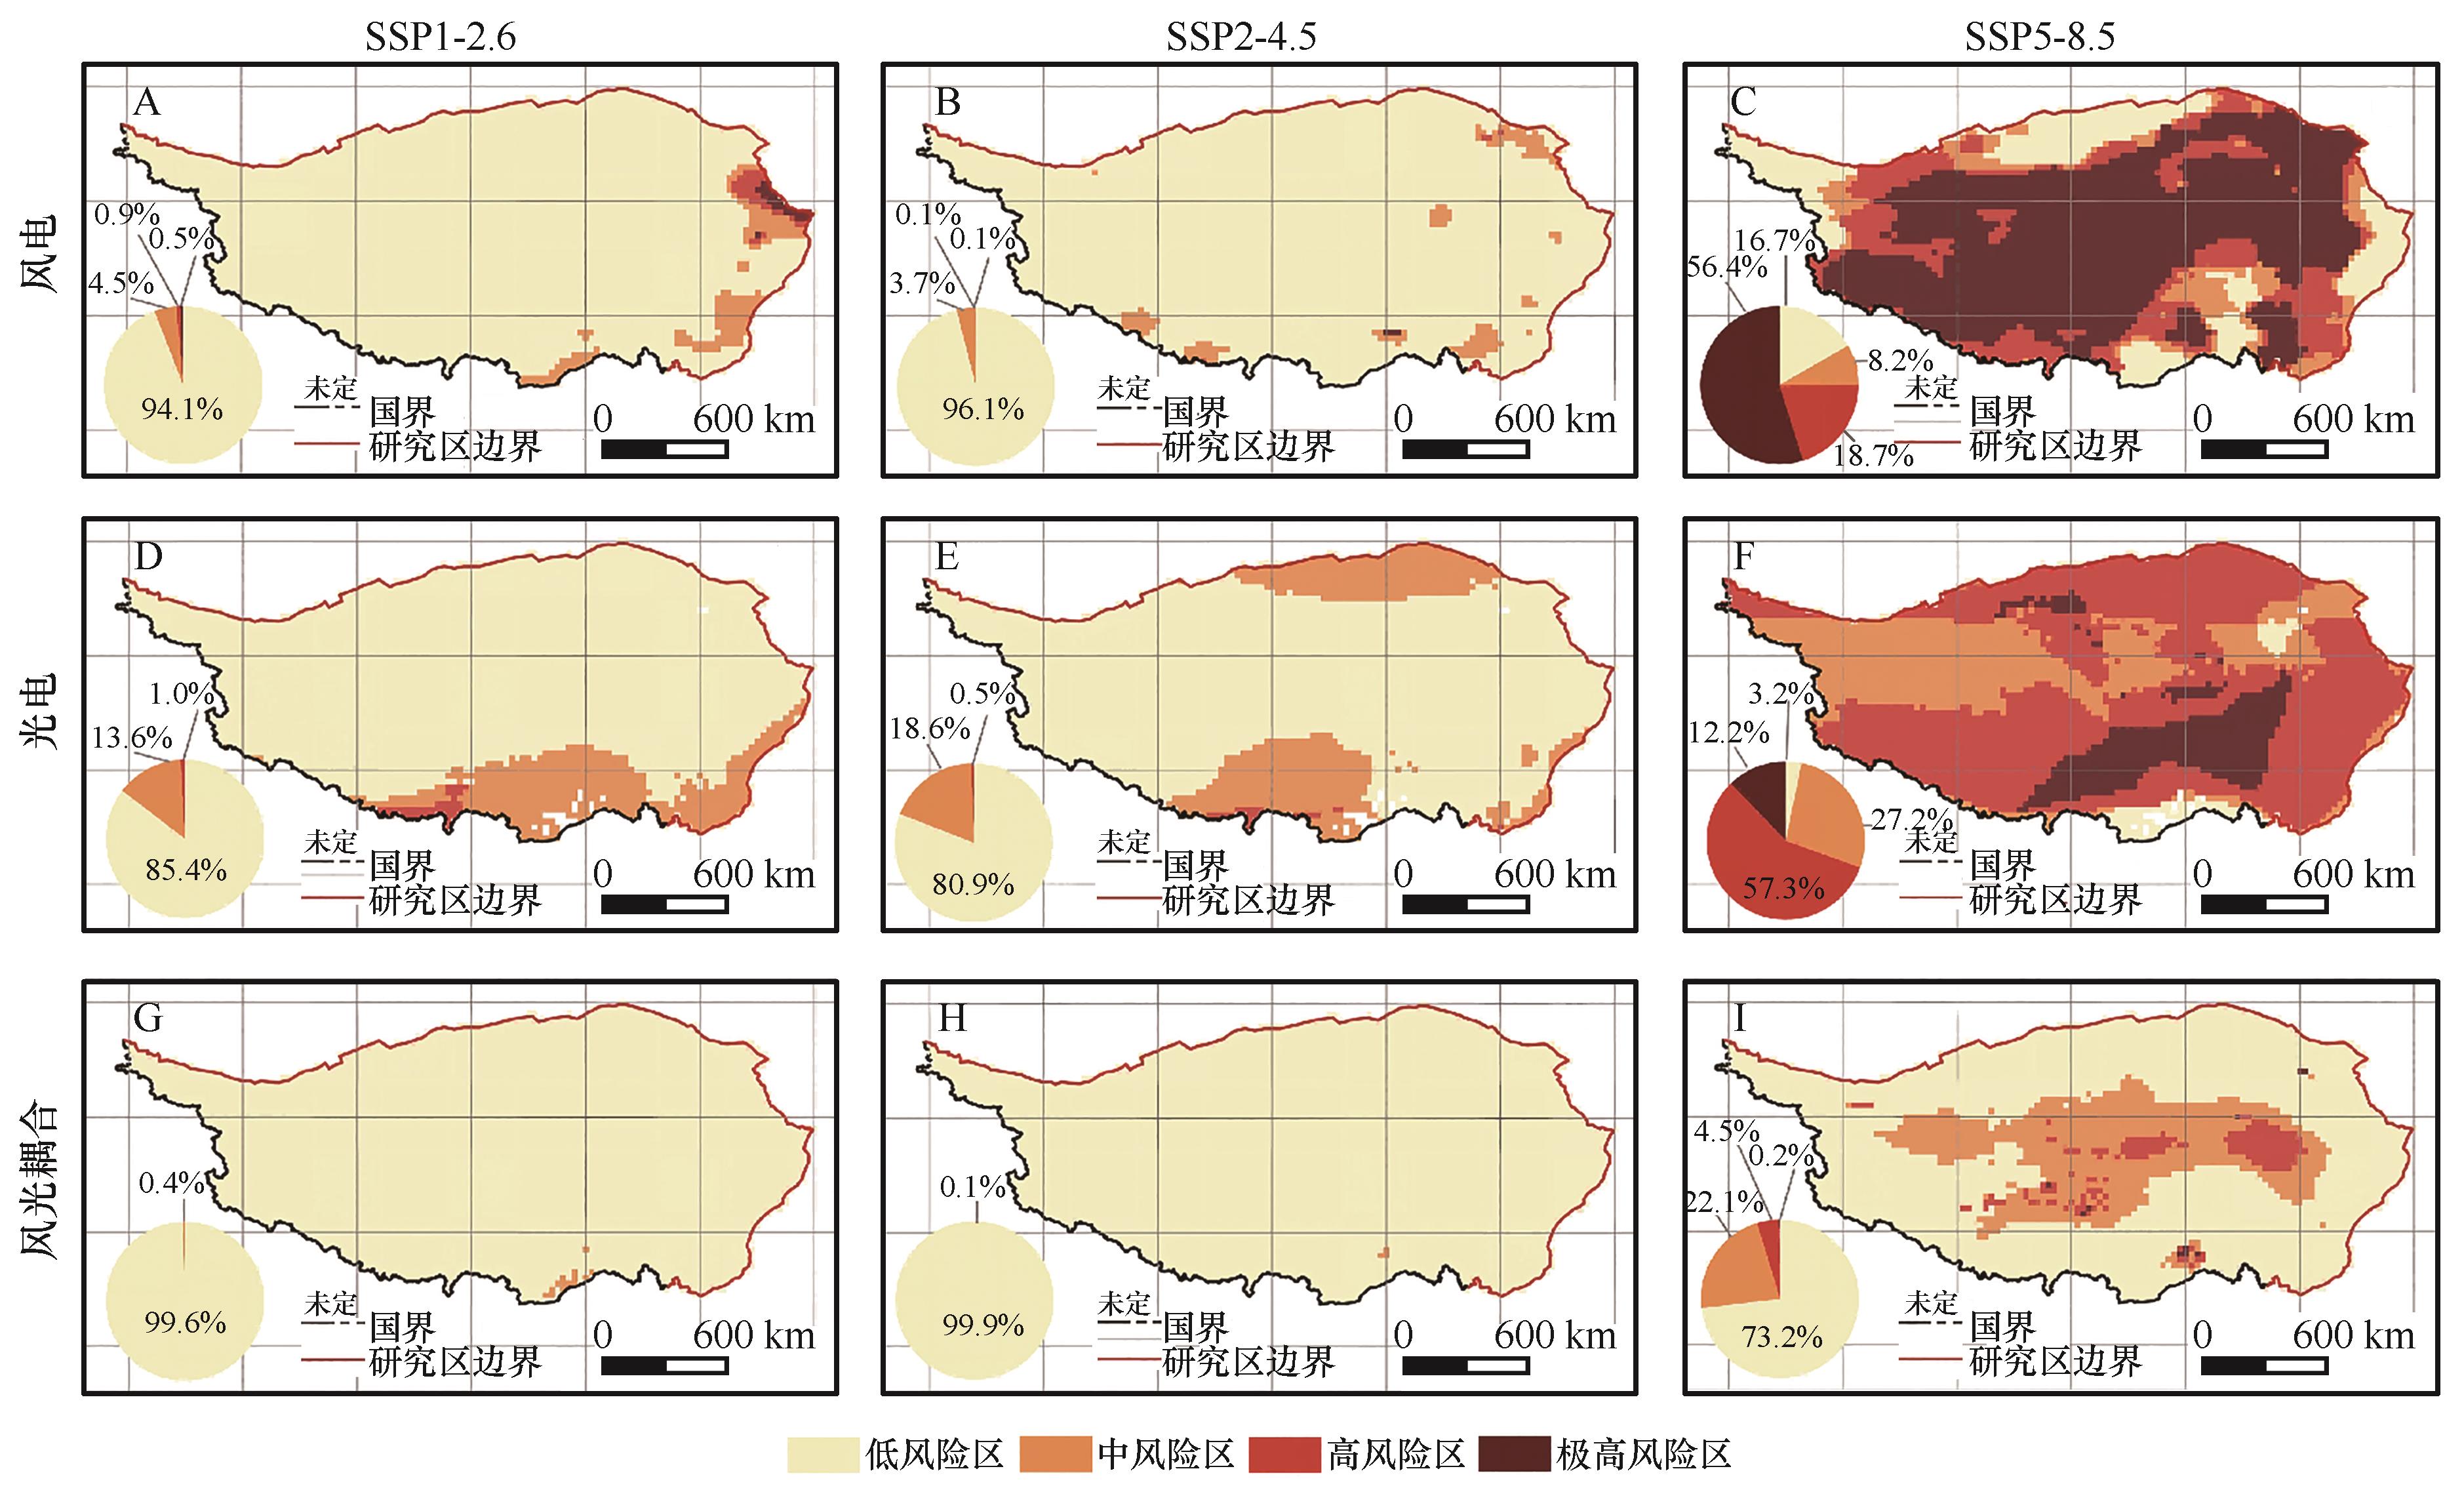
图9 未来不同排放情景下青藏高原风能与太阳能以及风光耦合发电潜力的风险区划。A~C为单一风电的风险区划,D~F为单一光电的风险区划,G~I为风光耦合发电的风险区划注:基于自然资源部标准地图服务网站审图号GS(2023)2767号标准地图制作,底图无修改
Fig.9 Risk regionalization of wind power, solar power, and wind-solar coupled power generation potential across the Qinghai-Xizang Plateau under different GHG emission scenarios. A-C indicate risk regionalization of standalone wind power. D-F indicate risk regionalization of standalone solar photovoltaic power. G-I indicate risk regionalization of wind-solar coupled power generation
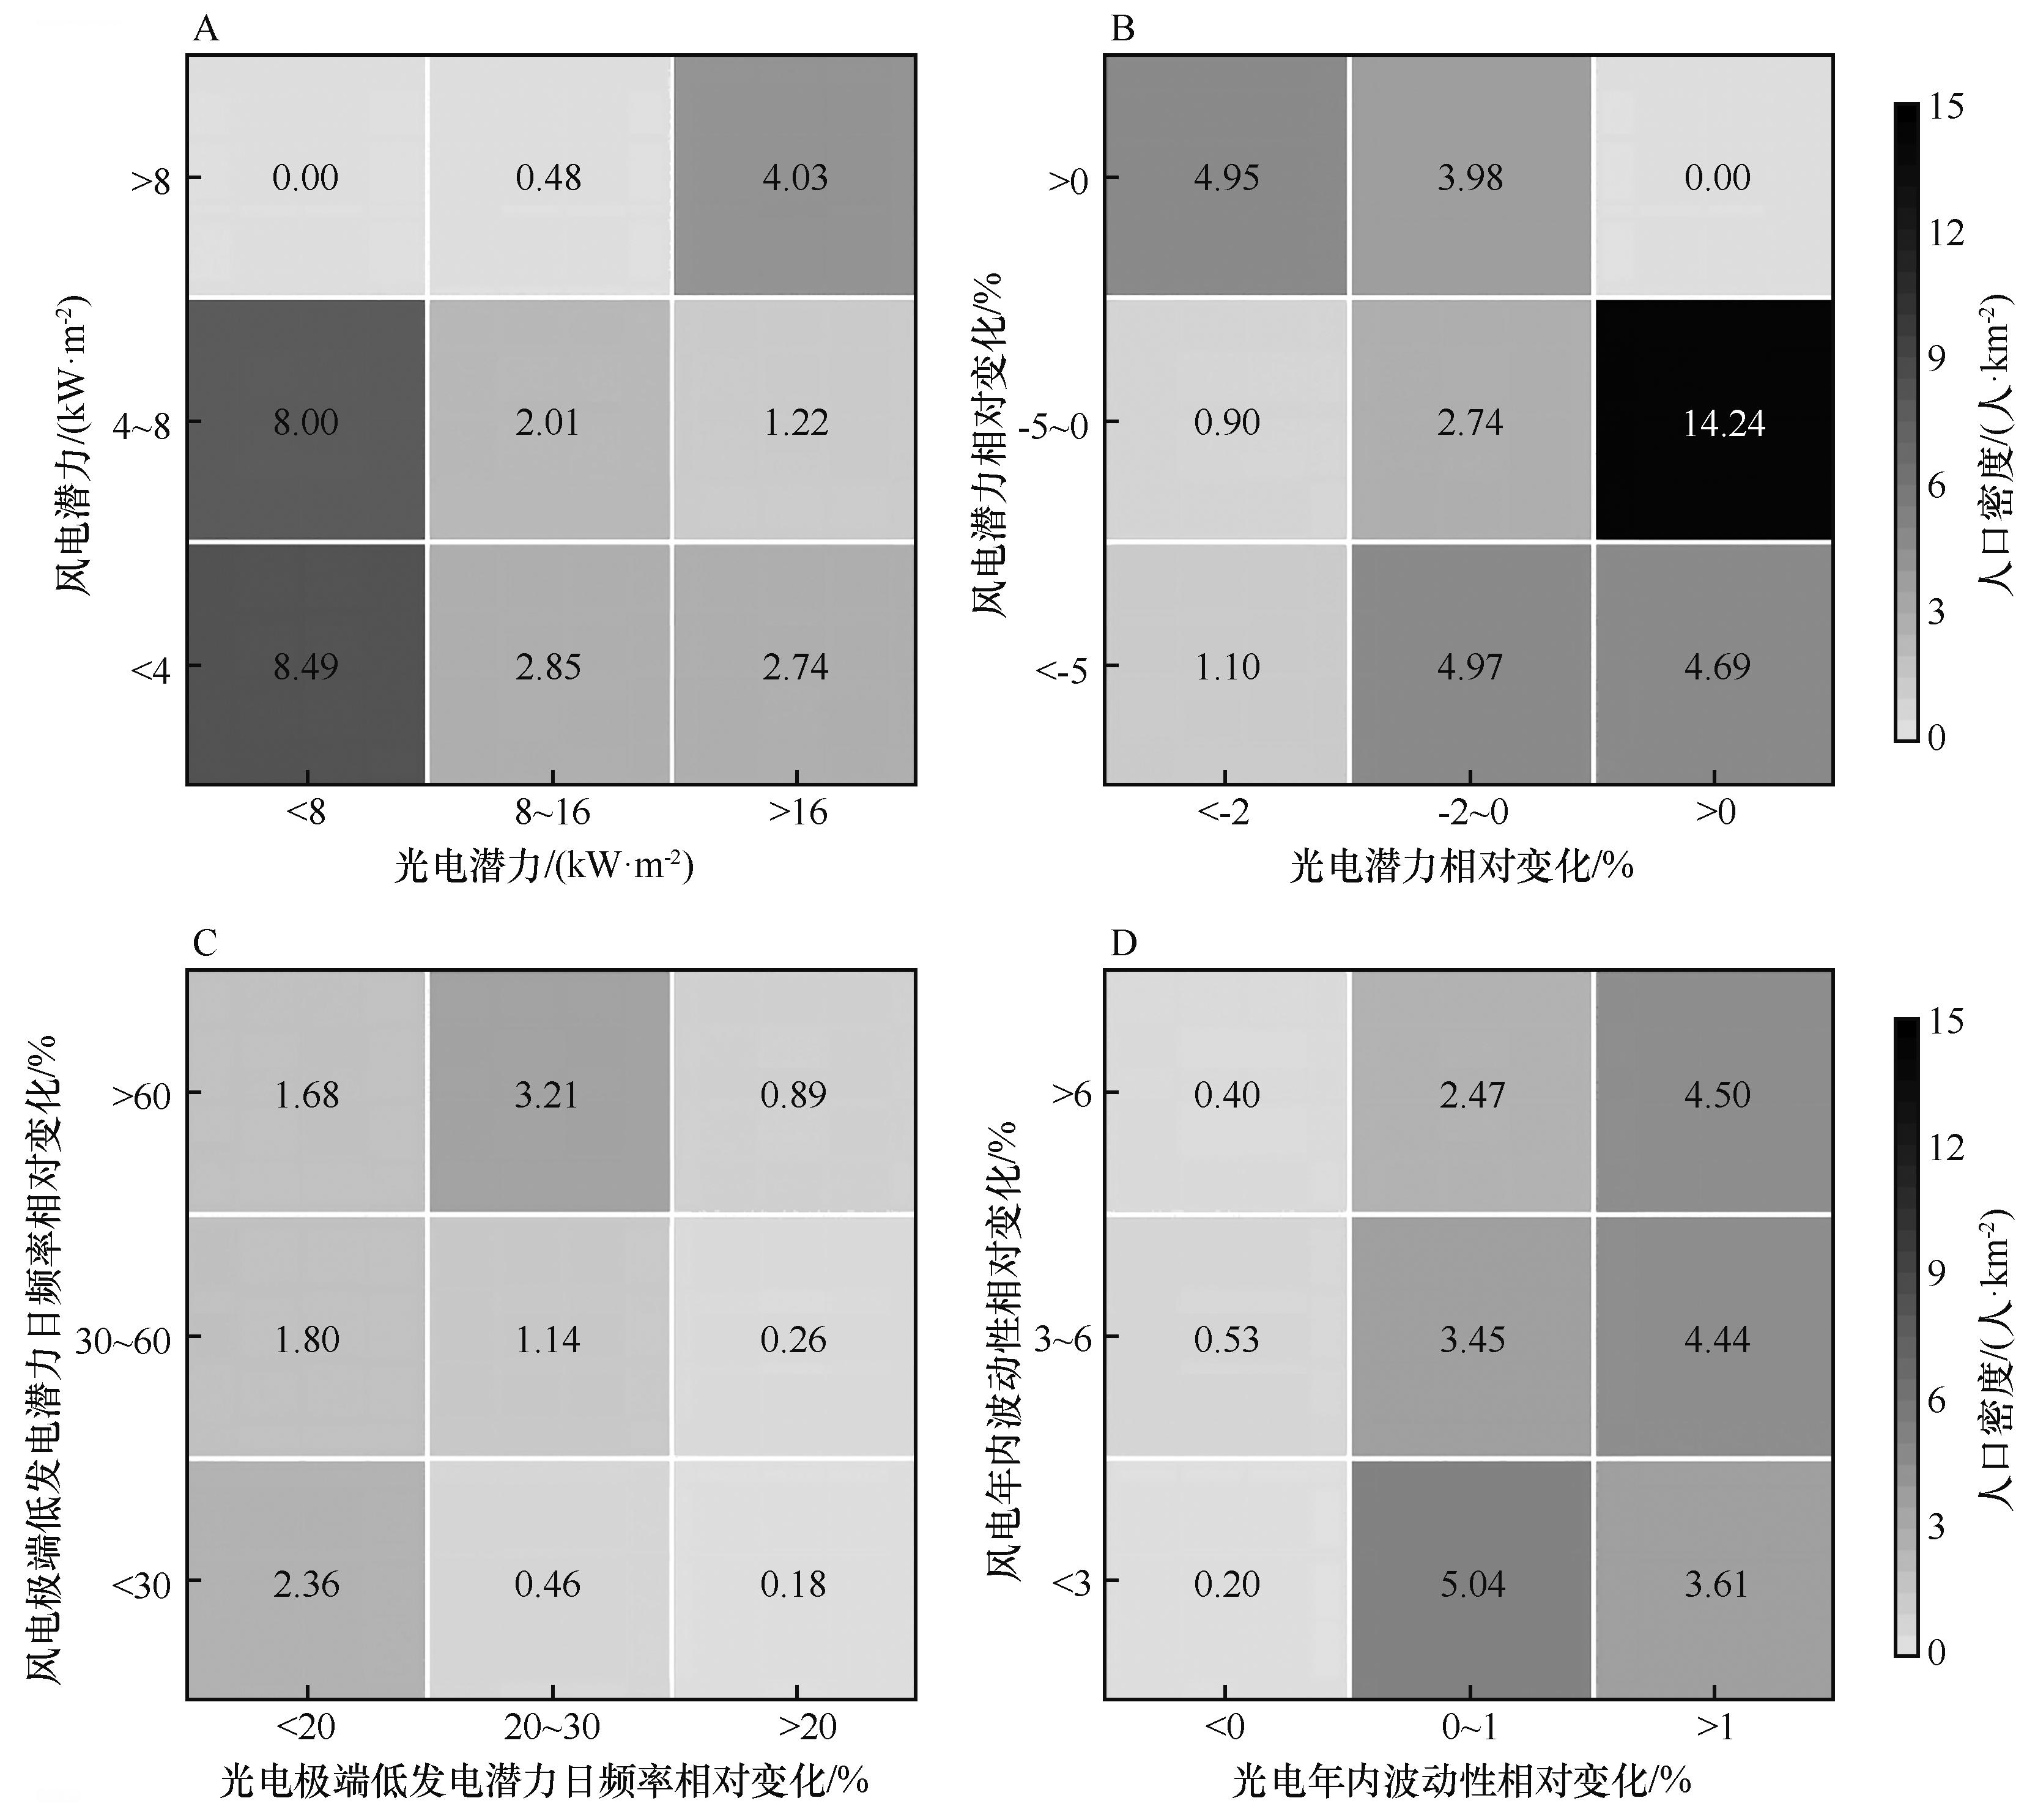
图10 青藏高原人口密度与风光发电潜力及其变化特征的空间关联热图。A为发电潜力,B为发电潜力相对变化,C为极端低发电潜力日频率相对变化,D为年内波动性相对变化。
Fig.10 Spatial correlation heatmaps of population density and wind-solar power generation potential with its changing characteristics in the Qinghai-Xizang Plateau. A indicates power generation potential. B indicates relative change in power generation potential. C indicates relative change in the frequency of power-deficit days. D indicates relative change in intra-annual variability
| [1] | IEA.World Energy Outlook 2024[R].Paris,France:International Energy Agency,2024. |
| [2] | Levin K, Rich D, Ross K,et al.Designing and communicating net-zero targets[EB/OL].2020. |
| [3] | Calvin K, Dasgupta D, Krinner G,et al. Climate Change 2023:Synthesis Report[R].Geneva,Switzerland:IPCC,2023. |
| [4] | 邹才能,熊波,薛华庆,等.新能源在碳中和中的地位与作用[J].石油勘探与开发,2021,48(2):411-420. |
| [5] | 何建坤.碳达峰碳中和目标导向下能源和经济的低碳转型[J].环境经济研究,2021,6(1):1-9. |
| [6] | 缴翼飞,林润.新能源发电装机规模或首超煤电[R].21世纪经济报道,2024. |
| [7] | 中国可再生能源学会.中国可再生能源发展报告2024 年度[R].2024. |
| [8] | 国家能源局.2025年1-7 月份全国电力工业统计数据[EB/OL].国家能源局,2025.. |
| [9] | 国家能源局.国家能源局举行新闻发布会 介绍上半年可再生能源并网运行情况[EB/OL].国家能源局,2025.. |
| [10] | 中国电力企业联合会.2025-2026年度全国电力供需形势分析预测报告[R].2026. |
| [11] | Lei Y, Wang Z, Wang D,et al.Co-benefits of carbon neutrality in enhancing and stabilizing solar and wind energy[J].Nature Climate Change,2023,13(7):693-700. |
| [12] | Zou H, Du H, Ren J,et al.Market dynamics,innovation,and transition in China's solar photovoltaic (PV) industry:a critical review[J].Renewable and Sustainable Energy Reviews,2017,69:197-206. |
| [13] | Li J, Huang J.The expansion of China's solar energy:challenges and policy options[J].Renewable and Sustainable Energy Reviews,2020,132:110002. |
| [14] | Liu L, Wang Z, Wang Y,et al.Optimizing wind/solar combinations at finer scales to mitigate renewable energy variability in China[J].Renewable and Sustainable Energy Reviews,2020,132(C):110151. |
| [15] | Zhou X, Wang F, Fan J,et al.Performance of solar chimney power plant in Qinghai-Tibet Plateau[J].Renewable and Sustainable Energy Reviews,2010,14(8):2249-2255. |
| [16] | Zhang Q, Yuan R, Singh V P,et al.Dynamic vulnerability of ecological systems to climate changes across the Qinghai-Tibet Plateau,China[J].Ecological Indicators,2022,134:108483. |
| [17] | Zhang C, Qin D H, Zhai P M.Amplification of warming on the Tibetan Plateau[J].Advances in Climate Change Research,2023,14(4):493-501. |
| [18] | Zhu Y Y, Yang S.Evaluation of CMIP6 for historical temperature and precipitation over the Tibetan Plateau and its comparison with CMIP5[J].Advances in Climate Change Research,2020,11(3):239-251. |
| [19] | 陈发虎,汪亚峰,甄晓林,等.全球变化下的青藏高原环境影响及应对策略研究[J].中国藏学,2021(4):21-28. |
| [20] | 孙乐,王迎新,孙建.青藏高原光伏电站建设的生态效应、评估体系及发展建议[J].西藏科技,2025,47(12):39-50. |
| [21] | Zhuang M, Lu X, Peng W,et al.Opportunities for household energy on the Qinghai-Tibet Plateau in line with United Nations' sustainable development goals[J].Renewable and Sustainable Energy Reviews,2021,144(C):110982. |
| [22] | Chen X, Mao H, Cheng N,et al.Climate change impacts on global photovoltaic variability[J].Applied Energy,2024,374:124087. |
| [23] | 杨萍,王云强,孙慧,颜长珍.中国戈壁光伏新能源基地建设的途径及政策[J].中国沙漠,2026,46(3):154-162. |
| [24] | 杨泽粟,张宇,张强,等.青藏高原蒸散年际变化及其对西风和季风环流的响应[J].地球物理学报,2022,65(8):2813-2827. |
| [25] | Jiang H, Lu N, Yao L,et al.Impact of climate changes on the stability of solar energy:evidence from observations and reanalysis[J].Renewable Energy,2023,208:726-736. |
| [26] | Liu L, He G, Wu M,et al.Climate change impacts on planned supply-demand match in global wind and solar energy systems[J].Nature Energy,2023,8(8):870-880. |
| [27] | 木哈代思·艾日肯,刘来保,李双成.气候变化情景下青藏高原风能和太阳能系统的供需匹配[J].自然资源学报,2026,41(2):627-642. |
| [28] | 田一聪,田明,刘劲松,等.青藏高原人口空间分布格局及其演变特征[J].科技促进发展,2022,18(5):620-628. |
| [29] | Thrasher B, Maurer E P, McKellar C,et al.Technical note:bias correcting climate model simulated daily temperature extremes with quantile mapping[J].Hydrology and Earth System Sciences,2012,16(9):3309-3314. |
| [30] | Friedl M, Damien S M.MODIS/Terra+Aqua land cover type yearly L3 global 500m SIN Grid V061[DS/OL].NASA Land Processes Distributed Active Archive Center,2022.. |
| [31] | Chen S, Lu X, Miao Y,et al.The potential of photovoltaics to power the belt and road initiative[J].Joule,2019,3(8):1895-1912. |
| [32] | Reicosky D C, Winkelman L J, Baker J M,et al.Accuracy of hourly air temperatures calculated from daily minima and maxima[J].Agricultural and Forest Meteorology,1989,46(3):193-209. |
| [33] | Collares-Pereira M, Rabl A.The average distribution of solar radiation-correlations between diffuse and hemispherical and between daily and hourly insolation values[J].Solar Energy,1979,22(2):155-164. |
| [34] | Carta J A, Ramírez P, Velázquez S.A review of wind speed probability distributions used in wind energy analysis:case studies in the Canary Islands[J].Renewable and Sustainable Energy Reviews,2009,13(5):933-955. |
| [35] | Rinne E, Holttinen H, Kiviluoma J,et al.Effects of turbine technology and land use on wind power resource potential[J].Nature Energy,2018,3(6):494-500. |
| [36] | Abolude A T, Zhou W.Assessment and performance evaluation of a wind turbine power output[J].Energies,2018,11(8):1992. |
| [37] | Zeng B, Liu Y, Xu F,et al.Optimal demand response resource exploitation for efficient accommodation of renewable energy sources in multi-energy systems considering correlated uncertainties[J].Journal of Cleaner Production,2021,288:125666. |
| [38] | Pryor S C, Barthelmie R J, Bukovsky M S,et al.Climate change impacts on wind power generation[J].Nature Reviews Earth and Environment,2020,1(12):627-643. |
| [39] | Wu F, You Q, Pepin N,et al.Surface warming in summer over the Tibetan Plateau:local and atmospheric circulation processes[J].Global and Planetary Change,2025,252:104904. |
| [40] | Zhu Z, Zhang P, Zhong X,et al.Contrasting responses of wind and solar energy potential to forestation-induced climate feedbacks[J].Environmental Science & Technology,2026,60(6):4718-4730. |
| [41] | Perera A T D, Nik V M, Chen D,et al.Quantifying the impacts of climate change and extreme climate events on energy systems[J].Nature Energy,2020,5(2):150-159. |
| [42] | Zheng D, Tong D, Davis S J,et al.Climate change impacts on the extreme power shortage events of wind-solar supply systems worldwide during 1980-2022[J].Nature Communications,2024,15(1):5225. |
| [43] | Yao T, Thompson L, Yang W,et al.Different glacier status with atmospheric circulations in Tibetan Plateau and surroundings[J].Nature Climate Change,2012,2(9):663-667. |
| [44] | Chen Z, Li W, Wang X,et al.Evaluating wind and solar complementarity in China:considering climate change and source-load matching dynamics[J].Energy,2024,312:133485. |
| [45] | Ji L, Li J, Wang S,et al.Optimizing wind-solar synergies in China with spatiotemporal analysis and climate change impacts[J].Journal of Cleaner Production,2025,532:146924. |
| [46] | Tang W, Xu S, Zhou X,et al.Meeting China's electricity demand with renewable energy over Tibetan Plateau[J].Science Bulletin,2023,68(1):39-42. |
| [47] | Zeng X, Sun W, Jia M,et al.Global high-resolution mapping of photovoltaic power plants from 2019 to 2025 using unsupervised index-based multi-source data fusion method[J].International Journal of Applied Earth Observation and Geoinformation,2025,145:105005. |
| [48] | Jung C, Schindler D.A global dataset of onshore wind turbines with site-specific historical (1989-2018) and future (2030-2059) wind resources across 89 countries[J].Scientific Data,2026,13(1):631. |
| [49] | Ren G, Liu J, Wan J,et al.Investigating the complementarity characteristics of wind and solar power for load matching based on the typical load demand in China[J].IEEE Transactions on Sustainable Energy,2021,13(2):778-790. |
| [50] | Hoicka C E, Rowlands I H.Solar and wind resource complementarity:advancing options for renewable electricity integration in Ontario,Canada[J].Renewable Energy,2011,36(1):97-107. |
| [51] | Rehbein J A, Watson J E M, Lane J L,et al.Renewable energy development threatens many globally important biodiversity areas[J].Global Change Biology,2020,26(5):3040-3051. |
| [52] | Panteli M, Mancarella P.Influence of extreme weather and climate change on the resilience of power systems:impacts and possible mitigation strategies[J].Electric Power Systems Research,2015,127:259-270. |
| [53] | Dowling J A, Rinaldi K Z, Ruggles T H,et al.Role of long-duration energy storage in variable renewable electricity systems[J].Joule,2020,4(9):1907-1928. |
| [54] | Peterson E W, Hennessey J P.On the use of power laws for estimates of wind power potential[J].Journal of Applied Meteorology and Climatology,1978,17(3):390-394. |
| [55] | Nelson F E.(Un)frozen in Time[J].Science,2003,299(5613):1673-1675. |
| [56] | Hjort J, Karjalainen O, Aalto J,et al.Degrading permafrost puts Arctic infrastructure at risk by mid-century[J].Nature Communications,2018,9(1):5147. |
| [57] | Zhou J, Ding Q, Zou Z,et al.Land suitability evaluation of large-scale photovoltaic plants using structural equation models[J].Resources,Conservation and Recycling,2023,198:107179. |
| [1] | 杨嘉繁, 张瑞珈, 曾维华, 李嘉琪, 王立婷, 彭怀午. 青藏高原大规模光伏发电系统建设生态适宜性分区[J]. 中国沙漠, 2026, 46(5): 246-259. |
| [2] | 宁洁, 史明昌, 陈春阳, 张晏维. 青藏高原土壤风蚀及防风固沙服务流动模拟[J]. 中国沙漠, 2026, 46(4): 308-320. |
| [3] | 张碧优, 胡光印, 胡菁菁. 黄河源区玛多盆地风况与输沙势特征[J]. 中国沙漠, 2026, 46(3): 88-96. |
| [4] | 高杰, 胡光印, 高娜, 胡菁菁. 2017—2018年卓乃湖湖冰表面风成沉积物遥感监测[J]. 中国沙漠, 2026, 46(2): 1-10. |
| [5] | 陈军伟, 常学向, 田全彦. 祁连山国家公园乔木林生态系统稳定性对气候变化的响应[J]. 中国沙漠, 2026, 46(1): 105-120. |
| [6] | 牛清河, 苏春丽, 肖建华, 王博, 夏磊, 张晴, 刘璐璐. 青藏高原苏干湖盆地光伏电站对戈壁风沙环境的影响[J]. 中国沙漠, 2025, 45(6): 249-257. |
| [7] | 管悦汝, 白俊武, 李一琼, 杨朝辉, 时浩南. 2001—2020年毛乌素沙地植被净初级生产力[J]. 中国沙漠, 2025, 45(6): 258-268. |
| [8] | 王明宇, 吴成永, 陈克龙. 青海湖流域植被绿度时空变化及影响因素[J]. 中国沙漠, 2025, 45(5): 289-300. |
| [9] | 白浩江, 罗永清, 程莉, 汪正蛟一. 差巴嘎蒿( Artemisia halodendron )和小叶锦鸡儿( Caragana microphylla )物候的气候响应[J]. 中国沙漠, 2025, 45(4): 305-313. |
| [10] | 翟颖, 庞奖励, 黄春长, 查小春, 周亚利, 李瑜琴, 张玉柱, 孙雪晴, 赵晓康. 若尔盖盆地阿米欧拉-南剖面粒度端元特征及其记录的15 ka来气候变化[J]. 中国沙漠, 2025, 45(2): 111-118. |
| [11] | 程星雨, 徐志伟, 俞妍, 张小啸. 卫星遥感揭示的2001年以来中蒙地区沙尘事件频次变化及其原因[J]. 中国沙漠, 2025, 45(2): 47-60. |
| [12] | 尹振良, 朱睿, 方春爽, 杨华庆, 陈泽霞. 基于Budyko假设的昌马河流域径流变化归因分析[J]. 中国沙漠, 2024, 44(6): 110-121. |
| [13] | 李森, 杨宗英, 赵鸿雁, 那仁图雅null, 安桂香, 谢家丽, 贾晓鹏, 颜长珍. 1975—2020年黄河“几字弯”沙漠化时空变化[J]. 中国沙漠, 2024, 44(5): 13-22. |
| [14] | 李成阳, 黄樱宜, 林千策, 沈琳丽, 罗诗影, 梁志辉, 李臻明, 彭飞, 薛娴. 长江源区高寒草甸生长季载畜量对模拟增温的响应[J]. 中国沙漠, 2024, 44(4): 165-173. |
| [15] | 陈俊言, 贯雅雯, 张越, 陈渔, 毕鸿儒, 娄高僮, 郭馨阳, 王洋, 陈思宇. 戈壁沙漠沙尘向青藏高原传输路径和传输机制:以2020年4月一次沙尘事件为例[J]. 中国沙漠, 2024, 44(3): 158-171. |
| 阅读次数 | ||||||
|
全文 |
|
|||||
|
摘要 |
|
|||||
©2018中国沙漠 编辑部
地址: 兰州市天水中路8号 (730000)
电话:0931-8267545
Email:caiedit@lzb.ac.cn;desert@lzb.ac.cn


 甘公网安备 62010202000688号