中国沙漠 ›› 2026, Vol. 46 ›› Issue (4): 308-320.DOI: 10.7522/j.issn.1000-694X.2026.00011
宁洁( ), 史明昌(), 陈春阳, 张晏维
收稿日期:2025-10-27
修回日期:2026-01-30
出版日期:2026-07-20
发布日期:2026-08-27
通讯作者:
史明昌
作者简介:宁洁(2000—),女,内蒙古呼和浩特人,硕士研究生,主要从事水土保持与荒漠化防治研究。E-mail: NingJie0725@bjfu.edu.cn
Jie Ning(), Mingchang Shi(), Chunyang Chen, Yanwei Zhang
Received:2025-10-27
Revised:2026-01-30
Online:2026-07-20
Published:2026-08-27
Contact:
Mingchang Shi
摘要:
青藏高原土壤风蚀过程对区域及全球生态环境具有重要影响。本研究基于2019—2023年多源遥感与气象数据,采用修正风蚀方程(RWEQ)模型与HYSPLIT大气扩散模型量化土壤风蚀强度并模拟防风固沙服务流动路径。结果表明:研究区潜在风蚀总量由2019年的7.326×10¹¹ kg降至2023年的6.330×10¹¹ kg,总体呈下降趋势;研究区实际风蚀总量2019年的3.211×10¹¹ kg降至2023年的1.559×10¹¹ kg,总体呈下降趋势;研究区防风固沙总量由2019年的4.115×10¹¹ kg升至2023年的4.771×10¹¹ kg,呈明显增加趋势。空间上,风蚀主要发生在藏北青南高原风蚀区。HYSPLIT模拟显示,2019—2023年3个代表性站点(青海湖、五道梁、帕里)的沙尘传输路径总数由1 535条减少至811条,风沙影响呈减弱趋势。
中图分类号:
宁洁, 史明昌, 陈春阳, 张晏维. 青藏高原土壤风蚀及防风固沙服务流动模拟[J]. 中国沙漠, 2026, 46(4): 308-320.
Jie Ning, Mingchang Shi, Chunyang Chen, Yanwei Zhang. Modeling of soil wind erosion and wind erosion control service flow in the Qinghai-Xizang Plateau[J]. Journal of Desert Research, 2026, 46(4): 308-320.
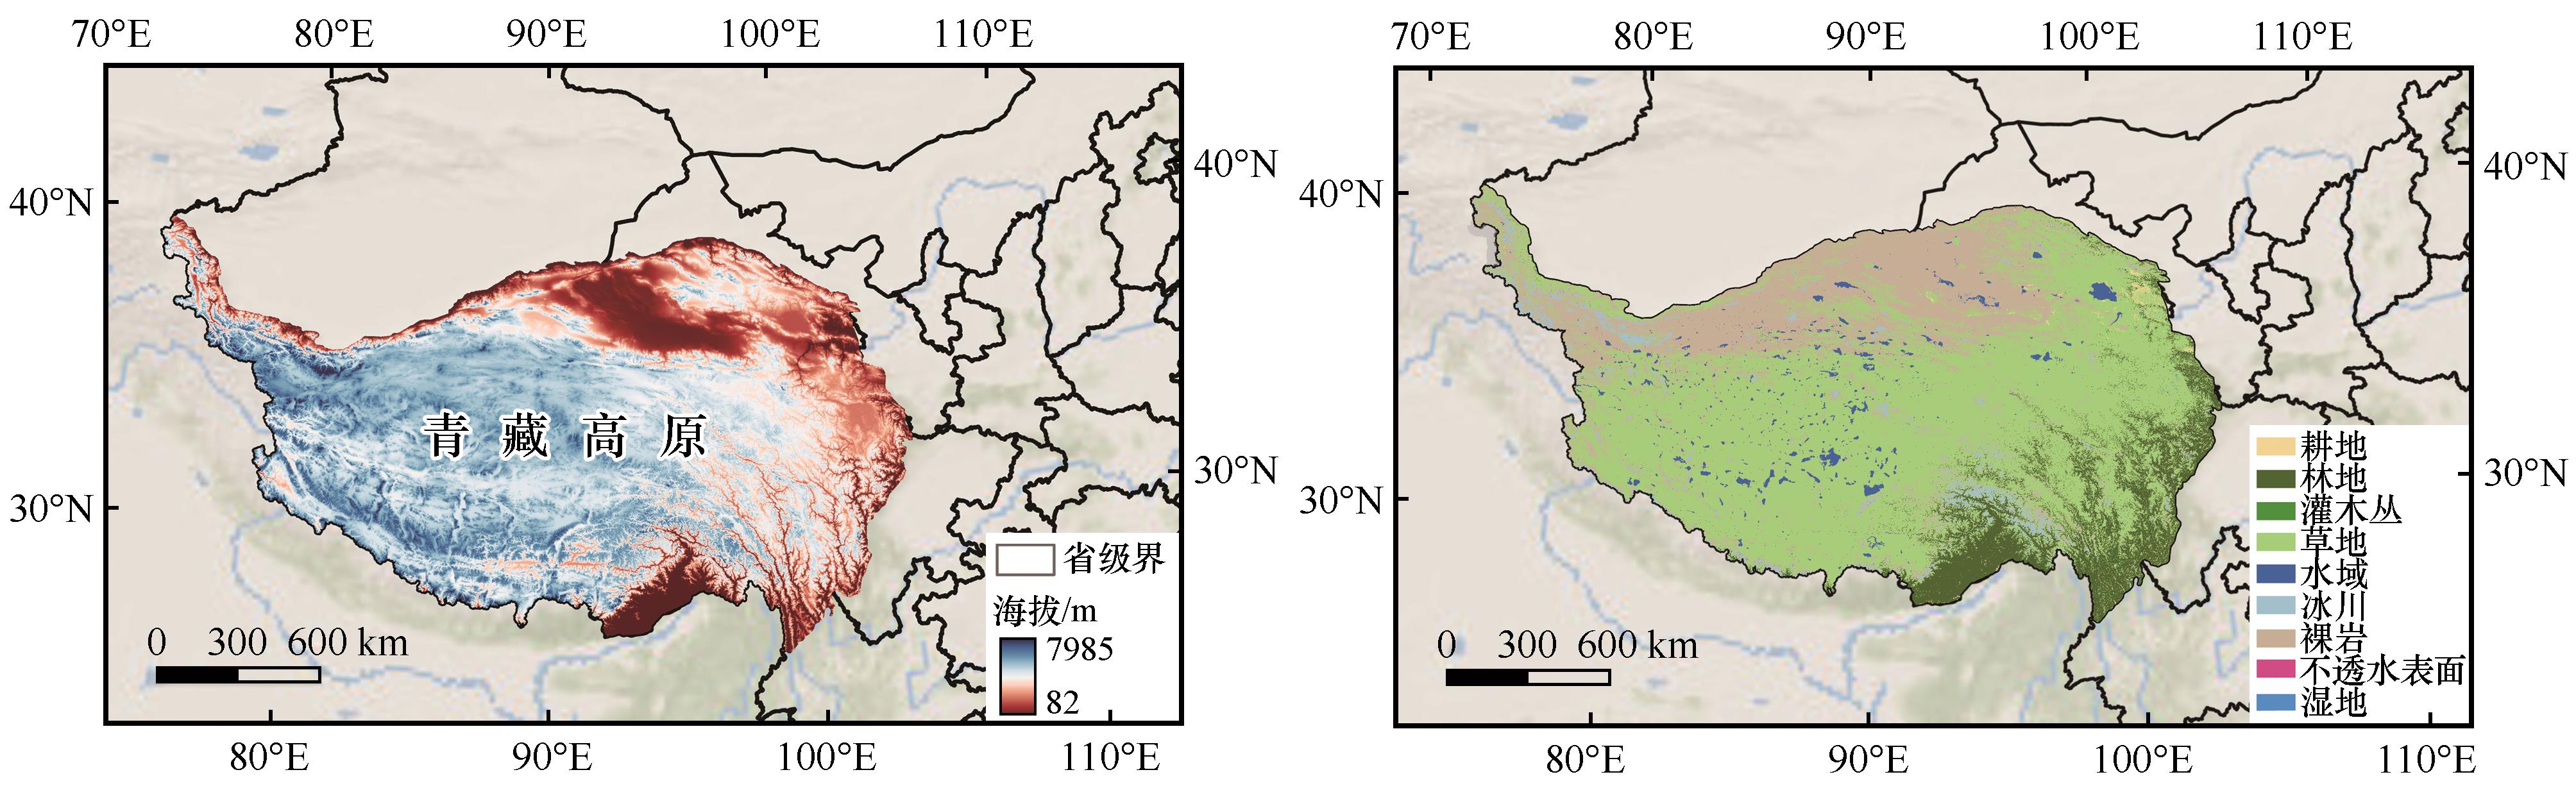
图1 研究区概况注:基于国家测绘地理信息局标准地图服务网站下载的审定号GS(2024)0650号标准地图的制作,底图无修改。
Fig.1 Location of the study area
| 土壤风蚀项目 | 参数 | 年份 | ||||
|---|---|---|---|---|---|---|
| 2019 | 2020 | 2021 | 2022 | 2023 | ||
| 潜在风蚀量 | 最大值/(kg·m-2) | 49.353 | 28.958 | 38.408 | 45.591 | 45.346 |
| 最小值/(kg·m-2) | 0 | 0 | 0 | 0 | 0 | |
| 平均值/(kg·m-2) | 0.281 | 0.118 | 0.181 | 0.107 | 0.242 | |
| 总量/1011 kg | 7.326 | 3.068 | 4.733 | 2.785 | 6.330 | |
| 实际风蚀量 | 最大值/(kg·m-2) | 35.136 | 26.903 | 20.636 | 16.879 | 22.248 |
| 最小值/(kg·m-2) | 0 | 0 | 0 | 0 | 0 | |
| 平均值/(kg·m-2) | 0.129 | 0.035 | 0.090 | 0.040 | 0.063 | |
| 总量/1011 kg | 3.211 | 0.886 | 2.254 | 0.992 | 1.559 | |
| 防风固沙量 | 最大值/(kg·m-2) | 49.185 | 26.379 | 38.270 | 45.443 | 45.290 |
| 最小值/(kg·m-2) | 0 | 0 | 0 | 0 | 0 | |
| 平均值/(kg·m-2) | 0.152 | 0.084 | 0.091 | 0.067 | 0.179 | |
| 总量/1011 kg | 4.115 | 2.182 | 2.479 | 1.793 | 4.771 | |
表1 2019—2023年潜在风蚀量、实际风蚀量、防风固沙量
Table 1 Statistics of potential soil loss, actual soil loss, and wind erosion control service from 2019 to 2023.
| 土壤风蚀项目 | 参数 | 年份 | ||||
|---|---|---|---|---|---|---|
| 2019 | 2020 | 2021 | 2022 | 2023 | ||
| 潜在风蚀量 | 最大值/(kg·m-2) | 49.353 | 28.958 | 38.408 | 45.591 | 45.346 |
| 最小值/(kg·m-2) | 0 | 0 | 0 | 0 | 0 | |
| 平均值/(kg·m-2) | 0.281 | 0.118 | 0.181 | 0.107 | 0.242 | |
| 总量/1011 kg | 7.326 | 3.068 | 4.733 | 2.785 | 6.330 | |
| 实际风蚀量 | 最大值/(kg·m-2) | 35.136 | 26.903 | 20.636 | 16.879 | 22.248 |
| 最小值/(kg·m-2) | 0 | 0 | 0 | 0 | 0 | |
| 平均值/(kg·m-2) | 0.129 | 0.035 | 0.090 | 0.040 | 0.063 | |
| 总量/1011 kg | 3.211 | 0.886 | 2.254 | 0.992 | 1.559 | |
| 防风固沙量 | 最大值/(kg·m-2) | 49.185 | 26.379 | 38.270 | 45.443 | 45.290 |
| 最小值/(kg·m-2) | 0 | 0 | 0 | 0 | 0 | |
| 平均值/(kg·m-2) | 0.152 | 0.084 | 0.091 | 0.067 | 0.179 | |
| 总量/1011 kg | 4.115 | 2.182 | 2.479 | 1.793 | 4.771 | |
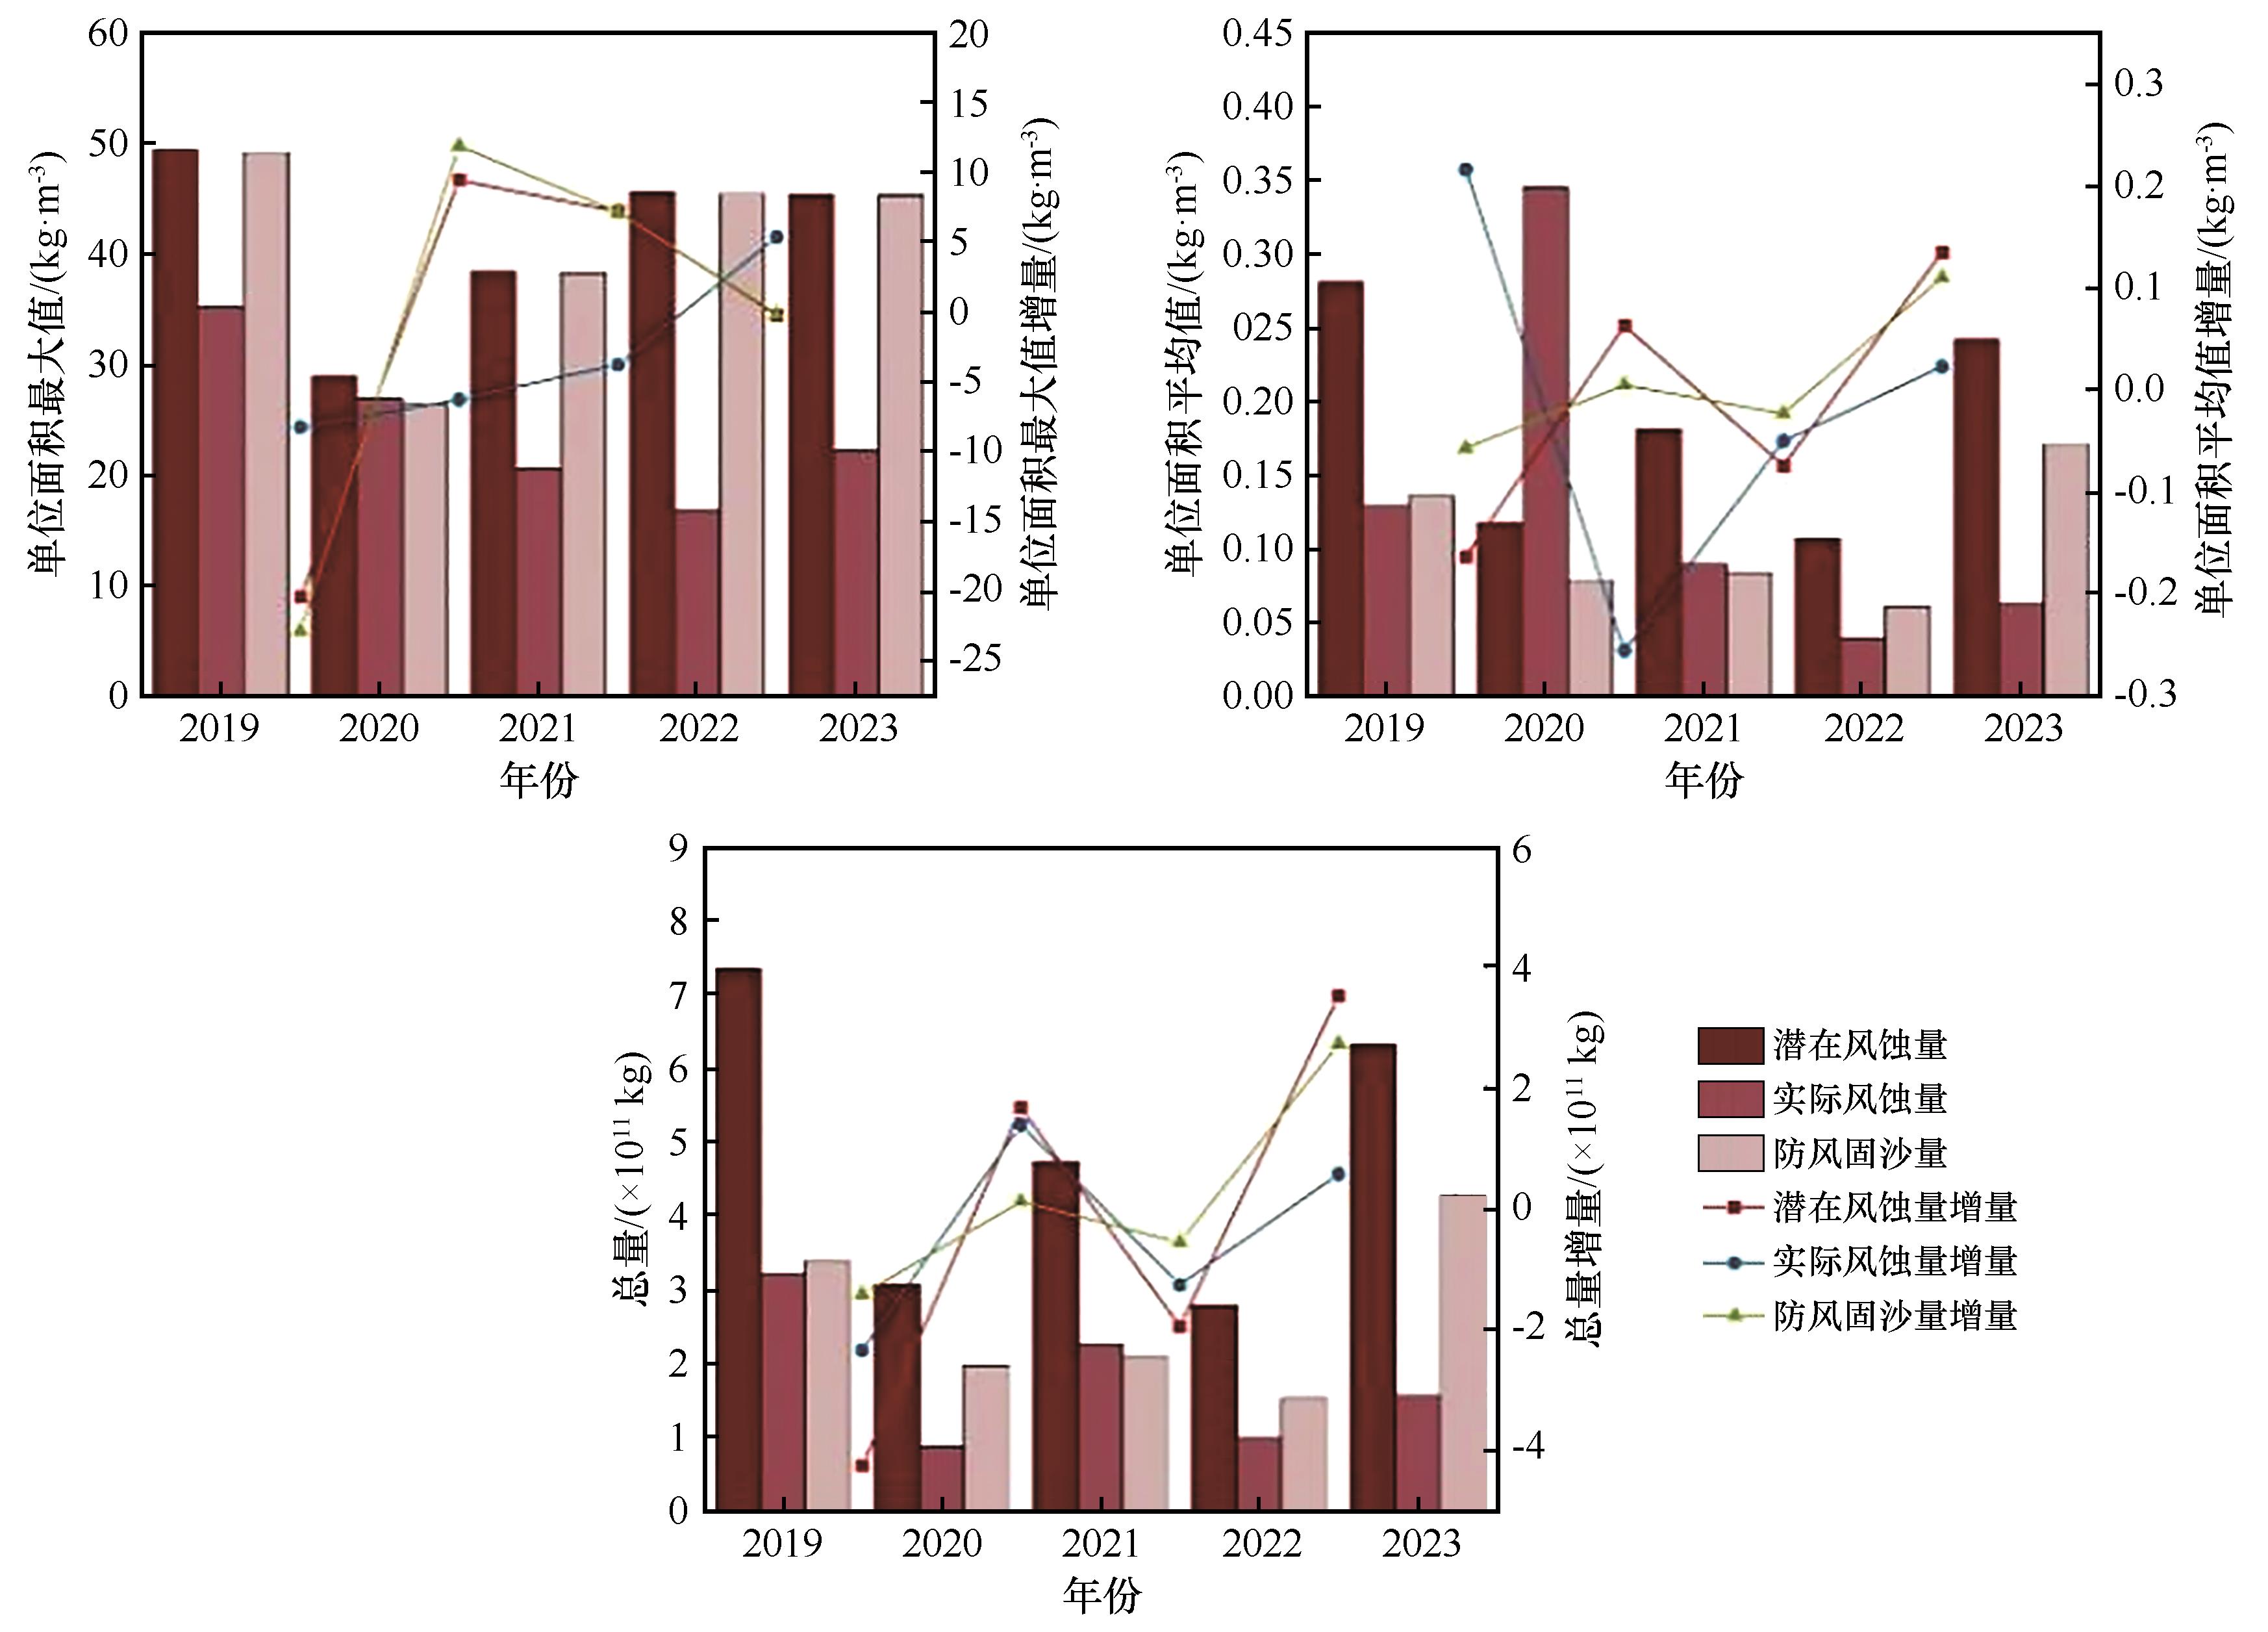
图2 潜在风蚀量、实际风蚀量、防风固沙量变化趋势
Fig.2 Trends in potential soil loss, actual soil loss, and wind erosion control service
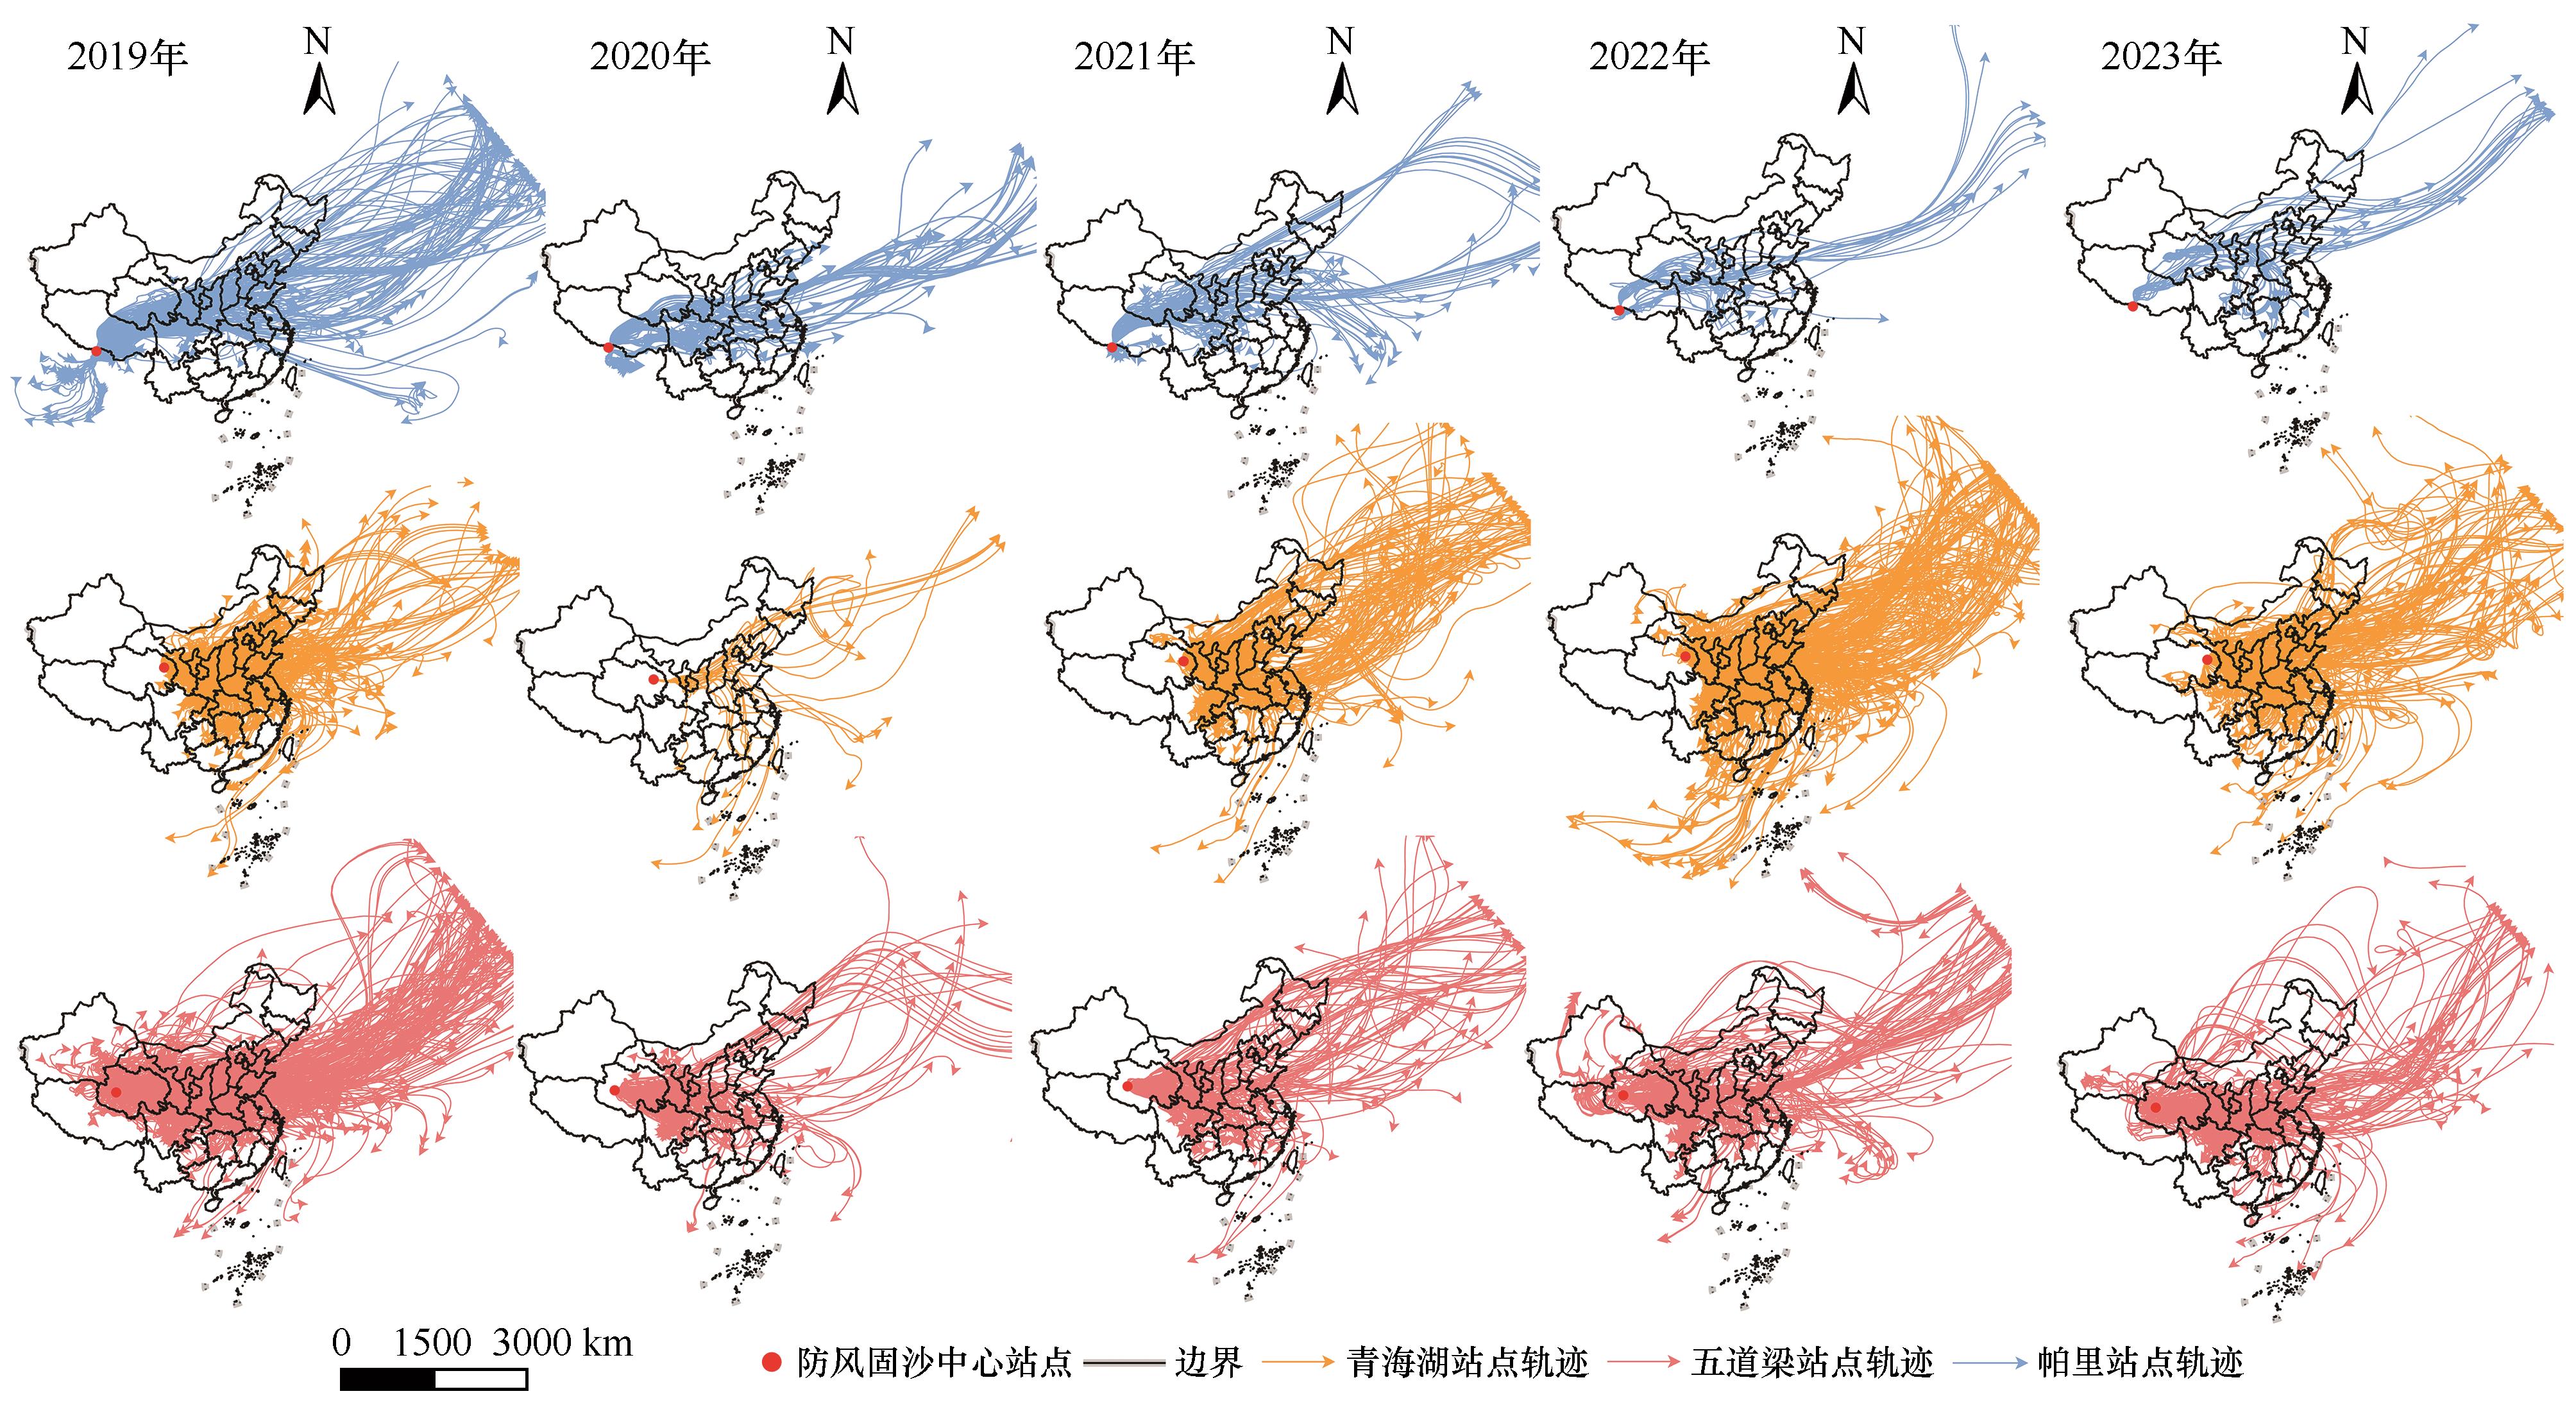
图3 监测站点防风固沙服务流动轨迹注:基于国家测绘地理信息局标准地图服务网站下载的审定号GS2023(2767)标准地图制作,底图无修改。
Fig.3 Transport trajectories of the wind erosion control service from monitoring sites
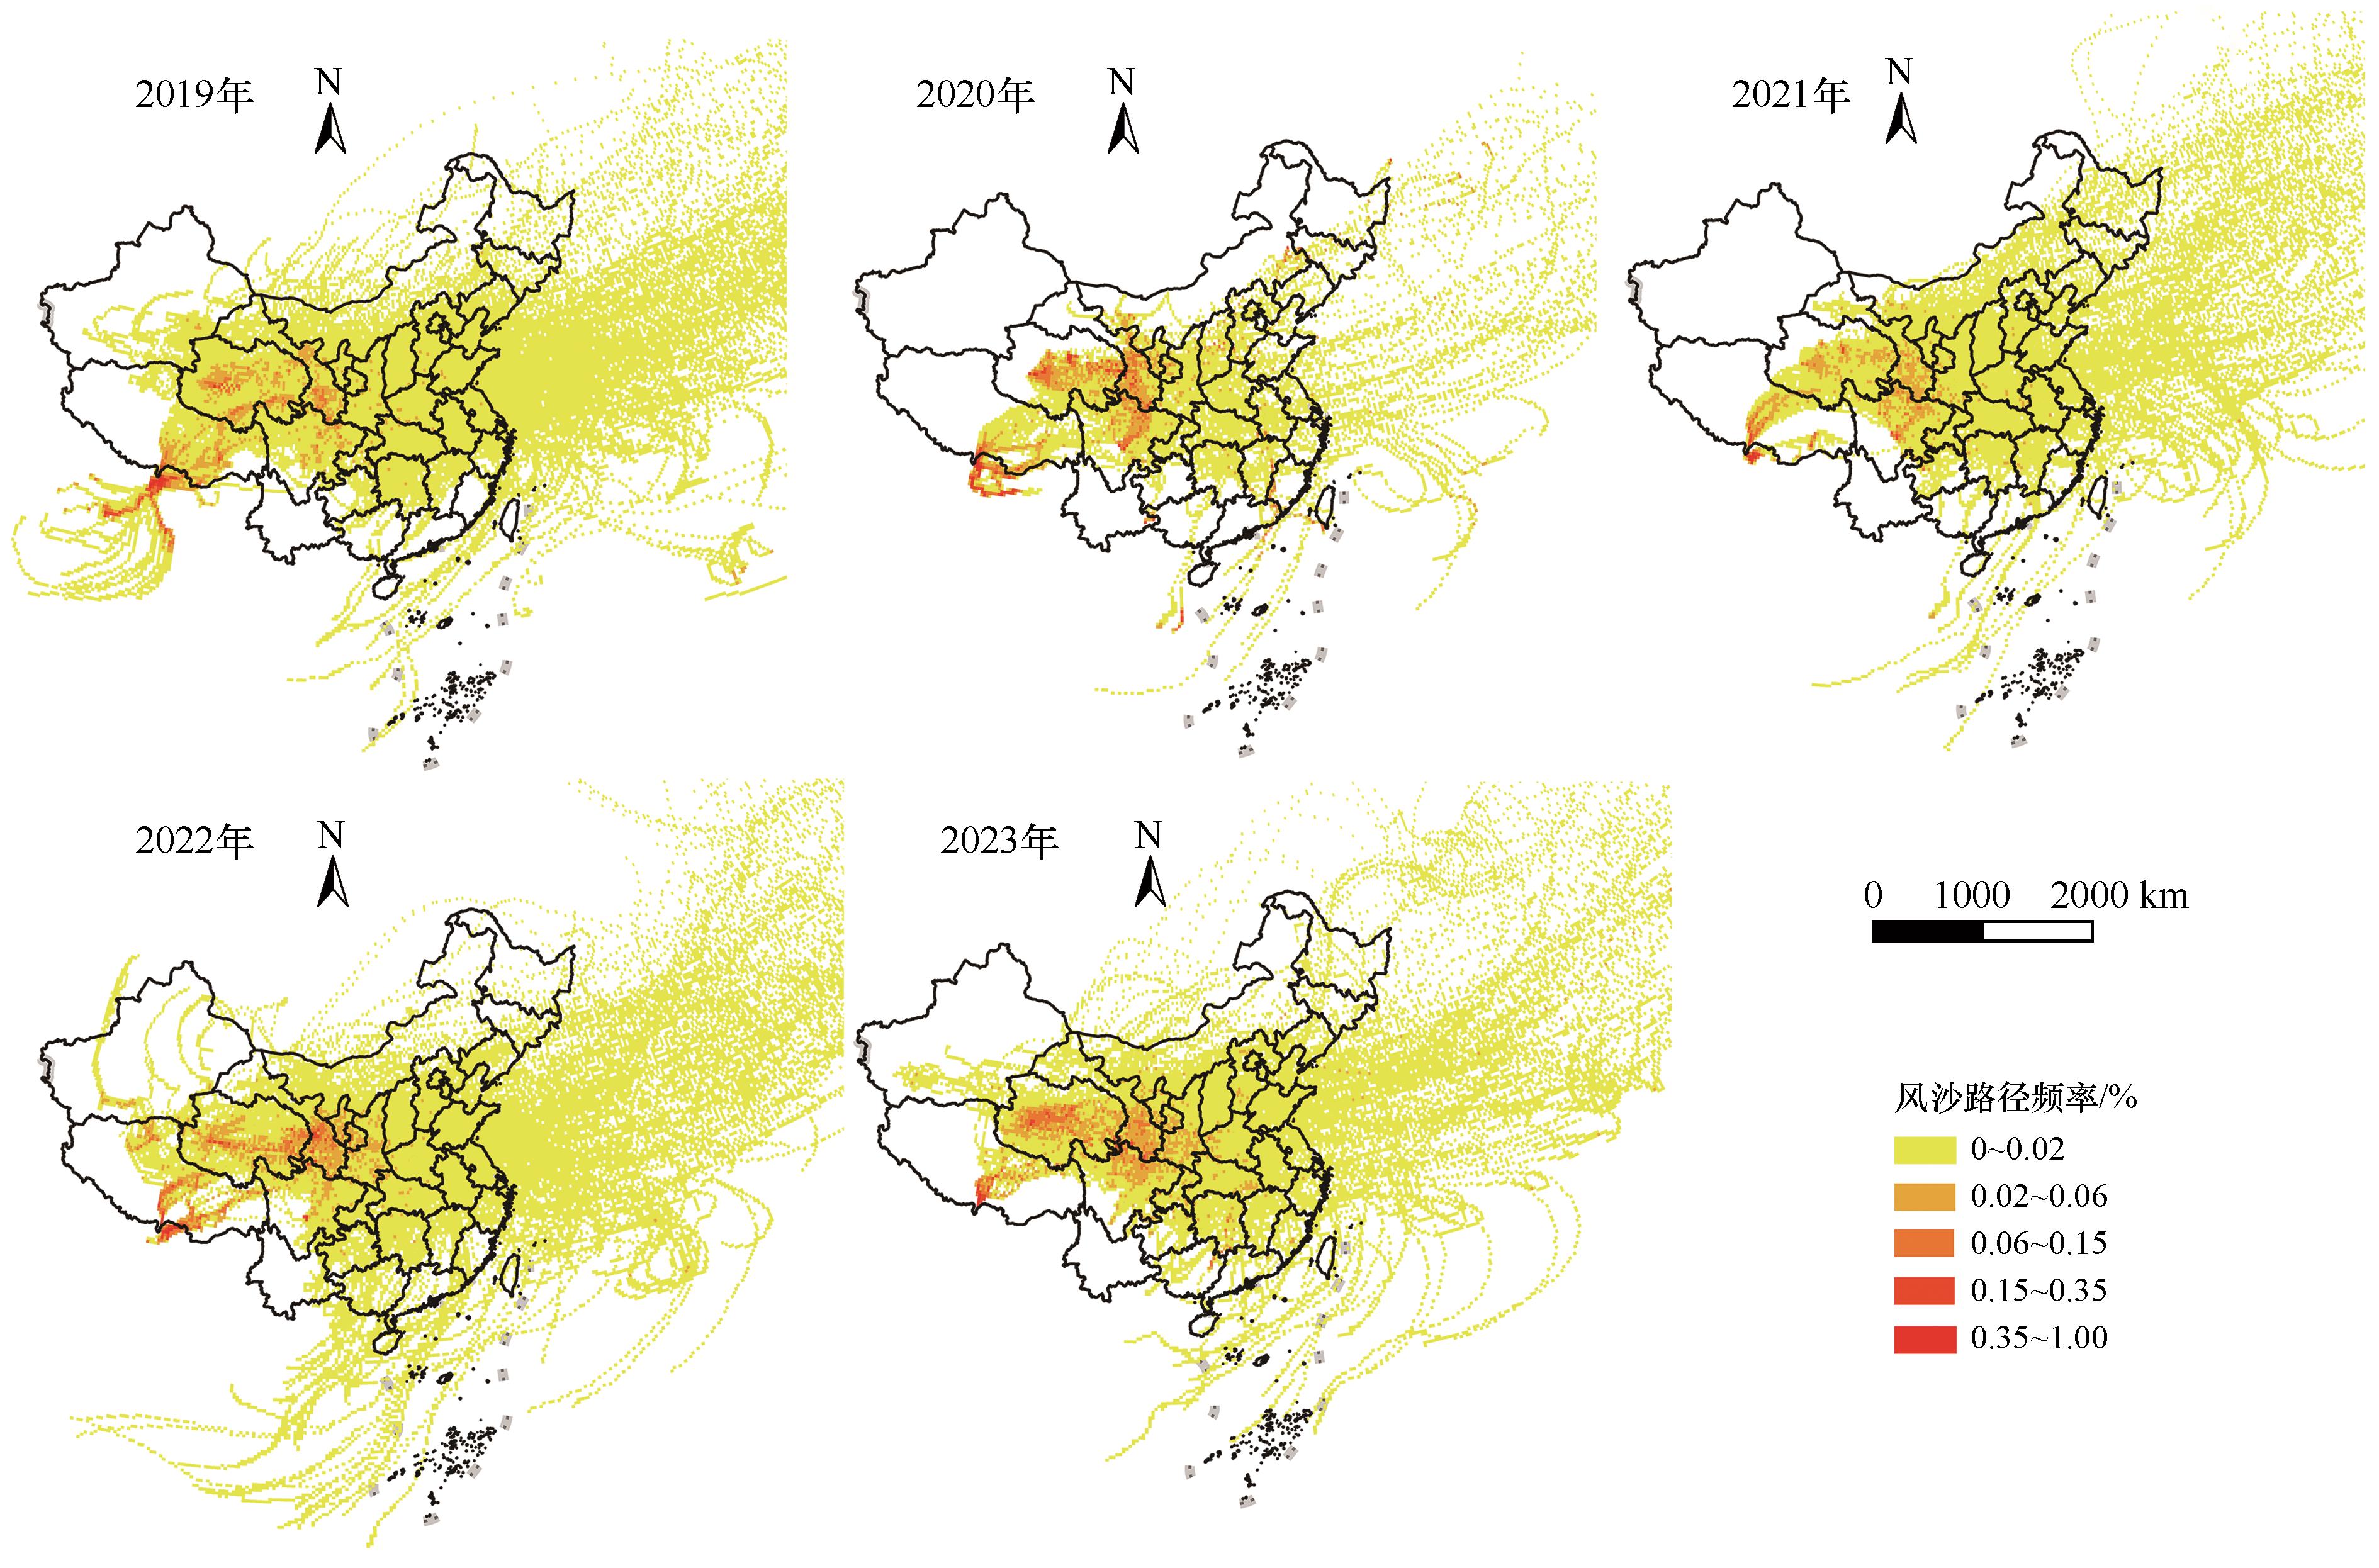
图4 防风固沙服务受益区范围
Fig.4 Extent of benefiting areas from the wind erosion control service
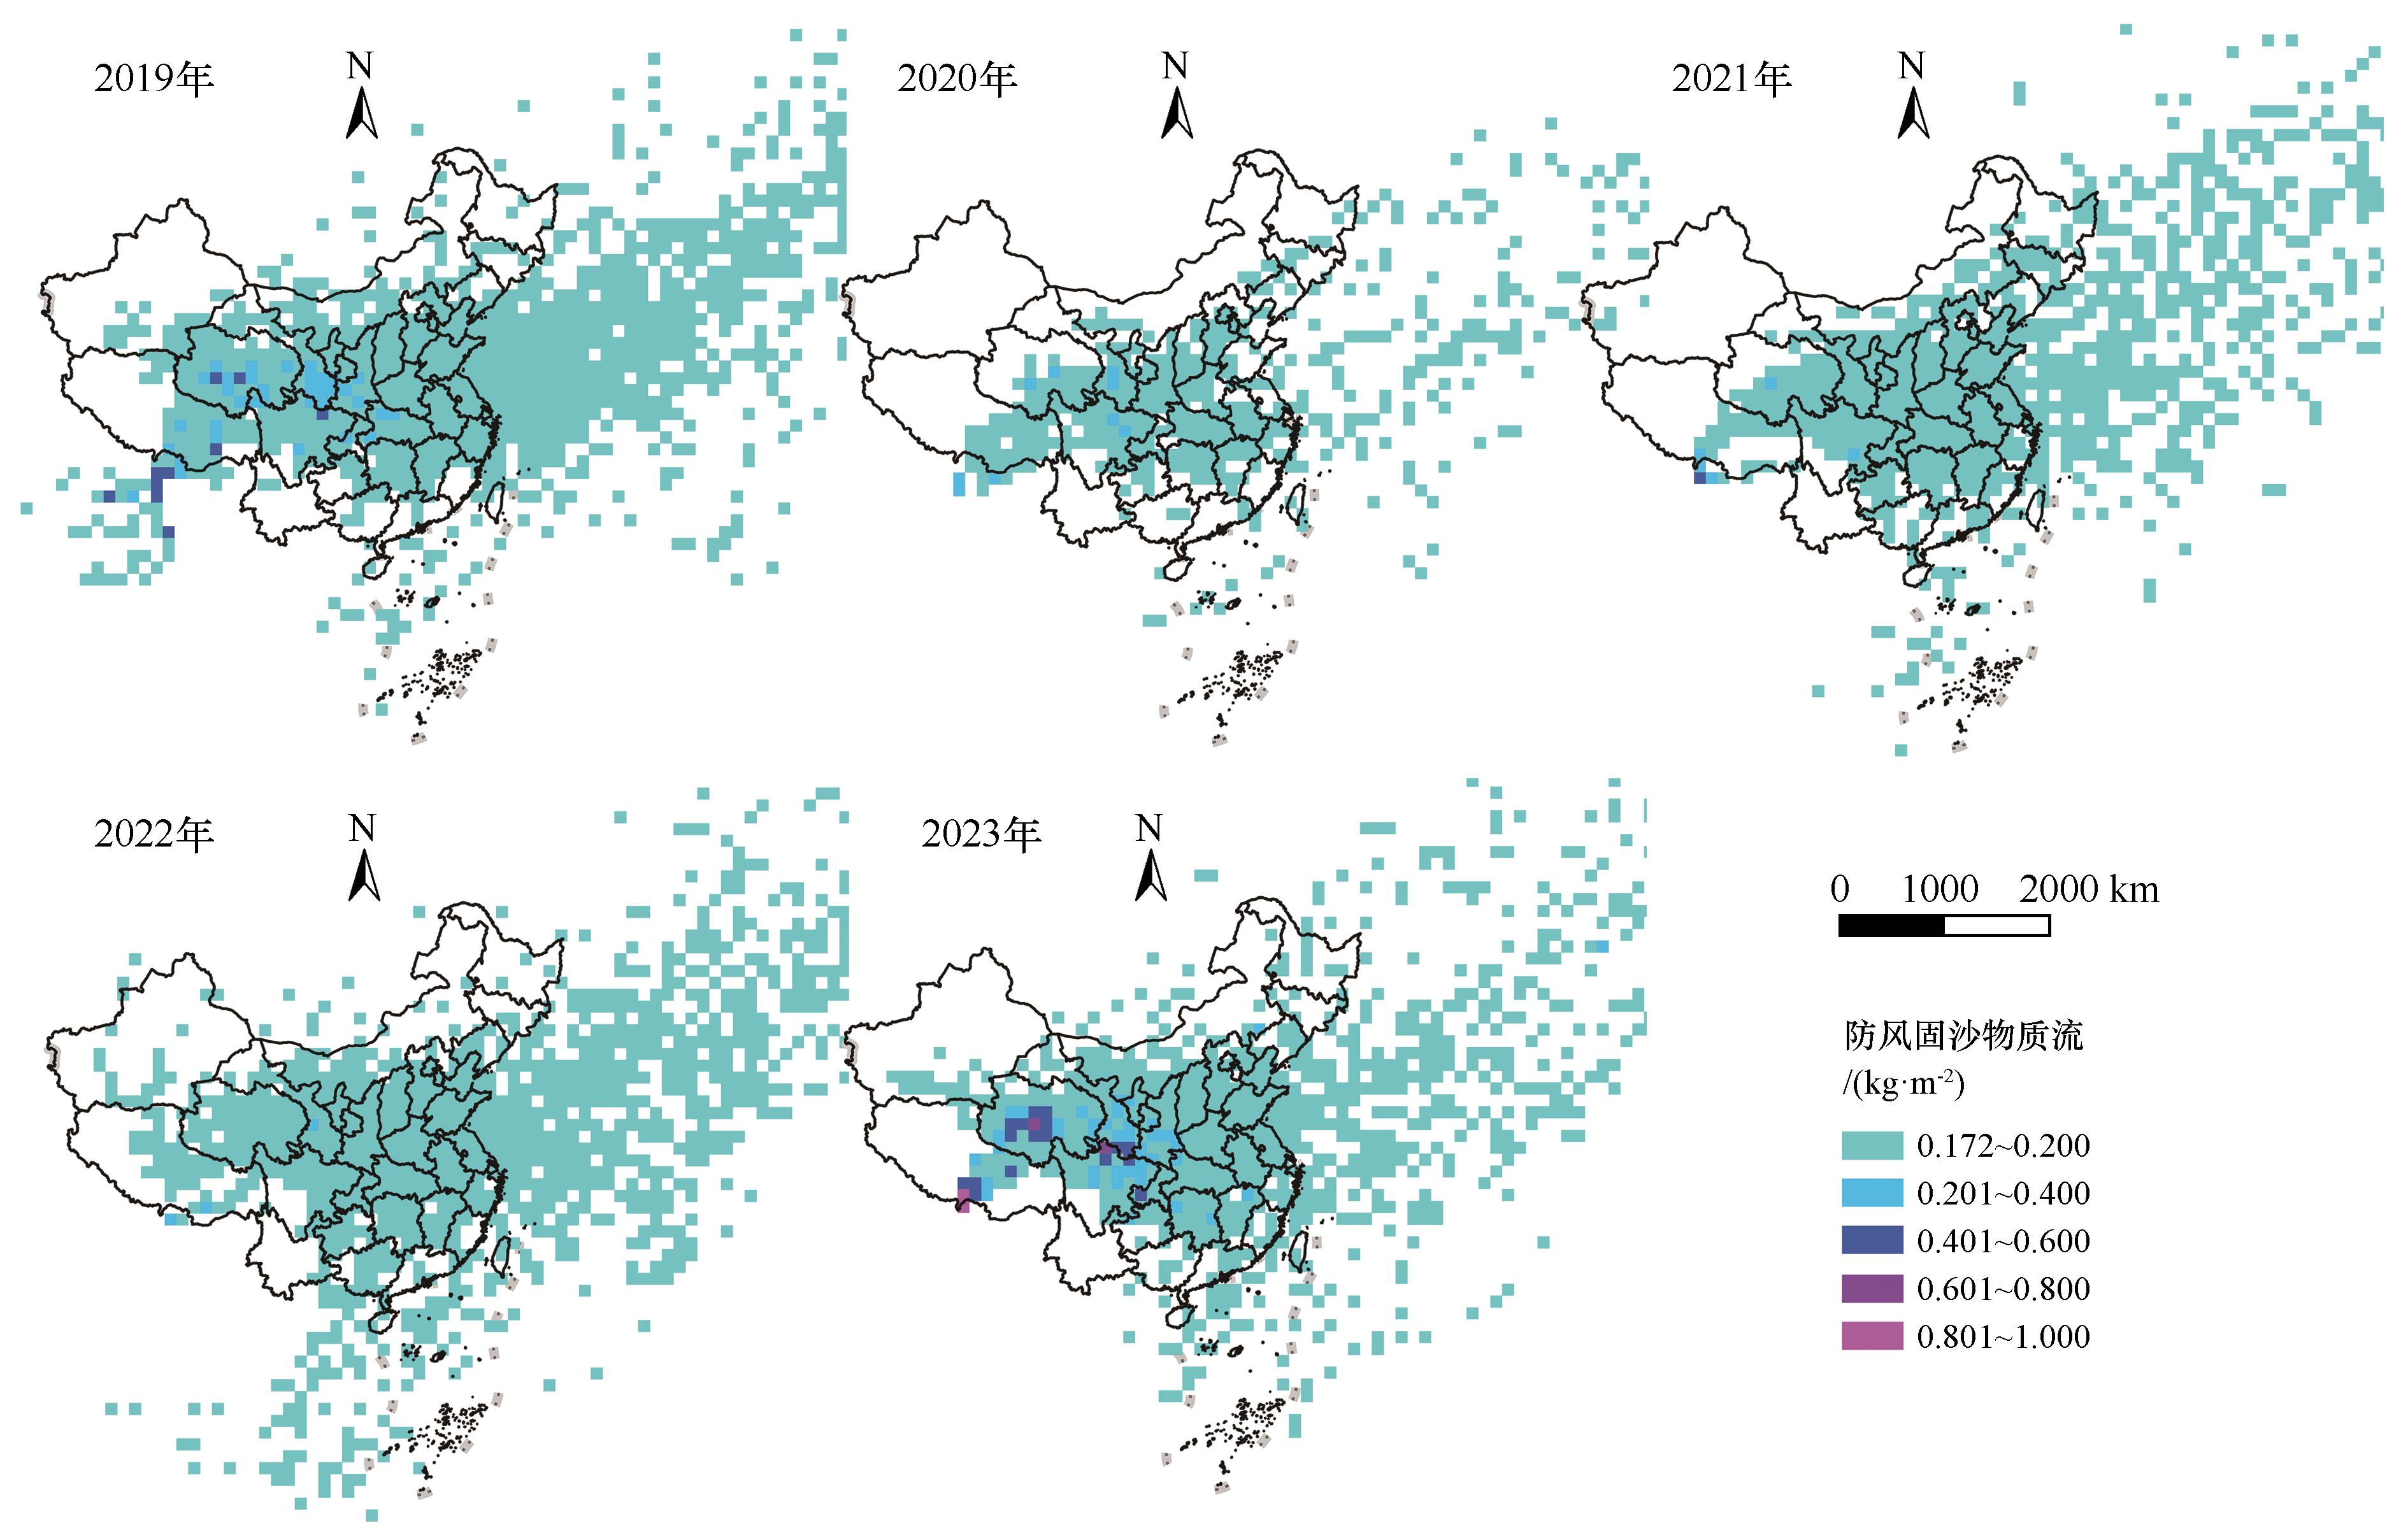
图5 防风固沙服务物质流
Fig.5 Material flow of the wind erosion control service
| 年份 | 频率/% | 受益人口/亿 | 占全国比例/% |
|---|---|---|---|
| 2019 | 0~2 2~6 6~15 15~35 35~100 | 7.050 0.281 0.012 0.00014 0.00004 | 50.356 2.005 0.087 0.0011 0.0001 |
| 总计 | 100 | 7.343 | 52.449 |
| 2020 | 0~2 2~6 6~15 15~35 35~100 | 4.988 0.376 0.133 0.013 0.001 | 35.33 2.665 0.940 0.089 0.010 |
| 总计 | 100 | 5.511 | 39.024 |
| 2021 | 0~2 2~6 6~15 15~35 35~100 | 6.983 0.377 0.023 0.002 0.000015 | 49.436 2.667 0.162 0.013 0.000001 |
| 总计 | 100 | 7.385 | 52.278 |
| 2022 | 0~2 2~6 6~15 15~35 35~100 | 7.645 0.389 0.049 0.014 0.001 | 54.150 2.757 0.344 0.100 0.0034 |
| 总计 | 100 | 8.098 | 57.3544 |
| 2023 | 0~2 2~6 6~15 15~35 35~100 | 6.911 0.649 0.057 0.004 0.001 | 49.023 4.605 0.406 0.026 0.000059 |
| 总计 | 100 | 7.622 | 54.060 |
表2 2019—2023年各频率内受益人口及占比
Table 2 Beneficiary population and proportion under different service scenarios from 2019 to 2023
| 年份 | 频率/% | 受益人口/亿 | 占全国比例/% |
|---|---|---|---|
| 2019 | 0~2 2~6 6~15 15~35 35~100 | 7.050 0.281 0.012 0.00014 0.00004 | 50.356 2.005 0.087 0.0011 0.0001 |
| 总计 | 100 | 7.343 | 52.449 |
| 2020 | 0~2 2~6 6~15 15~35 35~100 | 4.988 0.376 0.133 0.013 0.001 | 35.33 2.665 0.940 0.089 0.010 |
| 总计 | 100 | 5.511 | 39.024 |
| 2021 | 0~2 2~6 6~15 15~35 35~100 | 6.983 0.377 0.023 0.002 0.000015 | 49.436 2.667 0.162 0.013 0.000001 |
| 总计 | 100 | 7.385 | 52.278 |
| 2022 | 0~2 2~6 6~15 15~35 35~100 | 7.645 0.389 0.049 0.014 0.001 | 54.150 2.757 0.344 0.100 0.0034 |
| 总计 | 100 | 8.098 | 57.3544 |
| 2023 | 0~2 2~6 6~15 15~35 35~100 | 6.911 0.649 0.057 0.004 0.001 | 49.023 4.605 0.406 0.026 0.000059 |
| 总计 | 100 | 7.622 | 54.060 |
| 年份 | 频率/% | 类型 | ||||||||
|---|---|---|---|---|---|---|---|---|---|---|
| 耕地 | 林地 | 灌木丛 | 草地 | 水域 | 冰川 | 裸地 | 不透水面 | 湿地 | ||
| 2019 | 0~2 2~6 6~15 15~35 35~100 | 120.24 5.31 0.32 0.006 0 | 109.70 9.10 0.73 0.10 0.01 | 1.11 0.15 0.01 0 0 | 131.13 22.47 2.87 0.22 0.10 | 9.06 0.68 0.03 0.01 0.001 | 1.84 0.47 0.04 0.0042 0.001 | 83.05 5.87 0.44 0.05 0.024 | 19.44 0.33 0.003 0.001 0 | 0.045 0.042 0.0091 0.001 0 |
| 100 | 125.876 | 119.64 | 1.27 | 156.79 | 9.781 | 2.3552 | 89.434 | 19.774 | 0.0971 | |
| 2020 | 0~2 2~6 6~15 15~35 35~100 | 79.794 7.03 1.757 0.339 0.032 | 77.032 10.566 2.690 0.532 0.225 | 0.687 0.218 0.051 0.029 0.005 | 64.301 20.764 5.679 1.151 0.302 | 5.003 0.575 0.113 0.020 0.003 | 1.259 0.130 0.027 0.012 0.002 | 13.234 4.588 1.278 0.144 0.282 | 12.270 0.601 0.195 0.01 0 | 0.018 0.031 0.016 0.002 0 |
| 100 | 88.952 | 91.045 | 0.99 | 92.197 | 5.714 | 1.43 | 19.526 | 13.076 | 0.067 | |
| 2021 | 0~2 2~6 6~15 15~35 35~100 | 115.528 7.662 0.458 0.026 0 | 97.212 9.199 0.878 0.130 0 | 0.942 0.200 0.027 0.000 0 | 107.117 19.329 3.133 0.494 0.053 | 7.028 0.728 0.045 0.002 0.001 | 0.885 0.104 0.051 0 0.002 | 25.741 2.486 0.542 0.027 0.002 | 18.565 0.582 0.024 0.001 0 | 0.053 0.019 0.004 0 0 |
| 100 | 123.674 | 107.419 | 1.169 | 130.126 | 7.804 | 1.042 | 28.798 | 19.172 | 0.076 | |
| 2022 | 0~2 2~6 6~15 15~35 35~100 | 119.788 7.434 0.871 0.1 0.010 | 119.549 8.919 0.885 0.202 0.052 | 1.313 0.217 0.049 0.007 0 | 107.066 29.957 9.373 1.577 0.097 | 8.36 0.760 0.235 0.016 0.001 | 1.194 0.319 0.121 0.059 0.001 | 62.711 7.036 0.601 0.126 0.234 | 20.210 0.462 0.020 0.010 0 | 0.058 0.019 0.004 0.004 0 |
| 100 | 128.203 | 129.607 | 1.586 | 148.07 | 9.372 | 1.694 | 70.708 | 20.702 | 0.085 | |
| 2023 | 0~2 2~6 6~15 15~35 35~100 | 110.694 10.866 1.031 0.048 0.002 | 99.834 15.162 2.109 0.274 0.002 | 0.941 0.225 0.032 0.006 0.003 | 92.989 27.588 7.4 1.295 0.488 | 7.123 1.089 0.219 0.055 0.003 | 1.017 0.255 0.086 0.005 0.001 | 62.083 4.736 2.623 0.271 0.021 | 19.368 1.025 0.033 0.003 0 | 0.027 0.018 0.013 0 0 |
| 100 | 122.641 | 117.381 | 1.207 | 129.76 | 8.489 | 1.364 | 69.734 | 20.429 | 0.058 | |
表3 2019—2023年各频率内各类型土地覆被面积(×104 km²)
Table 3 Area of each land cover type under different service scenarios in 2019-2023 (×104 km²)
| 年份 | 频率/% | 类型 | ||||||||
|---|---|---|---|---|---|---|---|---|---|---|
| 耕地 | 林地 | 灌木丛 | 草地 | 水域 | 冰川 | 裸地 | 不透水面 | 湿地 | ||
| 2019 | 0~2 2~6 6~15 15~35 35~100 | 120.24 5.31 0.32 0.006 0 | 109.70 9.10 0.73 0.10 0.01 | 1.11 0.15 0.01 0 0 | 131.13 22.47 2.87 0.22 0.10 | 9.06 0.68 0.03 0.01 0.001 | 1.84 0.47 0.04 0.0042 0.001 | 83.05 5.87 0.44 0.05 0.024 | 19.44 0.33 0.003 0.001 0 | 0.045 0.042 0.0091 0.001 0 |
| 100 | 125.876 | 119.64 | 1.27 | 156.79 | 9.781 | 2.3552 | 89.434 | 19.774 | 0.0971 | |
| 2020 | 0~2 2~6 6~15 15~35 35~100 | 79.794 7.03 1.757 0.339 0.032 | 77.032 10.566 2.690 0.532 0.225 | 0.687 0.218 0.051 0.029 0.005 | 64.301 20.764 5.679 1.151 0.302 | 5.003 0.575 0.113 0.020 0.003 | 1.259 0.130 0.027 0.012 0.002 | 13.234 4.588 1.278 0.144 0.282 | 12.270 0.601 0.195 0.01 0 | 0.018 0.031 0.016 0.002 0 |
| 100 | 88.952 | 91.045 | 0.99 | 92.197 | 5.714 | 1.43 | 19.526 | 13.076 | 0.067 | |
| 2021 | 0~2 2~6 6~15 15~35 35~100 | 115.528 7.662 0.458 0.026 0 | 97.212 9.199 0.878 0.130 0 | 0.942 0.200 0.027 0.000 0 | 107.117 19.329 3.133 0.494 0.053 | 7.028 0.728 0.045 0.002 0.001 | 0.885 0.104 0.051 0 0.002 | 25.741 2.486 0.542 0.027 0.002 | 18.565 0.582 0.024 0.001 0 | 0.053 0.019 0.004 0 0 |
| 100 | 123.674 | 107.419 | 1.169 | 130.126 | 7.804 | 1.042 | 28.798 | 19.172 | 0.076 | |
| 2022 | 0~2 2~6 6~15 15~35 35~100 | 119.788 7.434 0.871 0.1 0.010 | 119.549 8.919 0.885 0.202 0.052 | 1.313 0.217 0.049 0.007 0 | 107.066 29.957 9.373 1.577 0.097 | 8.36 0.760 0.235 0.016 0.001 | 1.194 0.319 0.121 0.059 0.001 | 62.711 7.036 0.601 0.126 0.234 | 20.210 0.462 0.020 0.010 0 | 0.058 0.019 0.004 0.004 0 |
| 100 | 128.203 | 129.607 | 1.586 | 148.07 | 9.372 | 1.694 | 70.708 | 20.702 | 0.085 | |
| 2023 | 0~2 2~6 6~15 15~35 35~100 | 110.694 10.866 1.031 0.048 0.002 | 99.834 15.162 2.109 0.274 0.002 | 0.941 0.225 0.032 0.006 0.003 | 92.989 27.588 7.4 1.295 0.488 | 7.123 1.089 0.219 0.055 0.003 | 1.017 0.255 0.086 0.005 0.001 | 62.083 4.736 2.623 0.271 0.021 | 19.368 1.025 0.033 0.003 0 | 0.027 0.018 0.013 0 0 |
| 100 | 122.641 | 117.381 | 1.207 | 129.76 | 8.489 | 1.364 | 69.734 | 20.429 | 0.058 | |
| [1] | Ravi S, D'Odorico P, Over T M,et al.On the effect of air humidity on soil susceptibility to wind erosion:the case of air-dry soils[J].Geophysical Research Letters,2004,31(9):1-16. |
| [2] | Fryrear D W, Bilbro J D, Saleh A,et al.RWEQ:improved wind erosion technology[J].Journal of Soil and Water Conservation,2000,55(2):183-189. |
| [3] | Ravi S, Zobeck T M, Over T M,et al.On the effect of moisture bonding forces in air-dry soils on threshold friction velocity of wind erosion[J].Sedimentology,2006,53(3):597-609. |
| [4] | 郭茵,雷加强,范敬龙,等.近20 a蒙古国土壤风蚀变化特征及主要影响因素分析[J].干旱区研究,2022,39(4):1200-1211. |
| [5] | Sun R, He H, Jing Y,et al.Global wind erosion reduction driven by changing climate and land use[J].Earth's Future,2024,12(10):e2024EF004930. |
| [6] | Oldeman L R, Hakkeling R A, Sombroek W W.Global Assessment of Soil Degradation (GLASOD)[R].Wageningen,Netherlands:ISRIC,UNEP,FAO,1990. |
| [7] | Zhang H, Wang F, Zhou S,et al.Contribution of dust emissions from farmland to particulate matter concentrations in North China Plain:integration of WRF-Chem and WEPS model[J].Environment International,2025,195:109191. |
| [8] | 车鑫倩,倪万魁,牛富俊,等.基于改进RWEQ的青藏高原冻融风蚀性评价及影响因素分析[J].中国地质灾害与防治学报,2025,36(4):85-96. |
| [9] | Immerzeel W W, Van Beek L P H,et al.Climate change will affect the asian water towers[J].Science,2010,328(5984):1382-1385. |
| [10] | Wu G, Duan A, Liu Y,et al.Tibetan Plateau climate dynamics:recent research progress and outlook[J].National Science Review,2015,2(1):100-116. |
| [11] | Wang S, Duan J, Xu G,et al.Effects of warming and grazing on soil N availability,species composition,and ANPP in an alpine meadow[J].Ecology,2012,93(11):2365-2376. |
| [12] | 傅伯杰,欧阳志云,施鹏,等.青藏高原生态安全屏障状况与保护对策[J].中国科学院院刊,2021,36(11):1298-1306. |
| [13] | Woodruff N P, Siddoway F H.A wind erosion equation[J].Soil Science Society of America Journal,1965,29(5):602-608. |
| [14] | Gregory J M, Wilson G R, Singh U B,et al.TEAM:integrated,process-based wind-erosion model[J].Environmental Modelling & Software,2004,19(2):205-215. |
| [15] | Tatarko J, Wagner L, Fox F,et al.Wind Erosion Prediction System (WEPS):Technical Documentation USDA-Agriculture Handbook Number 727[M].Washington,USA:USDA Agricultural Research Service,2020. |
| [16] | Van Pelt R, Zobeck T M, Baddock M,et al.Design,construction,and calibration of a portable boundary layer wind tunnel for field use[J].Transactions of the ASABE,2010,53:1-12. |
| [17] | Van Pelt R S, Zobeck T M, Potter K N,et al.Validation of the wind erosion stochastic simulator (WESS) and the revised wind erosion equation (RWEQ)[J].Environmental Modelling & Software,2004,19(2):191-198. |
| [18] | Fryrear D W, Saleh A, Bilbro J D,et al.Revised Wind Erosion Equation (RWEQ)[R].Lubbock,USA:Wind Erosion and Water Conservation Research Unit,USDA-ARS,Southern Plains Area Cropping Systems Research Laboratory,1998. |
| [19] | Buschiazzo D E, Zobeck T M.Validation of WEQ,RWEQ and WEPS wind erosion for different arable land management systems in the Argentinean Pampas[J].Earth Surface Processes & Landforms,2010,33(12):1839-1850. |
| [20] | Youssef F, Visser S, Karssenberg D,et al.Calibration of RWEQ in a patchy landscape; a first step towards a regional scale wind erosion model[J].Aeolian Research,2012,3(4):467-476. |
| [21] | 巩国丽,刘纪远,邵全琴.基于RWEQ的20世纪90年代以来内蒙古锡林郭勒盟土壤风蚀研究[J].地理科学进展,2014,33(6):825-834. |
| [22] | 贺山峰,蒋德明,阿拉木萨.植被的防治风蚀作用[J].生态学杂志,2007,26(5):743-748. |
| [23] | Roels B, Donders S, Werger M J A E A.Relation of wind-induced sand displacement to plant biomass and plant sand-binding capacity[J].Acta Botanica Sinica,2001,43:979-982. |
| [24] | Syrbe R-U, Walz U.Spatial indicators for the assessment of ecosystem services:providing,benefiting and connecting areas and landscape metrics[J].Ecological Indicators,2012,21:80-88. |
| [25] | Draxler R, Hess G.An overview of the HYSPLIT_4 modeling system for trajectories,dispersion,and deposition[J].Australian Meteorological Magazine,1998,47:295-308. |
| [26] | Xu J, Xiao Y, Xie G,et al.How to guarantee the sustainability of the wind prevention and sand fixation service:an ecosystem service flow perspective[J].Sustainability,2018,10(9):10.3390/su10092995. |
| [27] | 冯钰满,戚伟,马海涛.青藏高原边境地区岸城互动发展模式及影响[J].经济地理,2023,43(4):63-72. |
| [28] | 张镱锂.青藏高原边界数据总集 [DB/OL].2019,. |
| [29] | Kang S, Xu Y, You Q,et al.Review of climate and cryospheric change in the Tibetan Plateau[J].Environmental Research Letters,2010,5(1):015101. |
| [30] | 黄孟冬,肖玉,秦克玉,等.1980-2018年浑善达克地区防风固沙服务时空变化及其驱动因素[J].生态学报,2022,42(18):7612-7629. |
| [31] | 申陆,田美荣,高吉喜.基于RWEQ模型的浑善达克沙漠化防治生态功能区土壤风蚀与主要影响因子分析[J].水土保持研究,2016,23(6):90-97. |
| [32] | Fryrear D W, Chen W N, Lester C.Revised wind erosion equation[J].Annals of Arid Zone,2001,40(3):265-279. |
| [33] | Zhang G, Azorin-Molina C, Shi P,et al.Impact of near-surface wind speed variability on wind erosion in the eastern agro-pastoral transitional zone of Northern China,1982–2016[J].Agricultural and Forest Meteorology,2019,271:102-115. |
| [34] | 伊力哈木·伊马木,李菊艳,玉米提·吾提库尔,等.起沙风速的观测方式及其影响因素研究综述[J].中国水土保持,2021(5):42-44. |
| [35] | 王国宇,李晶,张娅.无定河流域防风固沙服务流动模拟[J].生态学报,2024,44(6):2323-2336. |
| [36] | 熊梓旭.青藏高原及周边地区沙尘日变化和传输的三维特征[D].南京:南京信息工程大学,2025. |
| [37] | 苏凯,王计平,王茵然,等.基于HYSPLIT和PSCF的防风固沙生态服务功能空间模拟[J].农业机械学报,2020,51(10):232-242. |
| [38] | 王耕,张红玉.辽西北地区防风固沙服务空间流动与辐射效应[J].生态与农村环境学报,2023,39(1):52-59. |
| [39] | 徐洁.生态系统服务空间流动研究:以宁夏回族自治区为例[D].北京:中国科学院大学,2019. |
| [40] | Yao T, Xue Y, Chen D,et al.Recent third pole's rapid warming accompanies cryospheric melt and water cycle intensification and interactions between monsoon and environment:multidisciplinary approach with observations,modeling,and analysis[J].Bulletin of the American Meteorological Society,2019,100(3):423-444. |
| [41] | You Q, Pepin N, Chen D,et al.Warming amplification over the Arctic Pole and Third Pole:trends,mechanisms and consequences[J].Earth-Science Reviews,2021,217:103625. |
| [42] | Yao T, Bolch T, Chen D,et al.The imbalance of the Asian water tower[J].Nature Reviews Earth & Environment,2022,3(10):618-650. |
| [1] | 张碧优, 胡光印, 胡菁菁. 黄河源区玛多盆地风况与输沙势特征[J]. 中国沙漠, 2026, 46(3): 88-96. |
| [2] | 高杰, 胡光印, 高娜, 胡菁菁. 2017—2018年卓乃湖湖冰表面风成沉积物遥感监测[J]. 中国沙漠, 2026, 46(2): 1-10. |
| [3] | 江艳冰, 谭立海, 王洪涛, 周倩, 安志山. 中国西北干旱区典型泥漠地表粒度与矿物组成特征及抗风蚀能力[J]. 中国沙漠, 2026, 46(2): 233-241. |
| [4] | 白荔媛, 李庆, 王洪涛. 基于改进的第一次全国水利普查风蚀模型的河西走廊土壤风蚀时空变化研究[J]. 中国沙漠, 2026, 46(2): 34-42. |
| [5] | 范晓强, 白飞, 张加琼, 黄子炎, 王梦婕, 安鑫, 严云籍. 水蚀作用下砂黄土坡耕地风蚀的坡向分异特征[J]. 中国沙漠, 2026, 46(2): 371-379. |
| [6] | 牛清河, 苏春丽, 肖建华, 王博, 夏磊, 张晴, 刘璐璐. 青藏高原苏干湖盆地光伏电站对戈壁风沙环境的影响[J]. 中国沙漠, 2025, 45(6): 249-257. |
| [7] | 张慧琳, 王卫国, 薄一览, 晋子振. 科尔沁沙地防风固沙服务时空变化[J]. 中国沙漠, 2025, 45(4): 227-240. |
| [8] | 王飞翔, 甄天乐, 李继峰, 李慧茹, 郭中领, 常春平, 张夏蕾, 于凯昕. 奈曼旗玉米残茬覆盖度计算方法及其对土壤风蚀量计算的影响[J]. 中国沙漠, 2025, 45(4): 241-252. |
| [9] | 邢瑜, 柳本立, 马涛, 王伊蒙. 2000—2023年河西走廊-塔克拉玛干沙漠边缘阻击战核心区风蚀起尘量变化[J]. 中国沙漠, 2024, 44(6): 330-341. |
| [10] | 李成阳, 黄樱宜, 林千策, 沈琳丽, 罗诗影, 梁志辉, 李臻明, 彭飞, 薛娴. 长江源区高寒草甸生长季载畜量对模拟增温的响应[J]. 中国沙漠, 2024, 44(4): 165-173. |
| [11] | 陈俊言, 贯雅雯, 张越, 陈渔, 毕鸿儒, 娄高僮, 郭馨阳, 王洋, 陈思宇. 戈壁沙漠沙尘向青藏高原传输路径和传输机制:以2020年4月一次沙尘事件为例[J]. 中国沙漠, 2024, 44(3): 158-171. |
| [12] | 孟惠聪, 胡光印, 董治宝, 南维鸽, 莫皓焜, 胡菁菁. 若尔盖盆地流动沙丘治理前后表层沉积物粒度变化特征[J]. 中国沙漠, 2024, 44(3): 96-107. |
| [13] | 曹佳慧, 陈思宇, 张潮, 连露露, 赵丹, 杜世康. 青藏高原沙尘的外源贡献[J]. 中国沙漠, 2024, 44(2): 57-65. |
| [14] | 贾文茹, 李庆, 李秀明, 谢宝妮, 王翠. 2000—2018年河北坝上地区土壤风蚀模数变化[J]. 中国沙漠, 2024, 44(1): 130-141. |
| [15] | 李庆, 周娜, 王盛, 李童洲, 王仁德, 王金凤. 气候变化和人类活动对土壤风蚀影响的定量评估[J]. 中国沙漠, 2024, 44(1): 178-188. |
| 阅读次数 | ||||||
|
全文 |
|
|||||
|
摘要 |
|
|||||
©2018中国沙漠 编辑部
地址: 兰州市天水中路8号 (730000)
电话:0931-8267545
Email:caiedit@lzb.ac.cn;desert@lzb.ac.cn


 甘公网安备 62010202000688号