
- CN 62-1070/P
- ISSN 1000-694X
- Bimonthly 1981
Journal of Desert Research ›› 2023, Vol. 43 ›› Issue (5): 176-185.DOI: 10.7522/j.issn.1000-694X.2023.00090
Previous Articles Next Articles
Jing Yang1,2,4( ), Qun Guo1,3,4()
Received:2023-03-21
Revised:2023-06-01
Online:2023-09-20
Published:2023-09-27
Contact:
Qun Guo
CLC Number:
Jing Yang, Qun Guo. Study on carbon emission estimation methods and emission reduction pathways at provincial level[J]. Journal of Desert Research, 2023, 43(5): 176-185.
Add to citation manager EndNote|Ris|BibTeX
URL: http://www.desert.ac.cn/EN/10.7522/j.issn.1000-694X.2023.00090
| 影响因素 | 应用指标 | 影响过程 |
|---|---|---|
| 人口 | 年末总人口 | 人类活动(呼吸、出行等)消耗能源产生碳排放 |
| 经济 | GDP | 经济生产活动消耗能源产生碳排放 |
| 能源强度 | 能源消费总量/GDP | 高能源强度下碳排放量大于低能源强度 |
| 能源结构 | 煤炭、石油、天然气及清洁能源在能源消费总量中的构成比例 | 化石能源含碳量的多少影响碳排放量的大小 |
| 产业结构 | 第一、二、三产业产值比例 | 单位产值能耗量的大小影响一个产业/行业的碳排放量 |
Table 1 Application indicators and processes of the factors influencing annual carbon emissions
| 影响因素 | 应用指标 | 影响过程 |
|---|---|---|
| 人口 | 年末总人口 | 人类活动(呼吸、出行等)消耗能源产生碳排放 |
| 经济 | GDP | 经济生产活动消耗能源产生碳排放 |
| 能源强度 | 能源消费总量/GDP | 高能源强度下碳排放量大于低能源强度 |
| 能源结构 | 煤炭、石油、天然气及清洁能源在能源消费总量中的构成比例 | 化石能源含碳量的多少影响碳排放量的大小 |
| 产业结构 | 第一、二、三产业产值比例 | 单位产值能耗量的大小影响一个产业/行业的碳排放量 |
| 行业分类 | 行业名称 | GDP | 碳排放量 | 碳排放强度 | 脱钩情况 | ||||
|---|---|---|---|---|---|---|---|---|---|
| 亿元 | 占比/% | 106 t | 占比/% | /(t | 2010年 | 2015年 | 2020年 | ||
| 超高排放、高产值 | 电力、热力生产和供应业 | 265.44 | 6.70 | 176.55 | 78.75 | 66.51 | 负脱钩 | 绝对脱钩 | 负脱钩 |
| 高排放、中产值 | 黑色金属冶炼和压延加工业 | 43.15 | 1.09 | 15.96 | 7.12 | 36.97 | 相对脱钩 | 绝对脱钩 | 负脱钩 |
| 中排放、中产值 | 非金属矿物制品业 | 30.60 | 0.77 | 8.39 | 3.74 | 27.41 | 负脱钩 | 绝对脱钩 | 绝对脱钩 |
| 燃气生产和供应业 | 14.72 | 0.37 | 1.69 | 0.75 | 11.49 | 负脱钩 | 负脱钩 | 负脱钩 | |
| 中排放、高产值 | 石油加工、炼焦和核燃料加工业 | 182.33 | 4.60 | 8.39 | 3.74 | 4.60 | 负脱钩 | 负脱钩 | 负脱钩 |
| 化学原料和化学制品制造业 | 214.79 | 5.42 | 4.66 | 2.08 | 2.17 | 负脱钩 | 负脱钩 | 负脱钩 | |
| 交通运输、仓储和邮政业 | 181.00 | 4.57 | 3.26 | 1.46 | 1.80 | 相对脱钩 | 绝对脱钩 | 绝对脱钩 | |
| 煤炭开采和洗选业 | 206.46 | 5.21 | 1.94 | 0.87 | 0.94 | 相对脱钩 | 相对脱钩 | 负脱钩 | |
| 低排放、超高产值 | 其他服务业 | 1545.3 | 38.98 | 0.46 | 0.21 | 0.03 | 相对脱钩 | 绝对脱钩 | 相对脱钩 |
| 低排放、高产值 | 建筑业 | 324.30 | 8.18 | 0.71 | 0.32 | 0.22 | 相对脱钩 | 绝对脱钩 | 绝对脱钩 |
| 批发、零售和住宿、餐饮业 | 243.00 | 6.13 | 0.35 | 0.15 | 0.14 | 绝对脱钩 | 绝对脱钩 | 绝对脱钩 | |
| 农林牧渔业 | 356.30 | 8.99 | 0.23 | 0.10 | 0.06 | 相对脱钩 | 绝对脱钩 | 绝对脱钩 | |
| 低排放、中产值 | 食品制造业 | 36.89 | 0.93 | 0.39 | 0.18 | 1.06 | 绝对脱钩 | 负脱钩 | 相对脱钩 |
| 通用设备制造业 | 15.47 | 0.39 | 0.17 | 0.08 | 1.11 | 绝对脱钩 | 负脱钩 | 相对脱钩 | |
| 有色金属冶炼和压延加工业 | 48.69 | 1.23 | 0.16 | 0.07 | 0.33 | 负脱钩 | 负脱钩 | 绝对脱钩 | |
| 金属制品业 | 17.39 | 0.44 | 0.02 | 0.01 | 0.13 | 绝对脱钩 | 绝对脱钩 | 绝对脱钩 | |
| 农副食品加工业 | 16.32 | 0.41 | 0.02 | 0.01 | 0.10 | 相对脱钩 | 负脱钩 | 负脱钩 | |
| 纺织业 | 30.11 | 0.76 | 0.01 | 0.01 | 0.04 | 相对脱钩 | 负脱钩 | 绝对脱钩 | |
| 电气机械和器材制造业 | 63.61 | 1.60 | 0.01 | 0.00 | 0.01 | 绝对脱钩 | 负脱钩 | 相对脱钩 | |
| 专用设备制造业 | 12.47 | 0.31 | 0.01 | 0.00 | 0.04 | 相对脱钩 | 绝对脱钩 | 绝对脱钩 | |
| 运输设备制造业 | 29.70 | 0.75 | 0.00 | 0.00 | 0.01 | 相对脱钩 | 绝对脱钩 | 绝对脱钩 | |
| 烟草制品业 | 16.24 | 0.41 | 0.00 | 0.00 | 0.01 | 负脱钩 | 负脱钩 | 绝对脱钩 | |
| 医药制造业 | 10.60 | 0.27 | 0.00 | 0.00 | 0.01 | 绝对脱钩 | 负脱钩 | 负脱钩 | |
| 低排放、低产值 | 黑色金属矿采选业 | 7.87 | 0.20 | 0.63 | 0.28 | 7.97 | — | 相对脱钩 | 绝对脱钩 |
| 非金属矿采选业 | 1.31 | 0.03 | 0.11 | 0.05 | 8.08 | 负脱钩 | 负脱钩 | 绝对脱钩 | |
| 造纸和纸制品业 | 2.27 | 0.06 | 0.05 | 0.02 | 2.25 | 绝对脱钩 | 负脱钩 | 绝对脱钩 | |
| 酒、饮料和精制茶制造业 | 9.09 | 0.23 | 0.01 | 0.01 | 0.13 | 相对脱钩 | 负脱钩 | 负脱钩 | |
| 废弃资源综合利用业 | 5.25 | 0.13 | 0.005 | 0.002 | 0.09 | — | 相对脱钩 | 负脱钩 | |
| 印刷和记录媒介复制业 | 3.59 | 0.09 | 0.003 | 0.001 | 0.09 | 相对脱钩 | 负脱钩 | 相对脱钩 | |
| 仪器仪表制造业 | 4.30 | 0.11 | 0.003 | 0.001 | 0.07 | 相对脱钩 | 负脱钩 | 绝对脱钩 | |
| 木材加工和木、竹、藤、棕、草制品业 | 0.91 | 0.02 | 0.003 | 0.001 | 0.33 | 绝对脱钩 | 负脱钩 | 负脱钩 | |
| 水的生产和供应业 | 6.80 | 0.17 | 0.002 | 0.001 | 0.03 | 相对脱钩 | 负脱钩 | 绝对脱钩 | |
| 纺织服装、服饰业 | 8.52 | 0.21 | 0.001 | 0.0004 | 0.01 | 相对脱钩 | 负脱钩 | 相对脱钩 | |
| 皮革、毛皮、羽毛及其制品和制鞋业 | 1.28 | 0.03 | 0.001 | 0.0003 | 0.06 | 负脱钩 | 绝对脱钩 | 负脱钩 | |
| 橡胶和塑料制品业 | 6.99 | 0.18 | 0.0005 | 0.0002 | 0.01 | 绝对脱钩 | 绝对脱钩 | 绝对脱钩 | |
| 文教、工美、体育和娱乐用品制造业 | 0.26 | 0.01 | 0.0002 | 0.0001 | 0.07 | — | 相对脱钩 | 相对脱钩 | |
| 家具制造业 | 0.60 | 0.02 | 0 | 0 | 0 | 绝对脱钩 | 负脱钩 | 绝对脱钩 | |
| 石油和天然气开采业 | 0.09 | 0.002 | 0 | 0 | 0 | 相对脱钩 | 绝对脱钩 | 负脱钩 | |
| 计算机、通信和其他电子设备制造业 | — | — | 0.001 | 0.001 | — | — | — | — | |
Table 2 Carbon emissions (2020) and decoupling by sector in Ningxia
| 行业分类 | 行业名称 | GDP | 碳排放量 | 碳排放强度 | 脱钩情况 | ||||
|---|---|---|---|---|---|---|---|---|---|
| 亿元 | 占比/% | 106 t | 占比/% | /(t | 2010年 | 2015年 | 2020年 | ||
| 超高排放、高产值 | 电力、热力生产和供应业 | 265.44 | 6.70 | 176.55 | 78.75 | 66.51 | 负脱钩 | 绝对脱钩 | 负脱钩 |
| 高排放、中产值 | 黑色金属冶炼和压延加工业 | 43.15 | 1.09 | 15.96 | 7.12 | 36.97 | 相对脱钩 | 绝对脱钩 | 负脱钩 |
| 中排放、中产值 | 非金属矿物制品业 | 30.60 | 0.77 | 8.39 | 3.74 | 27.41 | 负脱钩 | 绝对脱钩 | 绝对脱钩 |
| 燃气生产和供应业 | 14.72 | 0.37 | 1.69 | 0.75 | 11.49 | 负脱钩 | 负脱钩 | 负脱钩 | |
| 中排放、高产值 | 石油加工、炼焦和核燃料加工业 | 182.33 | 4.60 | 8.39 | 3.74 | 4.60 | 负脱钩 | 负脱钩 | 负脱钩 |
| 化学原料和化学制品制造业 | 214.79 | 5.42 | 4.66 | 2.08 | 2.17 | 负脱钩 | 负脱钩 | 负脱钩 | |
| 交通运输、仓储和邮政业 | 181.00 | 4.57 | 3.26 | 1.46 | 1.80 | 相对脱钩 | 绝对脱钩 | 绝对脱钩 | |
| 煤炭开采和洗选业 | 206.46 | 5.21 | 1.94 | 0.87 | 0.94 | 相对脱钩 | 相对脱钩 | 负脱钩 | |
| 低排放、超高产值 | 其他服务业 | 1545.3 | 38.98 | 0.46 | 0.21 | 0.03 | 相对脱钩 | 绝对脱钩 | 相对脱钩 |
| 低排放、高产值 | 建筑业 | 324.30 | 8.18 | 0.71 | 0.32 | 0.22 | 相对脱钩 | 绝对脱钩 | 绝对脱钩 |
| 批发、零售和住宿、餐饮业 | 243.00 | 6.13 | 0.35 | 0.15 | 0.14 | 绝对脱钩 | 绝对脱钩 | 绝对脱钩 | |
| 农林牧渔业 | 356.30 | 8.99 | 0.23 | 0.10 | 0.06 | 相对脱钩 | 绝对脱钩 | 绝对脱钩 | |
| 低排放、中产值 | 食品制造业 | 36.89 | 0.93 | 0.39 | 0.18 | 1.06 | 绝对脱钩 | 负脱钩 | 相对脱钩 |
| 通用设备制造业 | 15.47 | 0.39 | 0.17 | 0.08 | 1.11 | 绝对脱钩 | 负脱钩 | 相对脱钩 | |
| 有色金属冶炼和压延加工业 | 48.69 | 1.23 | 0.16 | 0.07 | 0.33 | 负脱钩 | 负脱钩 | 绝对脱钩 | |
| 金属制品业 | 17.39 | 0.44 | 0.02 | 0.01 | 0.13 | 绝对脱钩 | 绝对脱钩 | 绝对脱钩 | |
| 农副食品加工业 | 16.32 | 0.41 | 0.02 | 0.01 | 0.10 | 相对脱钩 | 负脱钩 | 负脱钩 | |
| 纺织业 | 30.11 | 0.76 | 0.01 | 0.01 | 0.04 | 相对脱钩 | 负脱钩 | 绝对脱钩 | |
| 电气机械和器材制造业 | 63.61 | 1.60 | 0.01 | 0.00 | 0.01 | 绝对脱钩 | 负脱钩 | 相对脱钩 | |
| 专用设备制造业 | 12.47 | 0.31 | 0.01 | 0.00 | 0.04 | 相对脱钩 | 绝对脱钩 | 绝对脱钩 | |
| 运输设备制造业 | 29.70 | 0.75 | 0.00 | 0.00 | 0.01 | 相对脱钩 | 绝对脱钩 | 绝对脱钩 | |
| 烟草制品业 | 16.24 | 0.41 | 0.00 | 0.00 | 0.01 | 负脱钩 | 负脱钩 | 绝对脱钩 | |
| 医药制造业 | 10.60 | 0.27 | 0.00 | 0.00 | 0.01 | 绝对脱钩 | 负脱钩 | 负脱钩 | |
| 低排放、低产值 | 黑色金属矿采选业 | 7.87 | 0.20 | 0.63 | 0.28 | 7.97 | — | 相对脱钩 | 绝对脱钩 |
| 非金属矿采选业 | 1.31 | 0.03 | 0.11 | 0.05 | 8.08 | 负脱钩 | 负脱钩 | 绝对脱钩 | |
| 造纸和纸制品业 | 2.27 | 0.06 | 0.05 | 0.02 | 2.25 | 绝对脱钩 | 负脱钩 | 绝对脱钩 | |
| 酒、饮料和精制茶制造业 | 9.09 | 0.23 | 0.01 | 0.01 | 0.13 | 相对脱钩 | 负脱钩 | 负脱钩 | |
| 废弃资源综合利用业 | 5.25 | 0.13 | 0.005 | 0.002 | 0.09 | — | 相对脱钩 | 负脱钩 | |
| 印刷和记录媒介复制业 | 3.59 | 0.09 | 0.003 | 0.001 | 0.09 | 相对脱钩 | 负脱钩 | 相对脱钩 | |
| 仪器仪表制造业 | 4.30 | 0.11 | 0.003 | 0.001 | 0.07 | 相对脱钩 | 负脱钩 | 绝对脱钩 | |
| 木材加工和木、竹、藤、棕、草制品业 | 0.91 | 0.02 | 0.003 | 0.001 | 0.33 | 绝对脱钩 | 负脱钩 | 负脱钩 | |
| 水的生产和供应业 | 6.80 | 0.17 | 0.002 | 0.001 | 0.03 | 相对脱钩 | 负脱钩 | 绝对脱钩 | |
| 纺织服装、服饰业 | 8.52 | 0.21 | 0.001 | 0.0004 | 0.01 | 相对脱钩 | 负脱钩 | 相对脱钩 | |
| 皮革、毛皮、羽毛及其制品和制鞋业 | 1.28 | 0.03 | 0.001 | 0.0003 | 0.06 | 负脱钩 | 绝对脱钩 | 负脱钩 | |
| 橡胶和塑料制品业 | 6.99 | 0.18 | 0.0005 | 0.0002 | 0.01 | 绝对脱钩 | 绝对脱钩 | 绝对脱钩 | |
| 文教、工美、体育和娱乐用品制造业 | 0.26 | 0.01 | 0.0002 | 0.0001 | 0.07 | — | 相对脱钩 | 相对脱钩 | |
| 家具制造业 | 0.60 | 0.02 | 0 | 0 | 0 | 绝对脱钩 | 负脱钩 | 绝对脱钩 | |
| 石油和天然气开采业 | 0.09 | 0.002 | 0 | 0 | 0 | 相对脱钩 | 绝对脱钩 | 负脱钩 | |
| 计算机、通信和其他电子设备制造业 | — | — | 0.001 | 0.001 | — | — | — | — | |
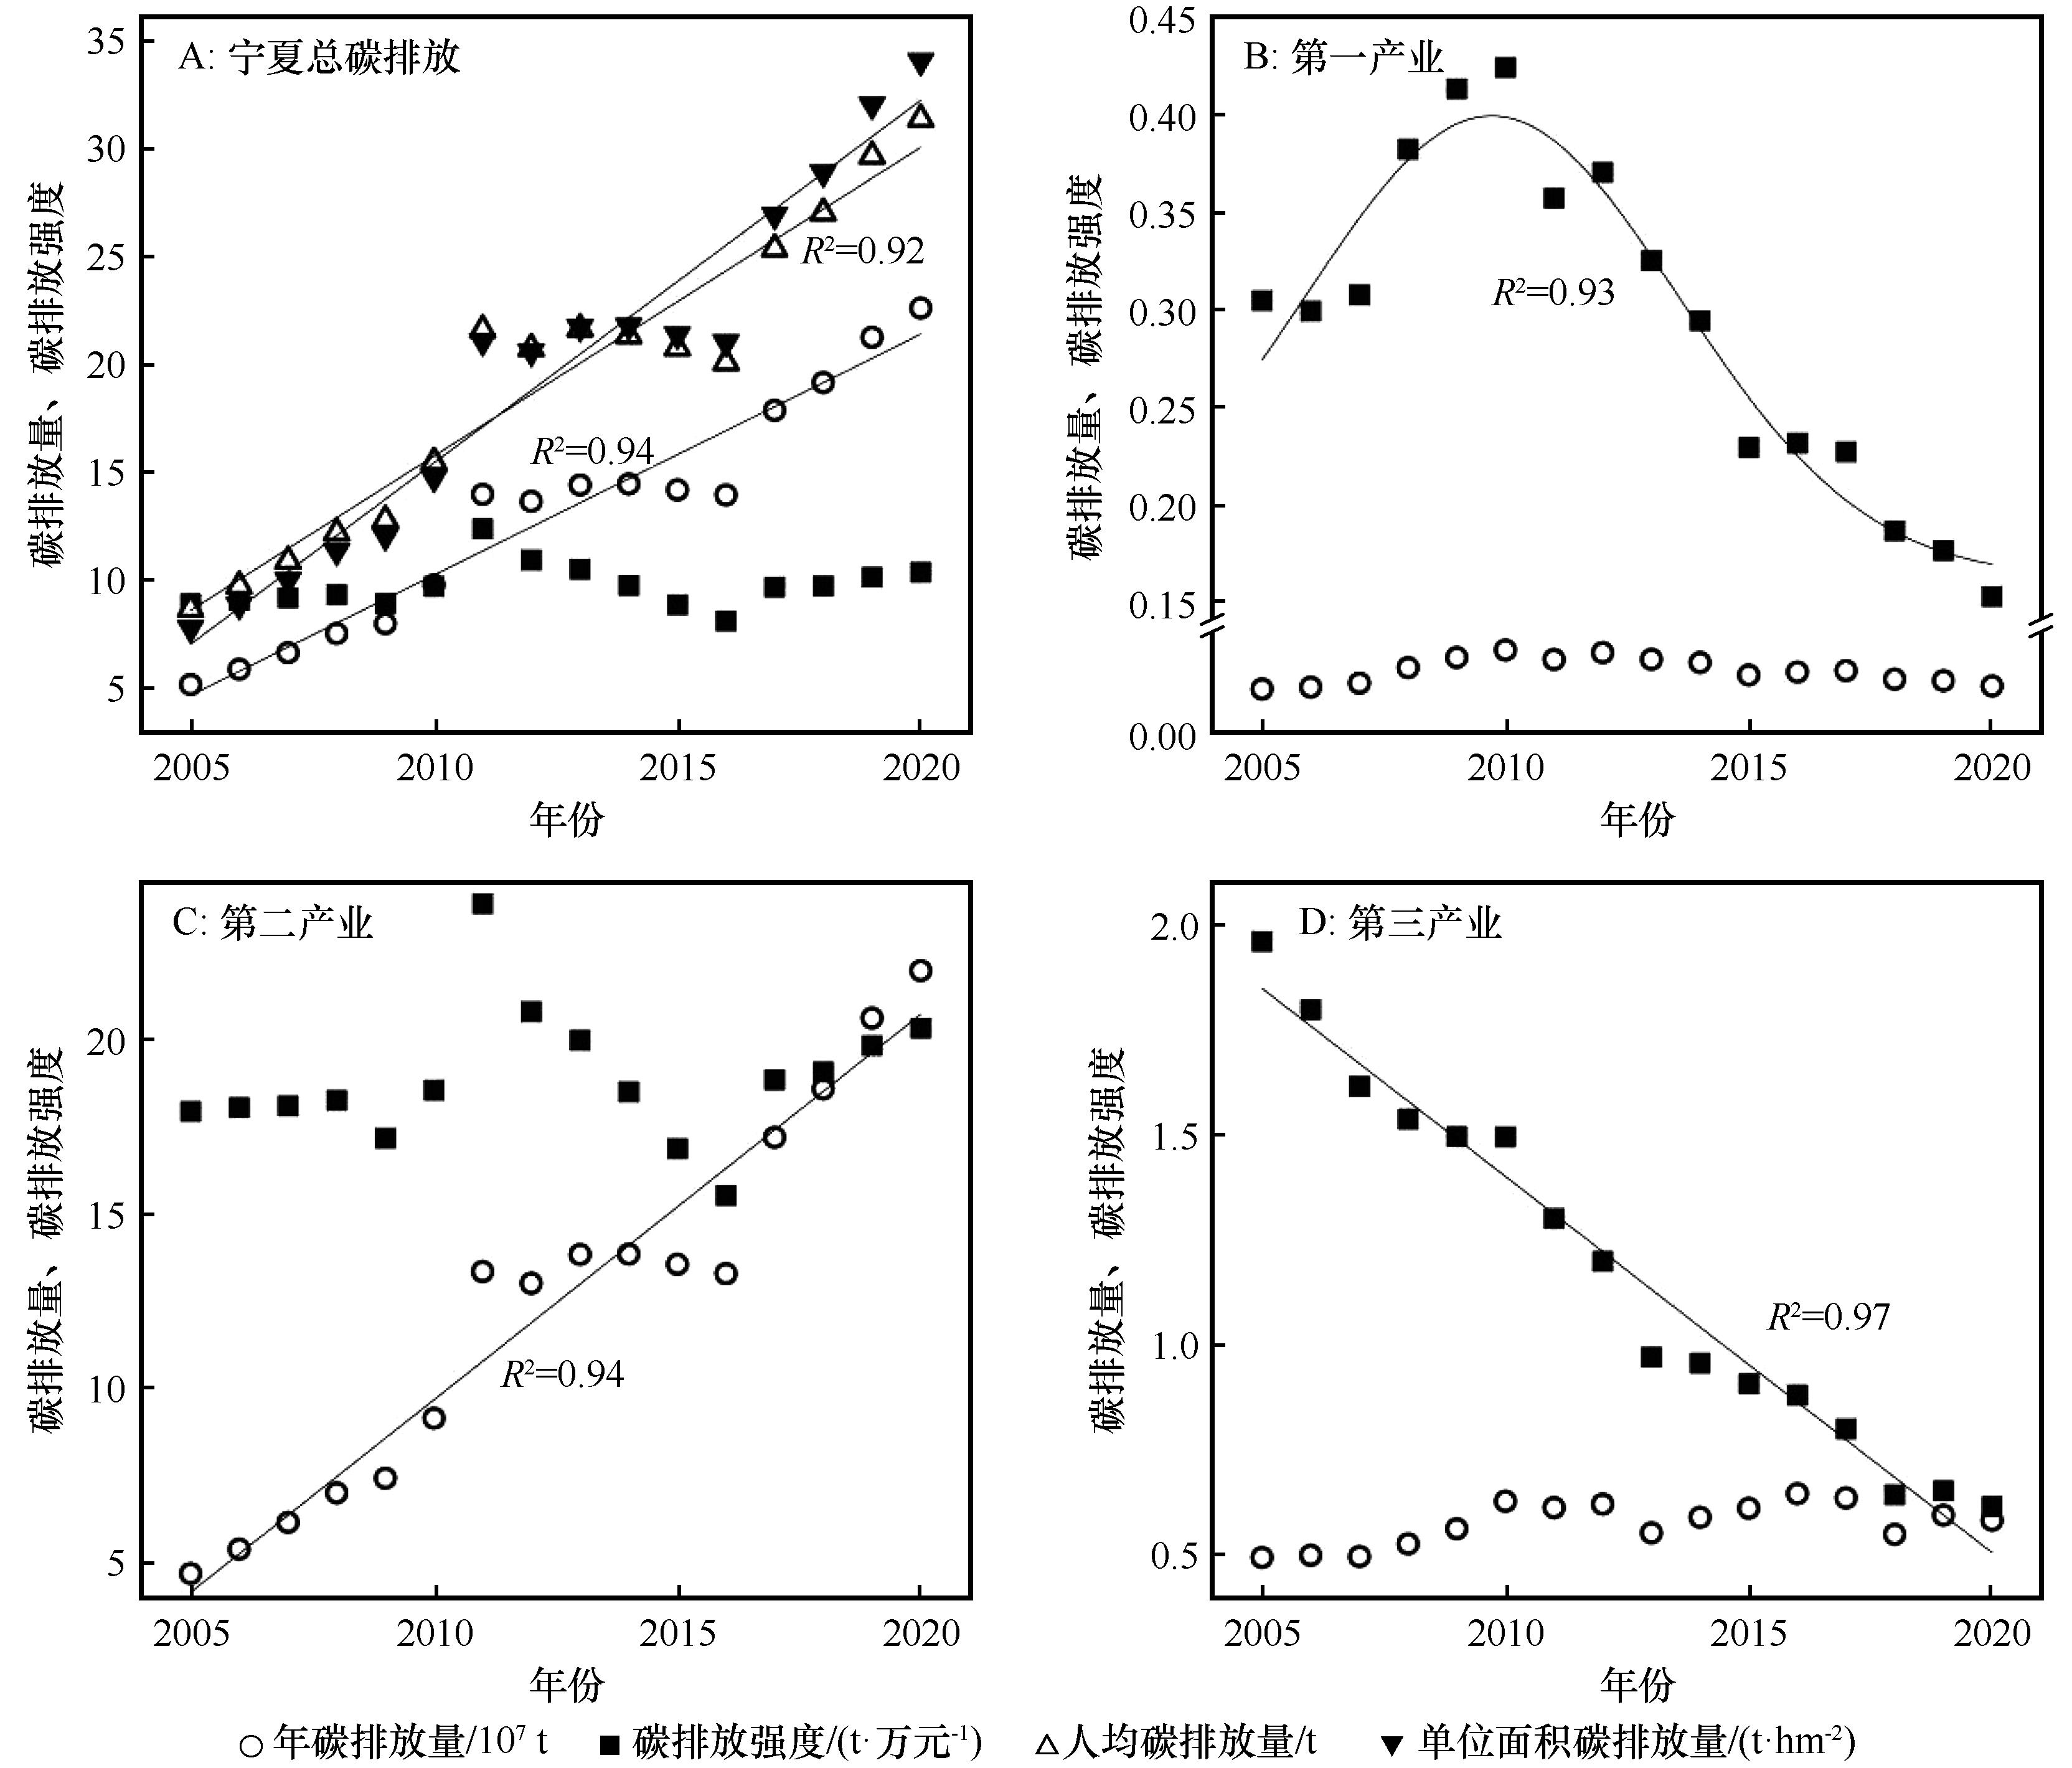
Fig.1 Changes in annual carbon emissions, carbon intensity, carbon emissions per capita, carbon emissions per unit area and carbon emissions by industry in Ningxia from 2005 to 2020
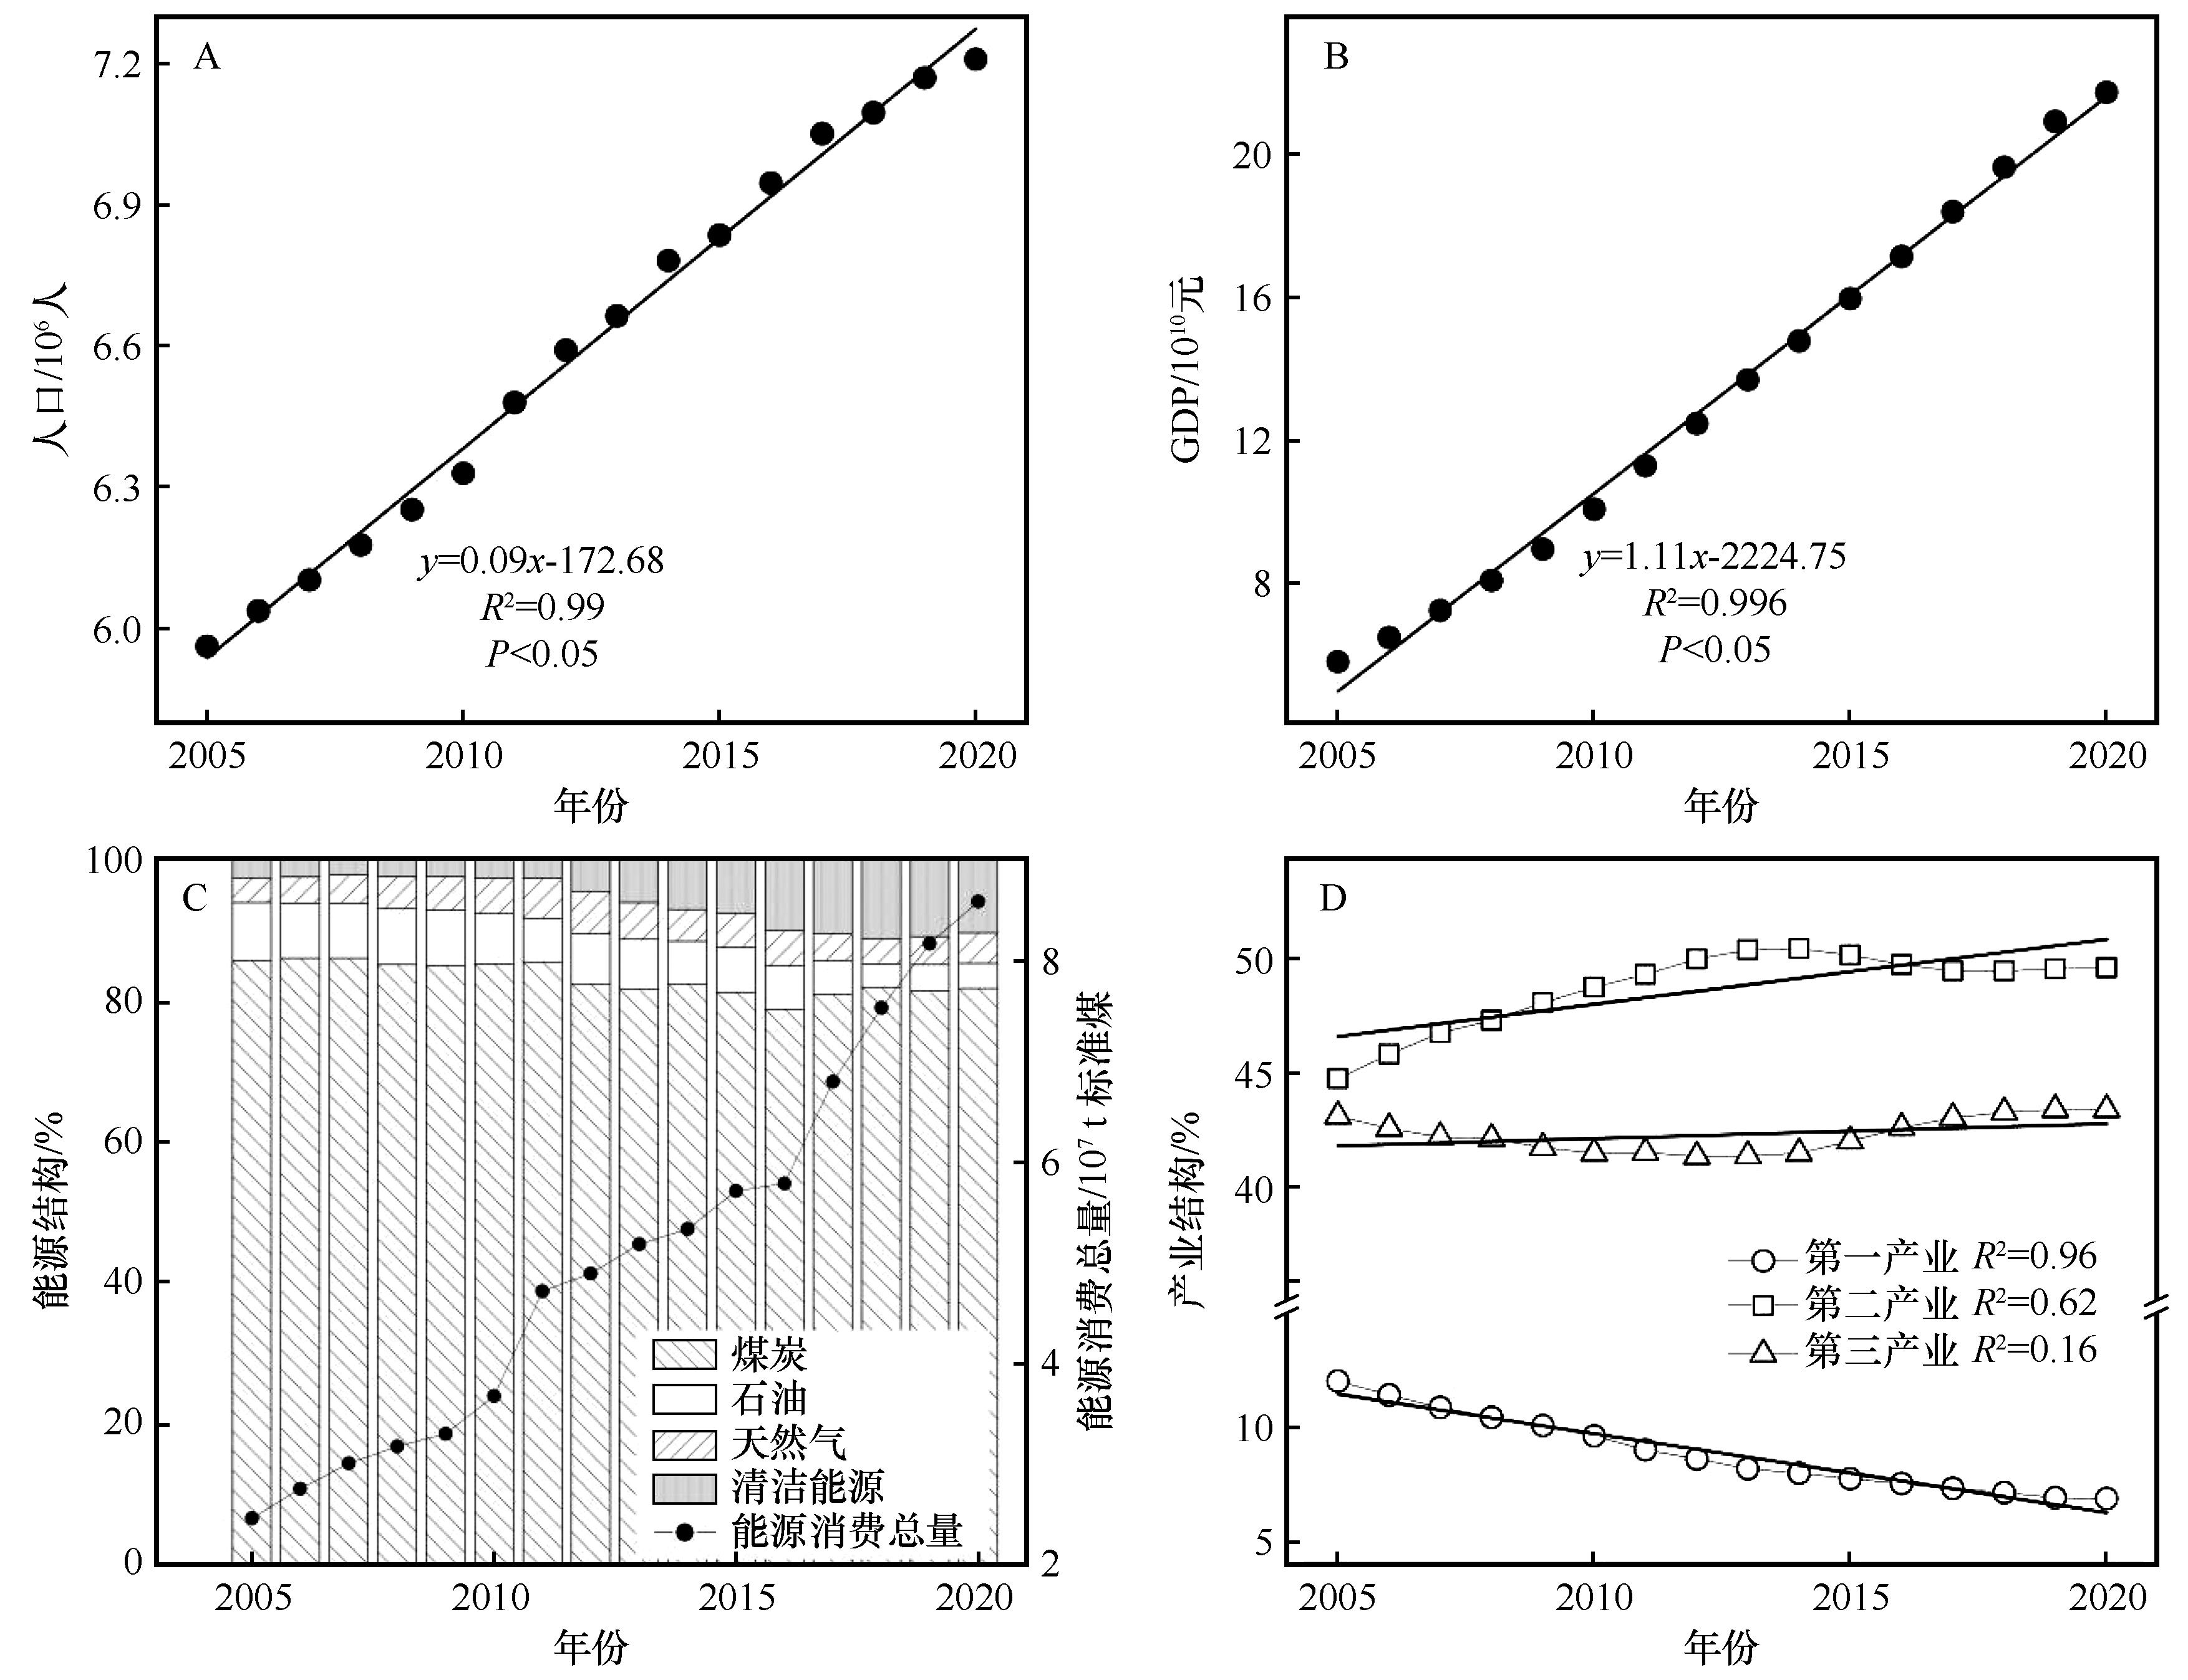
Fig.2 Population, GDP and composition of energy consumption and industrial structure in Ningxia from 2005 to 2020
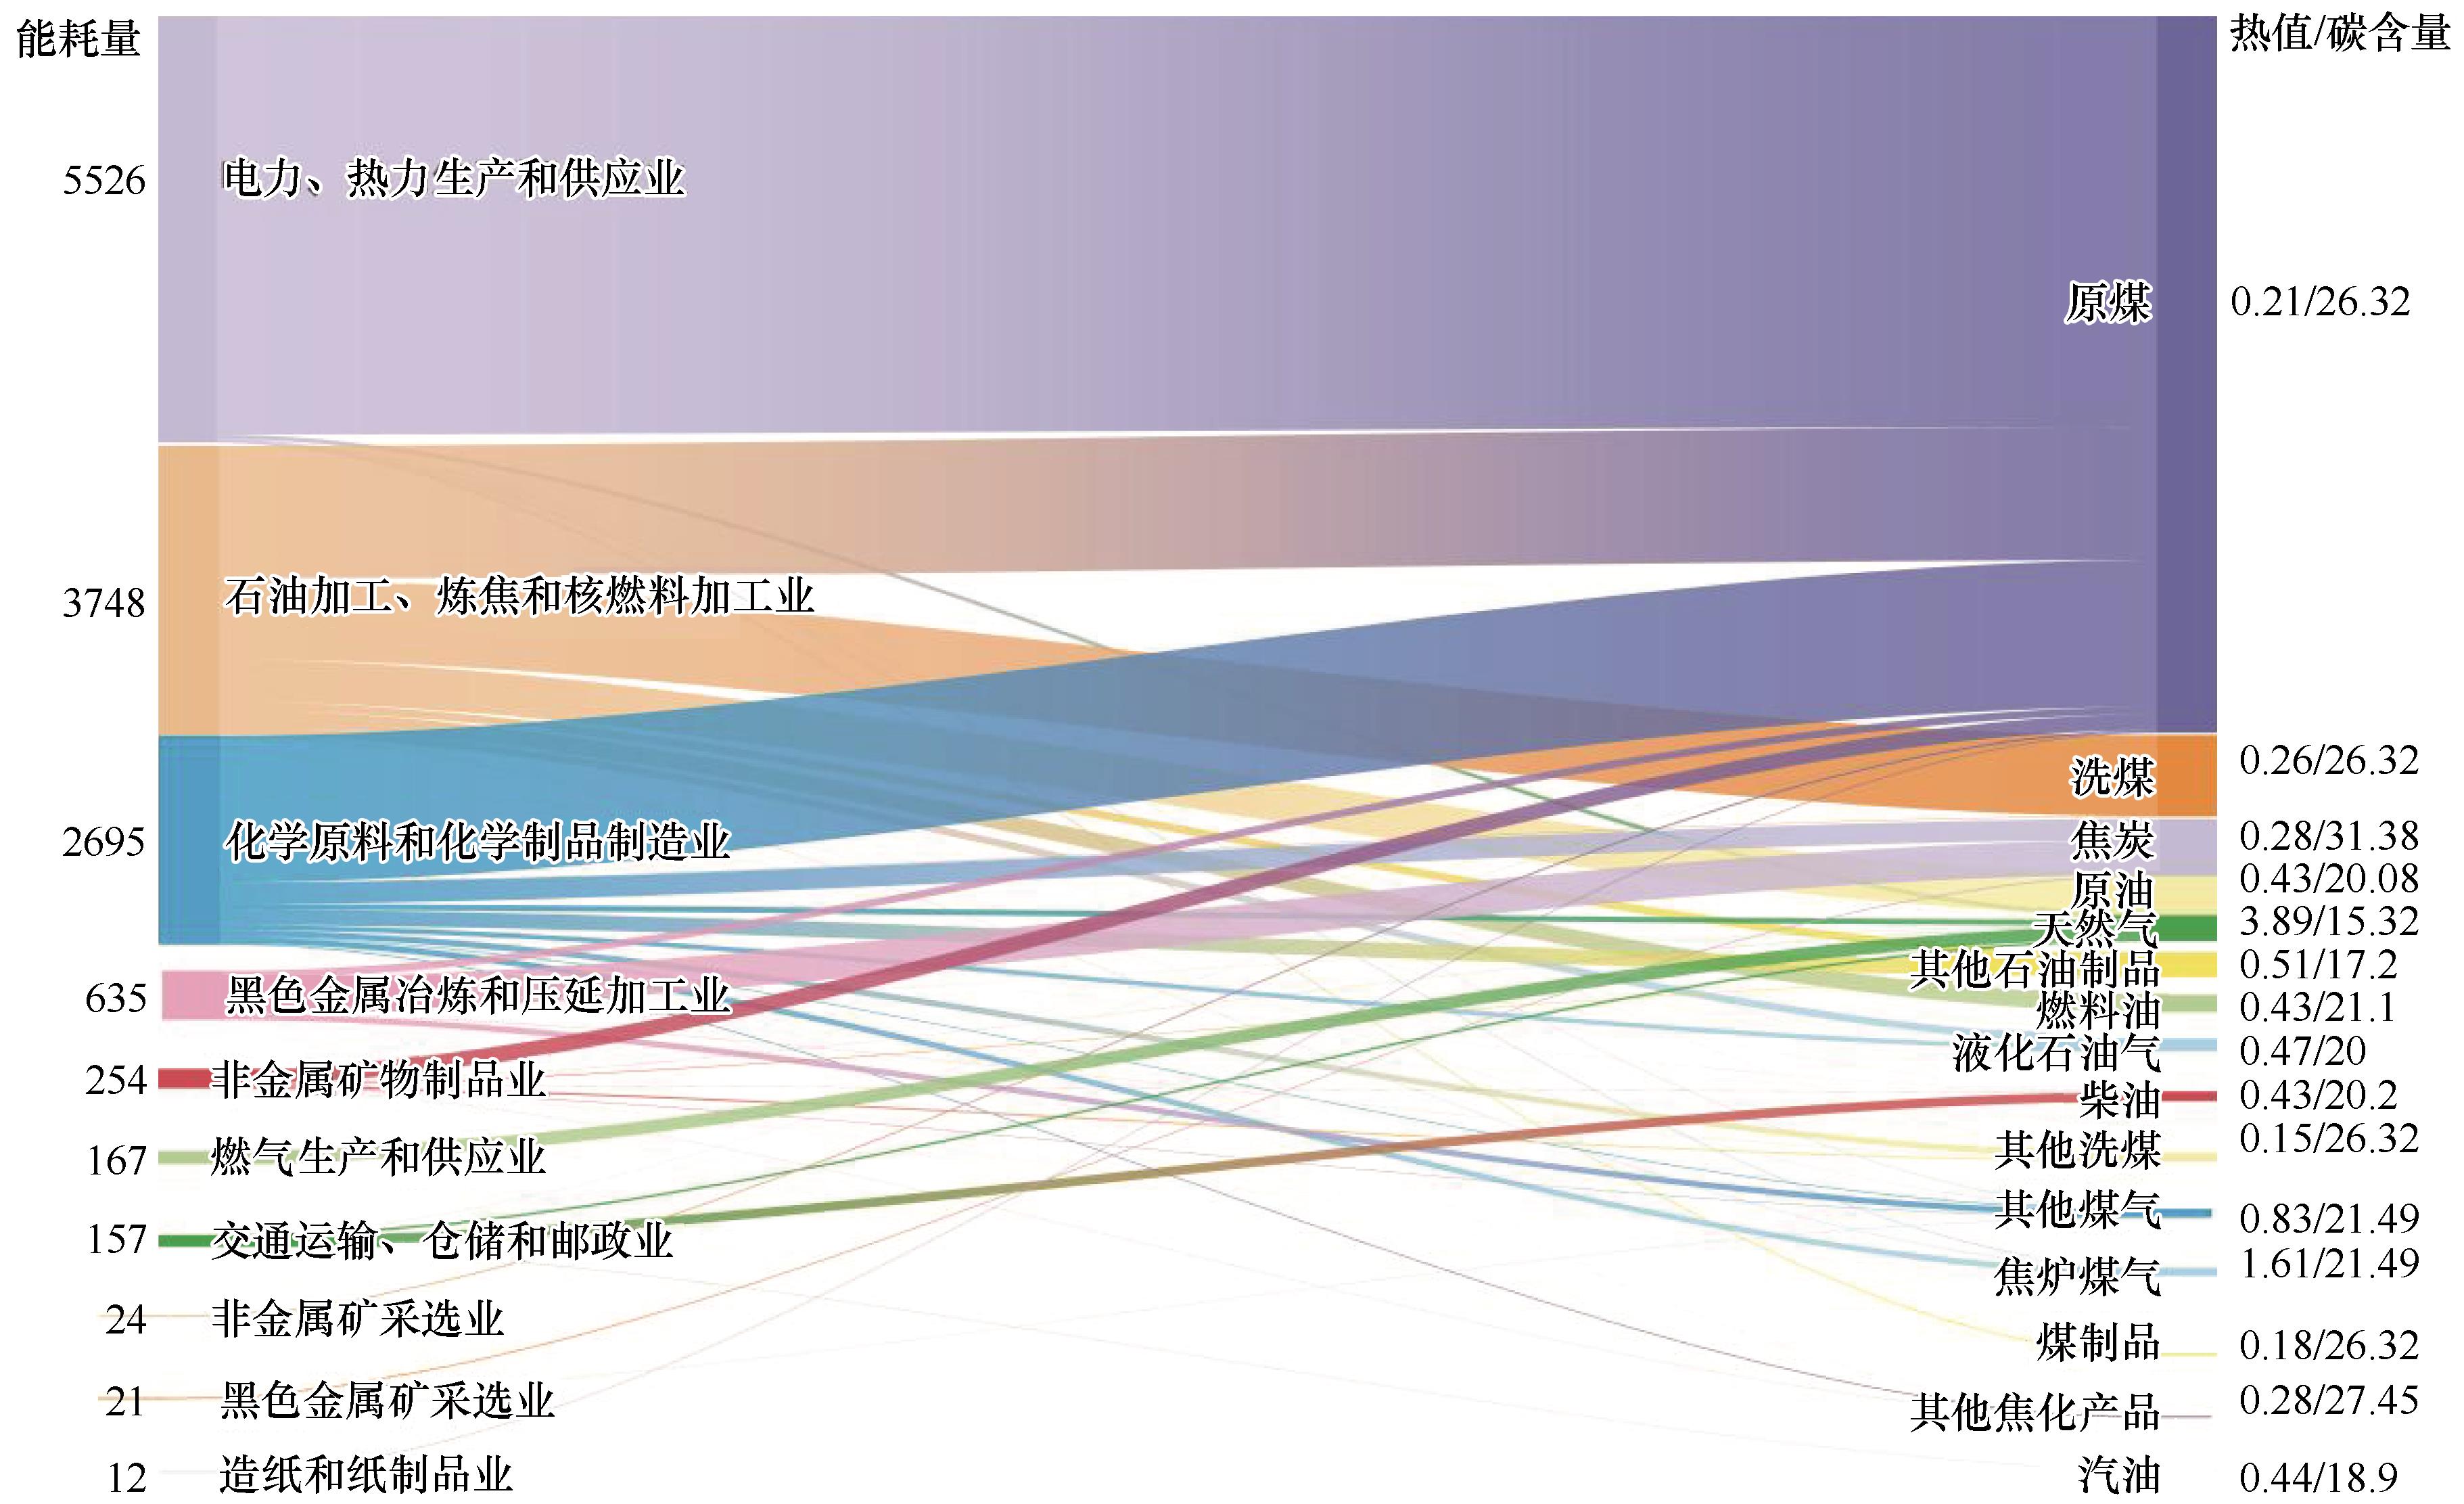
Fig.3 Energy flow diagram of the top 10 high-emission sectors in Ningxia in 2020 (unit: energy consumption, 104 tces; calorific value, PJ·10-4 tonnes, 108 m3; carbon content, tonne C·TJ-1)
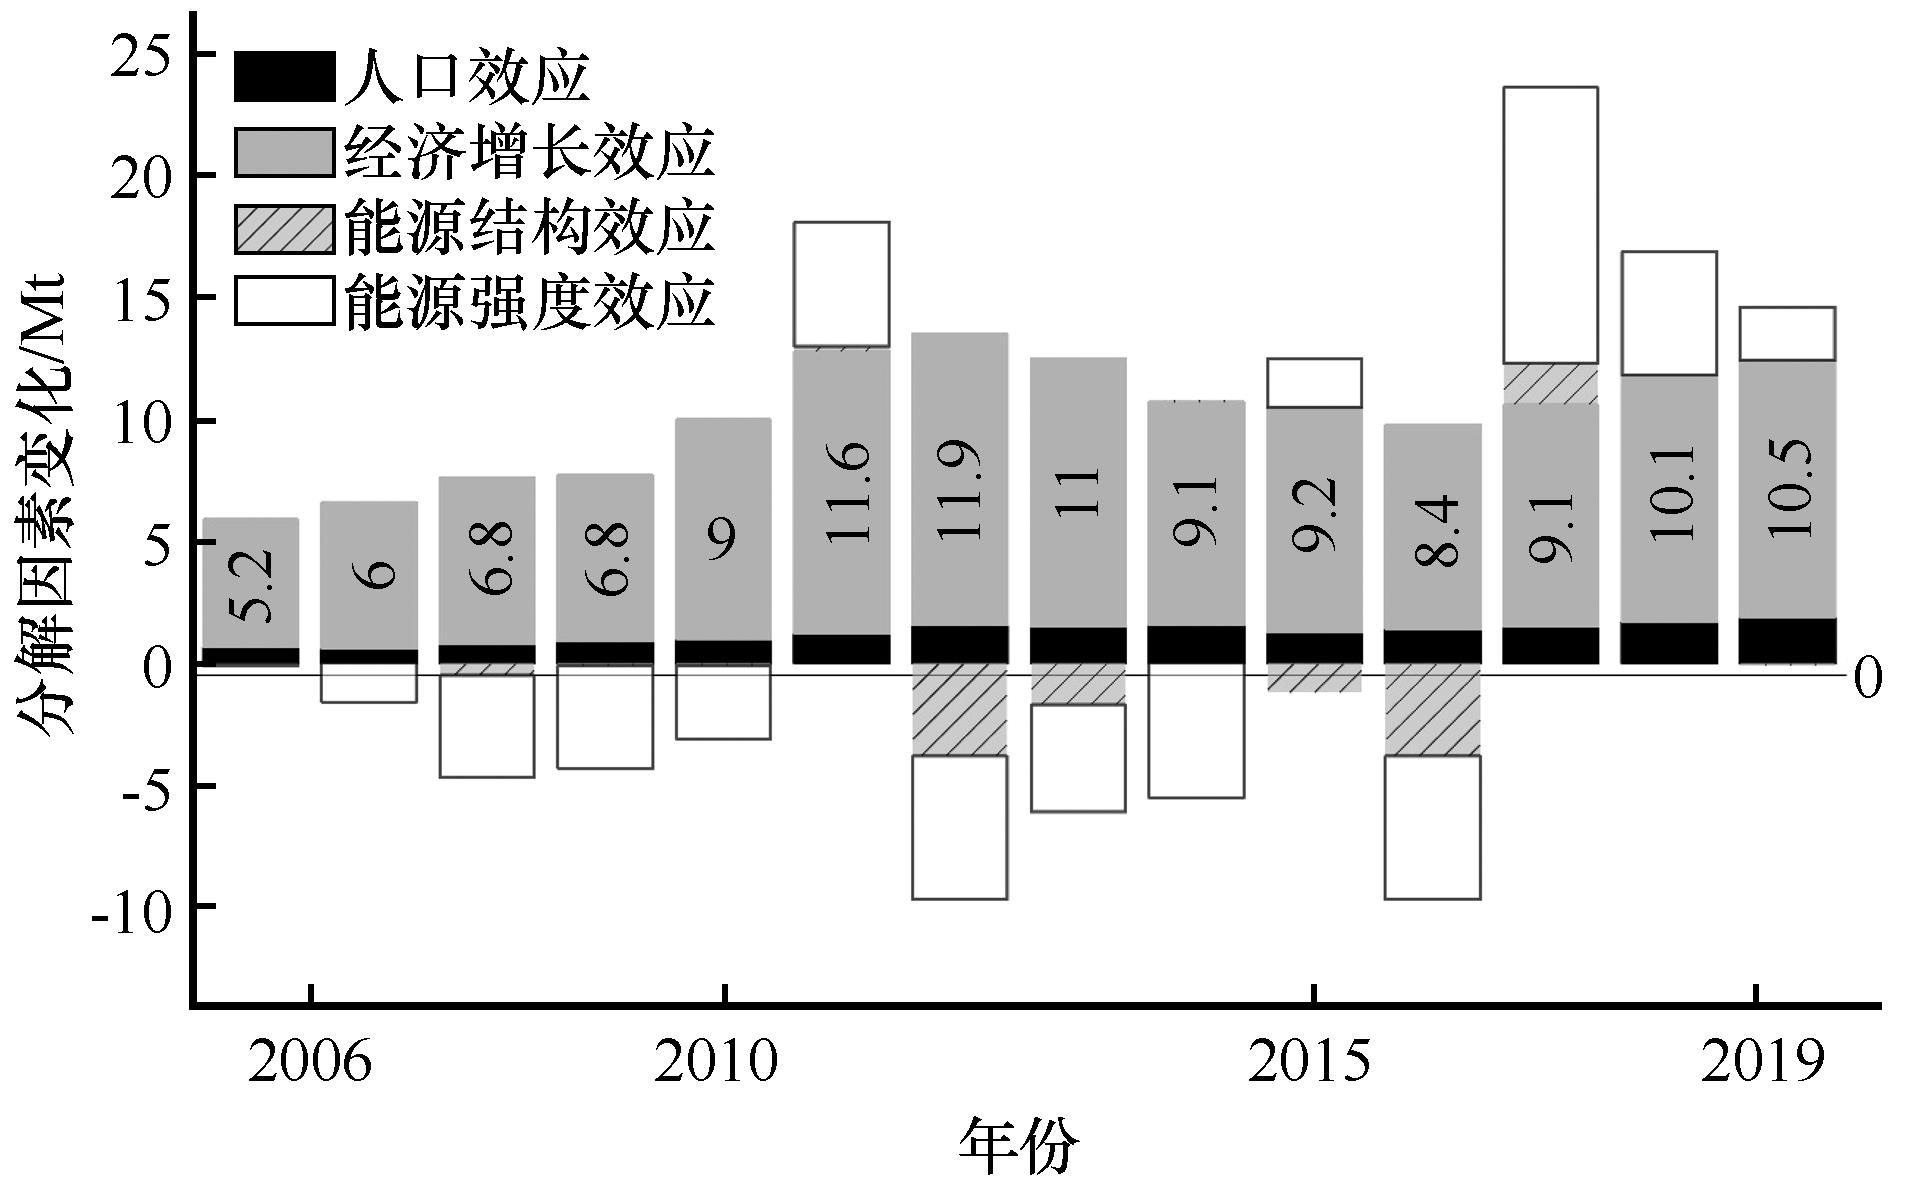
Fig.4 Carbon emission factor decomposition in Ningxia from 2005 to 2020
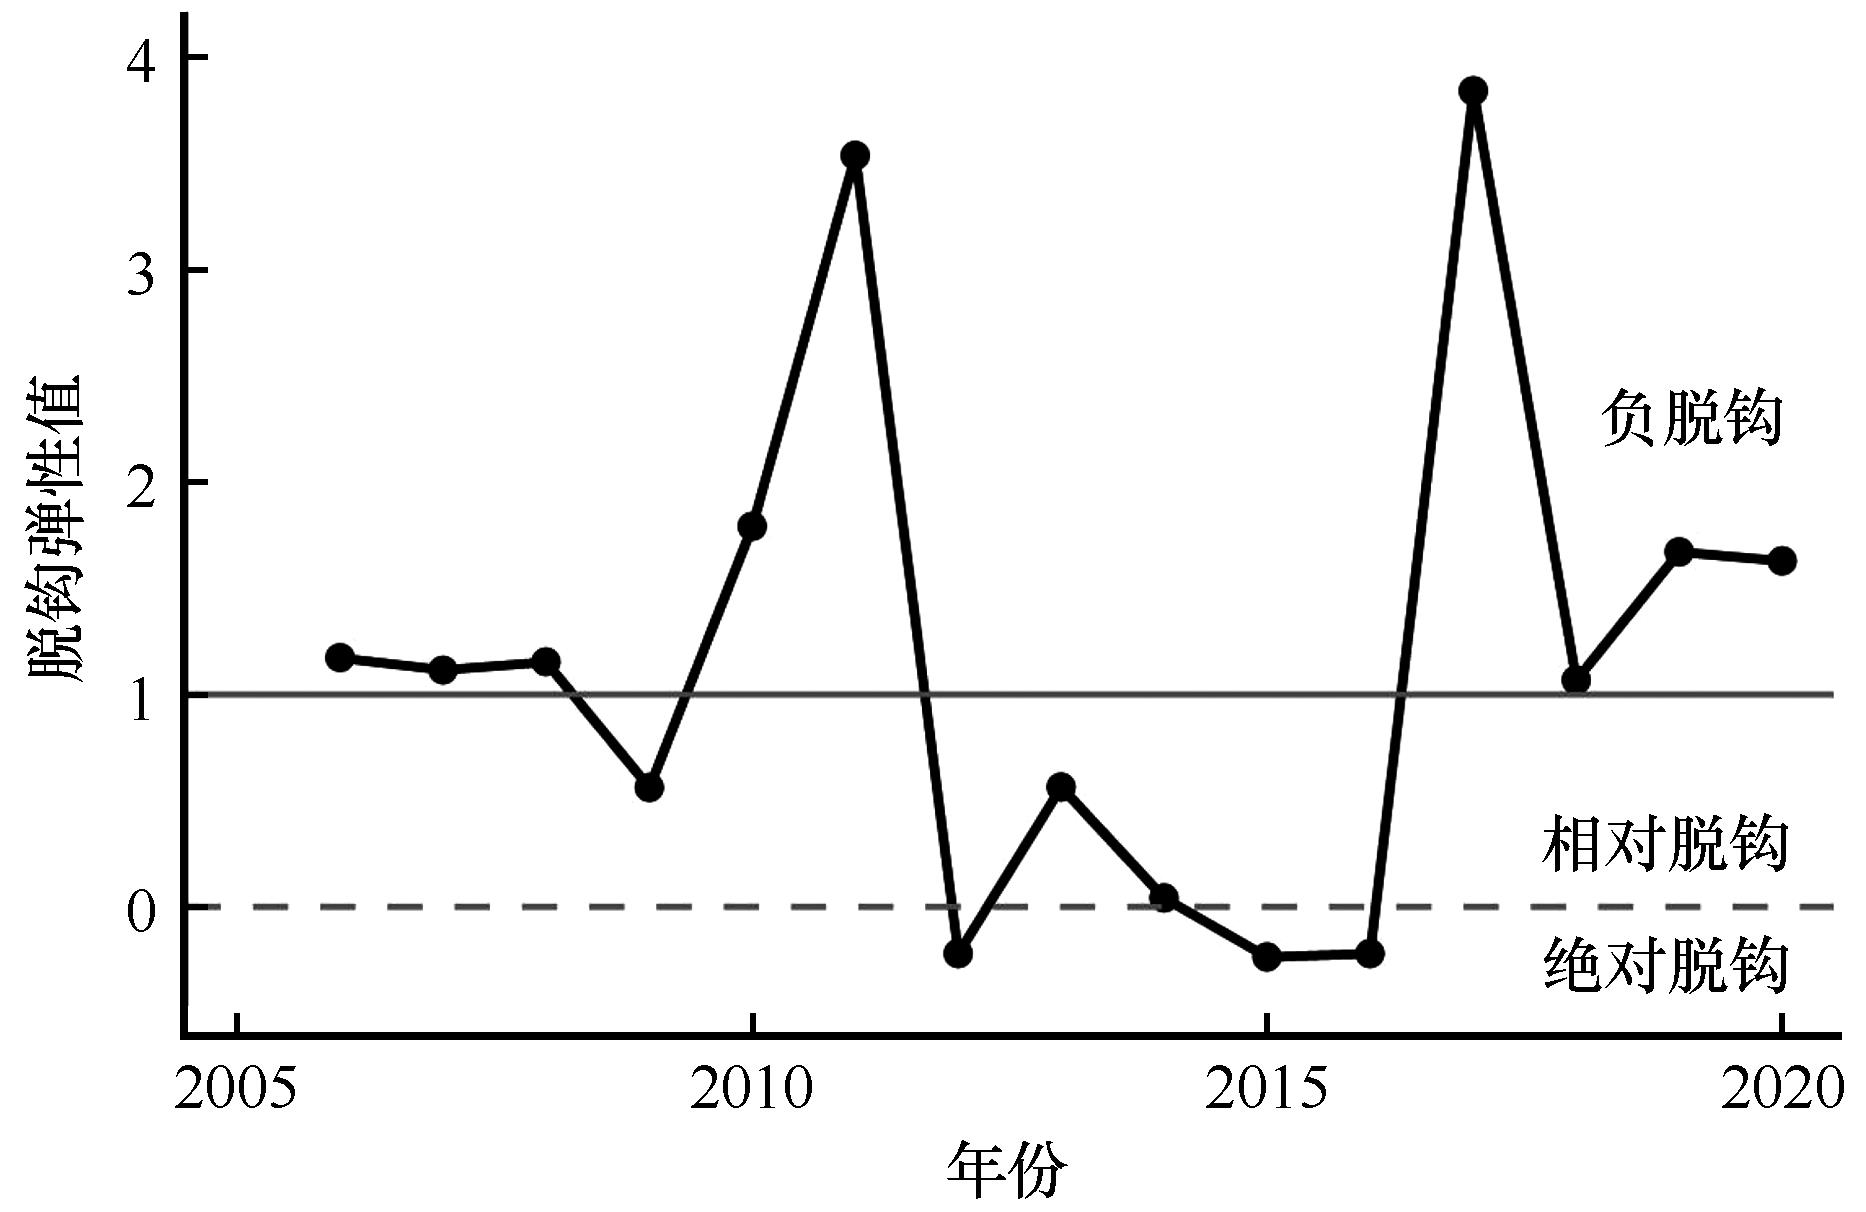
Fig.5 Decoupling of annual carbon emissions from economic growth in Ningxia from 2005 to 2020 (Dashed line: decoupling elasticity value=0, solid line: decoupling elasticity value=1)
| 1 | 习近平.继往开来,开启全球应对气候变化新征程:在气候变化峰会上的讲话[N].人民日报,2020-12-13(002). |
| 2 | Friedlingstein P, O'sullivan M, Jones M W,et al.Global carbon budget 2022[J].Earth System Science Data,2022,14(11):4811-4900. |
| 3 | 李研妮.碳核算的统计范畴、测算方法及指标选择[J].金融纵横,2021,11:29-34. |
| 4 | 张德英,张丽霞.碳源排碳量估算办法研究进展[J].内蒙古林业科技,2005(1):20-23. |
| 5 | 刘竹,耿涌,薛冰,等.城市能源消费碳排放核算方法[J].资源科学,2011,33(7):1325-1330. |
| 6 | 刘明达,蒙吉军,刘碧寒.国内外碳排放核算方法研究进展[J].热带地理,2014,34(2):248-258. |
| 7 | 刘竹,关大博,魏伟.中国二氧化碳排放数据核算[J].中国科学:地球科学,2018,48(7):878-887. |
| 8 | Zhang H, Jin G, Zhang Z.Coupling system of carbon emission and social economy:a review[J].Technological Forecasting and Social Change,2021,167:120730. |
| 9 | Casey G, Galor O.Population growth and carbon emissions[R].National Bureau of Economic Research,2016. |
| 10 | Danish, Ulucak R, Khan S U D.Relationship between energy intensity and CO2 emissions:does economic policy matter?[J].Sustainable Development,2020,28(5):1457-1464. |
| 11 | Liu J, Bai J, Deng Y,et al.Impact of energy structure on carbon emission and economy of China in the scenario of carbon taxation[J].Science of the Total Environment,2021,762:143093. |
| 12 | Cheng Z, Li L, Liu J.Industrial structure,technical progress and carbon intensity in China's provinces[J].Renewable and Sustainable Energy Reviews,2018,81:2935-2946. |
| 13 | 王中英,王礼茂.中国经济增长对碳排放的影响分析[J].安全与环境学报,2006,6(5):88-91. |
| 14 | 彭希哲,朱勤.我国人口态势与消费模式对碳排放的影响分析[J].人口研究,2010,34(1):48-58. |
| 15 | 赵敏,张卫国,俞立中.上海市能源消费碳排放分析[J].环境科学研究,2009,22(8):984-989. |
| 16 | 韩梦瑶,刘卫东,谢漪甜,等.中国省域碳排放的区域差异及脱钩趋势演变[J].资源科学,2021,43(4):710-721. |
| 17 | Guan Y, Shan Y, Huang Q,et al.Assessment to China's Recent Emission Pattern Shifts[J].Earth's Future,2021,9(11):e2021EF002241. |
| 18 | Shan Y, Guan D, Zheng H,et al.China CO2 emission accounts 1997-2015[J].Scientific Data,2018,5(1):170201. |
| 19 | Shan Y, Huang Q, Guan D,et al.China CO2 emission accounts 2016-2017[J].Scientific Data,2020,7(1):54. |
| 20 | Shan Y, Liu J, Liu Z,et al.New provincial CO2 emission inventories in China based on apparent energy consumption data and updated emission factors[J].Applied Energy,2016,184:742-750. |
| 21 | Liu Z, Guan D, Wei W,et al.Reduced carbon emission estimates from fossil fuel combustion and cement production in China[J].Nature,2015,524(7565):335-338. |
| 22 | Eggleston H, Buendia L, Miwa K,et al.2006 IPCC guidelines for national greenhouse gas inventories[C].International Panel on Climate Change,2006. |
| 23 | 王敏,冯相昭,安祺,等.基于脱钩指数和LMDI的青海省绿色低碳发展策略研究[J].气候变化研究进展,2021,17(5):598-607. |
| 24 | Vadén T, Lähde V, Majava A,et al.Decoupling for ecological sustainability:a categorisation and review of research literature [J].Environmental Science & Policy,2020,112:236-244. |
| 25 | 国家统计局. 国民经济行业分类: [S].北京:中国标准出版社,2011. |
| 26 | 马越峰,刘爽.“双碳”背景下内蒙古碳排放情景仿真模拟研究[J].河北环境工程学院学报,2023,33(1):1-7. |
| 27 | 吴茜,陈强强.甘肃省行业碳排放影响因素及脱钩努力研究[J].干旱区地理,2023,46(2):274-283. |
| 28 | 马冬芬,祝学军.新疆碳排放驱动因素与减排策略分析[J].煤炭经济研究,2022,42(12):25-31. |
| 29 | 秦旭阳,吴丽丽.湖北省碳排放现状深度解析及减碳途径研究[J].工业安全与环保,2021,47():53-57. |
| 30 | 候勃,岳文泽,王腾飞.中国大都市区碳排放时空异质性探测与影响因素:以上海市为例[J]. 经济地理,2020,40(9):82-90. |
| 31 | 水木.神华宁煤集团煤制油化工智能制造简介[J].通用机械,2018(6):22-25. |
| 32 | 舒印彪,张丽英,张运洲,等.我国电力碳达峰、碳中和路径研究[J].中国工程科学,2021,23(6):1-14. |
| 33 | 李晓易,谭晓雨,吴睿,等.交通运输领域碳达峰、碳中和路径研究[J].中国工程科学,2021,23(6):15-21. |
| [1] | Fangmiao Chen, Huiping Huang, Guang Yang, Xu Li. Research on the dynamic change of the ecological environment and its influencing factors in the Yellow River Basin based on Remote Sensing Ecological Index [J]. Journal of Desert Research, 2023, 43(4): 252-262. |
| [2] | Yushuo Zhang, Xuerui Shen, Renjing Sui, Jie Bao, Zhonglei Yu, Lin Zhao, Xuebin Zhang. Multi-scale analysis of spatial pattern and the influencing factors of A-grade scenic spots in the Yellow River Basin [J]. Journal of Desert Research, 2022, 42(6): 103-115. |
| [3] | Weicheng Luo, Wenzhi Zhao, Jiliang Liu, Jingyi Yang, Xuelian Bai, Lemin Wei, Yilin Feng. Distribution pattern and influencing factors of ground arthropods in coalmines restoration area of Qilian Mountain Nature Reserve, China [J]. Journal of Desert Research, 2022, 42(6): 165-175. |
| [4] | Yang Liu, Ya Wang, Lihua Zhou. Performance evaluation of ecological migration project based on process and outcome: a case study of Huanghuatan migration area in Gulang, Gansu, China [J]. Journal of Desert Research, 2022, 42(6): 185-193. |
| [5] | Wen Zhang, Dingding Du, Zhiwen Li, Wangyang Wu, Xiangjie Li, Yonghui Bai. Grain size characteristics of sediments in sandy land around the Poyang Lake and its influencing factors [J]. Journal of Desert Research, 2022, 42(5): 122-132. |
| [6] | Qianqian Wu, Xiao Zhang, Shuxing Xu, Xiaohui Yang, Yanshu Liu, Hanzhi Li, Zhongjie Shi. Climatic responses of NDVI and tree growth in the arid areas of inland Asia and their influencing factors [J]. Journal of Desert Research, 2022, 42(4): 1-10. |
| [7] | Lei Kang, Zhaoping Yang, Fang Han. Analysis of structural characteristics and spatial distribution of the intangible cultural heritage in Xinjiang and its influencing factor [J]. Journal of Desert Research, 2022, 42(1): 158-166. |
| [8] | Cheng Zhou, Binghua Liu, Xuhong Zhang, Juan Tian, Lin Zhou. Spatial distribution characteristics and influencing factors of heritage conservation units in the Yellow River Basin [J]. Journal of Desert Research, 2021, 41(6): 10-20. |
| [9] | Zhiwei Ding, Rui Zhao, Zihan Jian, Yiwei Meng, Gaisu Zhang. Economics spatial pattern and its influencing factors of Yellow River Basin at town scale from the perspective of urban-rural integration [J]. Journal of Desert Research, 2021, 41(6): 195-204. |
| [10] | Lizhu Xing, Fangmin Zhang, Kaicheng Xing, Yunpeng Li, Qi Lu, Feifei Lu. Change of soil wind erosion and attribution in Bayannur, Inner Mongolia based on the Revised Wind Erosion Equation [J]. Journal of Desert Research, 2021, 41(5): 111-119. |
| [11] | Longqiang Zhu, Xiaoyun Wang, Jiamin Liu, Yaowen Xie. Distribution and natural environment background of sites in Hexi region,Gansu,China [J]. Journal of Desert Research, 2021, 41(4): 121-128. |
| [12] | Gaopeng Sun, Xianfeng Liu, Xiaohong Wang, Shuangshuang Li. Changes in vegetation coverage and its influencing factors across the Yellow River Basin during 2001-2020 [J]. Journal of Desert Research, 2021, 41(4): 205-212. |
| [13] | Lichao Zhuang, Naiang Wang, Xunhe Zhang, Liqiang Zhao, Xianbao Su. Analysis on the difference of the spatial model of lake ice freezing and melting in the Badain Jaran Desert [J]. Journal of Desert Research, 2021, 41(3): 214-223. |
| [14] | Jun Lei, Xiaohu Yang, Hongmei Liu, Yuhong Zhao, Juping Fan, Caixia Guo. The characteristics of desert vegetation biomass and its influencing factors in the middle reaches of the Heihe River [J]. Journal of Desert Research, 2021, 41(1): 203-208. |
| [15] | Ying Dong, Zhong Hua, Zhixiang Lu, Baorong Xu, Songbing Zou. Cluster analysis of prefecture-level cities in Gansu Province for low carbon transformation [J]. Journal of Desert Research, 2020, 40(5): 25-31. |
| Viewed | ||||||
|
Full text |
|
|||||
|
Abstract |
|
|||||
©2018Journal of Desert Research
Tel:0931-8267545
Email:caiedit@lzb.ac.cn;desert@lzb.ac.cn
Support:Magtech