
- CN 62-1070/P
- ISSN 1000-694X
- Bimonthly 1981
Journal of Desert Research ›› 2025, Vol. 45 ›› Issue (5): 78-91.DOI: 10.7522/j.issn.1000-694X.2025.00030
Previous Articles Next Articles
Dehua Xu1( ), Qiang Liu2,3, Duan Li1, Jiyan Li1()
Received:2025-01-20
Revised:2025-03-22
Online:2025-09-20
Published:2025-09-27
Contact:
Jiyan Li
CLC Number:
Dehua Xu, Qiang Liu, Duan Li, Jiyan Li. Changes and driving forces of NDVI in the Lvliang Mountain area from 1986 to 2023[J]. Journal of Desert Research, 2025, 45(5): 78-91.
Add to citation manager EndNote|Ris|BibTeX
URL: http://www.desert.ac.cn/EN/10.7522/j.issn.1000-694X.2025.00030
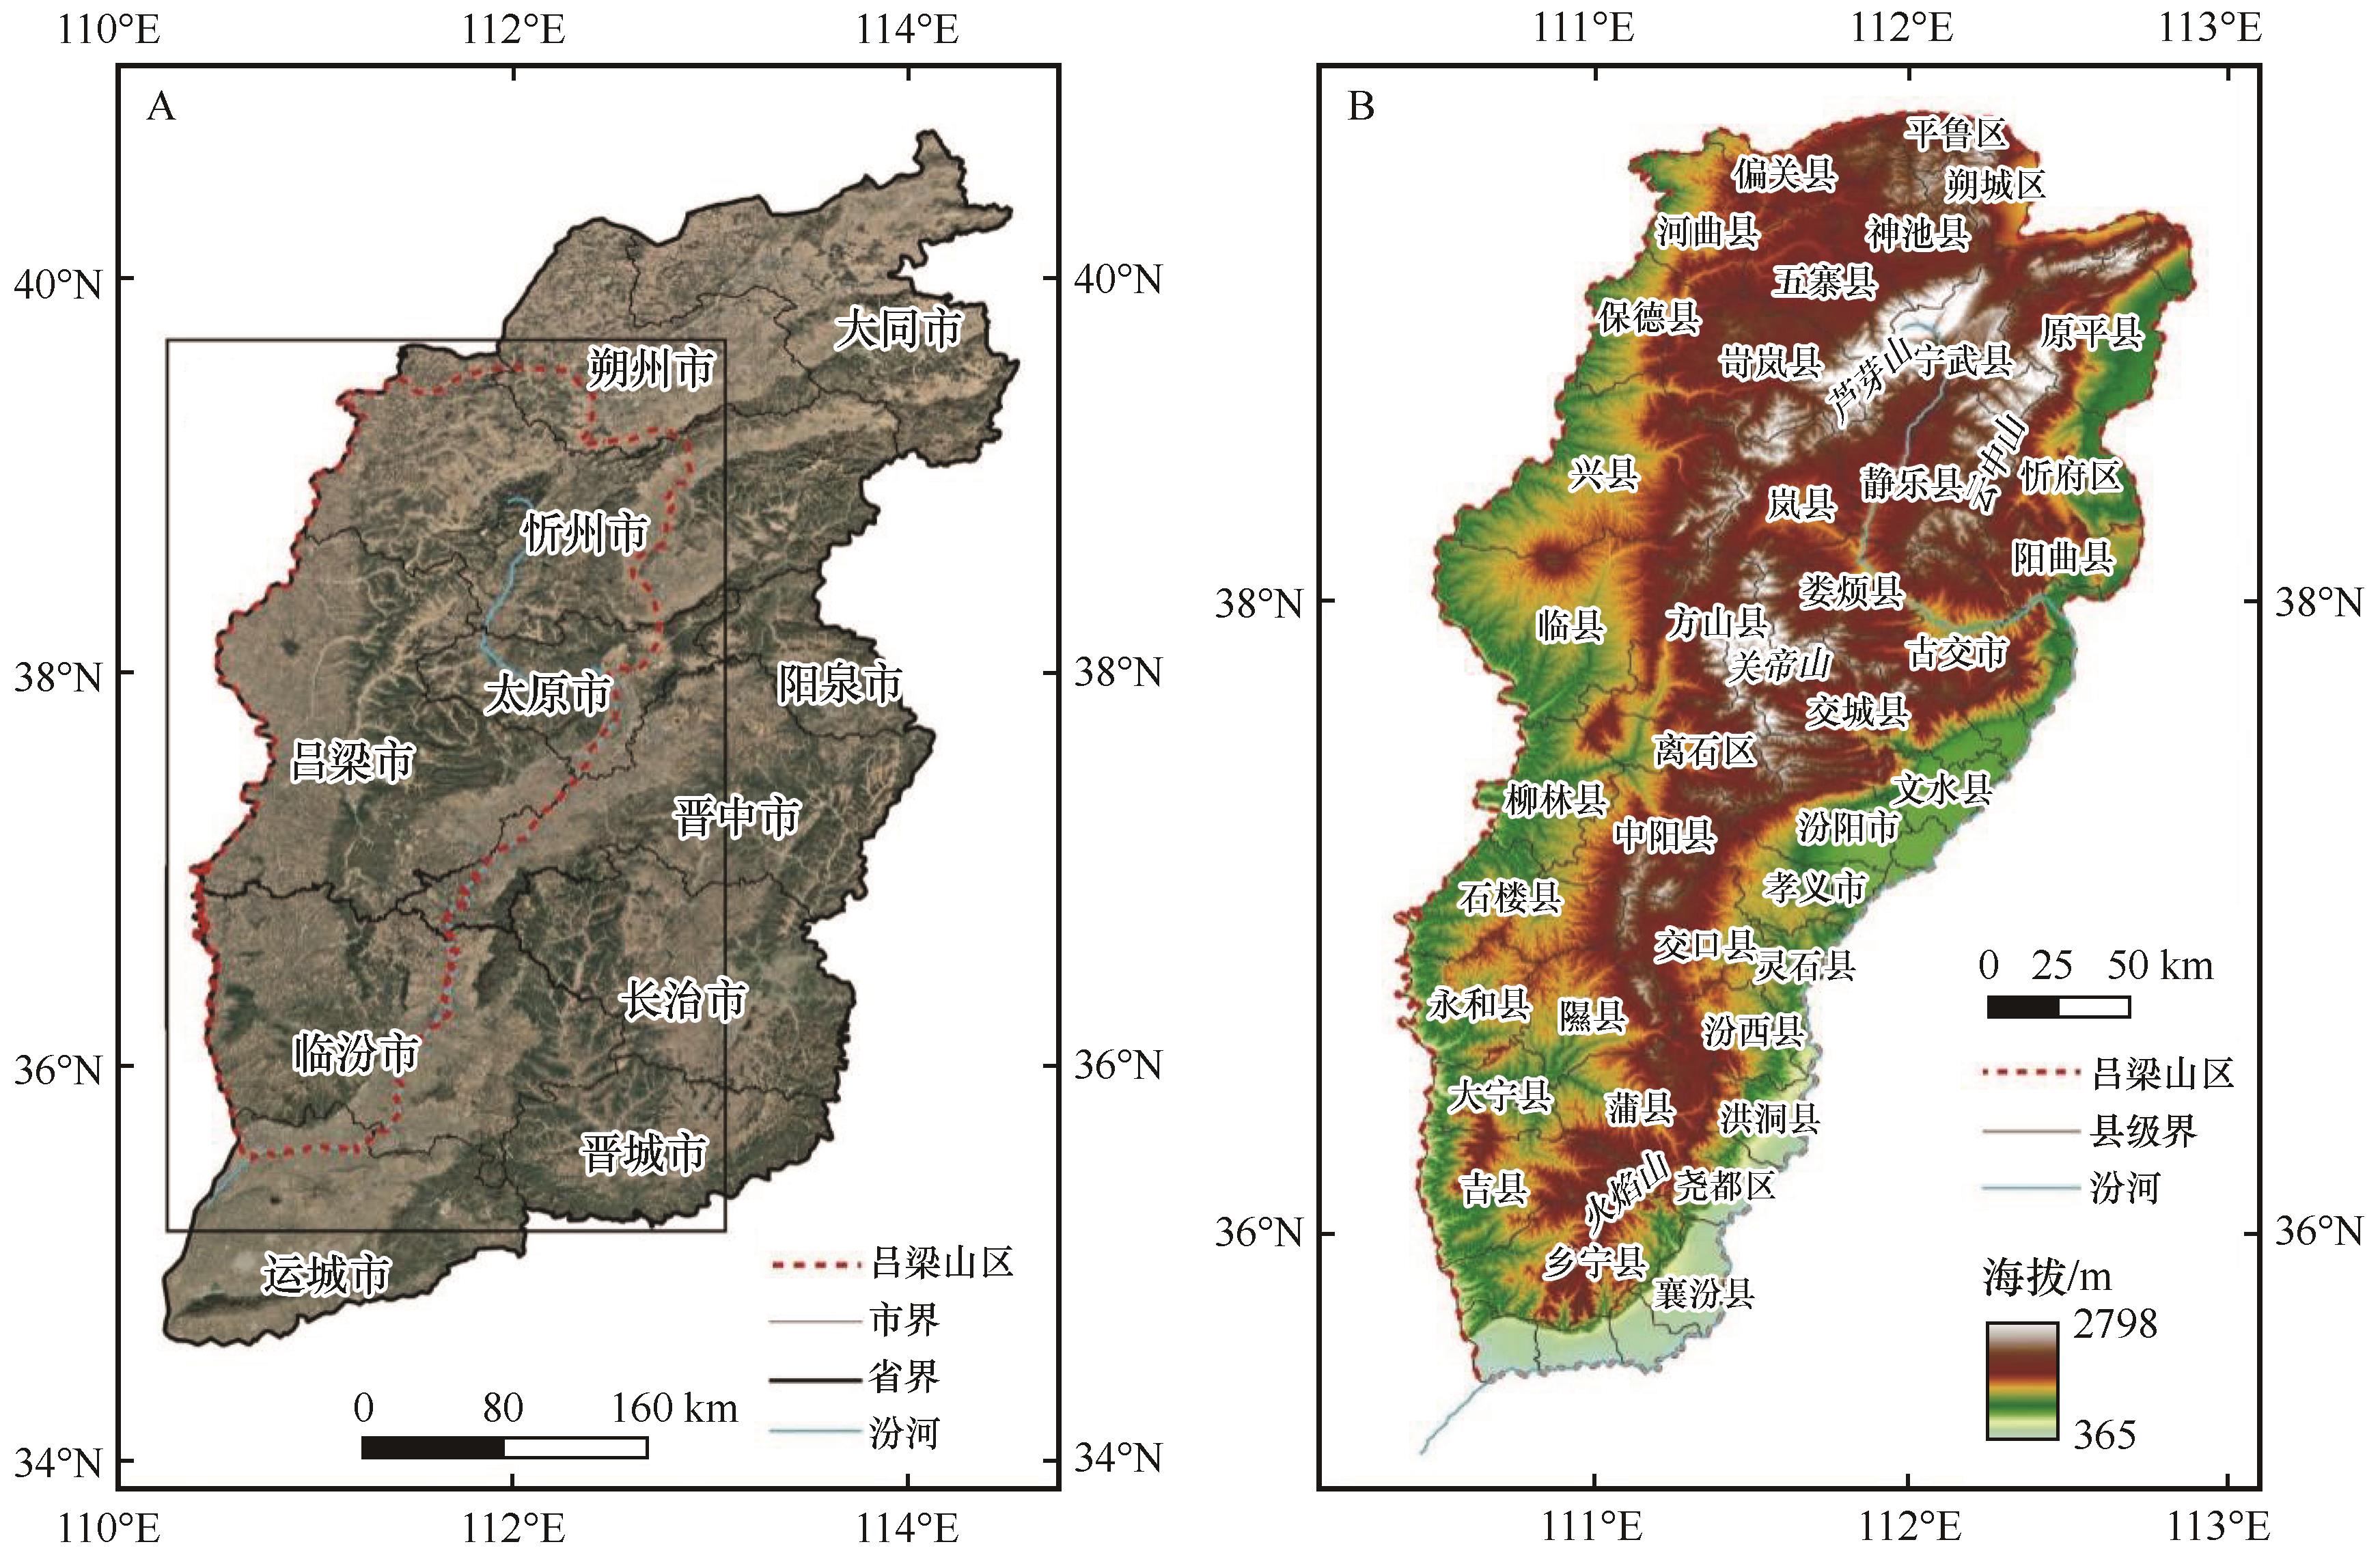
Fig.1 Satellite image of Shanxi Province (A) and topographic features of the Lvliang Mountain area (B,DEM data is downloaded from the Geospatial Data Cloud (http://www.gscloud.cn), and the DEM data type is SRTMDEMUTM with a resolution of 90 m)
| 驱动因子 | 类型 | 分辨率 | 时间范围 | 数据集名称 | 数据来源 |
|---|---|---|---|---|---|
| 气候因子 | 年均风速 | 0.042° | 1986—2023年 | TerraClimate[ | https://www.climatologylab.org/ |
| 年均土壤温度(0~10 cm) | 0.1° | 1986—2023年 | FLDAS[ | https://disc.gsfc.nasa.gov/ | |
| 年均土壤湿度(0~10 cm) | 0.1° | 1986—2023年 | |||
| 干燥度 | 0.008° | 1986—2023年 | 1901—2023年中国1 km分辨率逐年干燥度数据集[ | https://www.geodata.cn/main/ | |
| 年实际蒸发量 | 0.100° | 1986—2023年 | GLEAM4[ | https://www.gleam.eu/ | |
| 年均气温 | 0.008° | 1986—2023年 | 中国1 km分辨率年平均气温数据(1901—2023年)[ | https://www.geodata.cn/main/ | |
| 年降水量 | 0.008° | 1986—2023年 | 中国1 km分辨率年降水量数据(1901—2023年)[ | https://www.geodata.cn/main/ | |
| 地貌因子 | 高程 | 30 m | — | ASTER GDEM 30 M分辨率数字高程数据[ | https://www.gscloud.cn/ |
| 坡度 | 30 m | — | https://www.gscloud.cn/ | ||
| 人为因子 | 夜间灯光指数 | 0.008° | 1986—2020年 | 中国长时间序列逐年人造夜间灯光数据集(1984—2020)[ | https://data.tpdc.ac.cn/home |
| 1 km | 2021—2023年 | An improved time-series DMSP-OLS-like data (1992-2019) in China by integrating DMSP-OLS and SNPP-VIIRS[ | https://dataverse.harvard.edu/ | ||
| 其他 | 土地利用 | 30 m | 1990—2023年 | The 30 m annual land cover datasets and its dynamics in China from 1985 to 2022[ | https://zenodo.org/ |
Table 1 Information about the relative grids of driving factors
| 驱动因子 | 类型 | 分辨率 | 时间范围 | 数据集名称 | 数据来源 |
|---|---|---|---|---|---|
| 气候因子 | 年均风速 | 0.042° | 1986—2023年 | TerraClimate[ | https://www.climatologylab.org/ |
| 年均土壤温度(0~10 cm) | 0.1° | 1986—2023年 | FLDAS[ | https://disc.gsfc.nasa.gov/ | |
| 年均土壤湿度(0~10 cm) | 0.1° | 1986—2023年 | |||
| 干燥度 | 0.008° | 1986—2023年 | 1901—2023年中国1 km分辨率逐年干燥度数据集[ | https://www.geodata.cn/main/ | |
| 年实际蒸发量 | 0.100° | 1986—2023年 | GLEAM4[ | https://www.gleam.eu/ | |
| 年均气温 | 0.008° | 1986—2023年 | 中国1 km分辨率年平均气温数据(1901—2023年)[ | https://www.geodata.cn/main/ | |
| 年降水量 | 0.008° | 1986—2023年 | 中国1 km分辨率年降水量数据(1901—2023年)[ | https://www.geodata.cn/main/ | |
| 地貌因子 | 高程 | 30 m | — | ASTER GDEM 30 M分辨率数字高程数据[ | https://www.gscloud.cn/ |
| 坡度 | 30 m | — | https://www.gscloud.cn/ | ||
| 人为因子 | 夜间灯光指数 | 0.008° | 1986—2020年 | 中国长时间序列逐年人造夜间灯光数据集(1984—2020)[ | https://data.tpdc.ac.cn/home |
| 1 km | 2021—2023年 | An improved time-series DMSP-OLS-like data (1992-2019) in China by integrating DMSP-OLS and SNPP-VIIRS[ | https://dataverse.harvard.edu/ | ||
| 其他 | 土地利用 | 30 m | 1990—2023年 | The 30 m annual land cover datasets and its dynamics in China from 1985 to 2022[ | https://zenodo.org/ |
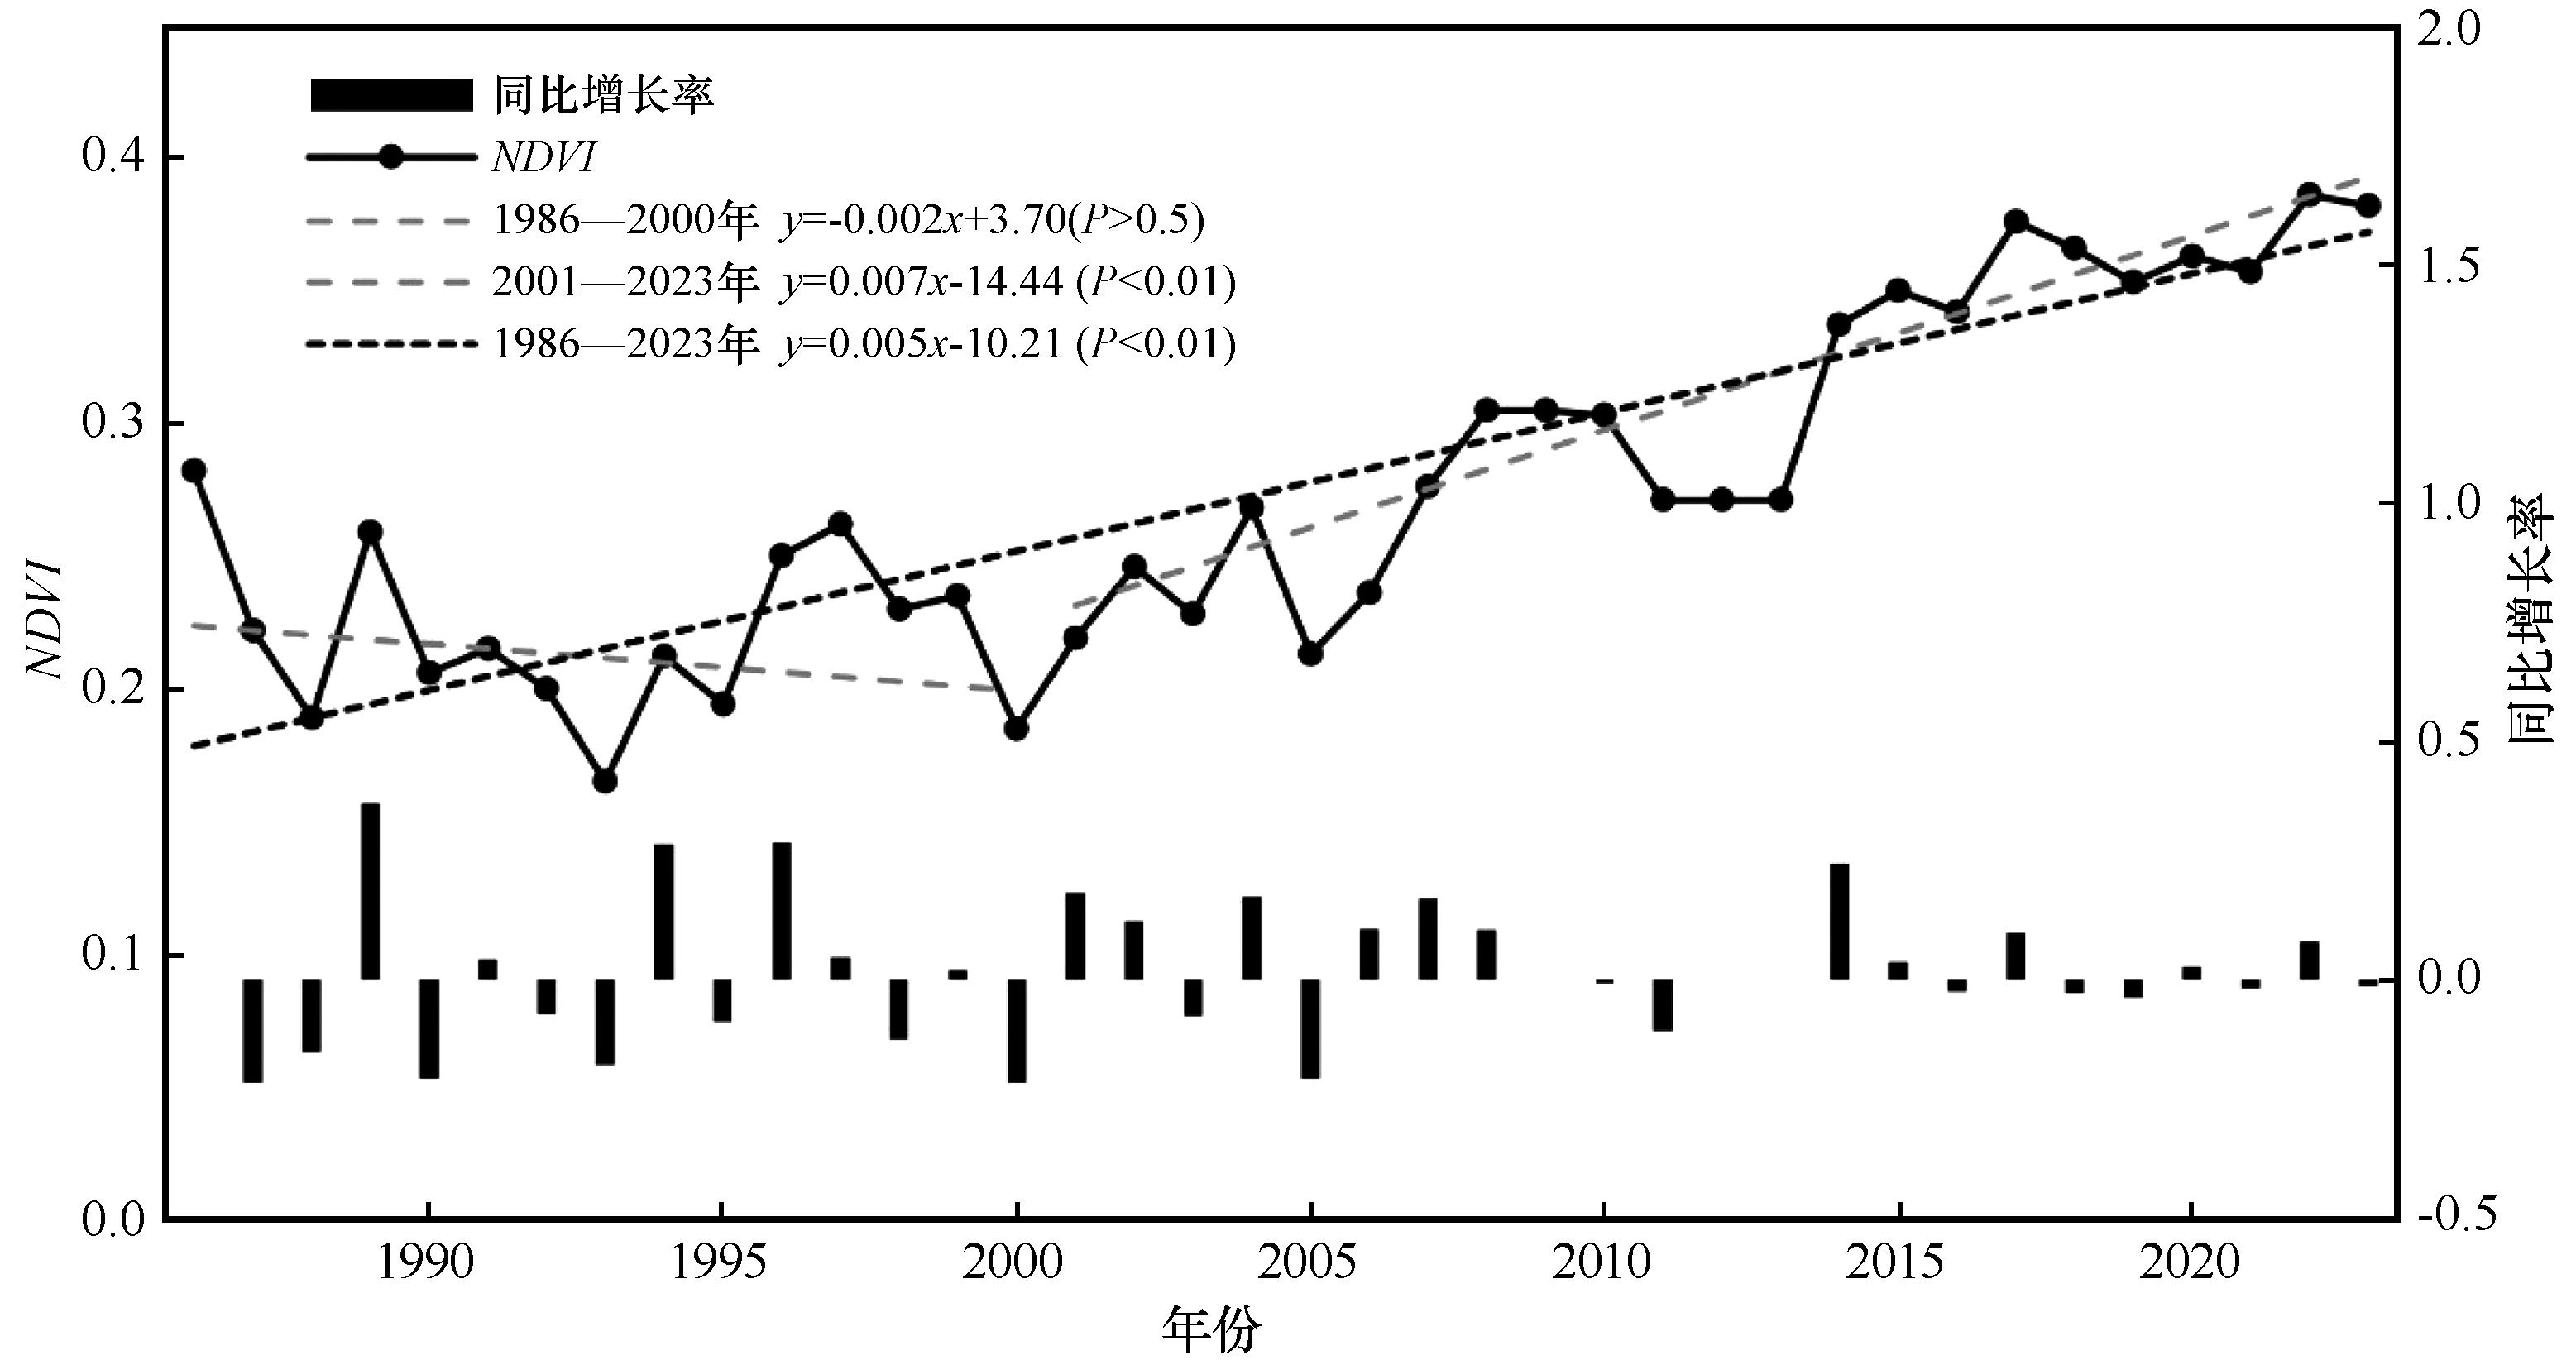
Fig.2 Inter-annual variation of average annual NDVI in the Lvliang Mountain area from 1986 to 2023
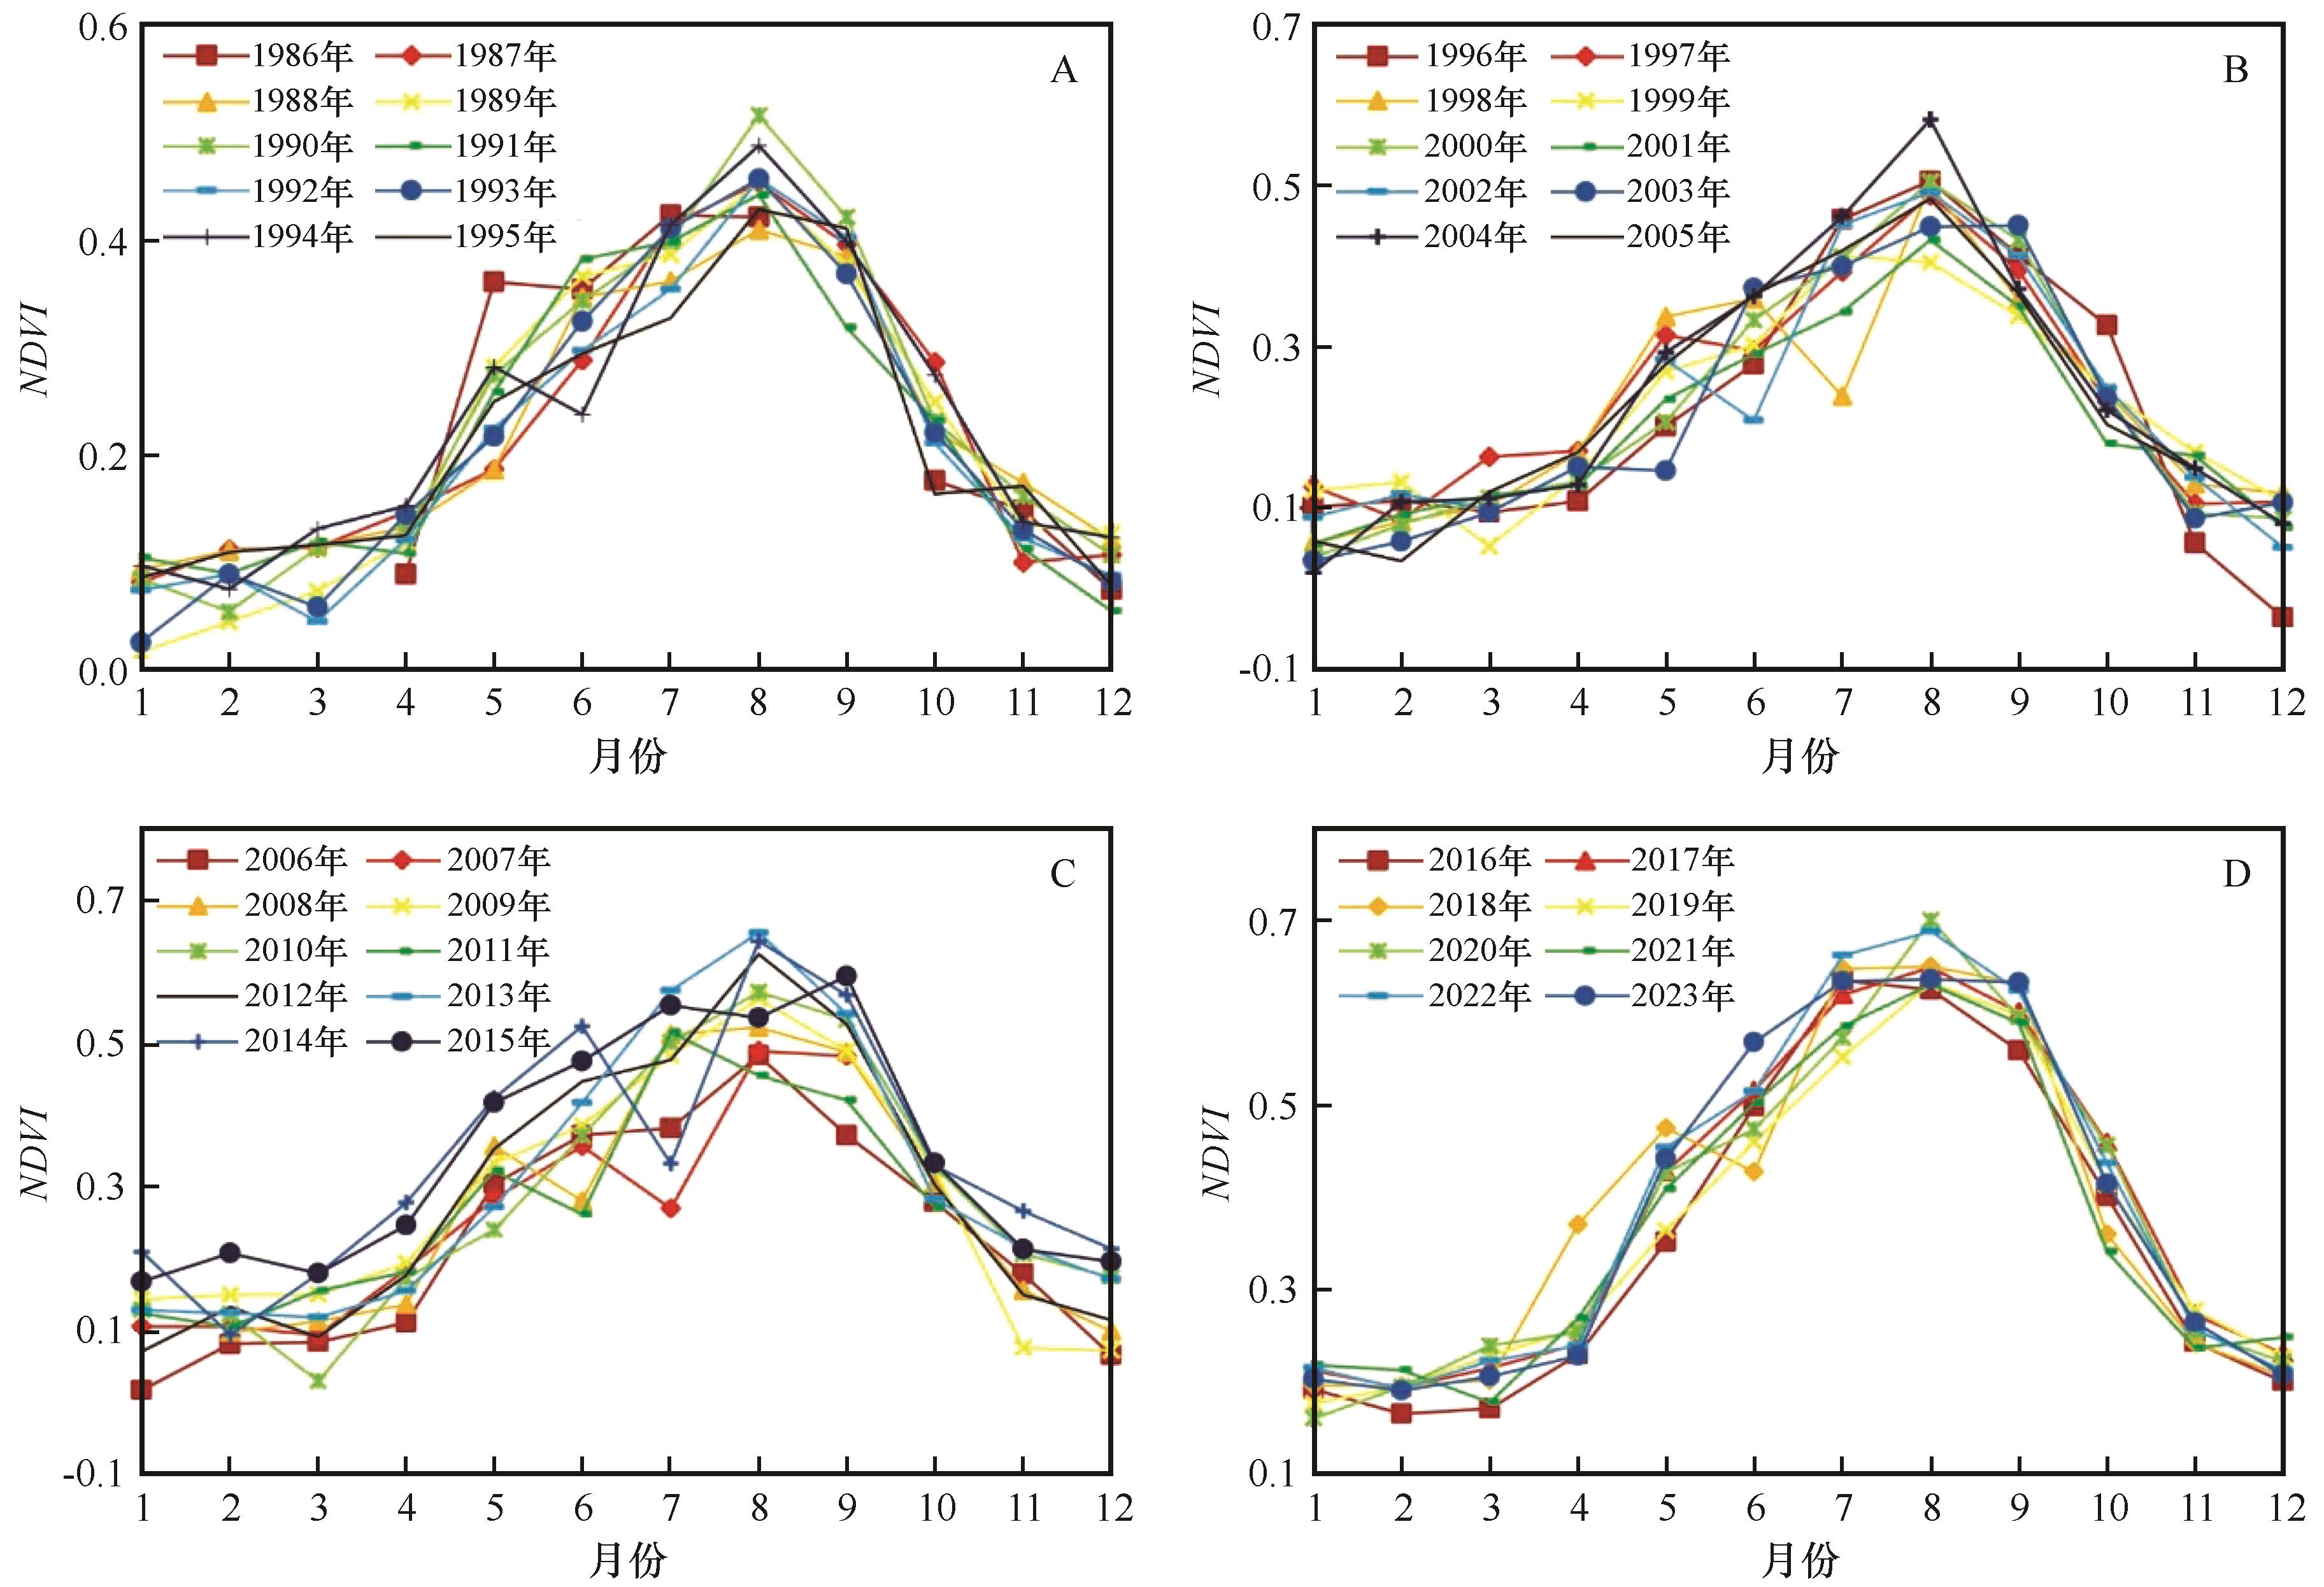
Fig.3 Inter-monthly changes of NDVI in the Lvliang Mountain area from 1986 to 2023
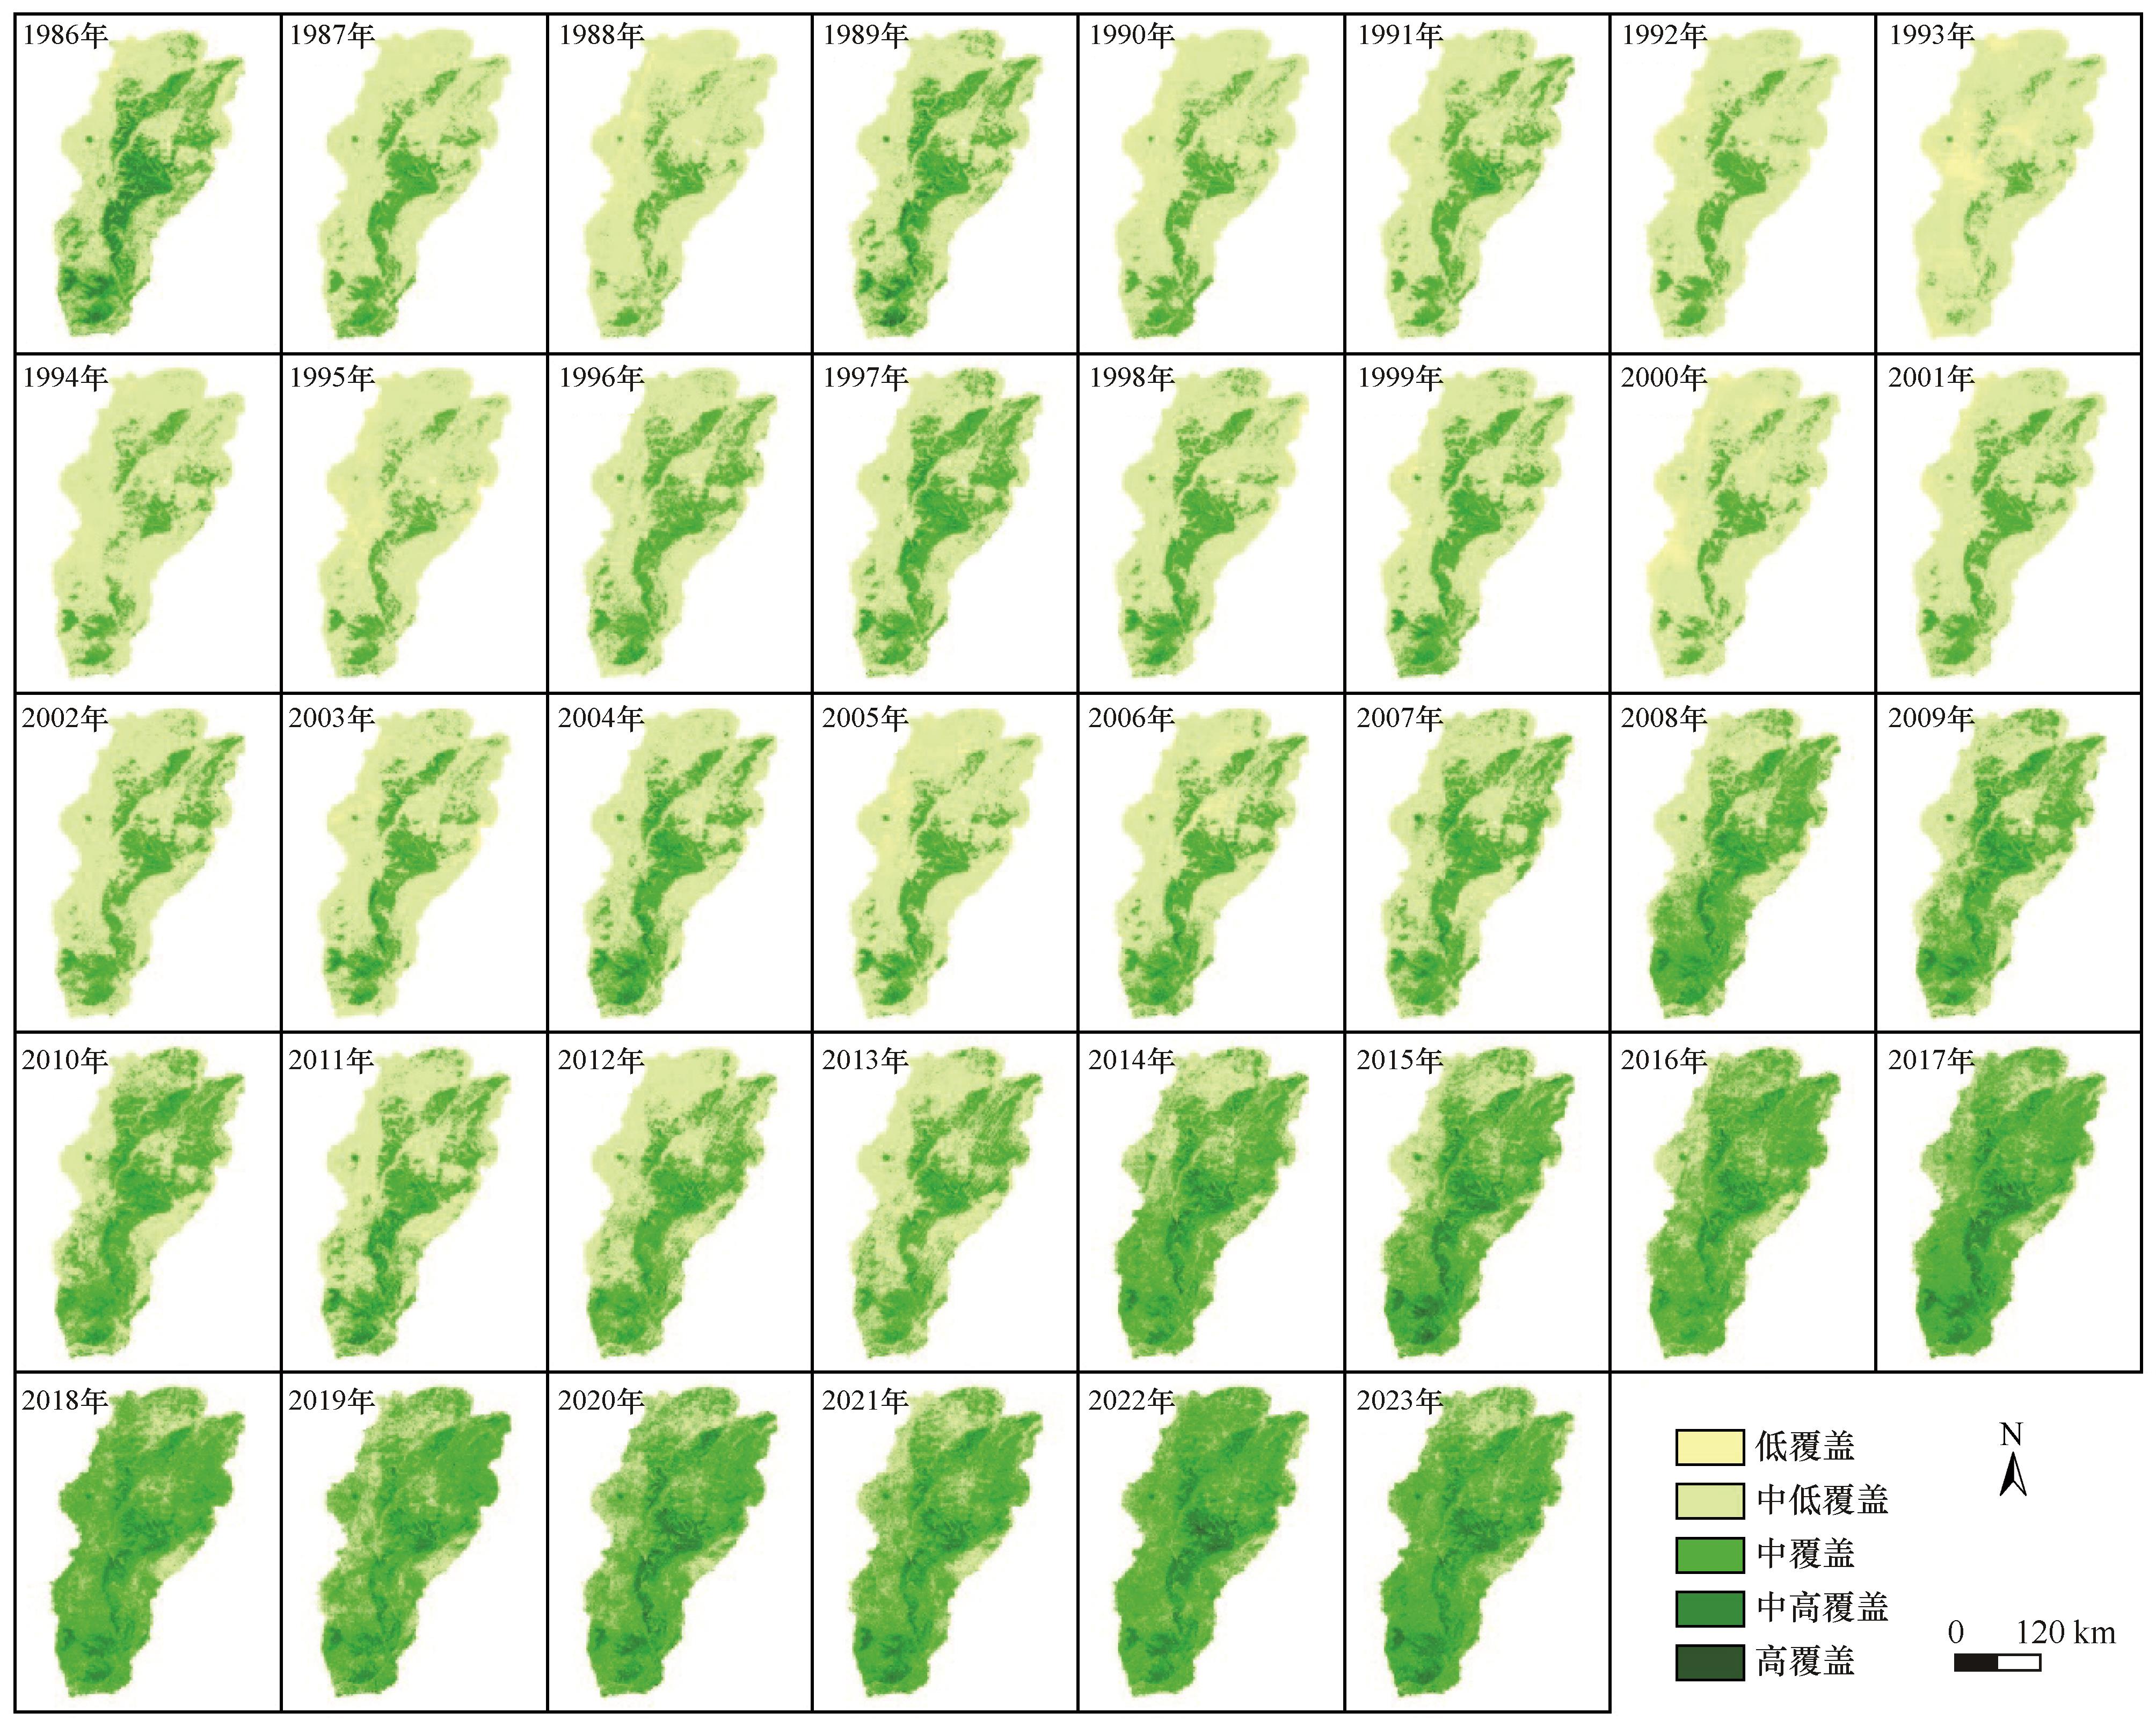
Fig.4 Spatial distribution of vegetation cover in the Lvliang Mountain area from 1986 to 2023
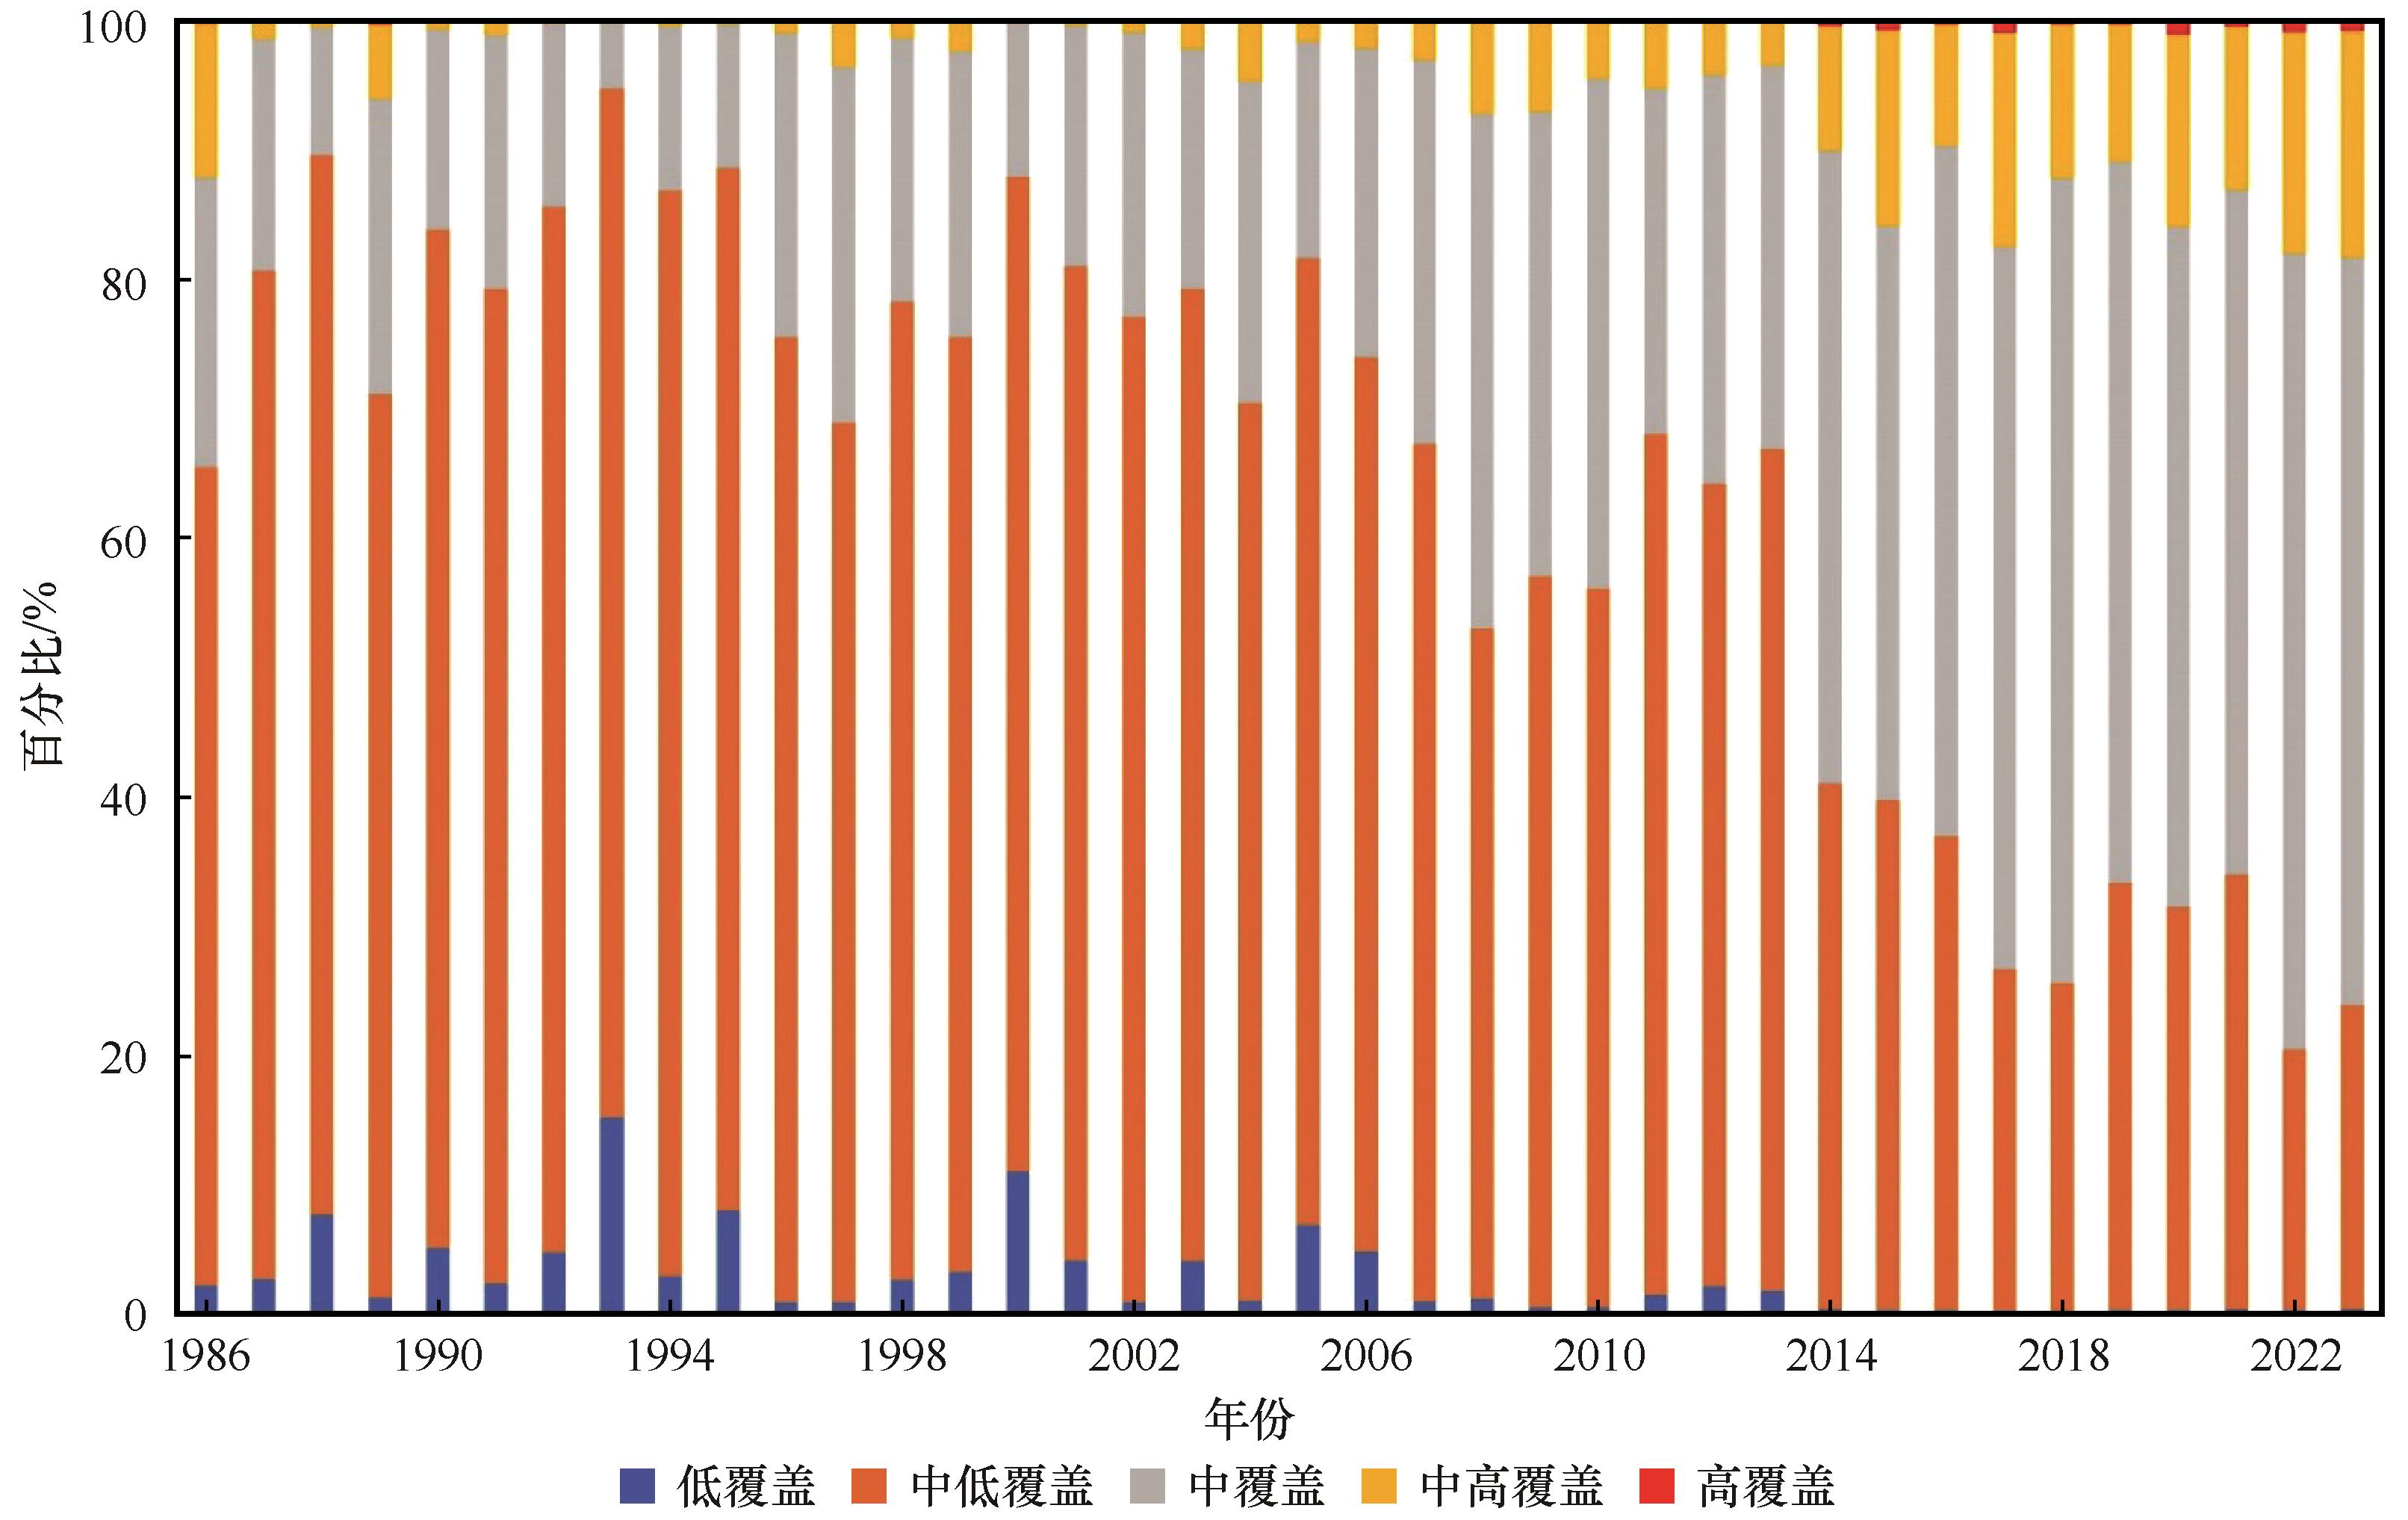
Fig.5 Proportion of vegetation coverage of different levels in the Lvliang Mountain area from 1986 to 2023
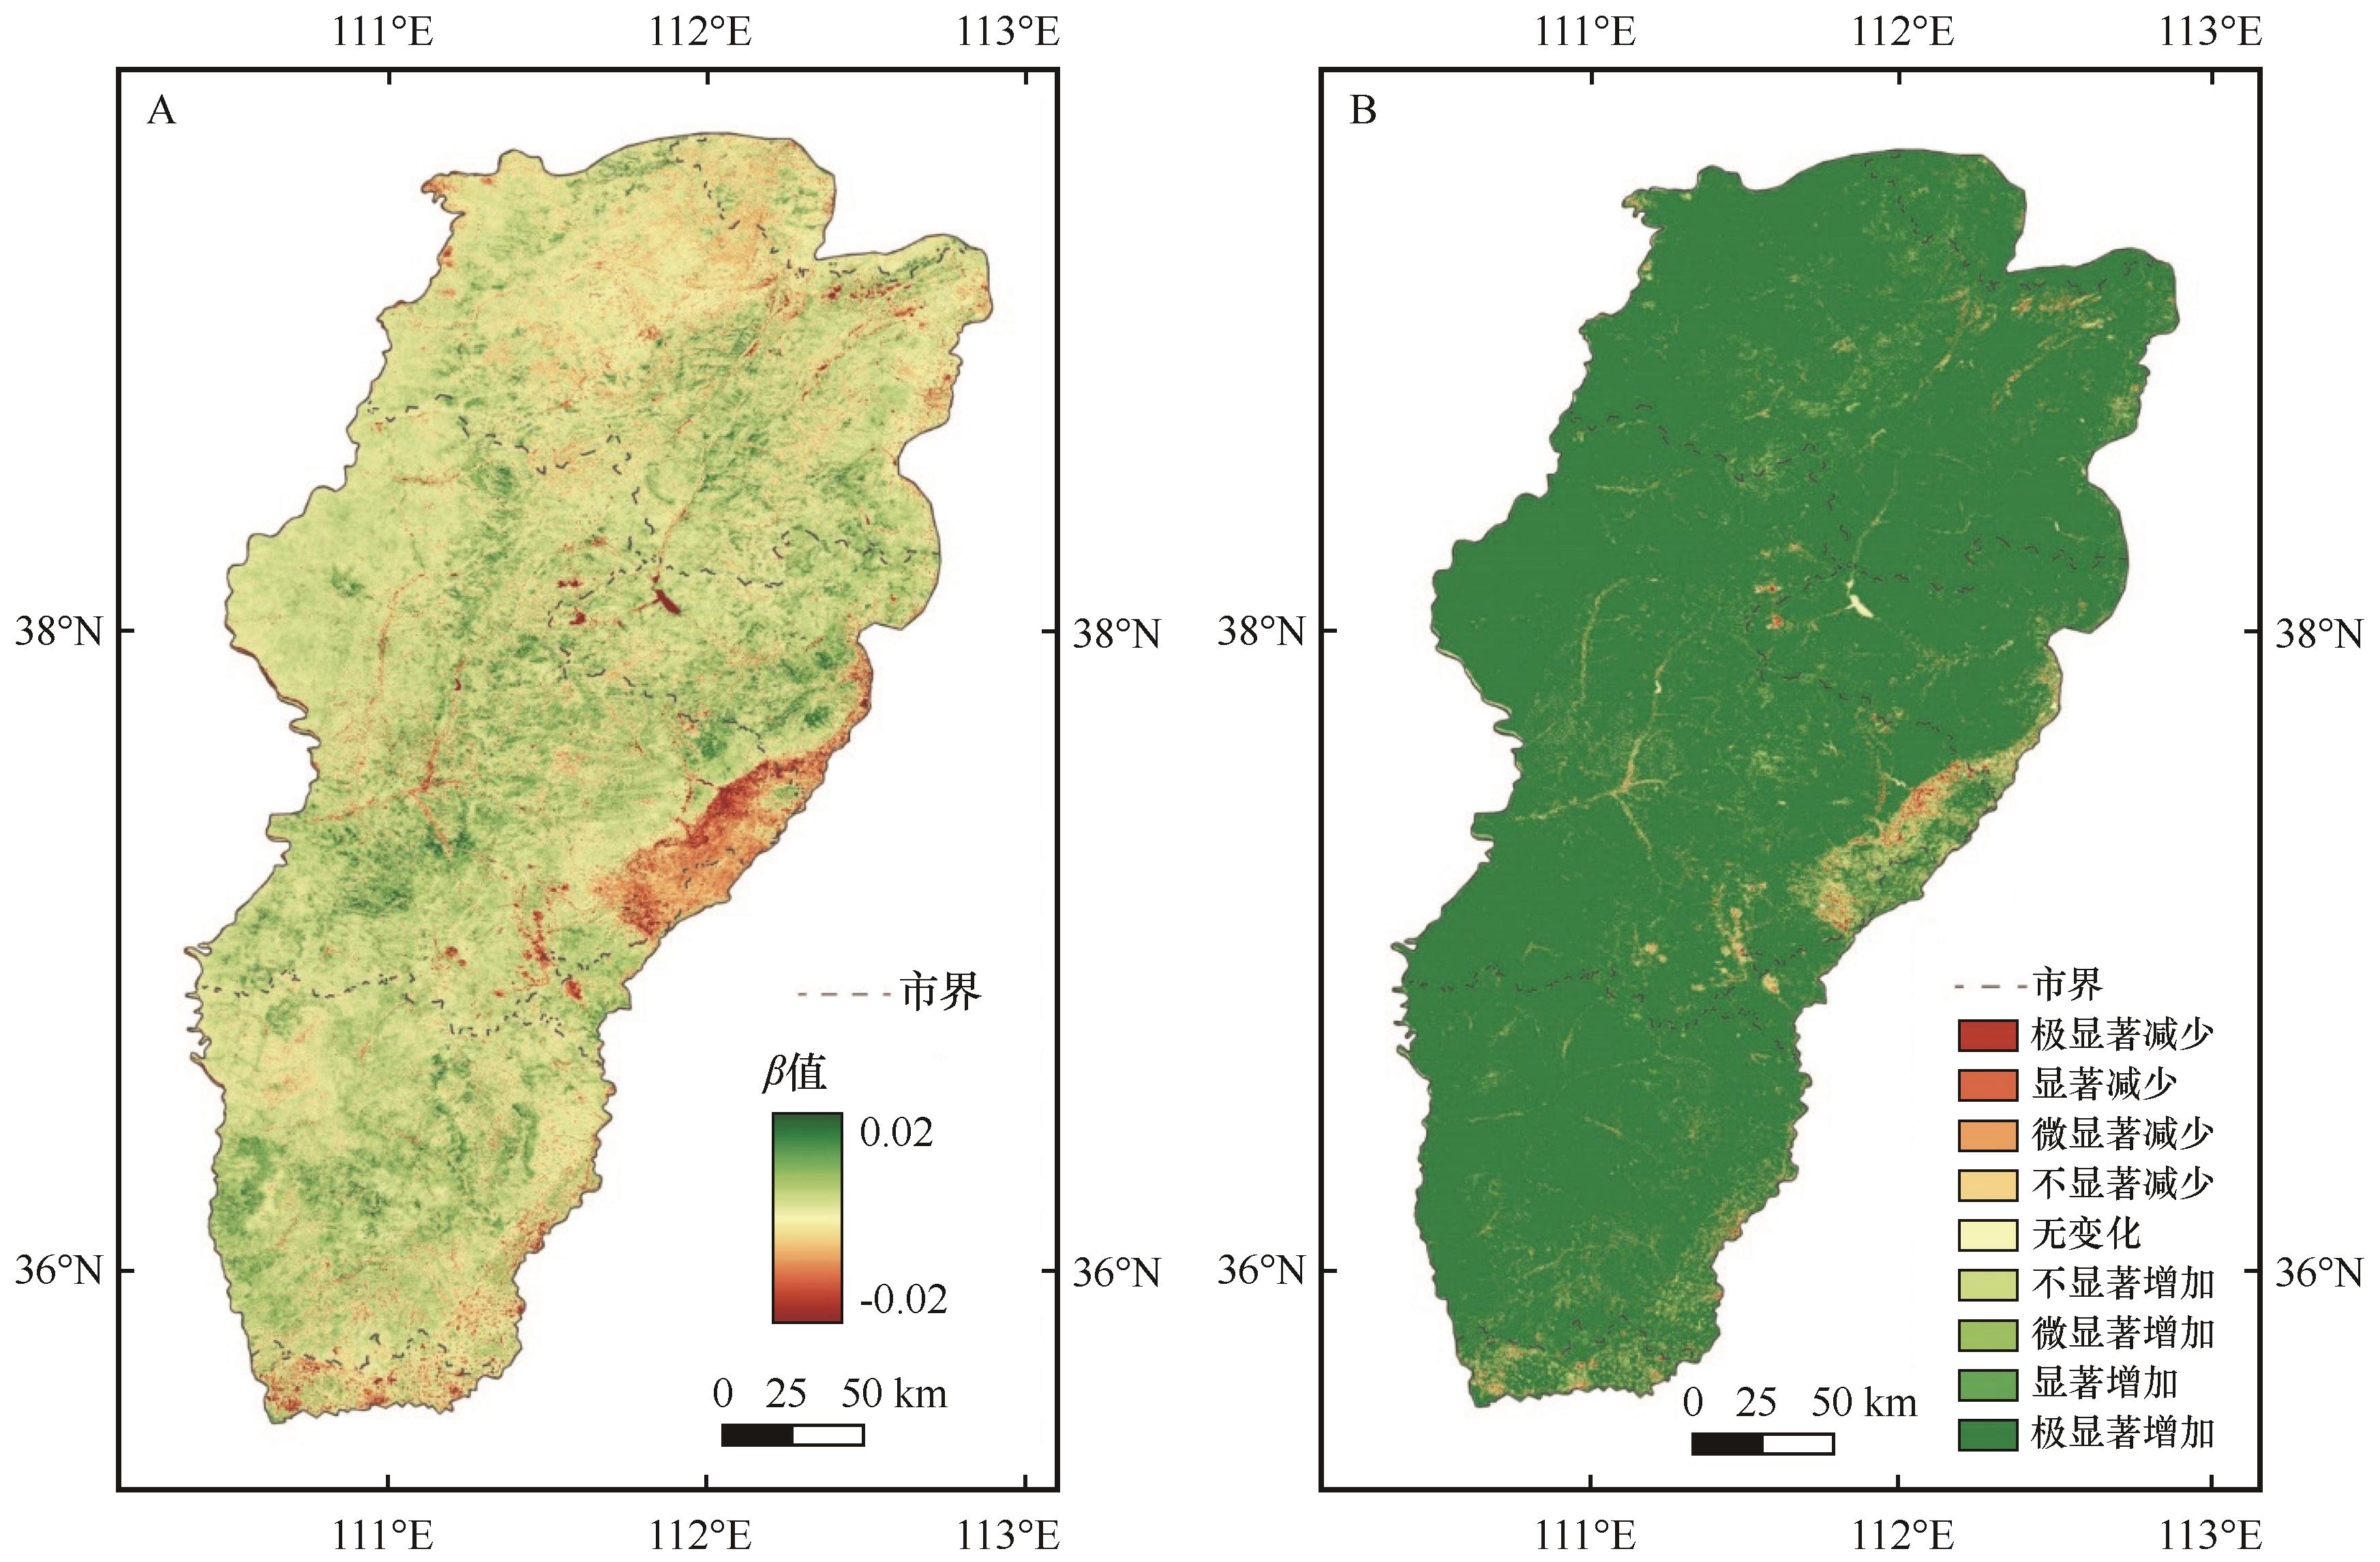
Fig.6 NDVI change trend (A) and significance (B) in the Lvliang Mountain area from 1986 to 2023
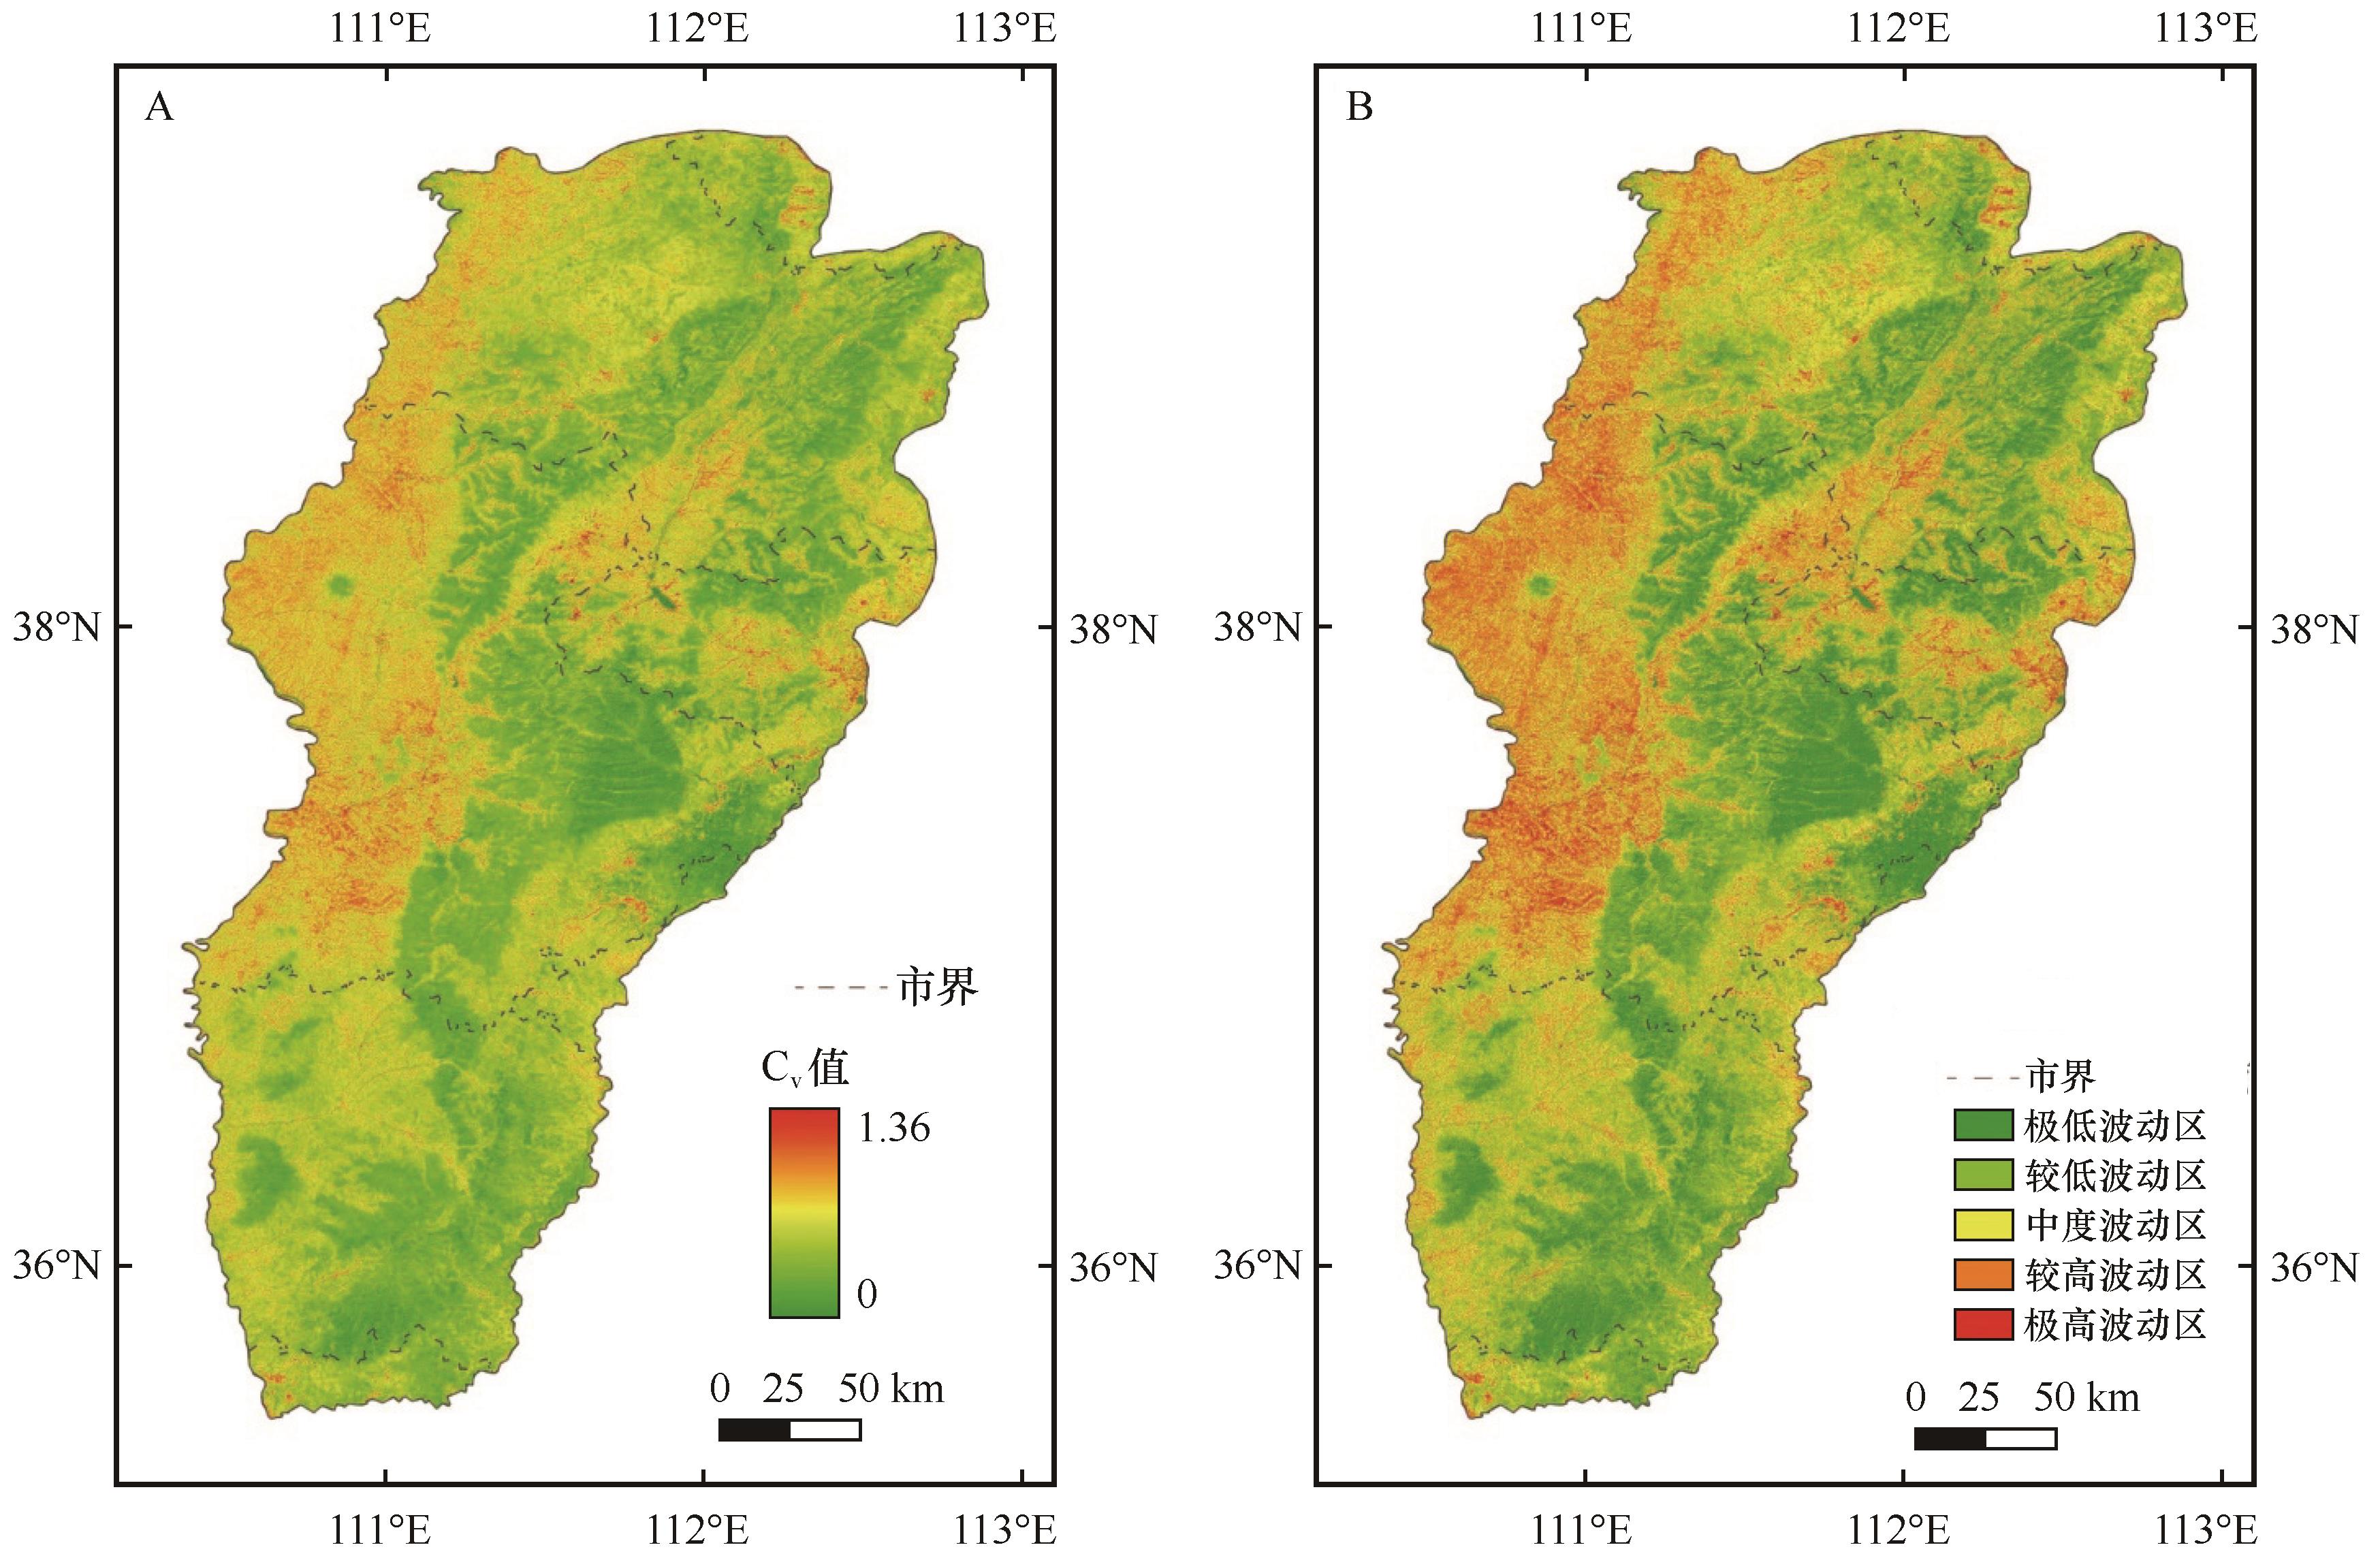
Fig.7 Cv values (A) and fluctuation regions (B) of NDVI in the Lvliang Mountain area from 1986 to 2023
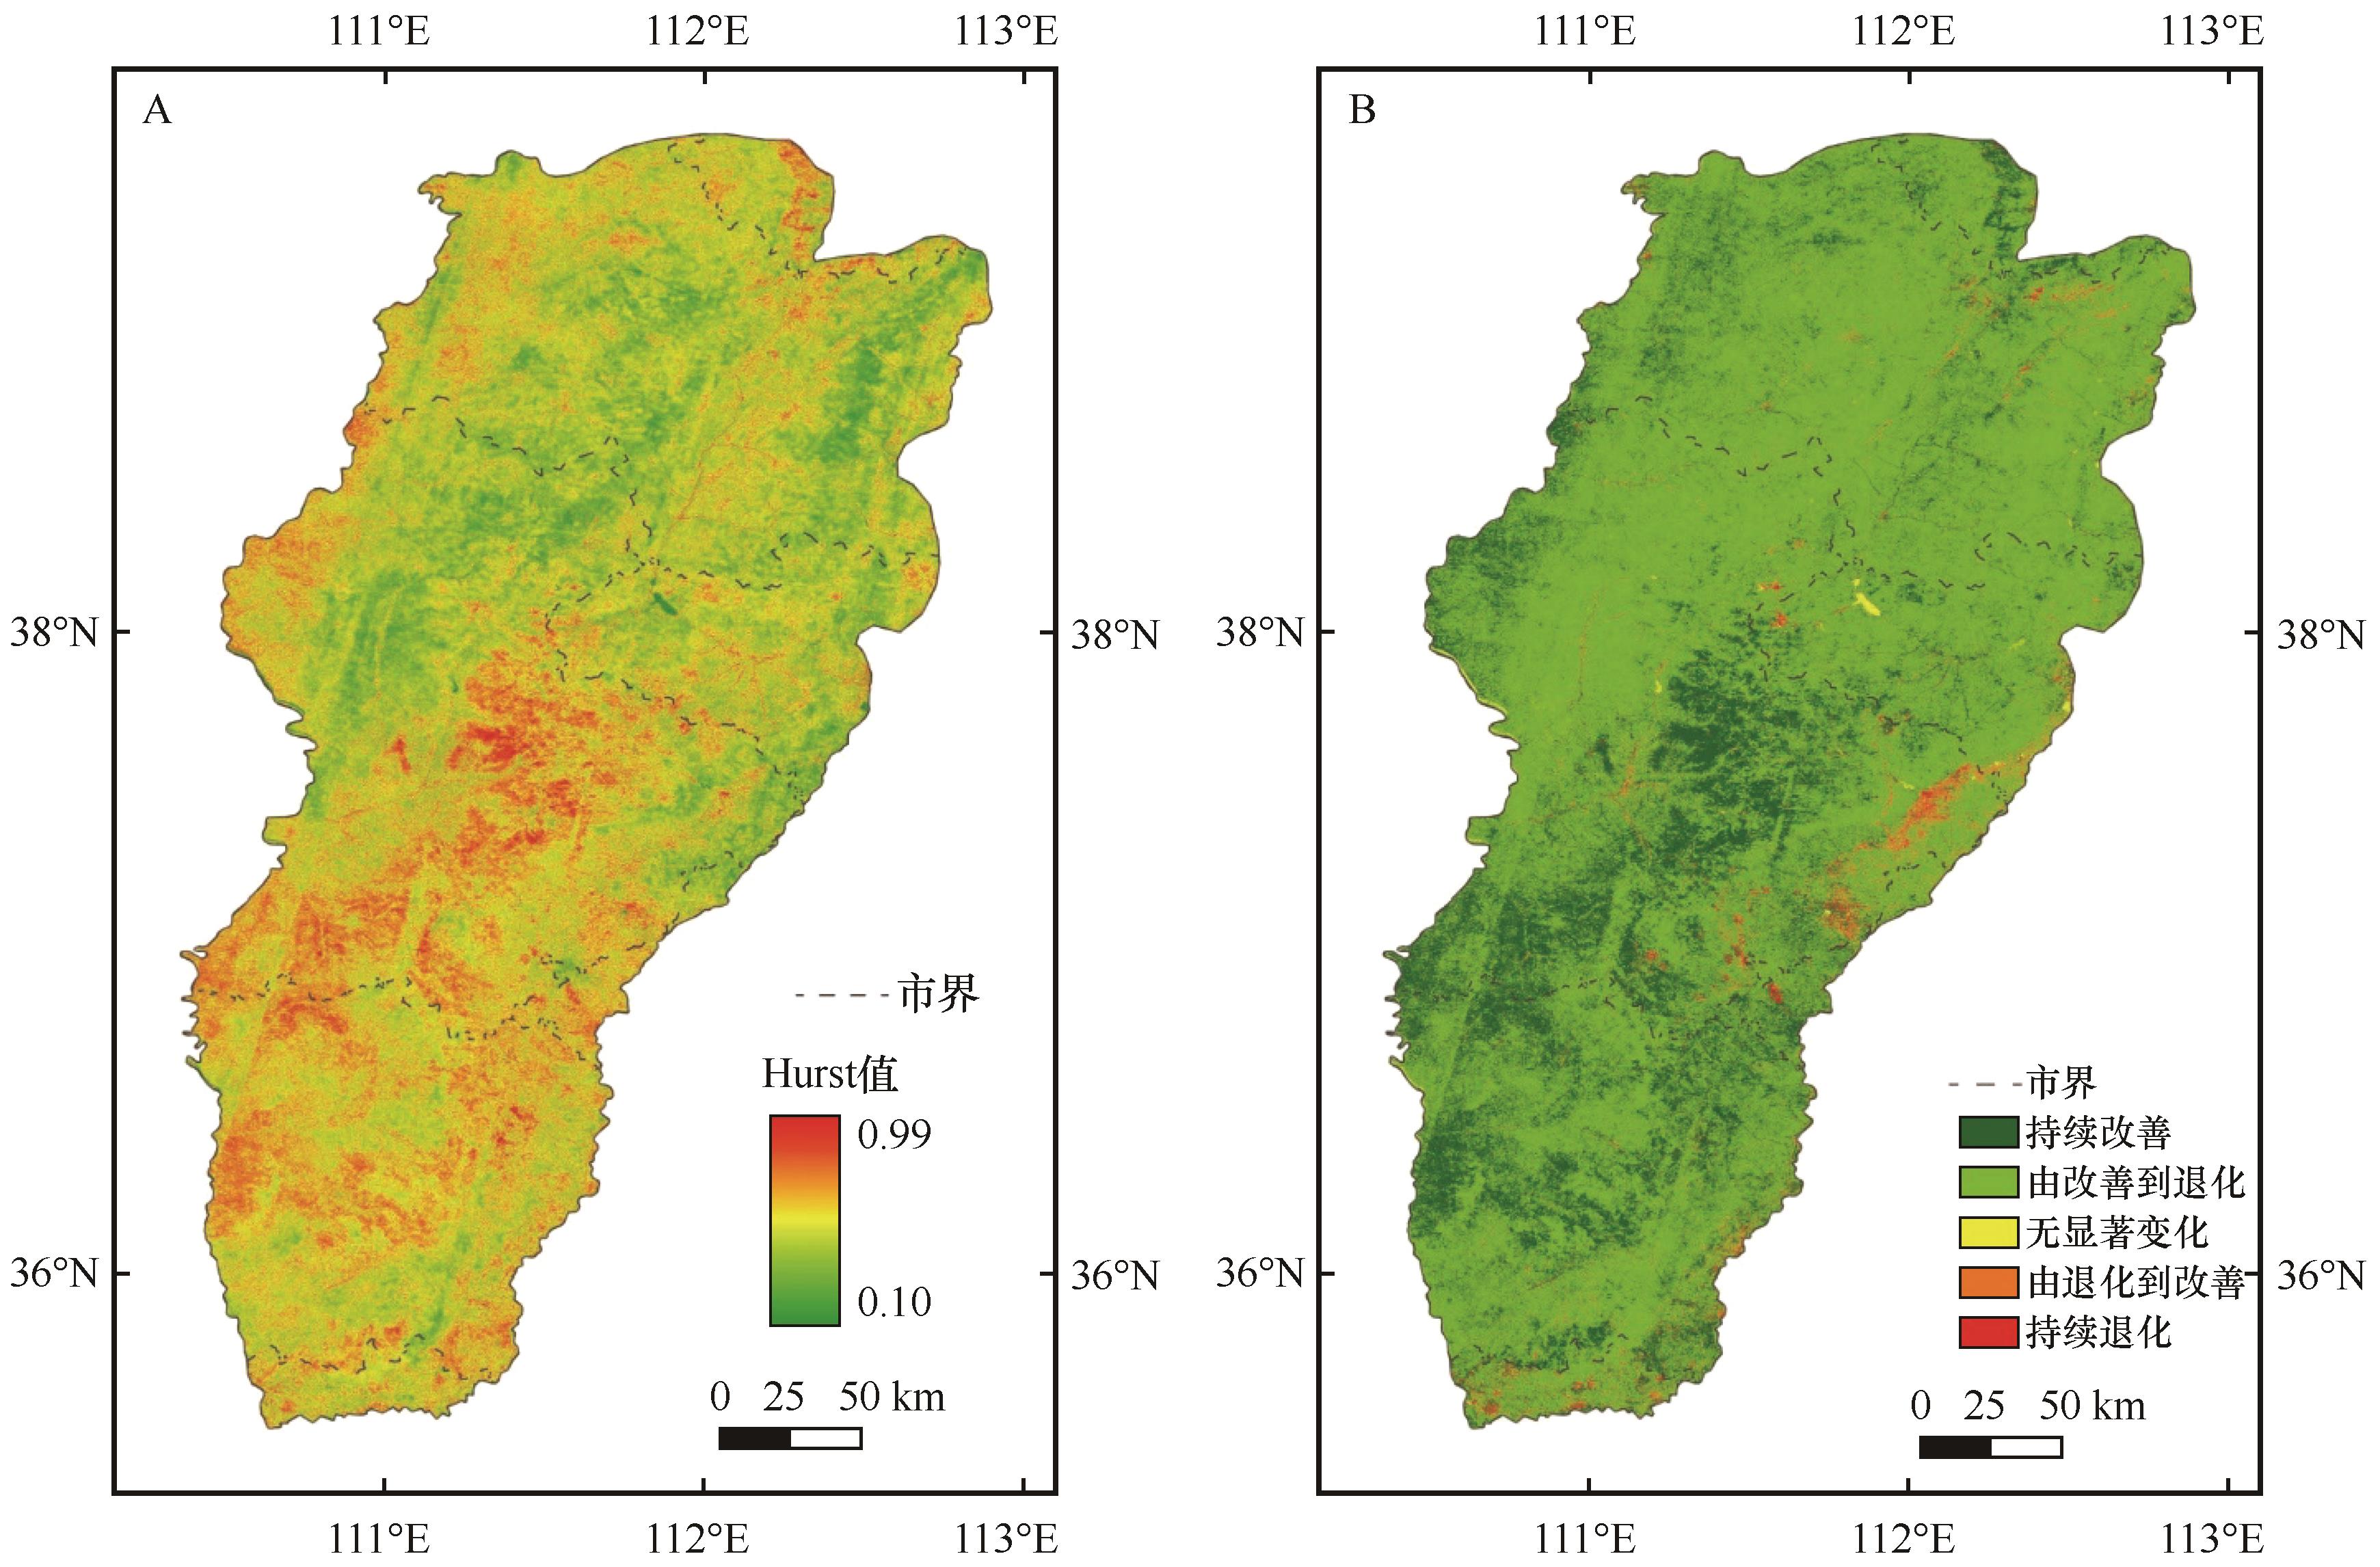
Fig.8 NDVI Hurst value (A) and future trend prediction (B) in the Lvliang Mountain area
| 因子 | 高程 | 坡度 | 年均风速 | 年均土壤温度 | 年均土壤湿度 | 干燥度 | 年实际蒸发量 | 年均气温 | 年降水量 | 夜间灯光指数 |
|---|---|---|---|---|---|---|---|---|---|---|
| q值 | 0.22 | 0.11 | 0.09 | 0.08 | 0.23 | 0.47 | 0.39 | 0.09 | 0.24 | 0.06 |
| P值(×10-10) | 3.67 | 6.60 | 6.80 | 2.85 | 3.71 | 6.76 | 7.11 | 6.56 | 6.03 | 2.94 |
Table 2 The results of factor detectors
| 因子 | 高程 | 坡度 | 年均风速 | 年均土壤温度 | 年均土壤湿度 | 干燥度 | 年实际蒸发量 | 年均气温 | 年降水量 | 夜间灯光指数 |
|---|---|---|---|---|---|---|---|---|---|---|
| q值 | 0.22 | 0.11 | 0.09 | 0.08 | 0.23 | 0.47 | 0.39 | 0.09 | 0.24 | 0.06 |
| P值(×10-10) | 3.67 | 6.60 | 6.80 | 2.85 | 3.71 | 6.76 | 7.11 | 6.56 | 6.03 | 2.94 |
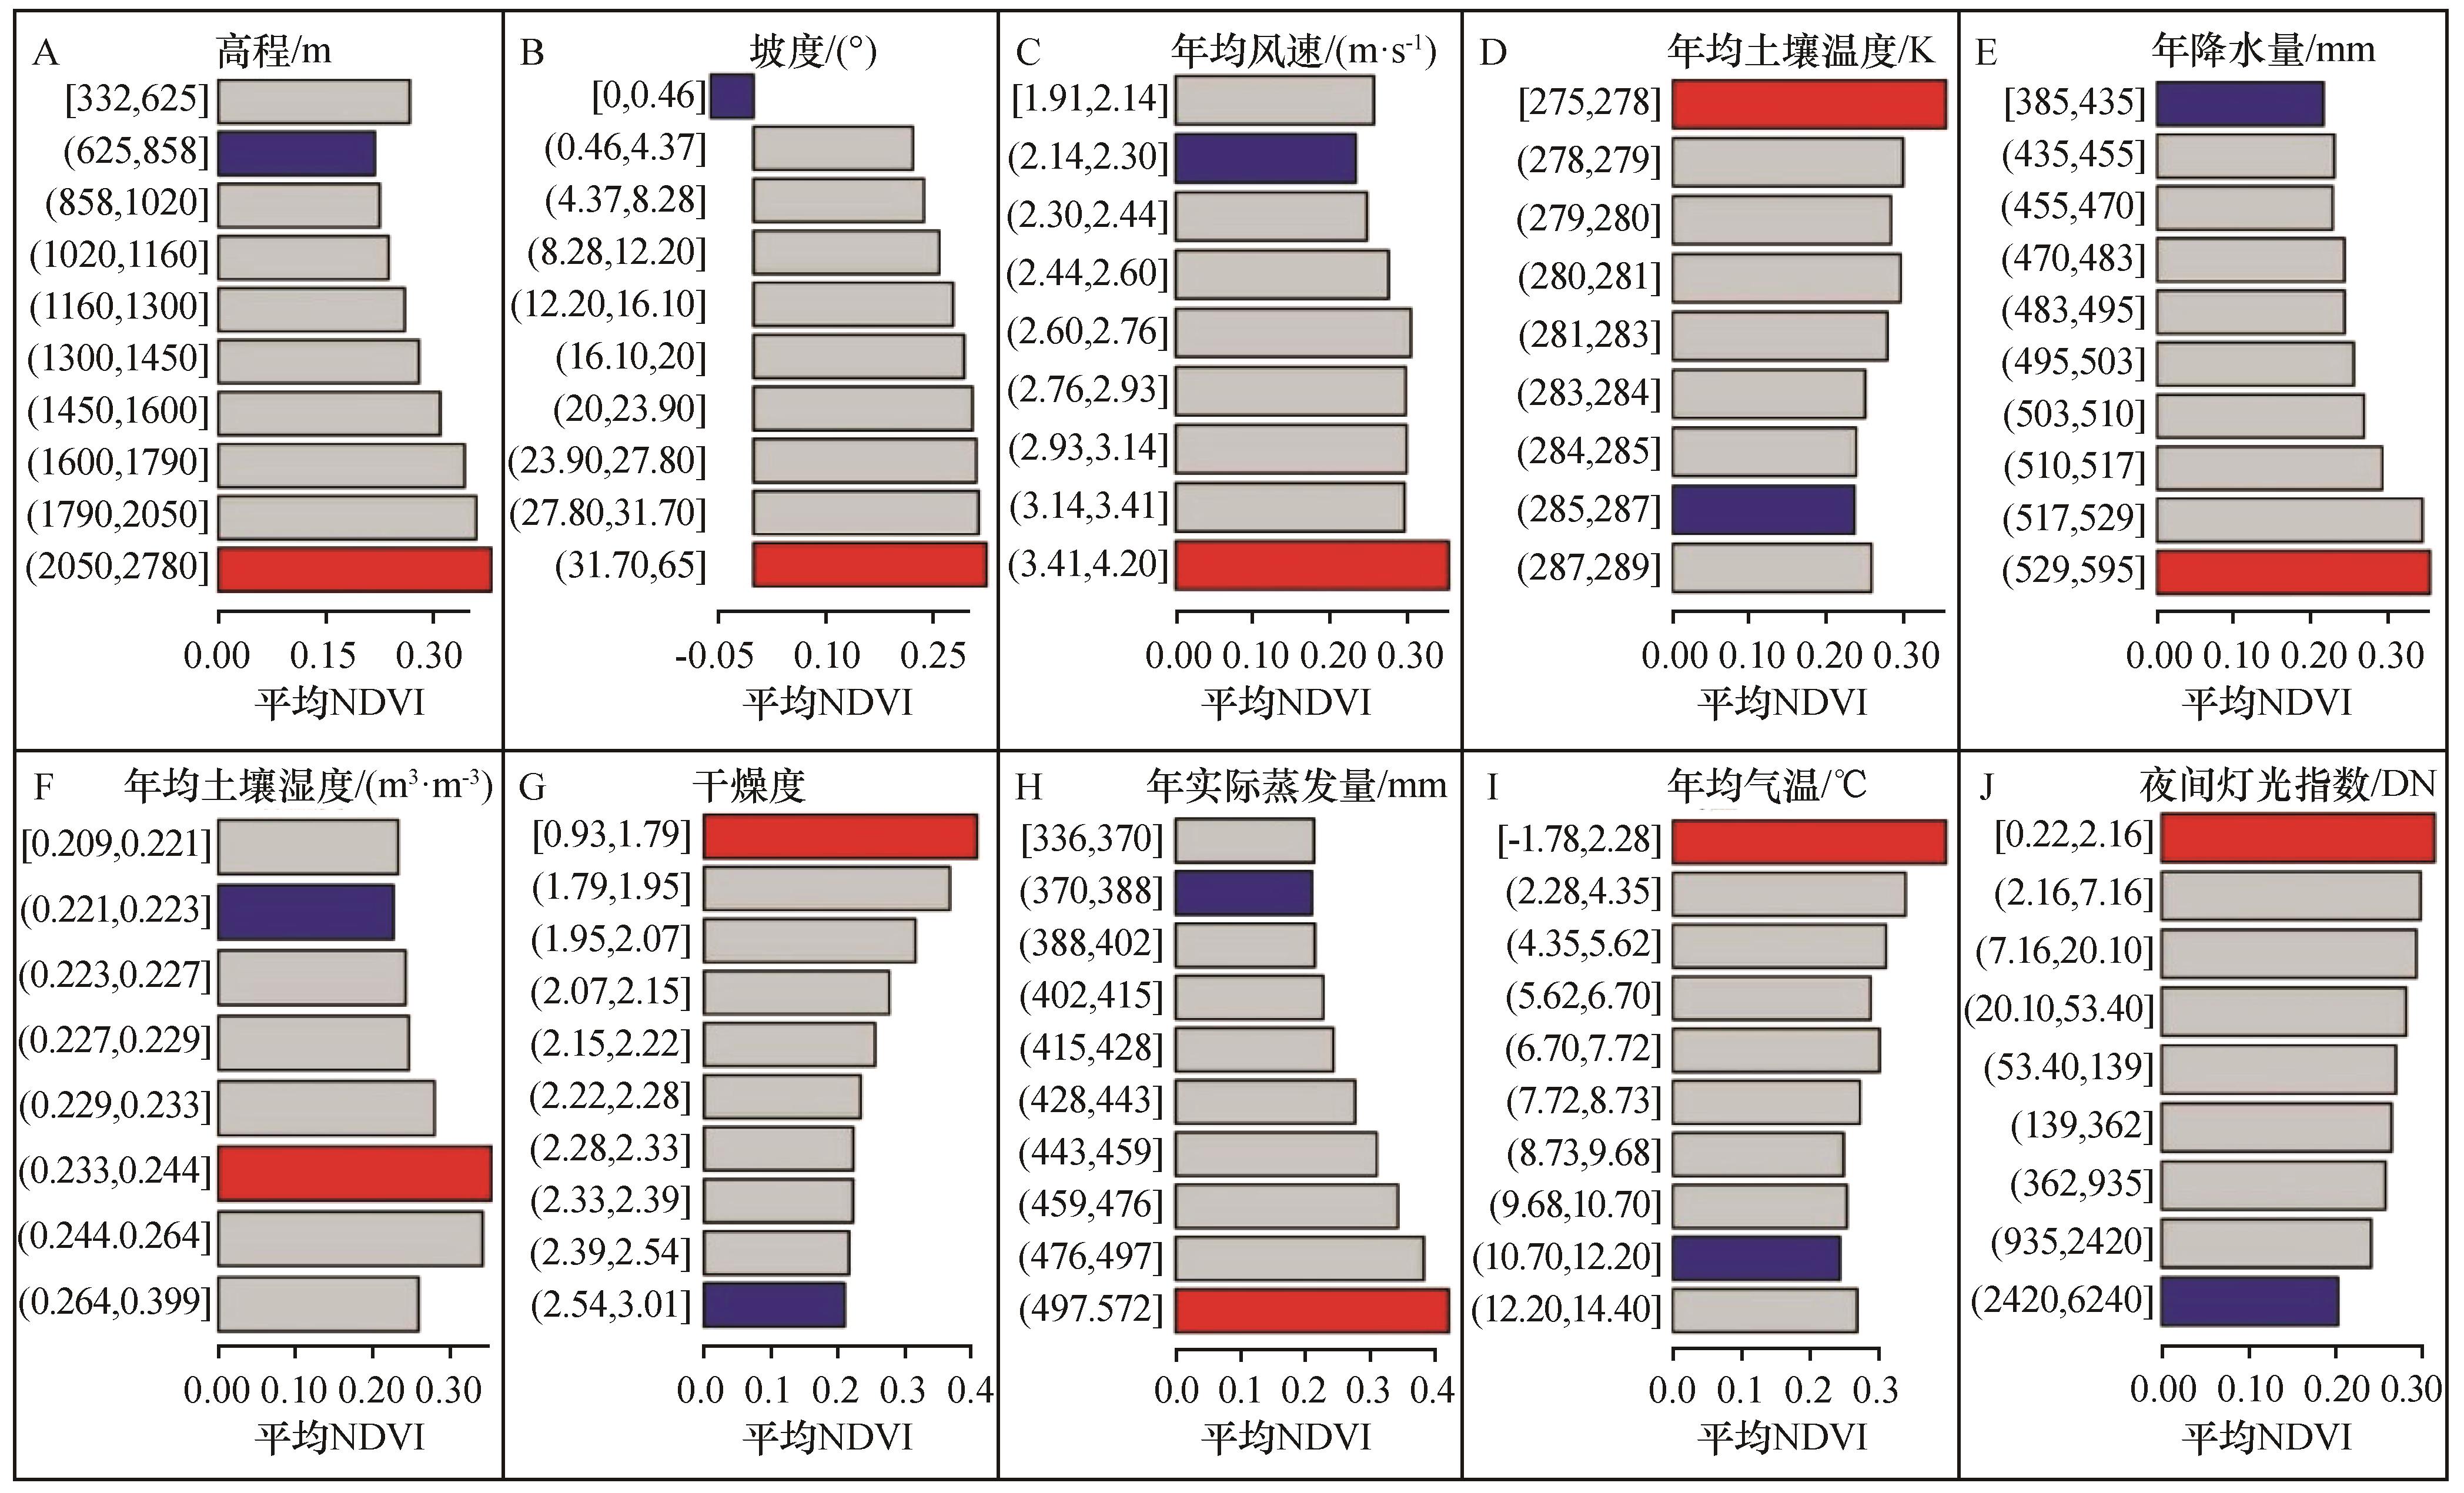
Fig.9 Average NDVI values of different levels of each factor
| 因子 | 植被NDVI适宜范围 | NDVI均值 |
|---|---|---|
| 高程 | 2 050~2 780 | 0.38 |
| 坡度 | 31.70~65 | 0.33 |
| 年均风速 | 3.41~4.20 | 0.35 |
| 年均土壤温度 | 275~278 | 0.36 |
| 年均土壤湿度 | 0.23~0.24 | 0.35 |
| 干燥度 | 0.93~1.79 | 0.41 |
| 年实际蒸发量 | 497~572 | 0.42 |
| 年均气温 | -1.78~2.28 | 0.40 |
| 年降水量 | 529~595 | 0.36 |
| 夜间灯光指数 | 0.22~2.16 | 0.32 |
Table 3 The suitable limits of the driver factors
| 因子 | 植被NDVI适宜范围 | NDVI均值 |
|---|---|---|
| 高程 | 2 050~2 780 | 0.38 |
| 坡度 | 31.70~65 | 0.33 |
| 年均风速 | 3.41~4.20 | 0.35 |
| 年均土壤温度 | 275~278 | 0.36 |
| 年均土壤湿度 | 0.23~0.24 | 0.35 |
| 干燥度 | 0.93~1.79 | 0.41 |
| 年实际蒸发量 | 497~572 | 0.42 |
| 年均气温 | -1.78~2.28 | 0.40 |
| 年降水量 | 529~595 | 0.36 |
| 夜间灯光指数 | 0.22~2.16 | 0.32 |
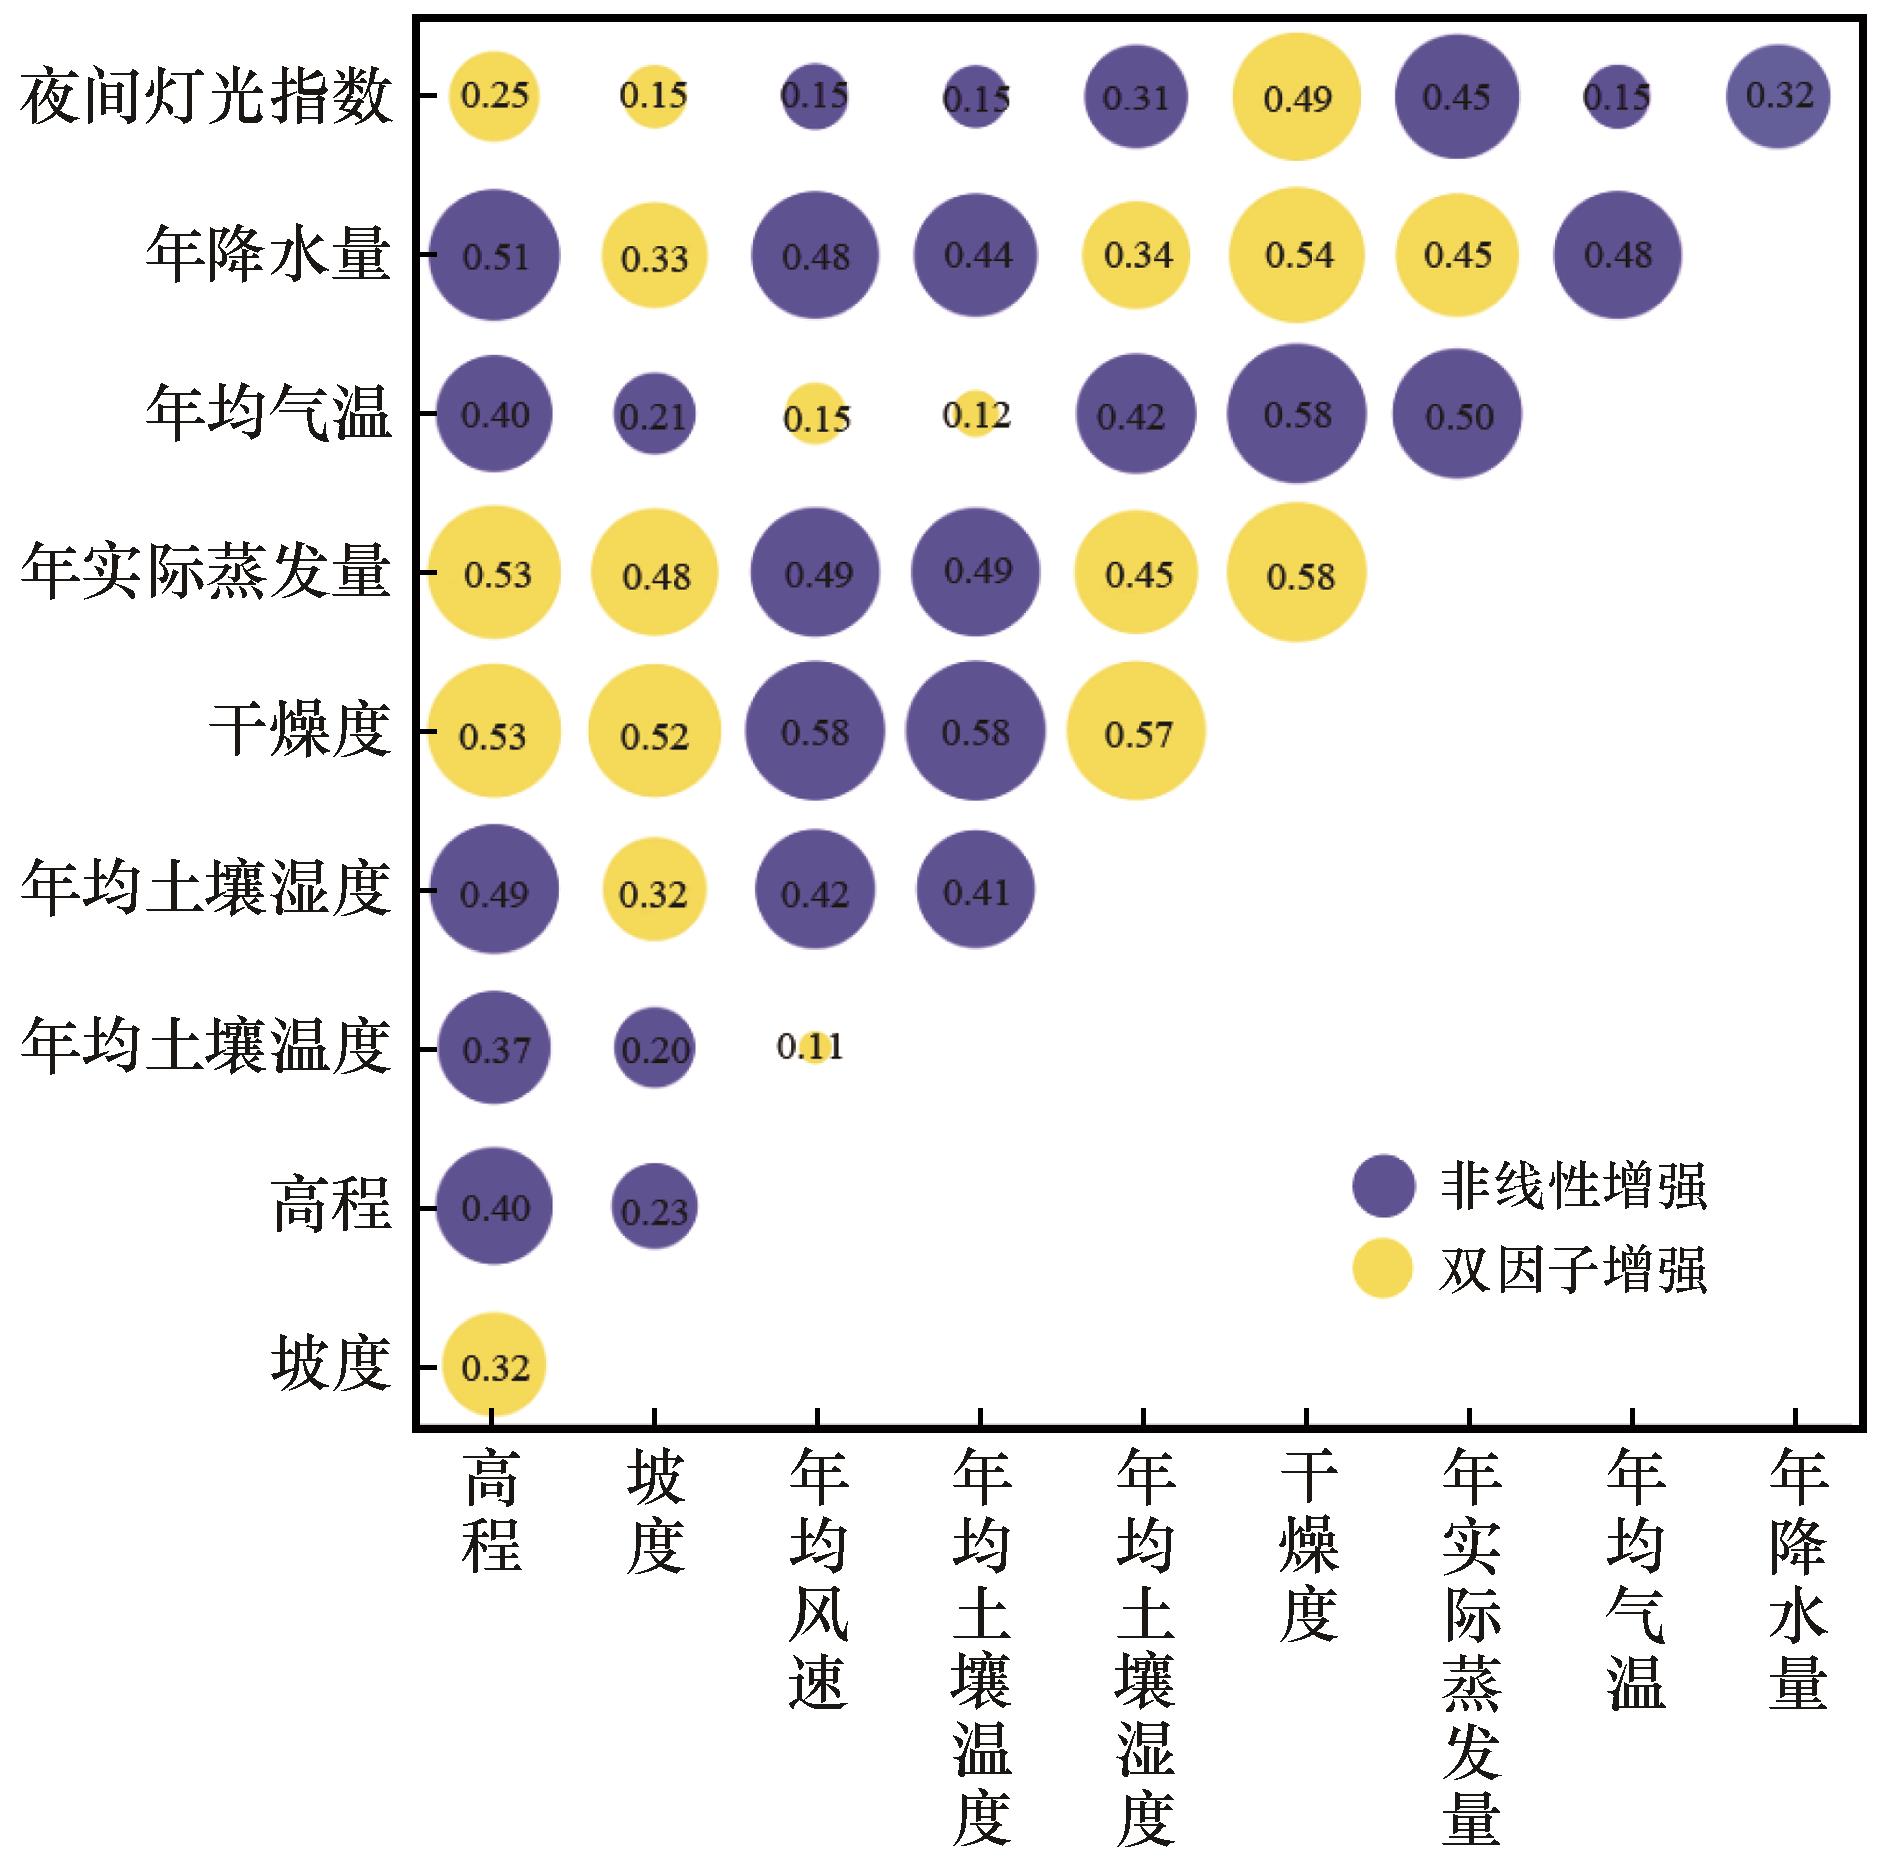
Fig.10 Interaction detectors of these factors
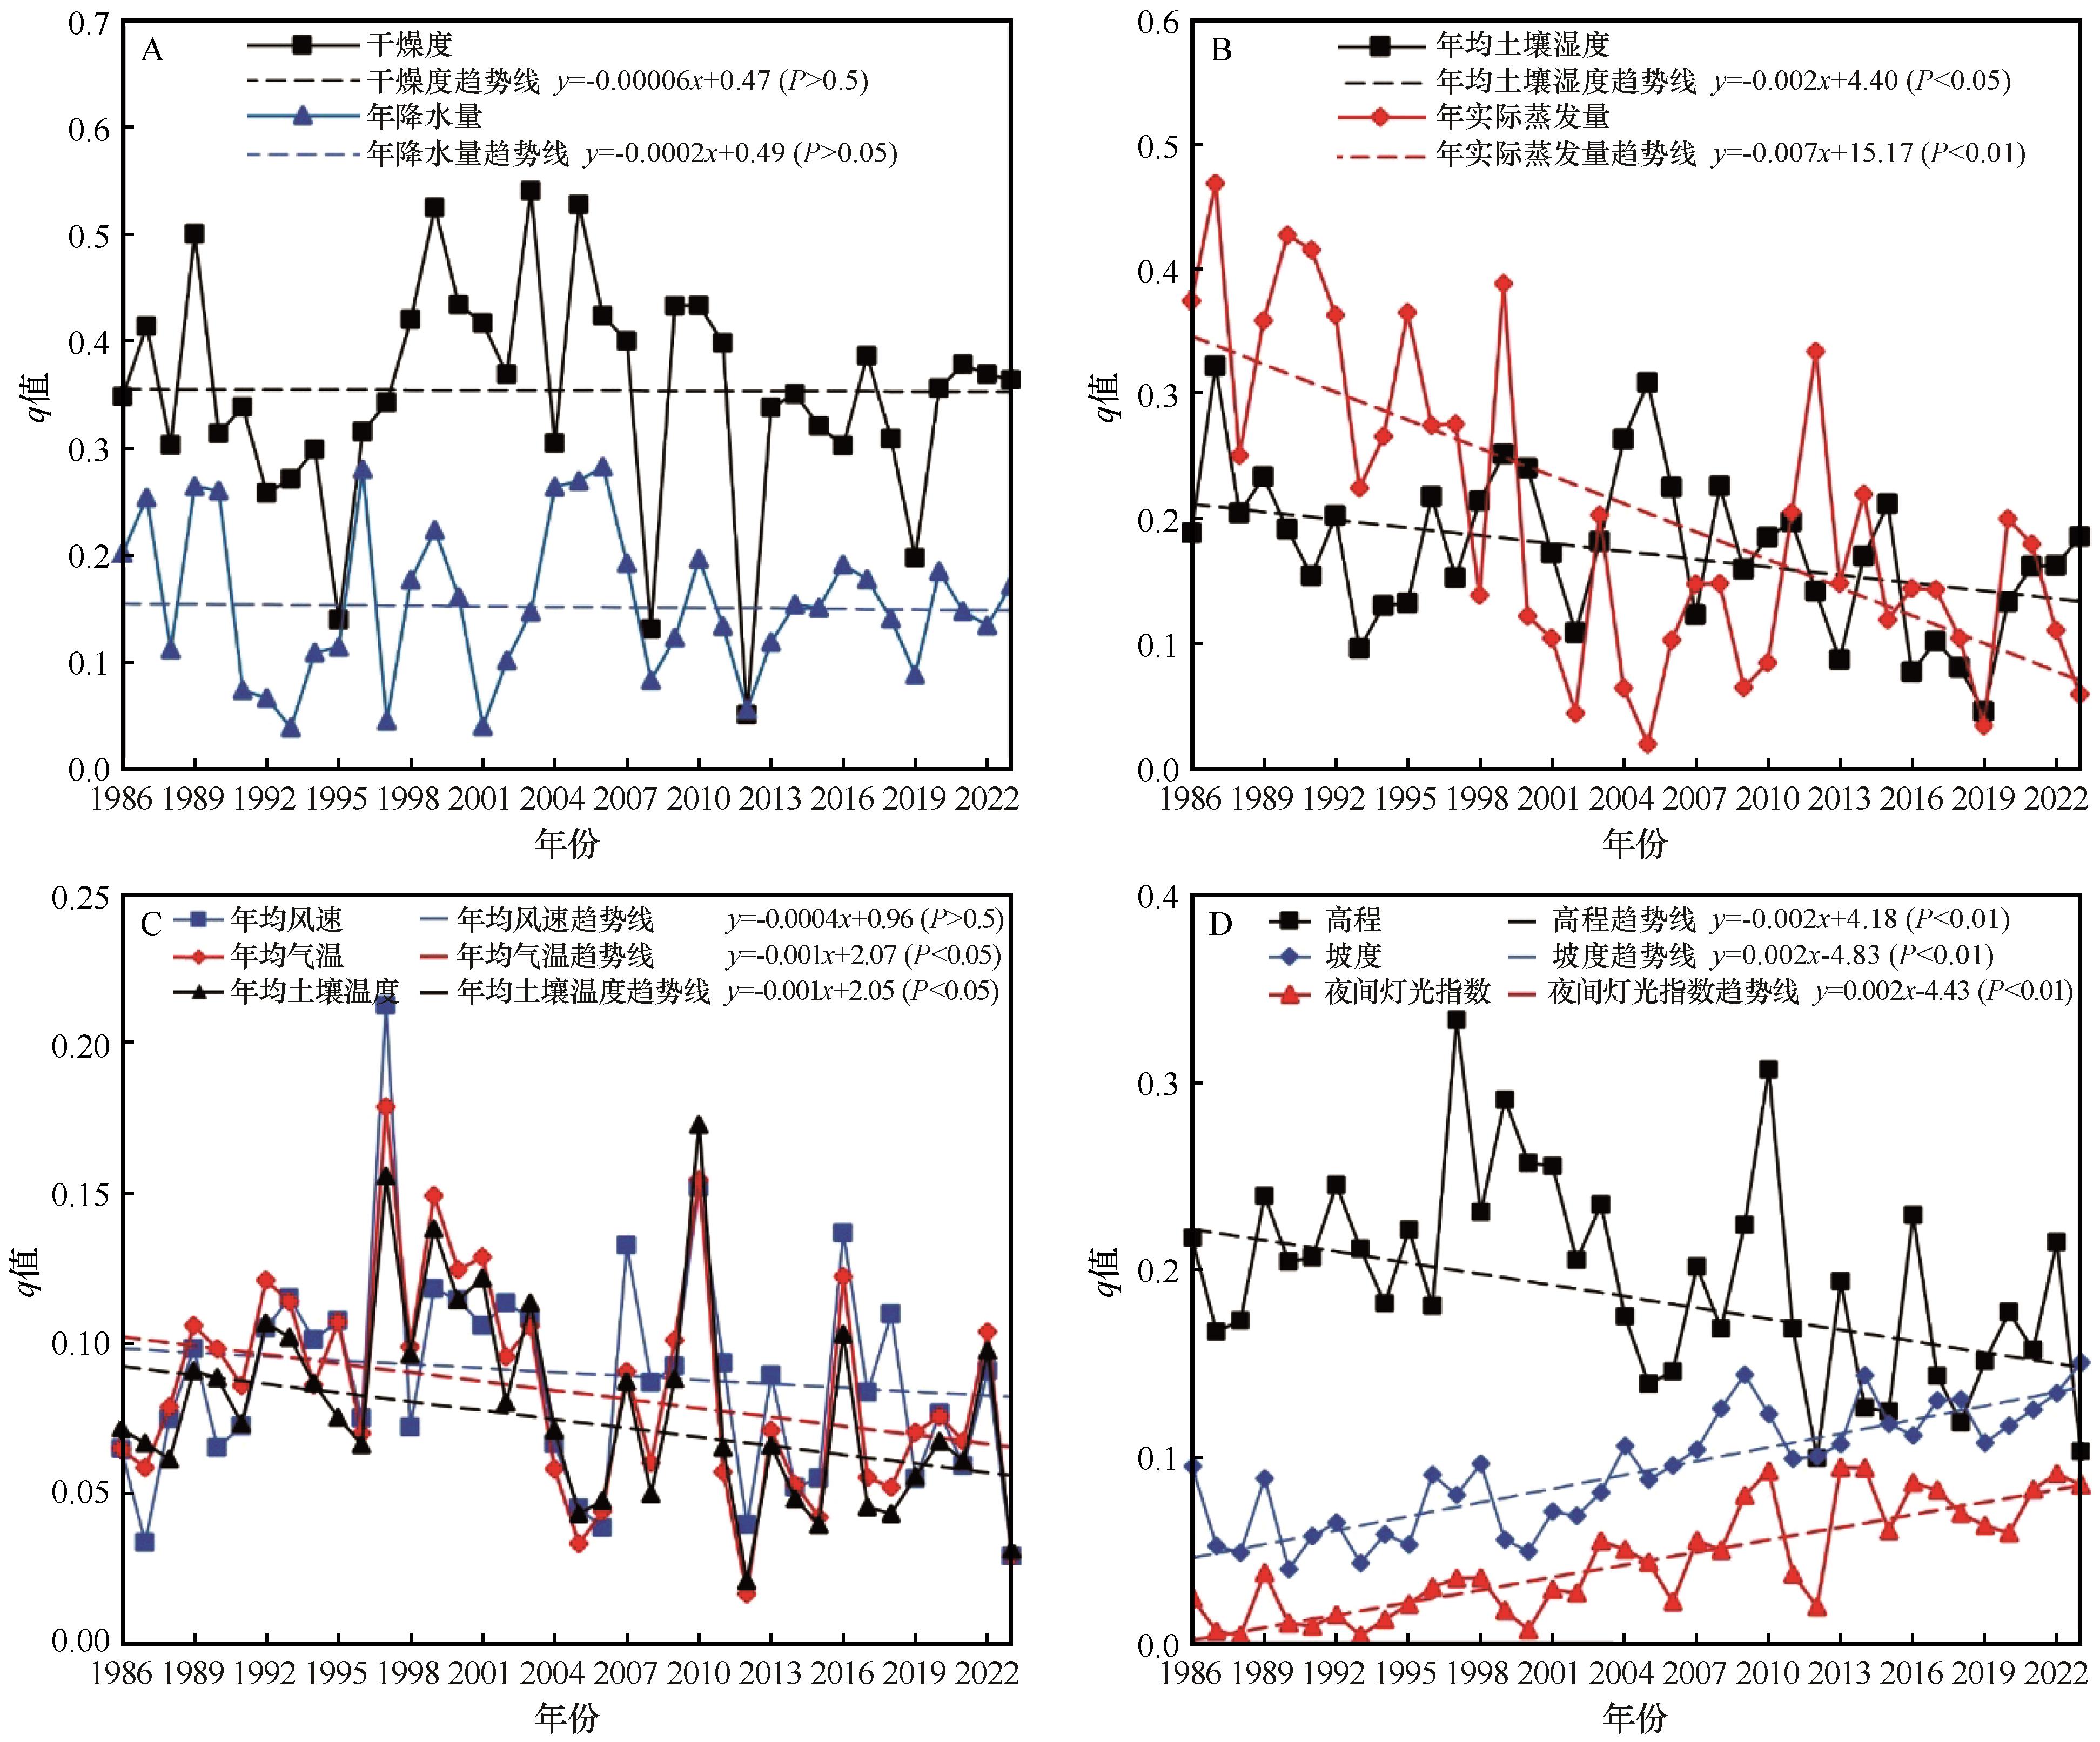
Fig.11 Changes of q values of various driving factors from 1986 to 2023
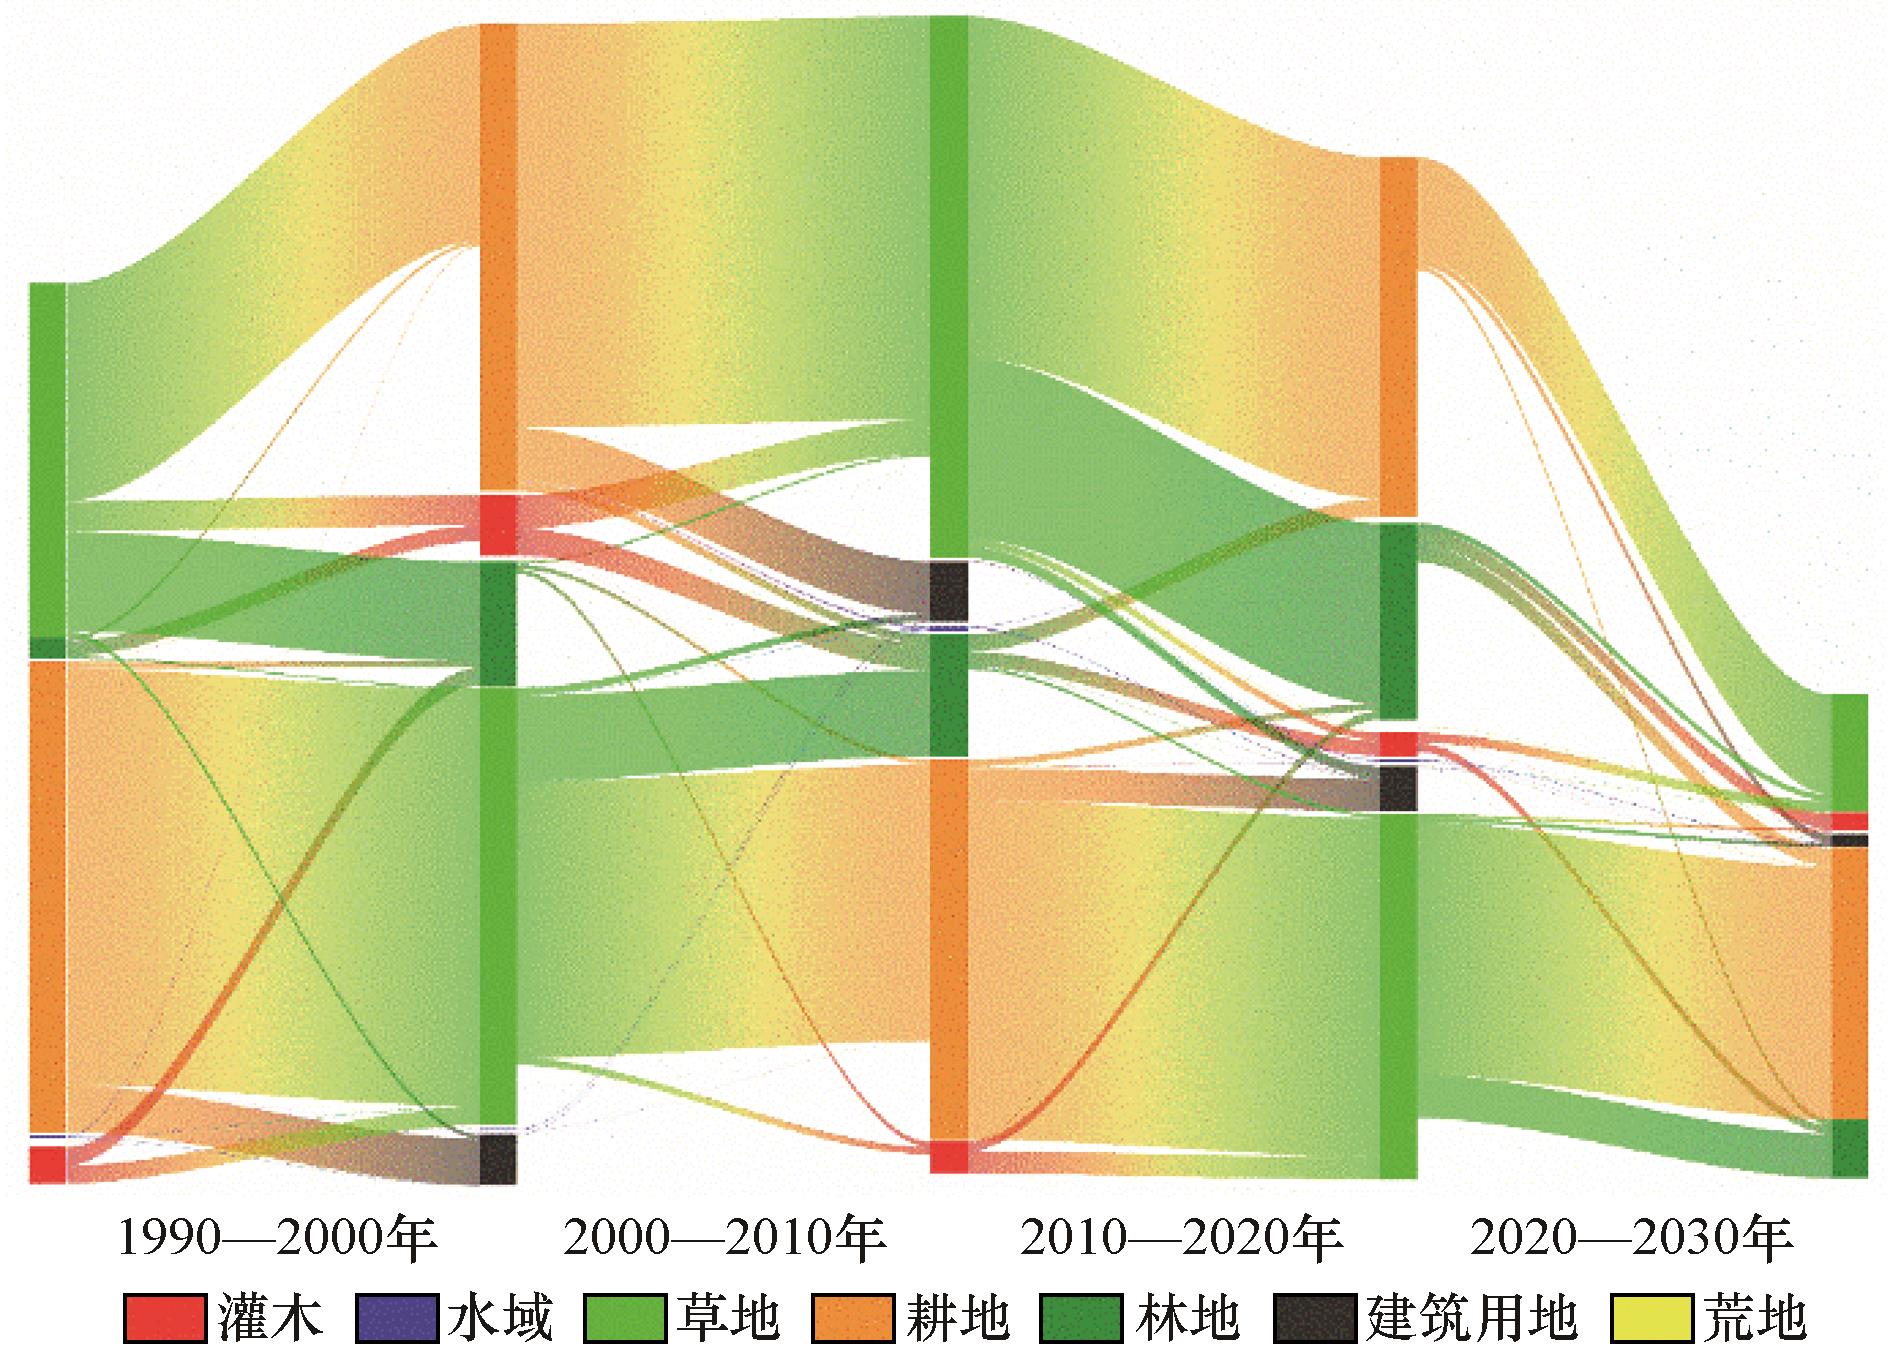
Fig.12 Land use classification changes in the Lvliang Mountain area from 1986 to 2023
| [1] | Higgins S I, Conradi T, Muhoko E.Shifts in vegetation activity of terrestrial ecosystems attributable to climate trends[J].Nature Geoscience,2023,16(2):147-153. |
| [2] | Pausas J G, Bond W J.On the three major recycling pathways in terrestrial ecosystems[J].Trends in Ecology & Evolution,2020,35(9):767-775. |
| [3] | 杜佳瑜,刘宪锋,孙高鹏,等.2003-2018年黄土高原植被光学厚度时空变化及其影响因素[J].中国沙漠,2024,44(3):222-230. |
| [4] | Rouse Jr J W, Haas R H, Deering D,et al.Monitoring the vernal advancement and retrogradation (green wave effect) of natural vegetation[R].College Station,Texas,USA:Texas A & m University,1974. |
| [5] | 申子傲,吴静,李纯斌.2000-2020年河西内陆河流域植被覆盖时空变化特征及其驱动力[J].中国沙漠,2024,44(3):119-127. |
| [6] | 王鹏新,龚健雅,李小文,等.基于植被指数和土地表面温度的干旱监测模型[J].地球科学进展,2003,18(4):527-533. |
| [7] | 杨邦杰,裴志远.农作物长势的定义与遥感监测[J].农业工程学报,1999,15(3):214-218. |
| [8] | 韩子言,蒙吉军,邹易,等.1982-2017年黑河流域植被指数动态及其对气候变化与生态建设工程的响应[J].中国沙漠,2023,43(3):96-106. |
| [9] | 郑元润,周广胜.基于NDVI的中国天然森林植被净第一性生产力模型[J].植物生态学报,2000,24(1):9-12. |
| [10] | 田剑,汤国安,周毅,等.黄土高原沟谷密度空间分异特征研究[J].地理科学,2013,33(5):622-628. |
| [11] | 武永利,李智才,王云峰,等.山西典型生态区植被指数(NDVI)对气候变化的响应[J].生态学杂志,2009,28(5):925-932. |
| [12] | 李孟蔚,栾青,张宁,等.2000-2019年吕梁市植被NDVI时空动态及其影响因素分析[J].水土保持研究,2022,29(4):248-254. |
| [13] | 王贝贝,周淑琴,荆耀栋,等.吕梁山地区植被物候变化及对气候的响应[J].中国农学通报,2021,37(16):102-107. |
| [14] | 孙高鹏,刘宪锋,王小红,等.2001-2020年黄河流域植被覆盖变化及其影响因素[J].中国沙漠,2021,41(4):205-212. |
| [15] | 田智慧,张丹丹,赫晓慧,等.2000-2015年黄河流域植被净初级生产力时空变化特征及其驱动因子[J].水土保持研究,2019,26(2):255-262. |
| [16] | 王娟,何慧娟,董金芳,等.黄河流域植被净初级生产力时空特征及自然驱动因子[J].中国沙漠,2021,41(6):213-222. |
| [17] | 张华,安慧敏.基于GEE的1987-2019年民勤绿洲NDVI变化特征及趋势分析[J].中国沙漠,2021,41(1):28-36. |
| [18] | 杨华庆,朱睿,尹振良,等.2001-2020年黄河流域水源涵养区植被覆盖变化及其对气候变化和人类活动的响应[J].中国沙漠,2024,44(4):57-70. |
| [19] | 王小娜,田金炎,李小娟,等.Google Earth Engine云平台对遥感发展的改变[J].遥感学报,2022,26(2):299-309. |
| [20] | 芦瑞杰,刘树林,康文平,等.结合GEE平台与机器学习算法的荒漠信息提取[J].中国沙漠,2023,43(6):60-70. |
| [21] | Yancho J M M, Jones T G, Gandhi S R,et al.The google earth engine mangrove mapping methodology (Geemmm)[J].Remote Sensing,2020,12(22):3758. |
| [22] | 胡云锋,商令杰,张千力,等.基于GEE平台的1990年以来北京市土地变化格局及驱动机制分析[J].遥感技术与应用,2018,33(4):573-583. |
| [23] | Sidhu N, Pebesma E, Câmara G.Using Google Earth Engine to detect land cover change:Singapore as a use case[J].European Journal of Remote Sensing,2018,51(1):486-500. |
| [24] | Jin Z N, Azzari G, You C,et al.Smallholder maize area and yield mapping at national scales with Google Earth Engine[J].Remote Sensing of Environment,2019,228:115-128. |
| [25] | Amani M, Mahdavi S, Afshar M,et al.Canadian wetland inventory using Google Earth Engine:the first map and preliminary results[J].Remote Sensing,2019,11(7):842. |
| [26] | Patel N N, Angiuli E, Gamba P,et al.Multitemporal settlement and population mapping from Landsat using Google Earth Engine[J].International Journal of Applied Earth Observation and Geoinformation,2015,35(Part B):199-208. |
| [27] | Meng X Y, Gao X, Li S,et al.Monitoring desertification in Mongolia based on Landsat images and Google Earth Engine from 1990 to 2020[J].Ecological Indicators,2021,129:107908. |
| [28] | 张姚姚,刘政鑫,张思悦,等.1957-2020年吕梁山区气候变化特征及影响因素分析[J].太原师范学院学报(自然科学版),2022,21(3):84-91. |
| [29] | 王琰.吕梁山森林生态系统碳密度及空间分布格局[D].太原:山西大学,2019. |
| [30] | 孙从建,李晓明,张文强,等.基于遥感信息的吕梁山贫困区生态安全评价[J].中国环境科学,2019,39(12):5352-5360. |
| [31] | 李慧,王百田,曹远博,等.吕梁山区3种人工林植被、凋落物生物量差异特征及其与土壤养分的关系[J].植物研究,2016,36(4):573-580. |
| [32] | Abatzoglou J T, Dobrowski S Z, Parks S A,et al.TerraClimate,a high-resolution global dataset of monthly climate and climatic water balance from 1958-2015[J].Scientific Data,2018,5(1):1-12. |
| [33] | McNally A, Arsenault K, Kumar S,et al.A land data assimilation system for sub-Saharan Africa food and water security applications[J].Scientific Data,2017,4(1):1-19. |
| [34] | Peng S Z, Ding Y X, Wen Z M,et al.Spatiotemporal change and trend analysis of potential evapotranspiration over the Loess Plateau of China during 2011-2100[J].Agricultural and Forest Meteorology,2017,233:183-194. |
| [35] | Miralles D G, Holmes T, De Jeu R,et al.Global land-surface evaporation estimated from satellite-based observations[J].Hydrology and Earth System Sciences,2011,15(2):453-469. |
| [36] | Peng S Z, Ding Y X, Liu W Z,et al.1 km monthly temperature and precipitation dataset for China from 1901 to 2017[J].Earth System Science Data,2019,11(4):1931-1946. |
| [37] | Abrams M, Crippen R, Fujisada H.ASTER global digital elevation model (GDEM) and ASTER global water body dataset (ASTWBD)[J].Remote Sensing,2020,12(7):1156. |
| [38] | Zhang L X, Ren Z H, Chen B,et al.A prolonged artificial nighttime-light dataset of China (1984-2020)[J].Scientific Data,2024,11(1):414. |
| [39] | Wu Y Z, Shi K F, Chen Z Q,et al.Developing improved time-series DMSP-OLS-like data (1992-2019) in China by integrating DMSP-OLS and SNPP-VIIRS[J].IEEE Transactions on Geoscience and Remote Sensing,2021,60:1-14. |
| [40] | Yang J, Huang X.30 m annual land cover and its dynamics in China from 1990 to 2019[J].Earth System Science Data Discussions,2021,2021:1-29. |
| [41] | 窦永静,王让虎,付含培,等.山西省植被NDVI时空变化及驱动力研究[J].山西大学学报(自然科学版),2023,46(1):244-255. |
| [42] | Sen P K.Estimates of the regression coefficient based on Kendall's tau[J].Journal of the American Statistical Association,1968,63(324):1379-1389. |
| [43] | Theil H.A rank-invariant method of linear and polynomial regression analysis:I,II and III[J].Proceedings of Koninklijke Nederlandse Akademie Vanwetenschappen,1950,53:386-392. |
| [44] | Mann H B.Nonparametric tests against trend[J].Econometrica:Journal of the Econometric Society,1945:245-259. |
| [45] | Kendall M.Rank Correlation Methods[J].Biometrika,1957,44(1/2):298. |
| [46] | 袁丽华,蒋卫国,申文明,等.2000-2010年黄河流域植被覆盖的时空变化[J].生态学报,2013,33(24):7798-7806. |
| [47] | Cai B F, Yu R.Advance and evaluation in the long time series vegetation trends research based on remote sensing[J].Journal of Remote Sensing,2009,13(6):1170-1186. |
| [48] | Hurst H E.Long-term storage capacity of reservoirs[J].Transactions of the American Society of Civil Engineers,1951,116(1):770-799. |
| [49] | Alvarez-Ramirez J, Echeverria J C, Rodriguez E.Is the North Atlantic Oscillation modulated by solar and lunar cycles? some evidences from Hurst autocorrelation analysis[J].Advances in Space Research,2011,47(4):748-756. |
| [50] | 岳辉,刘英.近15 a陕西省植被时空变化与影响因素分析[J].干旱区地理,2019,42(2):314-323. |
| [51] | 王劲峰,徐成东.地理探测器:原理与展望[J].地理学报,2017,72(1):116-134. |
| [52] | Wang J F, Li X H, Christakos G,et al.Geographical detectors‐based health risk assessment and its application in the neural tube defects study of the Heshun Region,China[J].International Journal of Geographical Information Science,2010,24(1):107-127. |
| [53] | Yao B, Gong X W, Li Y L,et al.Spatiotemporal variation and GeoDetector analysis of NDVI at the northern foothills of the Yinshan Mountains in Inner Mongolia over the past 40 years[J].Heliyon,2024,10(20):e39309. |
| [54] | Yang D W, Shao W W, Yeh P J,et al.Impact of vegetation coverage on regional water balance in the nonhumid regions of China[J].Water Resources Research,2009,45(7):W00A14. |
| [55] | Yang H, Luo P, Wang J,et al.Ecosystem evapotranspiration as a response to climate and vegetation coverage changes in Northwest Yunnan,China[J].Plos One,2015,10(8):e0134795. |
| [56] | Gao C, Ren X L, Fan L L,et al.Assessing the vegetation dynamics and its influencing factors in Central Asia from 2001 to 2020[J].Remote Sensing,2023,15(19):4670. |
| [57] | Guo Y J, Cheng L R, Ding A Z,et al.Geodetector model-based quantitative analysis of vegetation change characteristics and driving forces:a case study in the Yongding River basin in China[J].International Journal of Applied Earth Observation and Geoinformation,2024,132:104027. |
| [58] | 彭文甫,张冬梅,罗艳玫,等.自然因子对四川植被NDVI变化的地理探测[J].地理学报,2019,74(9):1758-1776. |
| [59] | Zhang Y, Zhang K C, An Z S,et al.Quantification of driving factors on NDVI in oasis-desert ecotone using geographical detector method[J].Journal of Mountain Science,2019,16(11):2615-2624. |
| [60] | 胡丰,张艳,郭宇,等.基于PLUS和InVEST模型的渭河流域土地利用与生境质量时空变化及预测[J].干旱区地理,2022,45(4):1125-1136. |
| [61] | 解铭威,周慧荻,陈耸,等.2000-2020年山西省吕梁市土地利用时空变化及其驱动因素[J].水土保持通报,2024,44(3):296-306. |
| [62] | 贾一越,齐璇璇,黄蕊,等.山西省植被覆盖度的时空变化及驱动因子[J].应用生态学报,2024,35(4):1073-1082. |
| [63] | 陈丽,梁建娥,郭青霞.基于GIS的忻州市土地利用分区研究[J].山西农业大学学报(自然科学版),2011,31(2):161-165. |
| [64] | 陈霁巍,穆兴民.黄河断流的态势、成因与科学对策[J].自然资源学报,2000,15(1):31-35. |
| [65] | 胡会峰,刘国华.中国天然林保护工程的固碳能力估算[J].生态学报,2006,26(1):291-296. |
| [66] | 问宝旺.退耕还林工程实践与探索[J].山西水土保持科技,2004(4):10-11. |
| [67] | 董彦华.基于森林资源变化的忻州市天然林保护工程实施效果评价[D].山西晋中:山西农业大学,2013. |
| [1] | Lingfei Zhong, Hu Liu, Lihua Zhang. Relationship between NDVI and precipitation in the Hexi Corridor desert area [J]. Journal of Desert Research, 2025, 45(5): 318-327. |
| [2] | Yongjie Liu, Heqiang Du, Yawei Fan, Shengfei Yang. Monitoring of wind erosion desertification process in the Mu Us Desert based on Google Earth Engine (GEE) [J]. Journal of Desert Research, 2025, 45(2): 262-274. |
| [3] | Huaqing Yang, Rui Zhu, Zhenliang Yin, Jian'an Shan, Wei Zhang, Chunshuang Fang. Dynamic changes of vegetation in water conservation area of the Yellow River Basin and its response to climate change and human activities during 2001-2020 [J]. Journal of Desert Research, 2024, 44(4): 57-70. |
| [4] | Xiaoya Yi, Dequan Zhang, Yong Liu, Xurigan, Shengbo Xie. Vegetation change and its response to climate factors in Hanggin Banner,Inner Mongolia, China from 2000 to 2020 [J]. Journal of Desert Research, 2024, 44(3): 51-62. |
| [5] | Ruijie Lu, Shulin Liu, Wenping Kang, Kun Feng, Zichen Guo, Ying Zhi. Combining the GEE platform and machine learning algorithm for desert information extraction [J]. Journal of Desert Research, 2023, 43(6): 60-70. |
| [6] | Jianbing Lu, Ke Ju, Weibin Liao. Variation in NDVI and its response to climate change and human activities in Gansu Province during 2000-2020 [J]. Journal of Desert Research, 2023, 43(4): 118-127. |
| [7] | Ziyan Han, Jijun Meng, Yi Zou, Likai Zhu. Vegetation dynamics and their response to climate change and ecological protection projects in the Heihe River Basin from 1982 to 2017 [J]. Journal of Desert Research, 2023, 43(3): 96-106. |
| [8] | Haixiu He, Aihong Fu, Chuan Wang. Negetation index change and its driving forces of low mountain meadow vegetation in the northwest of Tacheng Region, Xinjiang, China [J]. Journal of Desert Research, 2023, 43(1): 187-196. |
| [9] | Qianqian Wu, Xiao Zhang, Shuxing Xu, Xiaohui Yang, Yanshu Liu, Hanzhi Li, Zhongjie Shi. Climatic responses of NDVI and tree growth in the arid areas of inland Asia and their influencing factors [J]. Journal of Desert Research, 2022, 42(4): 1-10. |
| [10] | Zhenliang Yin, Qi Feng, Lingge Wang, Zexia Chen, Yabin Chang, Rui Zhu. Vegetation coverage change and its influencing factors across the northwest region of China during 2000-2019 [J]. Journal of Desert Research, 2022, 42(4): 11-21. |
| [11] | Yaowen Zhang, Bo Zhang, Rongpeng Yao, Libing Wang. Temporal and spatial changes of vegetation coverage and water production in the Weihe River Basin from 2000 to 2020 [J]. Journal of Desert Research, 2022, 42(2): 223-233. |
| [12] | Zhentao Lv, Shengyu Li, Jinglong Fan, Guojun Liu, Haifeng Wang, Xiaoyu Meng. Natural restoration potential of vegetation in Mongolia [J]. Journal of Desert Research, 2021, 41(5): 192-201. |
| [13] | Xuegang Xing, Changzhen Yan, Junfeng Lu, Xiaohui Zhai, Haowei Jia, Jiali Xie. Response of vegetation index to degraded succession of alpine meadow in Qinghai, China [J]. Journal of Desert Research, 2021, 41(3): 203-213. |
| [14] | Hua Zhang, Huimin An. Analysis of NDVI variation characteristics and trend of Minqin Oasis from 1987 to 2019 based on GEE [J]. Journal of Desert Research, 2021, 41(1): 28-36. |
| [15] | Lei Wu, Changbin Li, Liuming Wang, Xuhong Xie, Yuan Zhang, Jianmei Wei. Division and application of desert-oasis system in arid Northwest China based on ESA-LUC and MODIS-NDVI [J]. Journal of Desert Research, 2020, 40(6): 139-150. |
| Viewed | ||||||
|
Full text |
|
|||||
|
Abstract |
|
|||||
©2018Journal of Desert Research
Tel:0931-8267545
Email:caiedit@lzb.ac.cn;desert@lzb.ac.cn
Support:Magtech