
- CN 62-1070/P
- ISSN 1000-694X
- Bimonthly 1981
Journal of Desert Research ›› 2022, Vol. 42 ›› Issue (5): 232-244.DOI: 10.7522/j.issn.1000-694X.2022.00108
Previous Articles Next Articles
Meng Wang1( ), Junfeng Lu2(), Peng Fu1, Zhibao Dong3
Received:2022-08-13
Revised:2022-09-09
Online:2022-09-20
Published:2022-09-22
Contact:
Junfeng Lu
CLC Number:
Meng Wang, Junfeng Lu, Peng Fu, Zhibao Dong. Characteristics of soil nutrients and grain size around Badain Jaran Desert[J]. Journal of Desert Research, 2022, 42(5): 232-244.
Add to citation manager EndNote|Ris|BibTeX
URL: http://www.desert.ac.cn/EN/10.7522/j.issn.1000-694X.2022.00108

Fig.1 The geographic position of study areas
| 研究区域 | 样地个数 | 经纬度 | 海拔/m | 地貌特征 | 植物种 | 植被盖度/% |
|---|---|---|---|---|---|---|
| 1 | 6 | 39°34′52.37″—39°39′12.96″N、 101°28′39.69″—101°28′44.91″E | 1 263—1 371 | 星状高大沙山,灌丛沙丘,地势平坦 | 白刺(Nitraria tangutorum)、碟果虫实(Corispermum patelliforme)、沙米(Agriophyllum squarrosum) | 12—30 |
| 2 | 4 | 39°43′11.25″—39°43′51.34″N、 102°47′19.47″—102°48′01.88″E | 1 551—1 572 | 新月形沙丘,丘间地 | 霸王(Zygophyllum xanthoxylum)、沙蒿(Artemisia desertorum)、沙米(Agriophyllum squarrosum) | 15—35 |
| 3 | 6 | 40°42′04.38″—40°42′35.24″N、 102°46′38.55″—102°53′34.76″E | 1 457—1 469 | 被砾石覆盖,起伏较小 | 沙蒿(Artemisia desertorum)、沙竹(Psammochloa mongolica)、白刺(Nitraria tangutorum)、 | 5—30 |
| 4 | 3 | 41°20′02.89″—41°24′41.97″N、 102°18′59.78″—102°20′18.18″E | 996—903 | 戈壁,地势平坦 | 泡泡刺(Nitraria sphaerocarpa)、红砂(Reaumuria soongorica)、梭梭(Haloxylon ammodendron)、白刺(Nitraria tangutorum) | 4—30 |
| 5 | 3 | 41°41′34.34″—41°52′52.96″N、 101°42′37.70″—101°45′34.22″E | 895—911 | 灌丛沙丘,雅丹,星状沙丘,地形起伏较大 | 红砂(Reaumuria soongorica)、红柳(Tamarix ramosissima)、梭梭(Haloxylon ammodendron)、白刺(Nitraria tangutorum) | 4—30 |
| 6 | 5 | 40°36′27.10″—40°39′03.40″N、 101°23′58.74″—101°30′33.21″E | 1 072—1 047 | 新月形沙丘链,地形起伏较小 | 阿拉善沙拐枣(Calligonum alaschanicum)、麻黄(Ephedra sinica)、碟果虫实(Corispermum patelliforme) | 9—35 |
| 7 | 3 | 40°17′08.29″—40°17′46.90″N、 99°52′26.04″—99°56′30.13″E | 1 139—1 276 | 灌丛沙丘,新月形沙丘链,地形凹凸 | 白刺(Nitraria tangutorum)、阿拉善沙拐枣(Calligonum alaschanicum)、芦苇(Phragmites australis) | 25—40 |
| 8 | 3 | 39°47′38.85″—39°49′10.80″N、 100°33′08.28″—100°34′14.20″E | 1 276—1 281 | 纵向沙垄,起伏较小,有少量砾石 | 白刺(Nitraria tangutorum)、盐生草(Halogeton glomeratus)、红砂(Reaumuria soongorica)、猪毛菜(Salsola collina) | 15—40 |
Table 1 Geographic overview of eight study areas
| 研究区域 | 样地个数 | 经纬度 | 海拔/m | 地貌特征 | 植物种 | 植被盖度/% |
|---|---|---|---|---|---|---|
| 1 | 6 | 39°34′52.37″—39°39′12.96″N、 101°28′39.69″—101°28′44.91″E | 1 263—1 371 | 星状高大沙山,灌丛沙丘,地势平坦 | 白刺(Nitraria tangutorum)、碟果虫实(Corispermum patelliforme)、沙米(Agriophyllum squarrosum) | 12—30 |
| 2 | 4 | 39°43′11.25″—39°43′51.34″N、 102°47′19.47″—102°48′01.88″E | 1 551—1 572 | 新月形沙丘,丘间地 | 霸王(Zygophyllum xanthoxylum)、沙蒿(Artemisia desertorum)、沙米(Agriophyllum squarrosum) | 15—35 |
| 3 | 6 | 40°42′04.38″—40°42′35.24″N、 102°46′38.55″—102°53′34.76″E | 1 457—1 469 | 被砾石覆盖,起伏较小 | 沙蒿(Artemisia desertorum)、沙竹(Psammochloa mongolica)、白刺(Nitraria tangutorum)、 | 5—30 |
| 4 | 3 | 41°20′02.89″—41°24′41.97″N、 102°18′59.78″—102°20′18.18″E | 996—903 | 戈壁,地势平坦 | 泡泡刺(Nitraria sphaerocarpa)、红砂(Reaumuria soongorica)、梭梭(Haloxylon ammodendron)、白刺(Nitraria tangutorum) | 4—30 |
| 5 | 3 | 41°41′34.34″—41°52′52.96″N、 101°42′37.70″—101°45′34.22″E | 895—911 | 灌丛沙丘,雅丹,星状沙丘,地形起伏较大 | 红砂(Reaumuria soongorica)、红柳(Tamarix ramosissima)、梭梭(Haloxylon ammodendron)、白刺(Nitraria tangutorum) | 4—30 |
| 6 | 5 | 40°36′27.10″—40°39′03.40″N、 101°23′58.74″—101°30′33.21″E | 1 072—1 047 | 新月形沙丘链,地形起伏较小 | 阿拉善沙拐枣(Calligonum alaschanicum)、麻黄(Ephedra sinica)、碟果虫实(Corispermum patelliforme) | 9—35 |
| 7 | 3 | 40°17′08.29″—40°17′46.90″N、 99°52′26.04″—99°56′30.13″E | 1 139—1 276 | 灌丛沙丘,新月形沙丘链,地形凹凸 | 白刺(Nitraria tangutorum)、阿拉善沙拐枣(Calligonum alaschanicum)、芦苇(Phragmites australis) | 25—40 |
| 8 | 3 | 39°47′38.85″—39°49′10.80″N、 100°33′08.28″—100°34′14.20″E | 1 276—1 281 | 纵向沙垄,起伏较小,有少量砾石 | 白刺(Nitraria tangutorum)、盐生草(Halogeton glomeratus)、红砂(Reaumuria soongorica)、猪毛菜(Salsola collina) | 15—40 |
研究 区域 | 统计 参数 | OM /% | TN /(g·kg-1) | TP /(g·kg-1) | TK /(g·kg-1) | AN /(mg·kg-1) | AP /(mg·kg-1) | AK /(mg·kg-1) | pH | EC /(μS·cm-1) |
|---|---|---|---|---|---|---|---|---|---|---|
| 1 | 最小值 | 0.14 | 0.08 | 0.30 | 12.50 | 6.70 | 1.08 | 259.95 | 8.26 | 3.38 |
| 最大值 | 0.32 | 0.20 | 0.65 | 14.20 | 170.80 | 3.42 | 399.94 | 9.88 | 40.70 | |
| 平均值 | 0.21 | 0.17 | 0.41 | 13.36 | 49.67 | 2.39 | 323.28 | 9.29 | 16.13 | |
| CV/% | 33.49 | 28.66 | 31.34 | 5.09 | 129.22 | 40.61 | 17.89 | 8.00 | 117.07 | |
| 2 | 最小值 | 0.15 | 0.04 | 0.13 | 7.84 | 6.70 | 0.67 | 319.94 | 8.16 | 1.06 |
| 最大值 | 0.77 | 0.07 | 0.26 | 13.06 | 18.08 | 4.38 | 359.94 | 9.60 | 40.70 | |
| 平均值 | 0.33 | 0.05 | 0.20 | 10.11 | 11.22 | 1.91 | 337.44 | 9.13 | 11.96 | |
| CV/% | 90.61 | 29.01 | 30.67 | 21.47 | 43.16 | 87.73 | 5.06 | 7.17 | 160.40 | |
| 3 | 最小值 | 0.01 | 0.05 | 0.33 | 8.69 | 10.05 | 2.32 | 269.95 | 8.37 | 1.12 |
| 最大值 | 0.29 | 0.14 | 0.47 | 14.21 | 16.74 | 4.38 | 419.94 | 9.90 | 40.20 | |
| 平均值 | 0.08 | 0.07 | 0.40 | 11.89 | 13.38 | 3.42 | 344.95 | 9.33 | 9.49 | |
| CV/% | 126.13 | 42.65 | 13.92 | 16.17 | 20.98 | 23.41 | 17.08 | 6.38 | 159.75 | |
| 4 | 最小值 | 0.18 | 0.05 | 0.33 | 10.18 | 3.43 | 1.50 | 209.96 | 9.19 | 3.67 |
| 最大值 | 0.26 | 0.08 | 0.37 | 11.35 | 89.16 | 18.40 | 929.89 | 10.13 | 219.00 | |
| 平均值 | 0.23 | 0.07 | 0.35 | 10.62 | 37.72 | 12.58 | 539.91 | 9.75 | 141.56 | |
| CV/% | 17.55 | 16.82 | 5.46 | 5.94 | 120.26 | 76.33 | 67.36 | 5.06 | 84.57 | |
| 5 | 最小值 | 0.24 | 0.06 | 0.33 | 9.74 | 12.34 | 1.91 | 299.94 | 8.71 | 23.00 |
| 最大值 | 0.24 | 0.07 | 0.34 | 14.75 | 19.89 | 6.58 | 799.81 | 9.20 | 34.50 | |
| 平均值 | 0.24 | 0.07 | 0.34 | 12.24 | 16.12 | 4.24 | 549.87 | 8.96 | 28.75 | |
| CV/% | 0.38 | 7.78 | 0.57 | 28.91 | 33.11 | 77.82 | 64.28 | 3.87 | 28.28 | |
| 6 | 最小值 | 0.18 | 0.04 | 0.24 | 10.01 | 1.37 | 0.12 | 169.98 | 8.99 | 1.02 |
| 最大值 | 0.31 | 0.08 | 0.48 | 14.18 | 13.03 | 5.48 | 479.91 | 10.00 | 4.85 | |
| 平均值 | 0.23 | 0.06 | 0.39 | 12.54 | 6.86 | 2.49 | 307.94 | 9.70 | 3.13 | |
| CV/% | 21.76 | 29.13 | 25.72 | 13.12 | 60.42 | 99.88 | 36.55 | 4.23 | 48.18 | |
| 7 | 最小值 | 0.27 | 0.06 | 0.41 | 10.17 | 20.57 | 2.87 | 529.88 | 8.94 | 14.14 |
| 最大值 | 0.60 | 0.13 | 0.75 | 17.07 | 85.73 | 4.24 | 889.80 | 10.00 | 61.20 | |
| 平均值 | 0.41 | 0.08 | 0.54 | 13.15 | 45.72 | 3.65 | 759.84 | 9.56 | 32.08 | |
| CV/% | 41.77 | 45.75 | 34.41 | 26.99 | 76.61 | 19.32 | 26.28 | 5.79 | 79.31 | |
| 8 | 最小值 | 0.28 | 0.05 | 0.37 | 9.00 | 3.43 | 1.50 | 229.95 | 9.45 | 4.68 |
| 最大值 | 0.37 | 0.08 | 0.57 | 12.70 | 6.86 | 1.77 | 309.95 | 9.53 | 4.99 | |
| 平均值 | 0.34 | 0.06 | 0.48 | 11.13 | 5.72 | 1.59 | 269.95 | 9.48 | 4.82 | |
| CV/% | 16.30 | 20.72 | 20.82 | 17.16 | 34.63 | 9.98 | 14.82 | 0.49 | 3.24 |
Table 2 Statistical eigenvalues of nutrients content in 0-20 cm soil layer of study areas
研究 区域 | 统计 参数 | OM /% | TN /(g·kg-1) | TP /(g·kg-1) | TK /(g·kg-1) | AN /(mg·kg-1) | AP /(mg·kg-1) | AK /(mg·kg-1) | pH | EC /(μS·cm-1) |
|---|---|---|---|---|---|---|---|---|---|---|
| 1 | 最小值 | 0.14 | 0.08 | 0.30 | 12.50 | 6.70 | 1.08 | 259.95 | 8.26 | 3.38 |
| 最大值 | 0.32 | 0.20 | 0.65 | 14.20 | 170.80 | 3.42 | 399.94 | 9.88 | 40.70 | |
| 平均值 | 0.21 | 0.17 | 0.41 | 13.36 | 49.67 | 2.39 | 323.28 | 9.29 | 16.13 | |
| CV/% | 33.49 | 28.66 | 31.34 | 5.09 | 129.22 | 40.61 | 17.89 | 8.00 | 117.07 | |
| 2 | 最小值 | 0.15 | 0.04 | 0.13 | 7.84 | 6.70 | 0.67 | 319.94 | 8.16 | 1.06 |
| 最大值 | 0.77 | 0.07 | 0.26 | 13.06 | 18.08 | 4.38 | 359.94 | 9.60 | 40.70 | |
| 平均值 | 0.33 | 0.05 | 0.20 | 10.11 | 11.22 | 1.91 | 337.44 | 9.13 | 11.96 | |
| CV/% | 90.61 | 29.01 | 30.67 | 21.47 | 43.16 | 87.73 | 5.06 | 7.17 | 160.40 | |
| 3 | 最小值 | 0.01 | 0.05 | 0.33 | 8.69 | 10.05 | 2.32 | 269.95 | 8.37 | 1.12 |
| 最大值 | 0.29 | 0.14 | 0.47 | 14.21 | 16.74 | 4.38 | 419.94 | 9.90 | 40.20 | |
| 平均值 | 0.08 | 0.07 | 0.40 | 11.89 | 13.38 | 3.42 | 344.95 | 9.33 | 9.49 | |
| CV/% | 126.13 | 42.65 | 13.92 | 16.17 | 20.98 | 23.41 | 17.08 | 6.38 | 159.75 | |
| 4 | 最小值 | 0.18 | 0.05 | 0.33 | 10.18 | 3.43 | 1.50 | 209.96 | 9.19 | 3.67 |
| 最大值 | 0.26 | 0.08 | 0.37 | 11.35 | 89.16 | 18.40 | 929.89 | 10.13 | 219.00 | |
| 平均值 | 0.23 | 0.07 | 0.35 | 10.62 | 37.72 | 12.58 | 539.91 | 9.75 | 141.56 | |
| CV/% | 17.55 | 16.82 | 5.46 | 5.94 | 120.26 | 76.33 | 67.36 | 5.06 | 84.57 | |
| 5 | 最小值 | 0.24 | 0.06 | 0.33 | 9.74 | 12.34 | 1.91 | 299.94 | 8.71 | 23.00 |
| 最大值 | 0.24 | 0.07 | 0.34 | 14.75 | 19.89 | 6.58 | 799.81 | 9.20 | 34.50 | |
| 平均值 | 0.24 | 0.07 | 0.34 | 12.24 | 16.12 | 4.24 | 549.87 | 8.96 | 28.75 | |
| CV/% | 0.38 | 7.78 | 0.57 | 28.91 | 33.11 | 77.82 | 64.28 | 3.87 | 28.28 | |
| 6 | 最小值 | 0.18 | 0.04 | 0.24 | 10.01 | 1.37 | 0.12 | 169.98 | 8.99 | 1.02 |
| 最大值 | 0.31 | 0.08 | 0.48 | 14.18 | 13.03 | 5.48 | 479.91 | 10.00 | 4.85 | |
| 平均值 | 0.23 | 0.06 | 0.39 | 12.54 | 6.86 | 2.49 | 307.94 | 9.70 | 3.13 | |
| CV/% | 21.76 | 29.13 | 25.72 | 13.12 | 60.42 | 99.88 | 36.55 | 4.23 | 48.18 | |
| 7 | 最小值 | 0.27 | 0.06 | 0.41 | 10.17 | 20.57 | 2.87 | 529.88 | 8.94 | 14.14 |
| 最大值 | 0.60 | 0.13 | 0.75 | 17.07 | 85.73 | 4.24 | 889.80 | 10.00 | 61.20 | |
| 平均值 | 0.41 | 0.08 | 0.54 | 13.15 | 45.72 | 3.65 | 759.84 | 9.56 | 32.08 | |
| CV/% | 41.77 | 45.75 | 34.41 | 26.99 | 76.61 | 19.32 | 26.28 | 5.79 | 79.31 | |
| 8 | 最小值 | 0.28 | 0.05 | 0.37 | 9.00 | 3.43 | 1.50 | 229.95 | 9.45 | 4.68 |
| 最大值 | 0.37 | 0.08 | 0.57 | 12.70 | 6.86 | 1.77 | 309.95 | 9.53 | 4.99 | |
| 平均值 | 0.34 | 0.06 | 0.48 | 11.13 | 5.72 | 1.59 | 269.95 | 9.48 | 4.82 | |
| CV/% | 16.30 | 20.72 | 20.82 | 17.16 | 34.63 | 9.98 | 14.82 | 0.49 | 3.24 |
研究 区域 | 统计 参数 | OM /% | TN /(g·kg-1) | TP /(g·kg-1) | TK /(g·kg-1) | AN /(mg·kg-1) | AP /(mg·kg-1) | AK /(mg·kg-1) | pH | EC /(μS·cm-1) |
|---|---|---|---|---|---|---|---|---|---|---|
| 1 | 最小值 | 0.11 | 0.11 | 0.25 | 12.36 | 8.71 | 0.12 | 199.97 | 8.32 | 3.91 |
| 最大值 | 0.42 | 0.19 | 0.65 | 17.46 | 28.13 | 3.15 | 389.94 | 9.89 | 40.60 | |
| 平均值 | 0.20 | 0.16 | 0.40 | 14.39 | 15.07 | 1.86 | 299.95 | 9.53 | 11.01 | |
| CV/% | 58.13 | 19.31 | 33.41 | 12.20 | 50.49 | 64.38 | 24.49 | 6.26 | 132.55 | |
| 2 | 最小值 | 0.11 | 0.05 | 0.15 | 9.38 | 6.70 | 0.12 | 329.94 | 8.41 | 0.78 |
| 最大值 | 0.33 | 0.07 | 0.21 | 13.90 | 154.04 | 1.08 | 349.95 | 9.47 | 40.30 | |
| 平均值 | 0.20 | 0.06 | 0.18 | 10.91 | 47.72 | 0.50 | 334.96 | 9.03 | 11.68 | |
| CV/% | 44.66 | 12.18 | 16.24 | 18.72 | 149.02 | 84.88 | 2.98 | 5.53 | 163.64 | |
| 3 | 最小值 | 0.02 | 0.05 | 0.19 | 10.19 | 7.54 | 1.36 | 249.96 | 8.28 | 3.05 |
| 最大值 | 0.15 | 0.15 | 0.42 | 13.51 | 13.40 | 4.38 | 379.91 | 9.92 | 40.20 | |
| 平均值 | 0.07 | 0.10 | 0.32 | 12.37 | 10.41 | 2.64 | 323.27 | 9.19 | 15.79 | |
| CV/% | 99.89 | 53.17 | 38.34 | 15.27 | 28.13 | 59.14 | 20.59 | 9.09 | 133.92 | |
| 4 | 最小值 | 0.11 | 0.05 | 0.40 | 9.37 | 6.86 | 1.22 | 159.96 | 9.17 | 3.68 |
| 最大值 | 0.31 | 0.13 | 0.59 | 11.55 | 27.44 | 33.51 | 639.87 | 10.22 | 214.00 | |
| 平均值 | 0.24 | 0.09 | 0.48 | 10.76 | 17.15 | 16.24 | 453.26 | 9.76 | 94.89 | |
| CV/% | 45.49 | 44.93 | 20.68 | 11.23 | 60.00 | 100.10 | 56.73 | 5.49 | 113.71 | |
| 5 | 最小值 | 0.20 | 0.06 | 0.25 | 8.87 | 6.86 | 3.56 | 279.95 | 9.11 | 32.90 |
| 最大值 | 0.26 | 0.11 | 0.35 | 15.37 | 6.86 | 6.03 | 779.85 | 9.28 | 121.20 | |
| 平均值 | 0.23 | 0.08 | 0.30 | 12.12 | 6.86 | 4.79 | 529.90 | 9.20 | 77.05 | |
| CV/% | 17.70 | 37.82 | 22.22 | 37.93 | 0.01 | 36.46 | 66.71 | 1.31 | 81.04 | |
| 6 | 最小值 | 0.20 | 0.05 | 0.15 | 9.50 | 0.69 | 0.40 | 179.96 | 8.82 | 3.16 |
| 最大值 | 0.25 | 0.08 | 0.48 | 15.23 | 6.86 | 7.40 | 409.90 | 10.12 | 4.61 | |
| 平均值 | 0.23 | 0.06 | 0.35 | 11.45 | 5.62 | 2.57 | 311.92 | 9.72 | 3.83 | |
| CV/% | 8.53 | 14.85 | 38.60 | 19.91 | 49.08 | 115.23 | 31.52 | 5.32 | 18.04 | |
| 7 | 最小值 | 0.23 | 0.05 | 0.40 | 10.02 | 19.20 | 1.77 | 689.83 | 8.85 | 24.30 |
| 最大值 | 0.35 | 0.11 | 0.42 | 14.38 | 89.15 | 12.35 | 869.80 | 10.12 | 43.70 | |
| 平均值 | 0.29 | 0.08 | 0.41 | 12.20 | 54.18 | 7.06 | 779.81 | 9.49 | 34.00 | |
| CV/% | 30.55 | 45.52 | 1.90 | 25.30 | 91.29 | 105.93 | 16.32 | 9.47 | 40.35 | |
| 8 | 最小值 | 0.30 | 0.05 | 0.37 | 10.70 | 6.86 | 0.95 | 169.99 | 9.52 | 4.69 |
| 最大值 | 0.35 | 0.09 | 0.53 | 11.04 | 6.86 | 1.09 | 229.95 | 9.53 | 5.46 | |
| 平均值 | 0.32 | 0.07 | 0.45 | 10.87 | 6.86 | 1.02 | 199.97 | 9.53 | 5.08 | |
| CV/% | 10.48 | 45.08 | 25.42 | 2.24 | 0.00 | 9.56 | 21.20 | 0.07 | 10.73 |
Table 3 Statistical eigenvalues of nutrients content in 20-40 cm soil layer of study areas
研究 区域 | 统计 参数 | OM /% | TN /(g·kg-1) | TP /(g·kg-1) | TK /(g·kg-1) | AN /(mg·kg-1) | AP /(mg·kg-1) | AK /(mg·kg-1) | pH | EC /(μS·cm-1) |
|---|---|---|---|---|---|---|---|---|---|---|
| 1 | 最小值 | 0.11 | 0.11 | 0.25 | 12.36 | 8.71 | 0.12 | 199.97 | 8.32 | 3.91 |
| 最大值 | 0.42 | 0.19 | 0.65 | 17.46 | 28.13 | 3.15 | 389.94 | 9.89 | 40.60 | |
| 平均值 | 0.20 | 0.16 | 0.40 | 14.39 | 15.07 | 1.86 | 299.95 | 9.53 | 11.01 | |
| CV/% | 58.13 | 19.31 | 33.41 | 12.20 | 50.49 | 64.38 | 24.49 | 6.26 | 132.55 | |
| 2 | 最小值 | 0.11 | 0.05 | 0.15 | 9.38 | 6.70 | 0.12 | 329.94 | 8.41 | 0.78 |
| 最大值 | 0.33 | 0.07 | 0.21 | 13.90 | 154.04 | 1.08 | 349.95 | 9.47 | 40.30 | |
| 平均值 | 0.20 | 0.06 | 0.18 | 10.91 | 47.72 | 0.50 | 334.96 | 9.03 | 11.68 | |
| CV/% | 44.66 | 12.18 | 16.24 | 18.72 | 149.02 | 84.88 | 2.98 | 5.53 | 163.64 | |
| 3 | 最小值 | 0.02 | 0.05 | 0.19 | 10.19 | 7.54 | 1.36 | 249.96 | 8.28 | 3.05 |
| 最大值 | 0.15 | 0.15 | 0.42 | 13.51 | 13.40 | 4.38 | 379.91 | 9.92 | 40.20 | |
| 平均值 | 0.07 | 0.10 | 0.32 | 12.37 | 10.41 | 2.64 | 323.27 | 9.19 | 15.79 | |
| CV/% | 99.89 | 53.17 | 38.34 | 15.27 | 28.13 | 59.14 | 20.59 | 9.09 | 133.92 | |
| 4 | 最小值 | 0.11 | 0.05 | 0.40 | 9.37 | 6.86 | 1.22 | 159.96 | 9.17 | 3.68 |
| 最大值 | 0.31 | 0.13 | 0.59 | 11.55 | 27.44 | 33.51 | 639.87 | 10.22 | 214.00 | |
| 平均值 | 0.24 | 0.09 | 0.48 | 10.76 | 17.15 | 16.24 | 453.26 | 9.76 | 94.89 | |
| CV/% | 45.49 | 44.93 | 20.68 | 11.23 | 60.00 | 100.10 | 56.73 | 5.49 | 113.71 | |
| 5 | 最小值 | 0.20 | 0.06 | 0.25 | 8.87 | 6.86 | 3.56 | 279.95 | 9.11 | 32.90 |
| 最大值 | 0.26 | 0.11 | 0.35 | 15.37 | 6.86 | 6.03 | 779.85 | 9.28 | 121.20 | |
| 平均值 | 0.23 | 0.08 | 0.30 | 12.12 | 6.86 | 4.79 | 529.90 | 9.20 | 77.05 | |
| CV/% | 17.70 | 37.82 | 22.22 | 37.93 | 0.01 | 36.46 | 66.71 | 1.31 | 81.04 | |
| 6 | 最小值 | 0.20 | 0.05 | 0.15 | 9.50 | 0.69 | 0.40 | 179.96 | 8.82 | 3.16 |
| 最大值 | 0.25 | 0.08 | 0.48 | 15.23 | 6.86 | 7.40 | 409.90 | 10.12 | 4.61 | |
| 平均值 | 0.23 | 0.06 | 0.35 | 11.45 | 5.62 | 2.57 | 311.92 | 9.72 | 3.83 | |
| CV/% | 8.53 | 14.85 | 38.60 | 19.91 | 49.08 | 115.23 | 31.52 | 5.32 | 18.04 | |
| 7 | 最小值 | 0.23 | 0.05 | 0.40 | 10.02 | 19.20 | 1.77 | 689.83 | 8.85 | 24.30 |
| 最大值 | 0.35 | 0.11 | 0.42 | 14.38 | 89.15 | 12.35 | 869.80 | 10.12 | 43.70 | |
| 平均值 | 0.29 | 0.08 | 0.41 | 12.20 | 54.18 | 7.06 | 779.81 | 9.49 | 34.00 | |
| CV/% | 30.55 | 45.52 | 1.90 | 25.30 | 91.29 | 105.93 | 16.32 | 9.47 | 40.35 | |
| 8 | 最小值 | 0.30 | 0.05 | 0.37 | 10.70 | 6.86 | 0.95 | 169.99 | 9.52 | 4.69 |
| 最大值 | 0.35 | 0.09 | 0.53 | 11.04 | 6.86 | 1.09 | 229.95 | 9.53 | 5.46 | |
| 平均值 | 0.32 | 0.07 | 0.45 | 10.87 | 6.86 | 1.02 | 199.97 | 9.53 | 5.08 | |
| CV/% | 10.48 | 45.08 | 25.42 | 2.24 | 0.00 | 9.56 | 21.20 | 0.07 | 10.73 |
| 土壤养分 | OM | TN | TP | TK | AN | AP | AK | pH | EC |
|---|---|---|---|---|---|---|---|---|---|
| t检验P值 | 0.480 | 0.431 | 0.335 | 0.834 | 0.638 | 0.802 | 0.620 | 0.759 | 0.971 |
Table 4 The t-test of soil nutrients at 0-20 cm and 20-40 cm
| 土壤养分 | OM | TN | TP | TK | AN | AP | AK | pH | EC |
|---|---|---|---|---|---|---|---|---|---|
| t检验P值 | 0.480 | 0.431 | 0.335 | 0.834 | 0.638 | 0.802 | 0.620 | 0.759 | 0.971 |
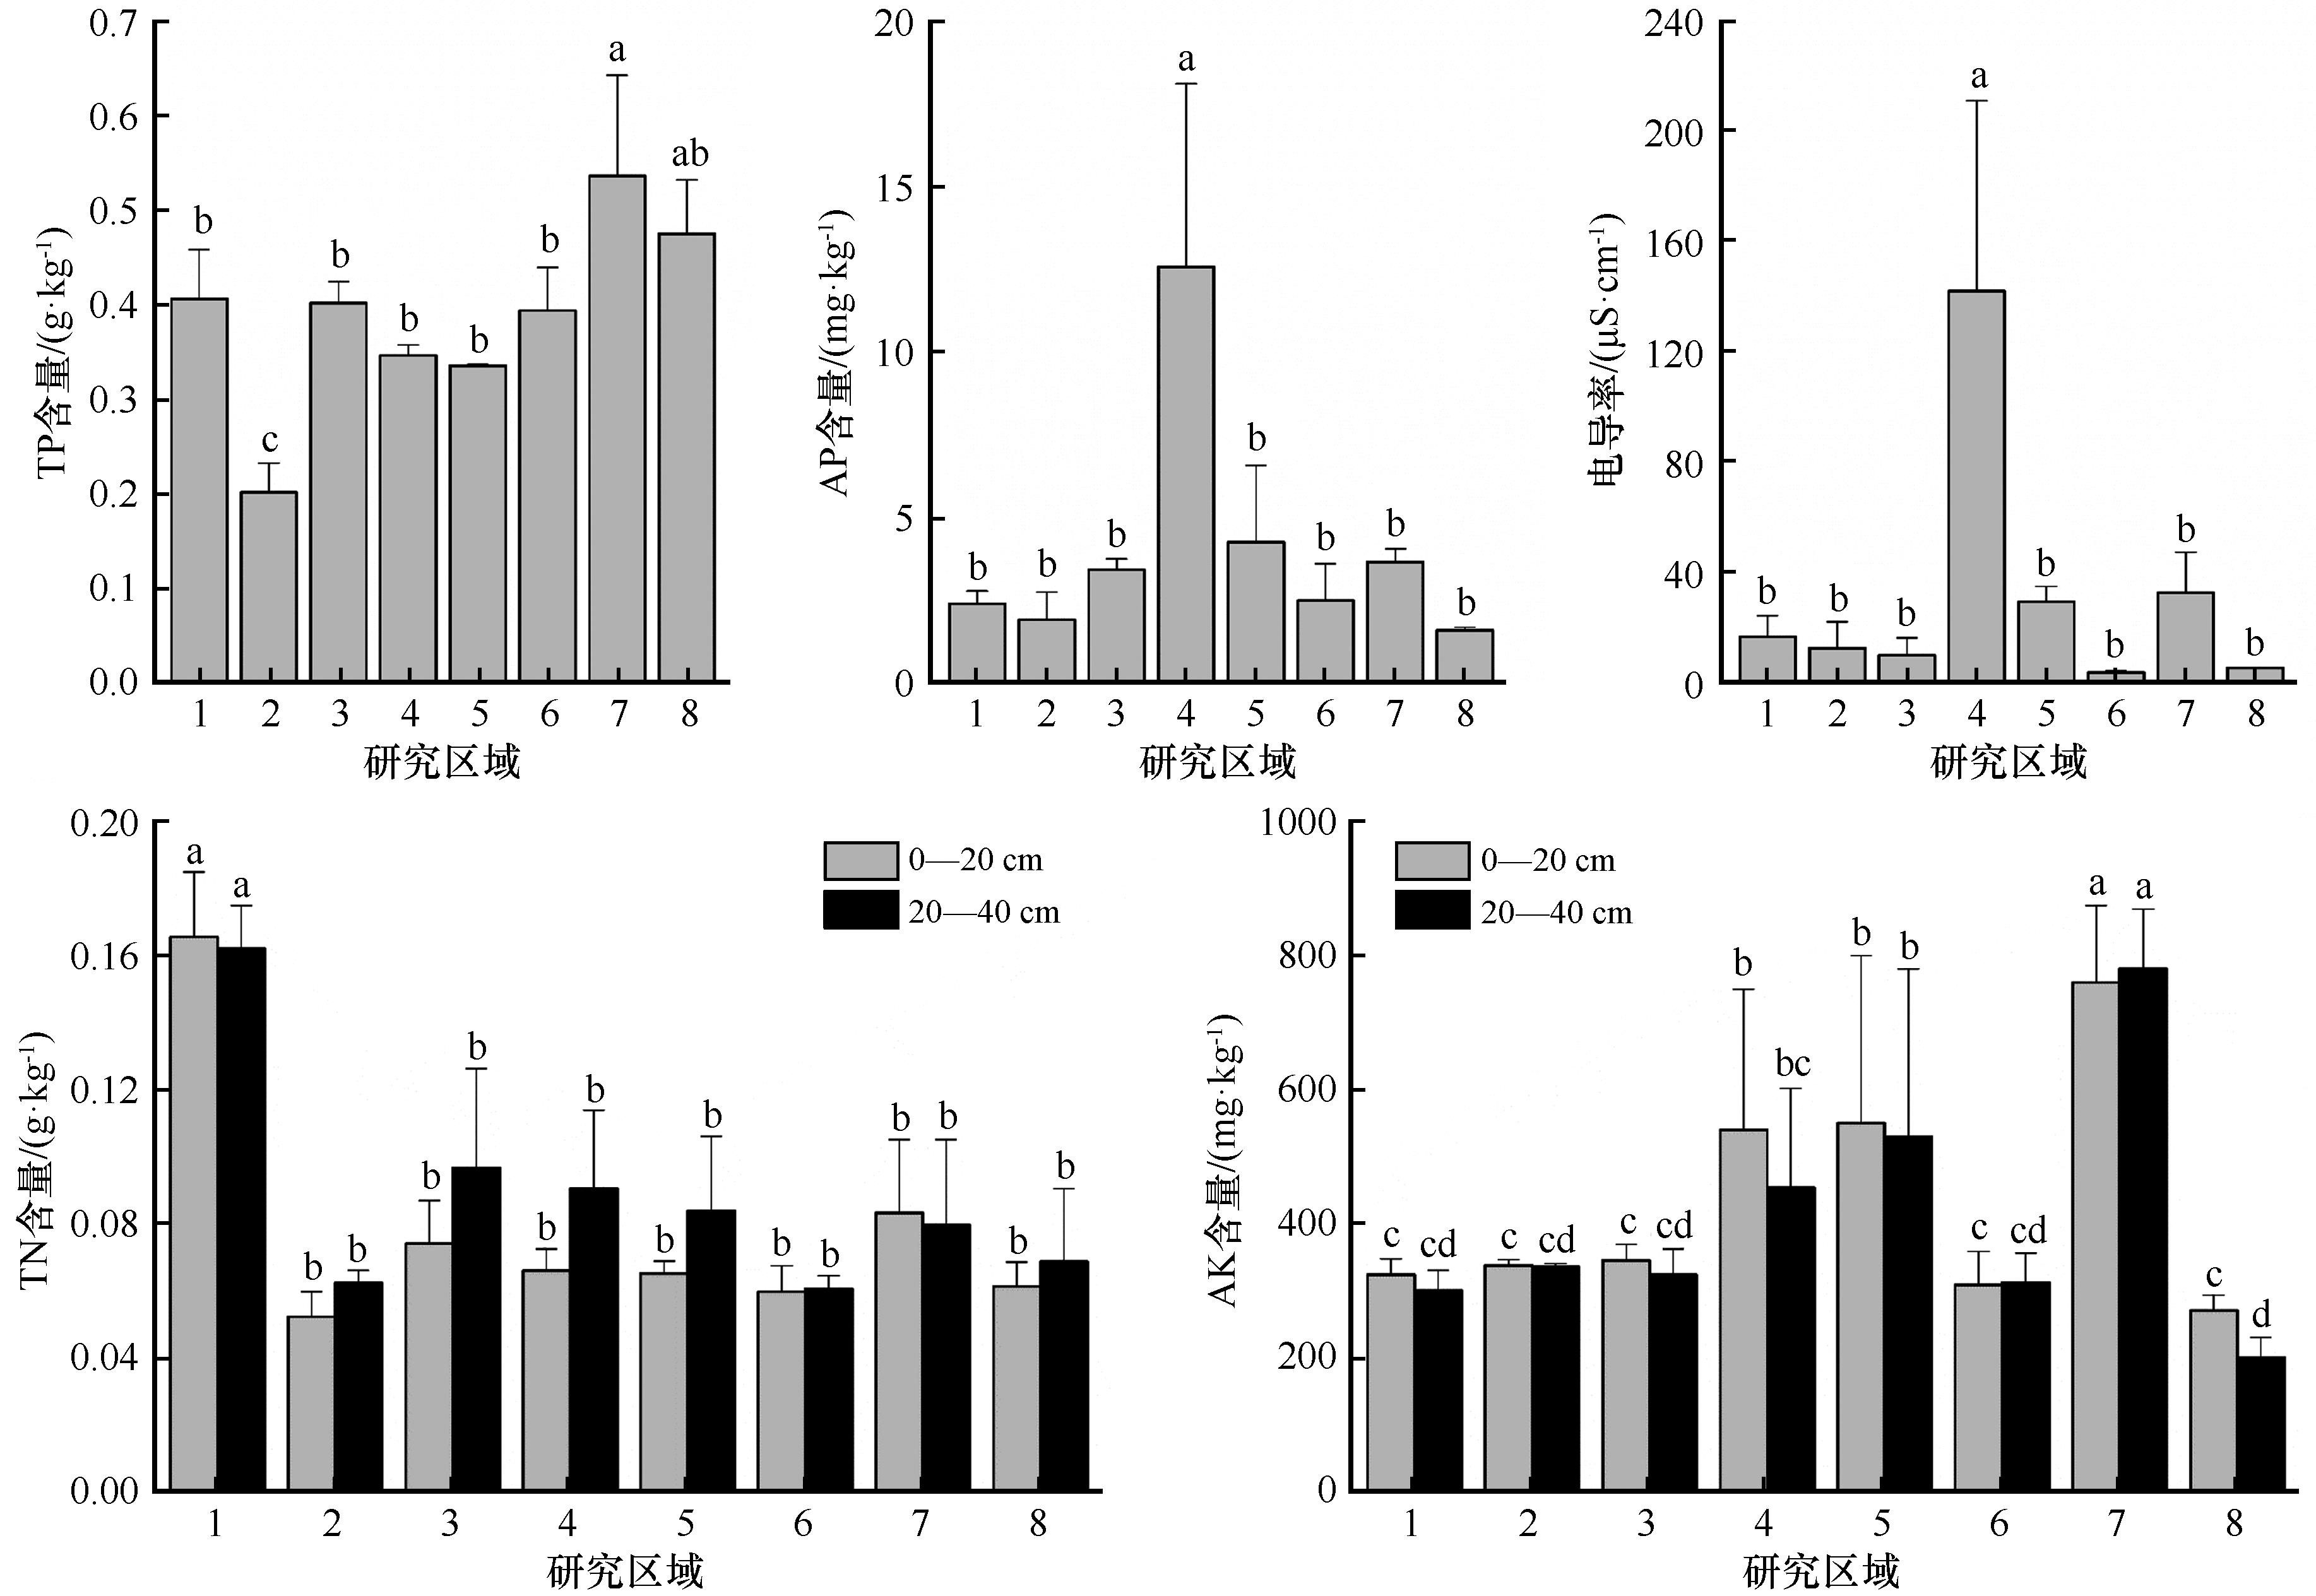
Fig.2 Regional differences of nutrients content of study areas
| 粒级 | 统计 参数 | 研究区域 | |||||||
|---|---|---|---|---|---|---|---|---|---|
| 1 | 2 | 3 | 4 | 5 | 6 | 7 | 8 | ||
黏土 <0.005 mm | 最小值 | 0.00 | 0.00 | 0.00 | 0.00 | 0.48 | 0.00 | 0.00 | 0.97 |
| 最大值 | 1.88 | 1.25 | 1.81 | 4.74 | 39.21 | 1.66 | 6.75 | 2.27 | |
| 平均值 | 1.25 | 0.31 | 0.67 | 2.01 | 19.84 | 0.33 | 3.48 | 1.51 | |
| CV/% | 52.34 | 200.00 | 124.99 | 121.71 | 138.02 | 223.61 | 97.01 | 44.81 | |
| 粉沙 0.005—0.063 mm | 最小值 | 0.62 | 0.12 | 0.01 | 2.16 | 2.84 | 0.01 | 0.71 | 2.13 |
| 最大值 | 7.24 | 5.18 | 4.98 | 7.96 | 48.47 | 5.93 | 13.22 | 6.30 | |
| 平均值 | 4.28 | 1.66 | 2.18 | 4.79 | 25.65 | 1.49 | 8.82 | 4.07 | |
| CV/% | 51.08 | 144.07 | 83.28 | 61.4 | 125.79 | 169.13 | 79.71 | 51.49 | |
| 极细沙 0.063—0.125 mm | 最小值 | 20.51 | 11.83 | 3.98 | 20.86 | 3.68 | 6.41 | 17.12 | 21.61 |
| 最大值 | 31.80 | 17.76 | 21.01 | 33.95 | 35.05 | 13.32 | 31.19 | 33.63 | |
| 平均值 | 27.82 | 15.59 | 12.42 | 29.42 | 19.37 | 8.87 | 24.11 | 27.64 | |
| CV/% | 18.44 | 17.52 | 58.89 | 25.21 | 114.52 | 30.57 | 29.17 | 21.74 | |
| 细沙 0.125—0.25 mm | 最小值 | 38.24 | 42.54 | 20.77 | 36.35 | 4.50 | 20.54 | 30.26 | 39.03 |
| 最大值 | 56.39 | 47.26 | 50.63 | 49.60 | 43.86 | 32.08 | 54.89 | 41.86 | |
| 平均值 | 44.62 | 45.40 | 37.27 | 43.25 | 24.18 | 25.82 | 39.93 | 40.13 | |
| CV/% | 14.59 | 4.45 | 29.97 | 15.36 | 115.12 | 18.62 | 32.92 | 3.79 | |
| 中沙 0.25—0.5 mm | 最小值 | 10.05 | 27.21 | 24.40 | 10.06 | 3.59 | 20.29 | 12.16 | 8.37 |
| 最大值 | 17.43 | 38.59 | 51.05 | 12.98 | 14.28 | 33.37 | 23.49 | 19.69 | |
| 平均值 | 13.51 | 31.76 | 35.19 | 11.31 | 8.94 | 27.01 | 17.01 | 14.19 | |
| CV/% | 22.92 | 15.41 | 27.25 | 13.26 | 84.56 | 17.78 | 34.34 | 39.96 | |
| 粗沙 0.5—1 mm | 最小值 | 0.31 | 2.18 | 0.63 | 0.00 | 0.55 | 15.41 | 0.53 | 5.21 |
| 最大值 | 12.44 | 6.70 | 30.44 | 11.18 | 3.29 | 29.27 | 8.67 | 12.23 | |
| 平均值 | 5.12 | 4.29 | 11.09 | 3.73 | 1.92 | 24.43 | 5.13 | 8.11 | |
| CV/% | 82.13 | 46.11 | 97.59 | 173.20 | 100.99 | 23.5 | 81.31 | 45.25 | |
| 极粗沙 >1 mm | 最小值 | 0.41 | 0.00 | 0.00 | 0.00 | 0.00 | 6.57 | 0.52 | 3.99 |
| 最大值 | 8.74 | 2.54 | 5.38 | 16.48 | 0.21 | 19.68 | 2.85 | 4.75 | |
| 平均值 | 3.40 | 0.98 | 1.18 | 5.49 | 0.10 | 12.05 | 1.52 | 4.36 | |
| CV/% | 86.88 | 124.91 | 177.37 | 173.20 | 141.42 | 44.24 | 78.61 | 8.74 | |
Table 5 Statistical eigenvalues of grain sizes in 0-20 cm soil layer of study areas
| 粒级 | 统计 参数 | 研究区域 | |||||||
|---|---|---|---|---|---|---|---|---|---|
| 1 | 2 | 3 | 4 | 5 | 6 | 7 | 8 | ||
黏土 <0.005 mm | 最小值 | 0.00 | 0.00 | 0.00 | 0.00 | 0.48 | 0.00 | 0.00 | 0.97 |
| 最大值 | 1.88 | 1.25 | 1.81 | 4.74 | 39.21 | 1.66 | 6.75 | 2.27 | |
| 平均值 | 1.25 | 0.31 | 0.67 | 2.01 | 19.84 | 0.33 | 3.48 | 1.51 | |
| CV/% | 52.34 | 200.00 | 124.99 | 121.71 | 138.02 | 223.61 | 97.01 | 44.81 | |
| 粉沙 0.005—0.063 mm | 最小值 | 0.62 | 0.12 | 0.01 | 2.16 | 2.84 | 0.01 | 0.71 | 2.13 |
| 最大值 | 7.24 | 5.18 | 4.98 | 7.96 | 48.47 | 5.93 | 13.22 | 6.30 | |
| 平均值 | 4.28 | 1.66 | 2.18 | 4.79 | 25.65 | 1.49 | 8.82 | 4.07 | |
| CV/% | 51.08 | 144.07 | 83.28 | 61.4 | 125.79 | 169.13 | 79.71 | 51.49 | |
| 极细沙 0.063—0.125 mm | 最小值 | 20.51 | 11.83 | 3.98 | 20.86 | 3.68 | 6.41 | 17.12 | 21.61 |
| 最大值 | 31.80 | 17.76 | 21.01 | 33.95 | 35.05 | 13.32 | 31.19 | 33.63 | |
| 平均值 | 27.82 | 15.59 | 12.42 | 29.42 | 19.37 | 8.87 | 24.11 | 27.64 | |
| CV/% | 18.44 | 17.52 | 58.89 | 25.21 | 114.52 | 30.57 | 29.17 | 21.74 | |
| 细沙 0.125—0.25 mm | 最小值 | 38.24 | 42.54 | 20.77 | 36.35 | 4.50 | 20.54 | 30.26 | 39.03 |
| 最大值 | 56.39 | 47.26 | 50.63 | 49.60 | 43.86 | 32.08 | 54.89 | 41.86 | |
| 平均值 | 44.62 | 45.40 | 37.27 | 43.25 | 24.18 | 25.82 | 39.93 | 40.13 | |
| CV/% | 14.59 | 4.45 | 29.97 | 15.36 | 115.12 | 18.62 | 32.92 | 3.79 | |
| 中沙 0.25—0.5 mm | 最小值 | 10.05 | 27.21 | 24.40 | 10.06 | 3.59 | 20.29 | 12.16 | 8.37 |
| 最大值 | 17.43 | 38.59 | 51.05 | 12.98 | 14.28 | 33.37 | 23.49 | 19.69 | |
| 平均值 | 13.51 | 31.76 | 35.19 | 11.31 | 8.94 | 27.01 | 17.01 | 14.19 | |
| CV/% | 22.92 | 15.41 | 27.25 | 13.26 | 84.56 | 17.78 | 34.34 | 39.96 | |
| 粗沙 0.5—1 mm | 最小值 | 0.31 | 2.18 | 0.63 | 0.00 | 0.55 | 15.41 | 0.53 | 5.21 |
| 最大值 | 12.44 | 6.70 | 30.44 | 11.18 | 3.29 | 29.27 | 8.67 | 12.23 | |
| 平均值 | 5.12 | 4.29 | 11.09 | 3.73 | 1.92 | 24.43 | 5.13 | 8.11 | |
| CV/% | 82.13 | 46.11 | 97.59 | 173.20 | 100.99 | 23.5 | 81.31 | 45.25 | |
| 极粗沙 >1 mm | 最小值 | 0.41 | 0.00 | 0.00 | 0.00 | 0.00 | 6.57 | 0.52 | 3.99 |
| 最大值 | 8.74 | 2.54 | 5.38 | 16.48 | 0.21 | 19.68 | 2.85 | 4.75 | |
| 平均值 | 3.40 | 0.98 | 1.18 | 5.49 | 0.10 | 12.05 | 1.52 | 4.36 | |
| CV/% | 86.88 | 124.91 | 177.37 | 173.20 | 141.42 | 44.24 | 78.61 | 8.74 | |
| 粒级 | 统计 参数 | 研究区域 | |||||||
|---|---|---|---|---|---|---|---|---|---|
| 1 | 2 | 3 | 4 | 5 | 6 | 7 | 8 | ||
黏土 <0.005 mm | 最小值 | 0.00 | 0.00 | 0.44 | 0.00 | 0.81 | 0.00 | 0.00 | 1.16 |
| 最大值 | 4.31 | 2.33 | 14.02 | 6.36 | 9.96 | 2.20 | 3.41 | 2.46 | |
| 平均值 | 1.64 | 0.58 | 5.81 | 3.11 | 5.39 | 0.44 | 1.71 | 1.81 | |
| CV/% | 87.64 | 200.00 | 124.49 | 102.18 | 120.05 | 223.61 | 141.42 | 50.73 | |
粉沙 0.005—0.063 mm | 最小值 | 2.47 | 0.00 | 1.66 | 1.86 | 0.37 | 0.00 | 0.59 | 2.40 |
| 最大值 | 11.44 | 7.33 | 40.60 | 11.68 | 16.32 | 5.89 | 11.56 | 4.52 | |
| 平均值 | 5.49 | 2.54 | 16.25 | 7.86 | 8.35 | 1.75 | 6.08 | 3.46 | |
| CV/% | 68.41 | 128.85 | 130.65 | 66.90 | 135.10 | 135.19 | 127.64 | 43.35 | |
极细沙 0.063—0.125 mm | 最小值 | 19.60 | 9.59 | 15.69 | 18.14 | 11.08 | 5.57 | 22.73 | 11.57 |
| 最大值 | 33.00 | 19.27 | 19.64 | 38.55 | 26.05 | 16.01 | 28.30 | 26.47 | |
| 平均值 | 26.88 | 15.16 | 17.14 | 30.27 | 18.57 | 10.64 | 25.52 | 19.02 | |
| CV/% | 22.15 | 28.64 | 12.68 | 35.47 | 57.01 | 42.92 | 15.45 | 55.40 | |
细沙 0.125—0.25 mm | 最小值 | 33.88 | 41.44 | 14.83 | 33.05 | 34.04 | 21.11 | 41.33 | 23.42 |
| 最大值 | 49.86 | 48.07 | 47.14 | 41.85 | 55.74 | 40.58 | 54.15 | 40.03 | |
| 平均值 | 43.50 | 45.27 | 34.46 | 38.14 | 44.89 | 29.28 | 47.74 | 31.73 | |
| CV/% | 13.22 | 6.80 | 50.02 | 11.95 | 34.18 | 24.83 | 19.00 | 37.01 | |
中沙 0.25—0.5 mm | 最小值 | 9.47 | 27.76 | 10.16 | 6.59 | 16.94 | 20.26 | 15.63 | 13.43 |
| 最大值 | 19.47 | 37.31 | 30.59 | 10.37 | 26.24 | 34.96 | 19.97 | 21.05 | |
| 平均值 | 13.80 | 31.95 | 21.78 | 8.43 | 21.59 | 27.18 | 17.80 | 17.24 | |
| CV/% | 32.75 | 12.39 | 48.22 | 22.47 | 30.47 | 22.03 | 17.27 | 31.24 | |
粗沙 0.5—1 mm | 最小值 | 1.84 | 2.37 | 0.75 | 0.00 | 0.08 | 7.72 | 1.00 | 7.95 |
| 最大值 | 9.55 | 5.35 | 5.80 | 14.05 | 2.36 | 29.08 | 1.15 | 25.64 | |
| 平均值 | 5.57 | 4.05 | 3.46 | 4.68 | 1.22 | 20.52 | 1.07 | 16.80 | |
| CV/% | 60.75 | 33.13 | 73.54 | 173.21 | 132.02 | 40.07 | 9.90 | 74.46 | |
极粗沙 >1 mm | 最小值 | 0.22 | 0.00 | 0.00 | 0.00 | 0.00 | 2.82 | 0.00 | 5.15 |
| 最大值 | 6.01 | 1.63 | 3.06 | 22.53 | 0.00 | 15.60 | 0.18 | 14.76 | |
| 平均值 | 3.12 | 0.44 | 1.11 | 7.51 | 0.00 | 10.18 | 0.09 | 9.95 | |
| CV/% | 69.20 | 178.71 | 153.75 | 173.21 | 0.00 | 50.56 | 141.42 | 68.41 | |
Table 6 Statistical eigenvalues of grain sizes in 20-40 cm soil layer of study areas
| 粒级 | 统计 参数 | 研究区域 | |||||||
|---|---|---|---|---|---|---|---|---|---|
| 1 | 2 | 3 | 4 | 5 | 6 | 7 | 8 | ||
黏土 <0.005 mm | 最小值 | 0.00 | 0.00 | 0.44 | 0.00 | 0.81 | 0.00 | 0.00 | 1.16 |
| 最大值 | 4.31 | 2.33 | 14.02 | 6.36 | 9.96 | 2.20 | 3.41 | 2.46 | |
| 平均值 | 1.64 | 0.58 | 5.81 | 3.11 | 5.39 | 0.44 | 1.71 | 1.81 | |
| CV/% | 87.64 | 200.00 | 124.49 | 102.18 | 120.05 | 223.61 | 141.42 | 50.73 | |
粉沙 0.005—0.063 mm | 最小值 | 2.47 | 0.00 | 1.66 | 1.86 | 0.37 | 0.00 | 0.59 | 2.40 |
| 最大值 | 11.44 | 7.33 | 40.60 | 11.68 | 16.32 | 5.89 | 11.56 | 4.52 | |
| 平均值 | 5.49 | 2.54 | 16.25 | 7.86 | 8.35 | 1.75 | 6.08 | 3.46 | |
| CV/% | 68.41 | 128.85 | 130.65 | 66.90 | 135.10 | 135.19 | 127.64 | 43.35 | |
极细沙 0.063—0.125 mm | 最小值 | 19.60 | 9.59 | 15.69 | 18.14 | 11.08 | 5.57 | 22.73 | 11.57 |
| 最大值 | 33.00 | 19.27 | 19.64 | 38.55 | 26.05 | 16.01 | 28.30 | 26.47 | |
| 平均值 | 26.88 | 15.16 | 17.14 | 30.27 | 18.57 | 10.64 | 25.52 | 19.02 | |
| CV/% | 22.15 | 28.64 | 12.68 | 35.47 | 57.01 | 42.92 | 15.45 | 55.40 | |
细沙 0.125—0.25 mm | 最小值 | 33.88 | 41.44 | 14.83 | 33.05 | 34.04 | 21.11 | 41.33 | 23.42 |
| 最大值 | 49.86 | 48.07 | 47.14 | 41.85 | 55.74 | 40.58 | 54.15 | 40.03 | |
| 平均值 | 43.50 | 45.27 | 34.46 | 38.14 | 44.89 | 29.28 | 47.74 | 31.73 | |
| CV/% | 13.22 | 6.80 | 50.02 | 11.95 | 34.18 | 24.83 | 19.00 | 37.01 | |
中沙 0.25—0.5 mm | 最小值 | 9.47 | 27.76 | 10.16 | 6.59 | 16.94 | 20.26 | 15.63 | 13.43 |
| 最大值 | 19.47 | 37.31 | 30.59 | 10.37 | 26.24 | 34.96 | 19.97 | 21.05 | |
| 平均值 | 13.80 | 31.95 | 21.78 | 8.43 | 21.59 | 27.18 | 17.80 | 17.24 | |
| CV/% | 32.75 | 12.39 | 48.22 | 22.47 | 30.47 | 22.03 | 17.27 | 31.24 | |
粗沙 0.5—1 mm | 最小值 | 1.84 | 2.37 | 0.75 | 0.00 | 0.08 | 7.72 | 1.00 | 7.95 |
| 最大值 | 9.55 | 5.35 | 5.80 | 14.05 | 2.36 | 29.08 | 1.15 | 25.64 | |
| 平均值 | 5.57 | 4.05 | 3.46 | 4.68 | 1.22 | 20.52 | 1.07 | 16.80 | |
| CV/% | 60.75 | 33.13 | 73.54 | 173.21 | 132.02 | 40.07 | 9.90 | 74.46 | |
极粗沙 >1 mm | 最小值 | 0.22 | 0.00 | 0.00 | 0.00 | 0.00 | 2.82 | 0.00 | 5.15 |
| 最大值 | 6.01 | 1.63 | 3.06 | 22.53 | 0.00 | 15.60 | 0.18 | 14.76 | |
| 平均值 | 3.12 | 0.44 | 1.11 | 7.51 | 0.00 | 10.18 | 0.09 | 9.95 | |
| CV/% | 69.20 | 178.71 | 153.75 | 173.21 | 0.00 | 50.56 | 141.42 | 68.41 | |
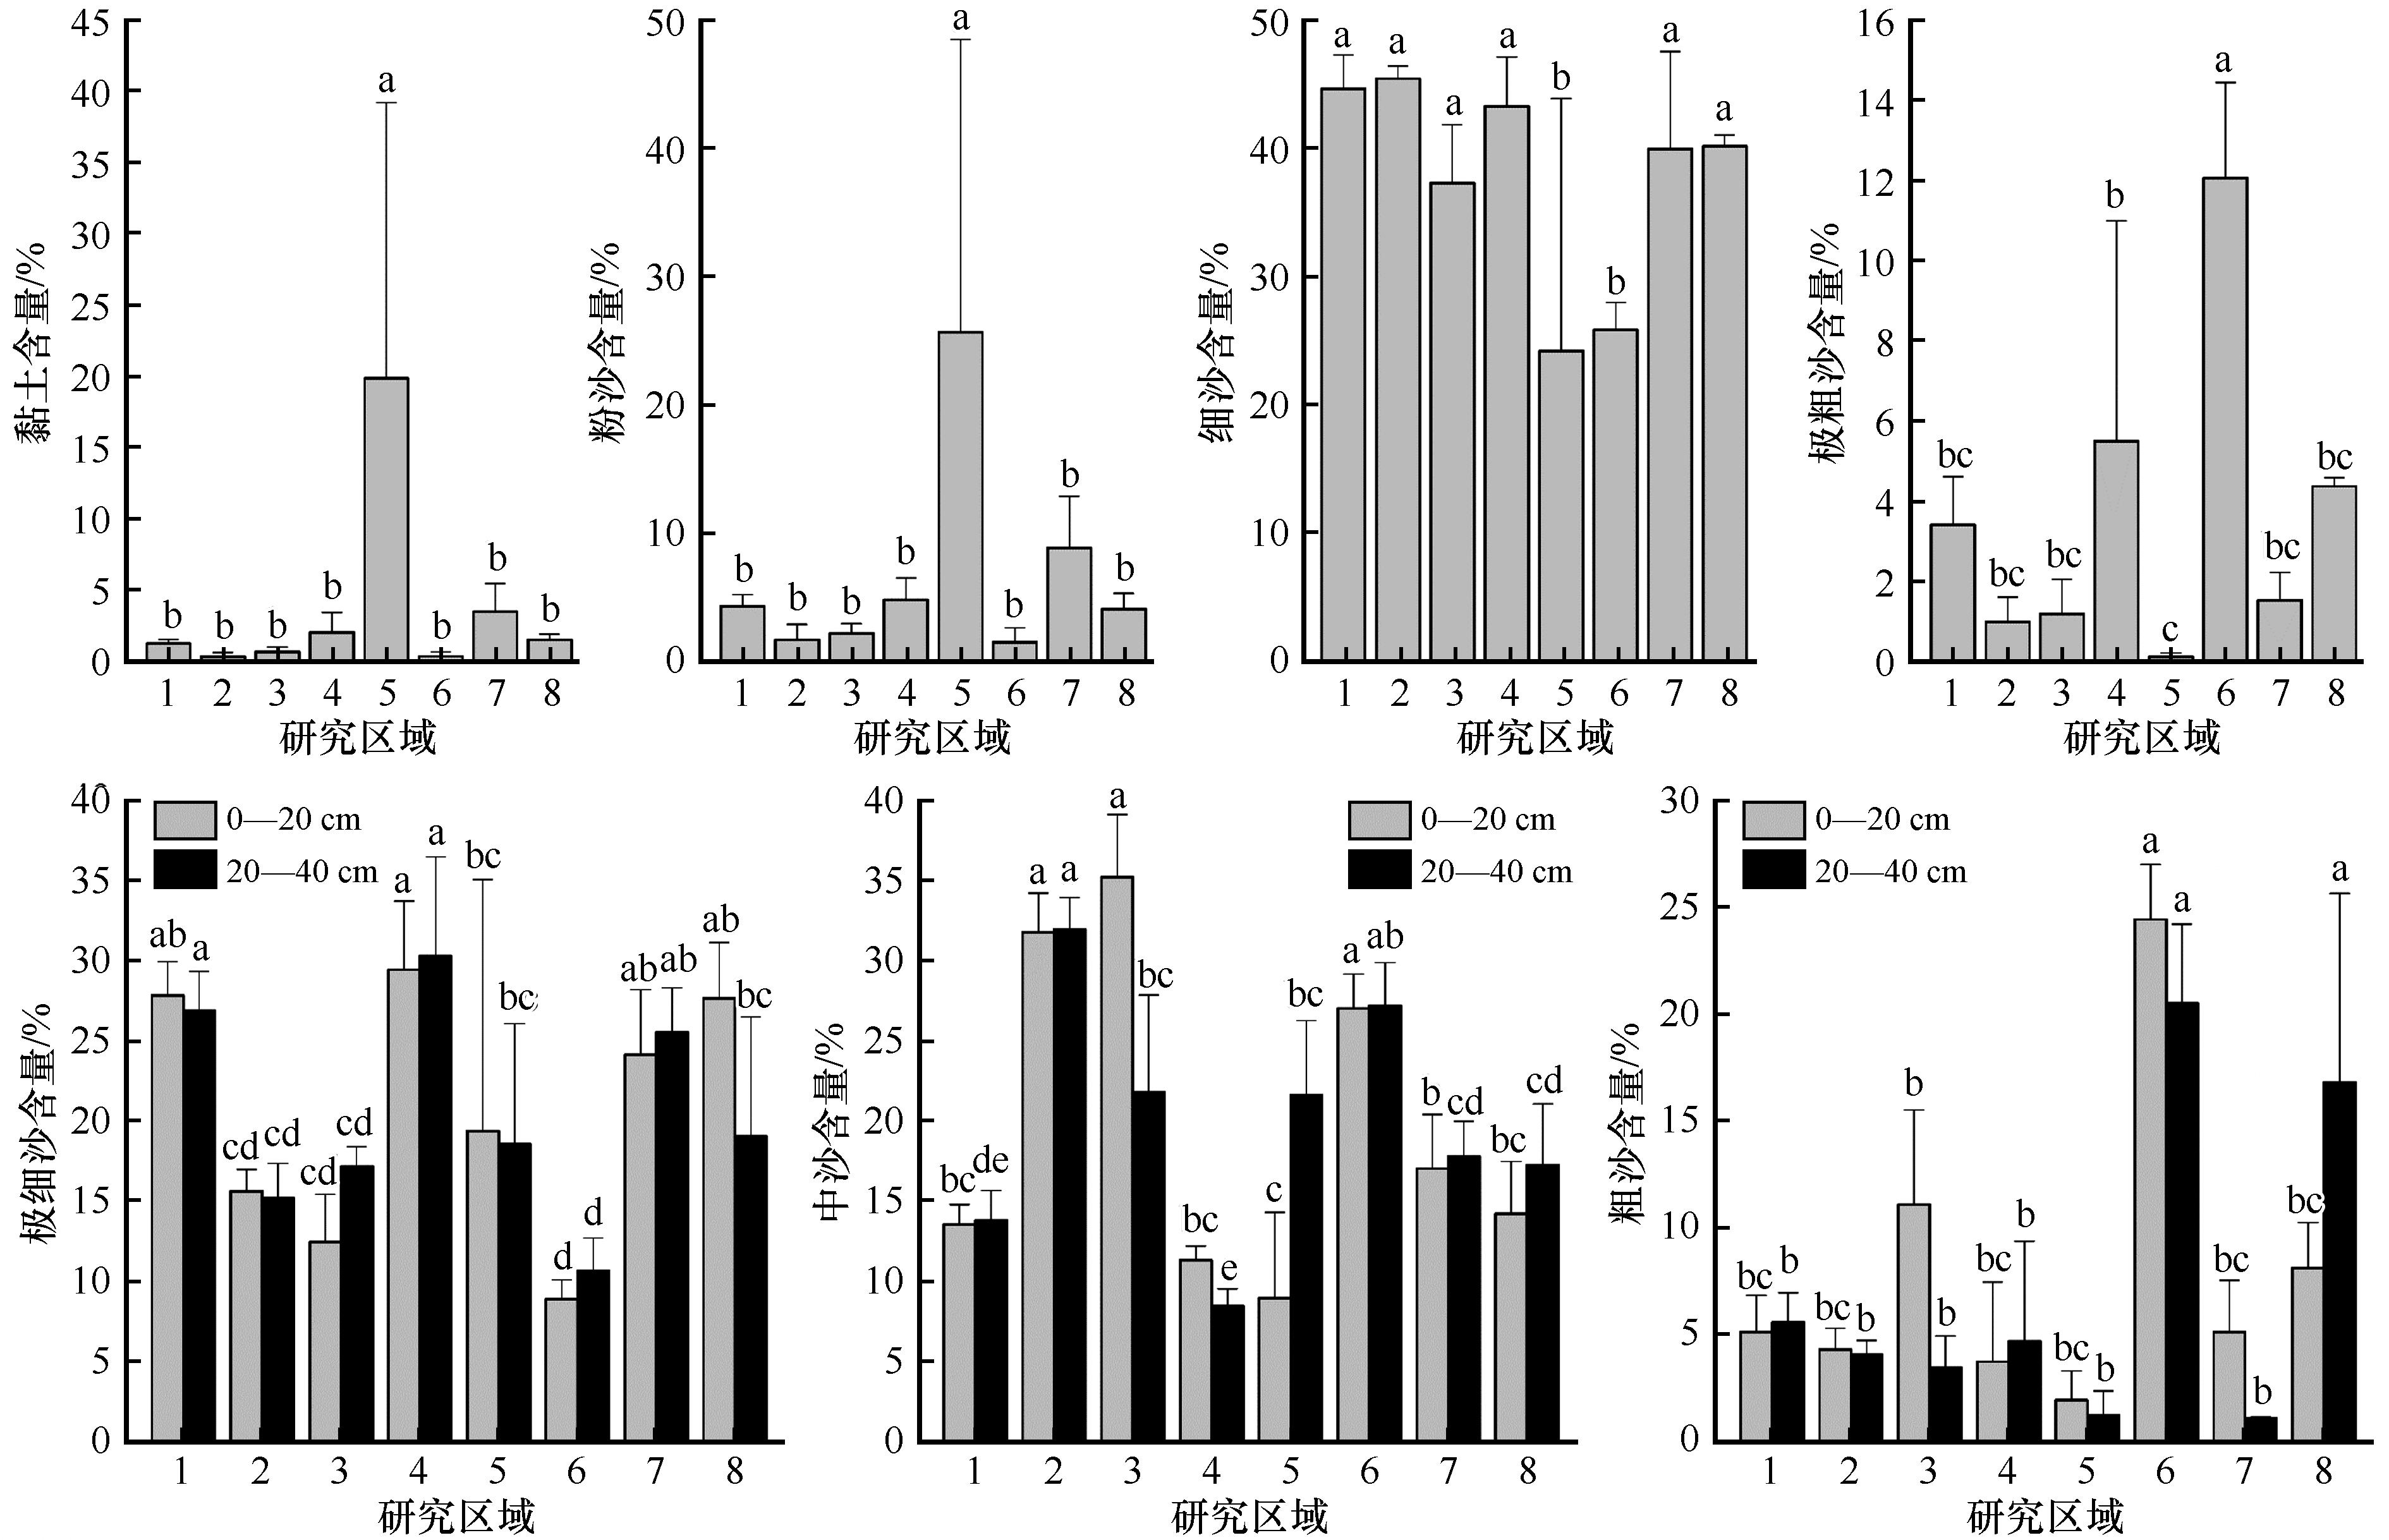
Fig.3 Regional differences of grain sizes of study areas
| 土层 | 土壤养分 | Clay | S | VFS | FS | MS | CS | VCS |
|---|---|---|---|---|---|---|---|---|
| 0—20 cm | OM | 0.103 | 0.189 | 0.218 | 0.035 | -0.279 | -0.166 | -0.060 |
| TN | -0.019 | 0.025 | 0.266 | 0.121 | -0.204 | -0.129 | -0.129 | |
| TP | 0.036 | 0.125 | 0.149 | -0.120 | -0.141 | 0.021 | -0.024 | |
| TK | 0.335 | 0.385* | -0.215 | -0.426* | -0.035 | 0.171 | 0.021 | |
| AN | 0.048 | 0.090 | 0.375* | 0.155 | -0.284 | -0.250 | -0.227 | |
| AP | 0.218 | 0.235 | 0.267 | 0.105 | -0.313 | -0.306 | -0.216 | |
| AK | 0.526** | 0.596** | 0.103 | -0.167 | -0.308 | -0.318 | -0.311 | |
| pH | -0.150 | -0.091 | 0.183 | -0.025 | -0.188 | 0.118 | 0.242 | |
| EC | 0.091 | 0.119 | 0.384* | 0.219 | -0.284 | -0.354* | -0.303 | |
| 20—40 cm | OM | -0.067 | -0.135 | 0.129 | -0.063 | -0.104 | 0.166 | 0.053 |
| TN | 0.005 | -0.013 | 0.410* | 0.298 | -0.329 | -0.250 | -0.230 | |
| TP | 0.195 | 0.228 | 0.407* | -0.242 | -0.548** | 0.041 | 0.150 | |
| TK | 0.483* | 0.480* | 0.149 | -0.093 | -0.192 | -0.250 | -0.333 | |
| AN | -0.105 | -0.071 | 0.178 | 0.258 | 0.005 | -0.220 | -0.225 | |
| AP | 0.395* | 0.297 | 0.420* | 0.024 | -0.353 | -0.320 | -0.286 | |
| AK | 0.303 | 0.206 | 0.264 | 0.235 | -0.084 | -0.442* | -0.458* | |
| pH | 0.113 | 0.073 | 0.155 | -0.206 | -0.336 | 0.168 | 0.214 | |
| EC | 0.418* | 0.247 | 0.354 | 0.104 | -0.244 | -0.380 | -0.343 |
Table 7 The correlation coefficients between soil grain sizes and nutrients in the study areas
| 土层 | 土壤养分 | Clay | S | VFS | FS | MS | CS | VCS |
|---|---|---|---|---|---|---|---|---|
| 0—20 cm | OM | 0.103 | 0.189 | 0.218 | 0.035 | -0.279 | -0.166 | -0.060 |
| TN | -0.019 | 0.025 | 0.266 | 0.121 | -0.204 | -0.129 | -0.129 | |
| TP | 0.036 | 0.125 | 0.149 | -0.120 | -0.141 | 0.021 | -0.024 | |
| TK | 0.335 | 0.385* | -0.215 | -0.426* | -0.035 | 0.171 | 0.021 | |
| AN | 0.048 | 0.090 | 0.375* | 0.155 | -0.284 | -0.250 | -0.227 | |
| AP | 0.218 | 0.235 | 0.267 | 0.105 | -0.313 | -0.306 | -0.216 | |
| AK | 0.526** | 0.596** | 0.103 | -0.167 | -0.308 | -0.318 | -0.311 | |
| pH | -0.150 | -0.091 | 0.183 | -0.025 | -0.188 | 0.118 | 0.242 | |
| EC | 0.091 | 0.119 | 0.384* | 0.219 | -0.284 | -0.354* | -0.303 | |
| 20—40 cm | OM | -0.067 | -0.135 | 0.129 | -0.063 | -0.104 | 0.166 | 0.053 |
| TN | 0.005 | -0.013 | 0.410* | 0.298 | -0.329 | -0.250 | -0.230 | |
| TP | 0.195 | 0.228 | 0.407* | -0.242 | -0.548** | 0.041 | 0.150 | |
| TK | 0.483* | 0.480* | 0.149 | -0.093 | -0.192 | -0.250 | -0.333 | |
| AN | -0.105 | -0.071 | 0.178 | 0.258 | 0.005 | -0.220 | -0.225 | |
| AP | 0.395* | 0.297 | 0.420* | 0.024 | -0.353 | -0.320 | -0.286 | |
| AK | 0.303 | 0.206 | 0.264 | 0.235 | -0.084 | -0.442* | -0.458* | |
| pH | 0.113 | 0.073 | 0.155 | -0.206 | -0.336 | 0.168 | 0.214 | |
| EC | 0.418* | 0.247 | 0.354 | 0.104 | -0.244 | -0.380 | -0.343 |
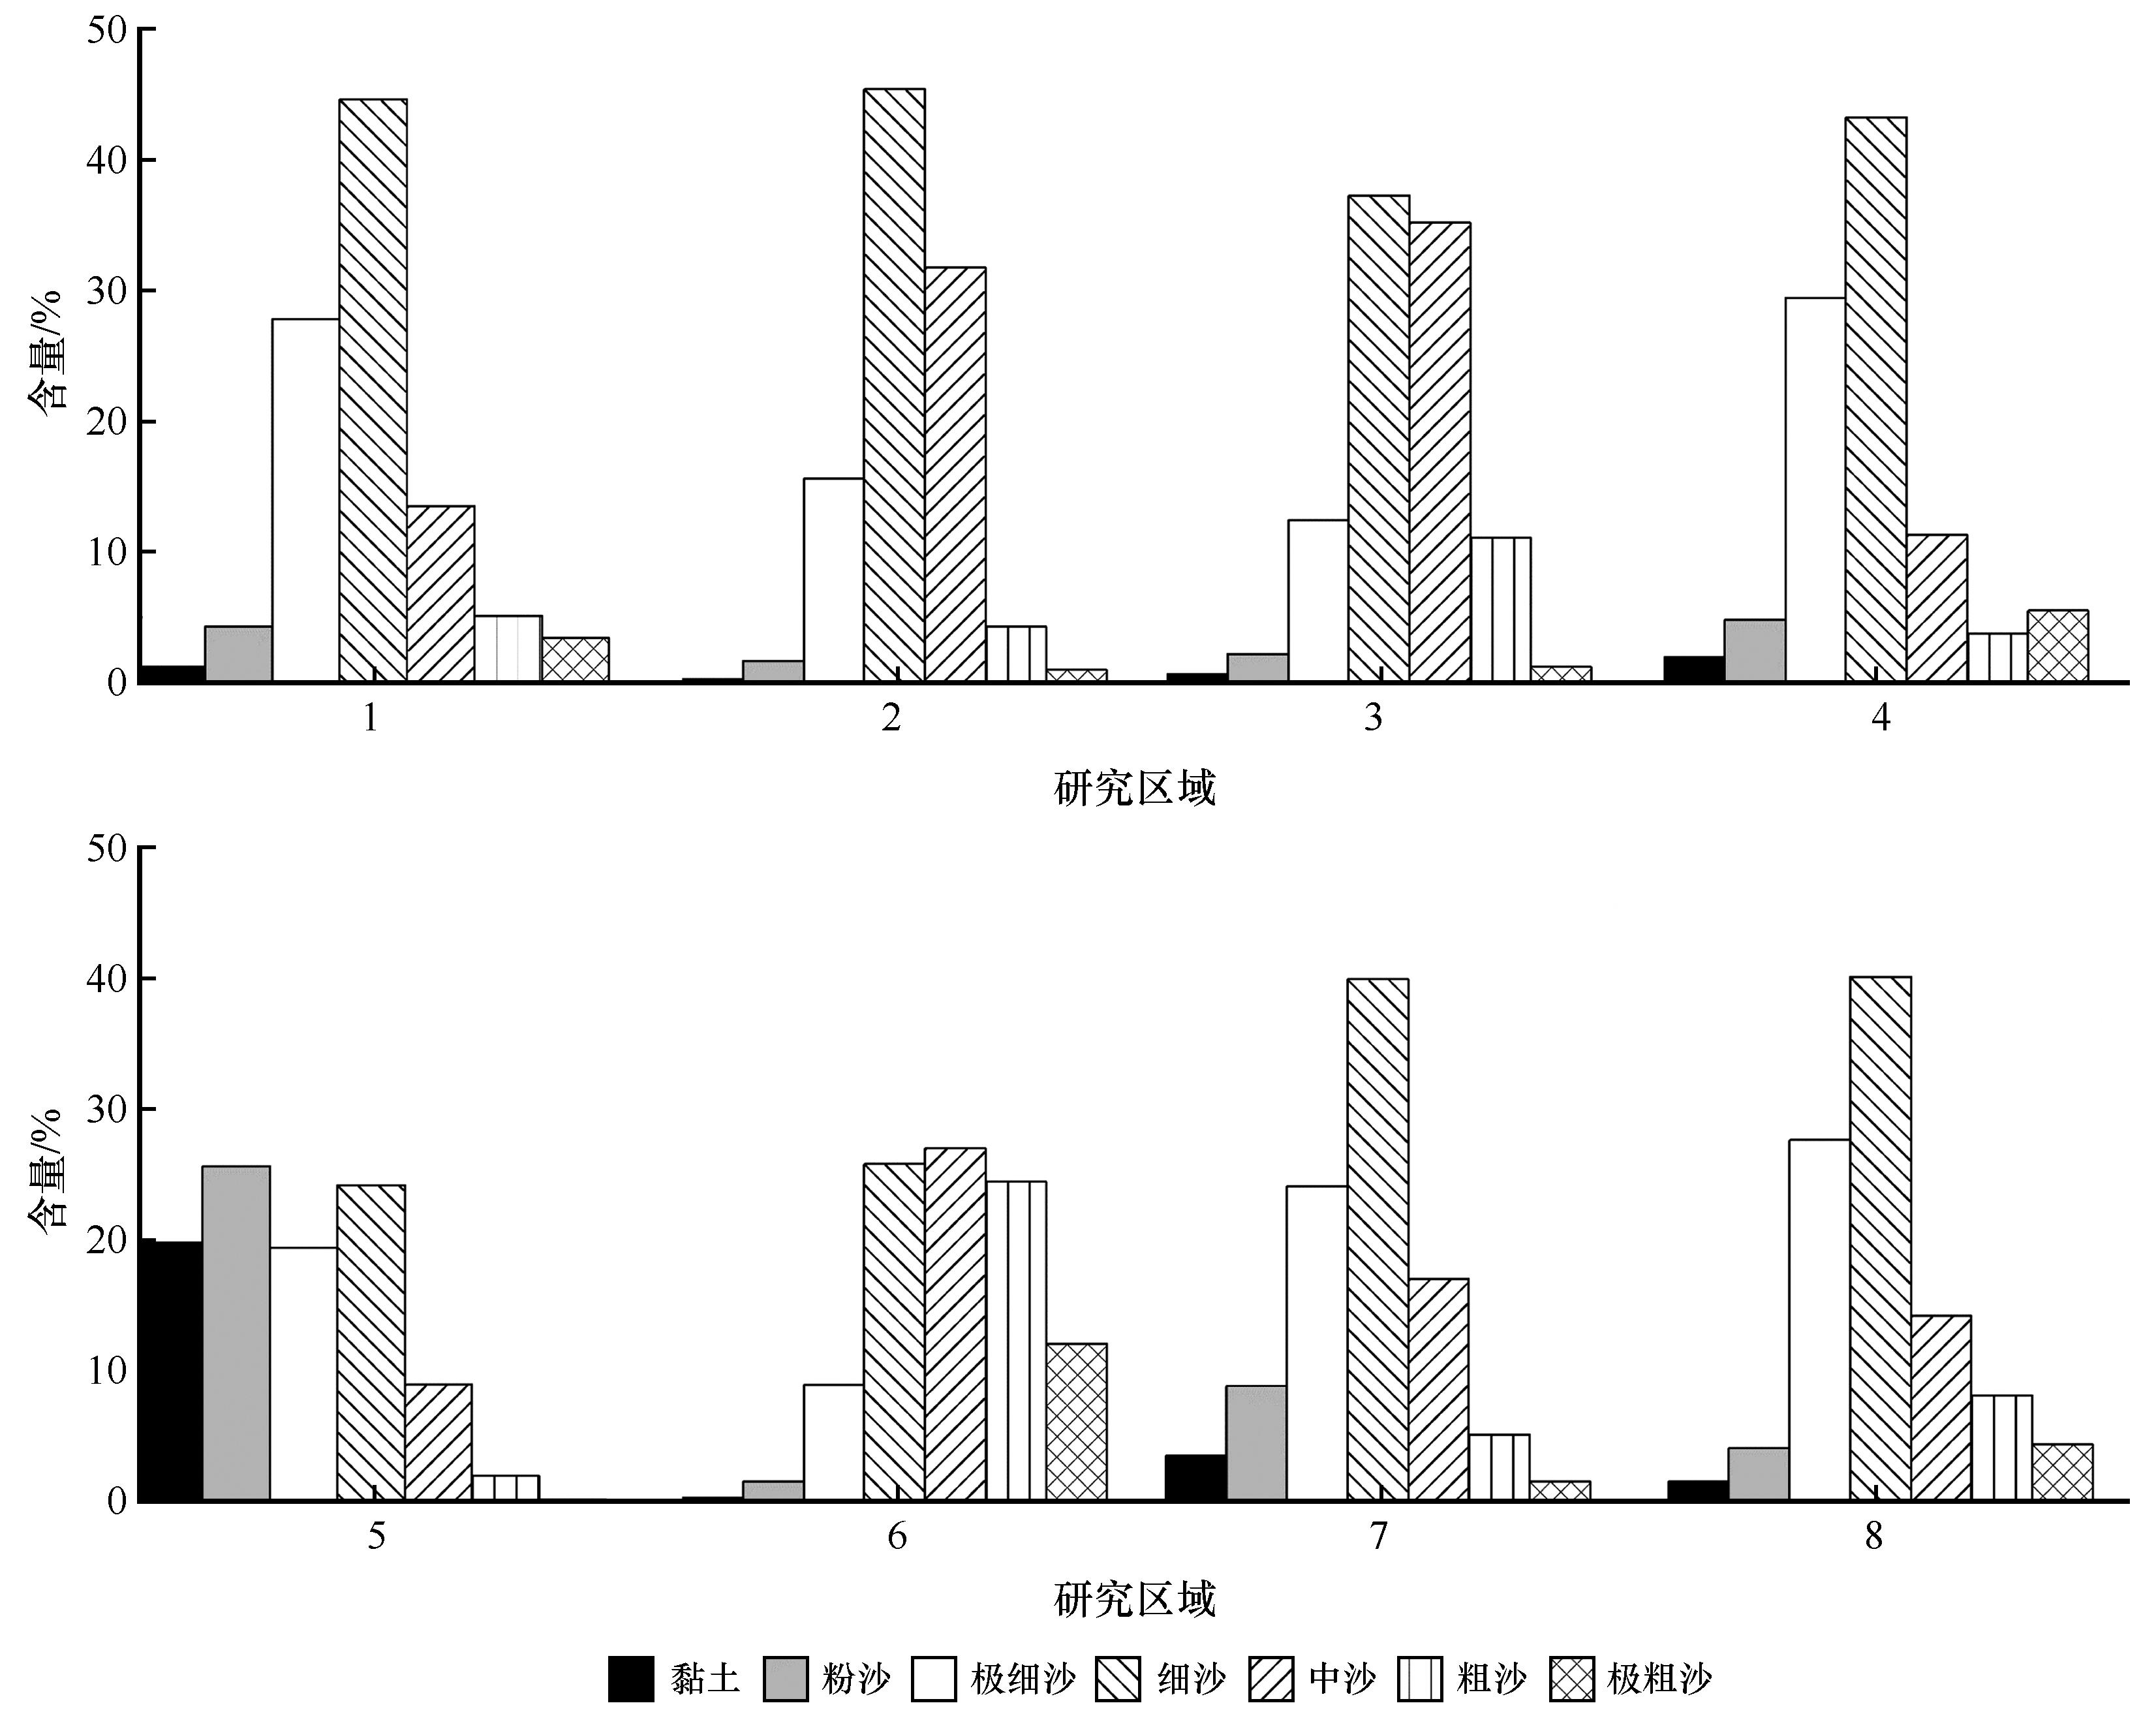
Fig.4 Composition characteristics of grain sizes in 0-20 cm soil layer of study areas
| 1 | Gallardo A.Spatial variability of soil properties in a floodplain forest in northwest Spain[J].Ecosystems,2003,6:564-576. |
| 2 | Schlesinger W H, Raikes J A, Hartley A E,et al.On the spatial pattern of soil nutrients in desert ecosystems[J].Ecology,1996,77:364-374. |
| 3 | 邱扬,傅伯杰,王军,等.黄土丘陵小流域土壤物理性质的空间变异[J].地理学报,2002,57(5):587-594. |
| 4 | Warrick A W, Nielsen D R.Spatial variability of soil physical properties[M]//Hillel D.Application of Soil Physics.New York,USA:Academic Press,1980:466-472. |
| 5 | Manderscheid B, Matzner E.Spatial and temporal variation of soil solution chemistry and ion fluxes through the soil in a mature Norway Spruce (Picea abies (L.) Karst.) stand[J].Biogeochemistry,1995,30:99-114. |
| 6 | 唐国勇,黄道友,黄敏,等.红壤丘陵景观表层土壤有机碳空间变异特点及其影响因子[J].土壤学报,2010,47(4):753-759. |
| 7 | Tang G Y, Xiao H A, Su Y R,et al.Spatial variation in organic carbon,nutrients and microbial biomass contents of paddy soils in a hilly red soil region[J].Frontiers of Agriculture in China,2007,1(4):424-429. |
| 8 | 左小安,赵哈林,赵学勇,等.科尔沁沙地退化植被恢复过程中土壤有机碳和全氮的空间异质性[J].环境科学,2009,30(8):2387-2393. |
| 9 | Ben-Shahar R.Soil nutrients disturbution and moisture dynamics on upper catena in semi-arid nature reserve[J].Vegetatio,1990,89:69-77. |
| 10 | 李小乐,魏亚娟,党晓宏,等.红砂灌丛沙堆土壤粒度组成及养分积累特征[J].干旱区研究,2022,39(3):933-942. |
| 11 | Zuo X A, Zhao H L, Zhao X Y,et al.Vegetation pattern variation,soil degradation and their relationship along a grassland desertification gradient in Horqin Sandy Land,northern China[J].Environmental Geology,2009,58:1227-1237. |
| 12 | 章明奎.砂质土壤不同粒径颗粒中有机碳、养分和重金属状况[J].土壤学报,2006,43(4):584-591. |
| 13 | 刘树林,王涛,屈建军.浑善达克沙地土地沙漠化过程中土壤粒度与养分变化研究[J].中国沙漠,2008,28(4):611-616. |
| 14 | 毕银丽,王百群,郭胜利,等.黄土丘陵区坝地系统土壤养分特征及其与侵蚀环境的关系Ⅱ.坝系土壤粒径分布及各粒径的养分状况[J].土壤侵蚀与水土保持学报,1997,3(4):37-43. |
| 15 | 王岩,杨振明,沈其荣.土壤不同粒级中C、N、P、K的分配及N的有效性研究[J].土壤学报,2000,37(1):85-94. |
| 16 | 刘钦普,林振山,周勤.华北黄泛平原潮土土壤养分与土壤粒级的关系研究[J].土壤肥料,2006(2):26-29. |
| 17 | 李海东,沈渭寿,邹长新,等.雅鲁藏布江山南宽谷风沙化土地土壤养分和粒度特征[J].生态学报,2012,32(16):4981-4992. |
| 18 | 王新中,刘国顺,张正杨,等.土壤粒级空间分布及其与土壤养分的关系[J].中国烟草科学,2011,32(5):47-51. |
| 19 | Qiao Y F, Miao S J, Li N,et al.Crop species affect soil organic carbon turnover in soil profile and among aggregate sizes in a Mollisol as estimated from natural 13C abundance[J].Plant and Soil,2015,392:163-174. |
| 20 | 董正武,李生宇,毛东雷,等.古尔班通古特沙漠西南缘柽柳沙包土壤粒度分布特征[J].水土保持学报,2021,35(4):64-79. |
| 21 | Dong Z B, Wang T, Wang X M.Geomorphology of the megadunes in the Badain Jaran Desert[J].Geomorphology,2004,60(1/2):191-203. |
| 22 | Dong Z B, Qian G Q, Lv P,et al.Investigation of the sand sea with the tallest dunes on Earth:China's Badain Jaran Sand Sea[J].Earth-Science Reviews,2013,120:20-39. |
| 23 | 王涛.巴丹吉林沙漠形成演变的若干问题[J].中国沙漠,1990,10(1):29-40. |
| 24 | 闫满存,王光谦,李保生,等.巴丹吉林沙漠高大沙山的形成发育研究[J].地理学报,2001,56(1):83-91. |
| 25 | 钱广强,董治宝,罗万银,等.巴丹吉林沙漠地表沉积物粒度特征及区域差异[J].中国沙漠,2011,31(6):1357-1364. |
| 26 | 崔徐甲,董治宝,罗万银,等.巴丹吉林沙漠高大沙山沉积物粒度特征及其与植被、地貌关系[J].中国沙漠,2015,35(4):857-864. |
| 27 | 刘铮瑶,董治宝,萨日娜,等.巴丹吉林沙漠边缘沉积物粒度和微形态特征空间分异[J].中国沙漠,2018,38(5):945-953. |
| 28 | 张克存,姚正毅,安志山,等.巴丹吉林沙漠及其毗邻地区降水特征及风沙环境分析[J].中国沙漠,2012,32(6):1507-1511. |
| 29 | 王蒙,董治宝,逯军峰,等.巴丹吉林沙漠周边地区植被特征和物种多样性研究[J].中国沙漠,2015,35(5):1226-1233. |
| 30 | 李继彦,董治宝,李恩菊,等.察尔汗盐湖雅丹地貌沉积物粒度特征研究[J].中国沙漠,2012,32(5):1187-1192. |
| 31 | Li J, Zhao C, Zhu H,et al.Effect of plant species on shrub fertile island at an oasis-desert ecotone in the South Junggar Basin,China[J].Journal of Arid Envrionments,2007,71:350-361. |
| 32 | Robertson G P, Crum J R, Ellis B G.The spatial variability of soil resources following long-term disturbance[J].Oecologia,1993,96:451-456. |
| 33 | 高海宁,李彩霞,孙小妹,等.祁连山北麓不同海拔土壤化学计量特征[J].中国沙漠,2021,41(1):219-227. |
| 34 | 全国土壤普查办公室.中国土壤普查数据[M].北京:中国农业出版社,1997. |
| 35 | 黄昌勇.土壤学[M].北京:中国农业出版社,2000. |
| 36 | 许延强,邓红,段志钟,等.拐子湖地区近40a气候变化特征分析[J]内蒙古气象,2013,(2):21-22,41. |
| 37 | Wang M, Dong Z B, Luo W Y,et al.Spatial variability of vegetation characteristics,soil properties and their relationships in and around China's Badain Jaran Desert[J]. Environmental Earth Sciences,2015,74:6847-6858. |
| 38 | 刘志鹏.黄土高原地区土壤养分的空间分布及其影响因素[D].杨凌:中国科学院教育部水土保持与生态环境研究中心,2014. |
| 39 | 裴世芳,傅华,陈亚明,等.放牧和围封下霸王灌丛对土壤肥力的影响[J].中国沙漠,2004,24(6):763-767. |
| 40 | Schlesinger W H, Reynolds J F, Cunningham G L,et al.Biological feedbacks in global desertification[J].Science,1990,247:1043-1048. |
| 41 | 罗维成,赵文智,任珩,等.不同气候区灌丛沙堆形态及土壤养分积累特征[J].中国沙漠,2021,41(2):191-199. |
| 42 | Li Y Y, Shao M A.Change of soil physical properties under long-term natural vegetation restoration in the Loess Plateau of China[J].Journal of Arid Envrionments,2006,64:77-96. |
| 43 | Mischke S.New evidence for origin of Badain Fijaran Desert of Inner Mongolia from granulometry and thermoluminescence dating[J].Journal of Palaeogeography,2005,7(1):79-97. |
| 44 | 王蒙,董治宝,罗万银,等.巴丹吉林沙漠南缘物种多样性及其与土壤特性的关系[J].西北植物学报,2015,35(2):379-388. |
| 45 | 高广磊,丁国栋,赵媛媛,等.生物结皮发育对毛乌素沙地土壤粒度特征的影响[J].农业机械学报,2014,45(1):115-120. |
| 46 | 张晓娜,蒙仲举,黄昕,等.荒漠草原不同植被覆盖下土壤粒度组成与速效养分特征[J].内蒙古林业科技,2018,44(1):37-40. |
| 47 | 邹诚,徐福利,闫亚丹.黄土高原丘陵沟壑区不同土地利用模式对土壤机械组成和速效养分影响分析[J].中国农学通报,2008,24(12):424-427. |
| [1] | Yunfeng Zhang, Yijuan Ma, Zhizhu Su, Aimin Liang, Xin Zhang, Yingying Cui. Dune movement in the joint zone of the Badain Jaran Desert and Tengger Desert [J]. Journal of Desert Research, 2022, 42(5): 82-91. |
| [2] | Heng Ren, Wenzhi Zhao, Zhitao Wang, Jiang Zhao. Spatial pattern of Psammochloa villosa population in patch landscape in dune habitat [J]. Journal of Desert Research, 2022, 42(4): 89-98. |
| [3] | Kuiming Li, Xiaoyan Wang, Luolan Yao. Regional differences and driving factors of agricultural green development level in the Yellow River Basin [J]. Journal of Desert Research, 2022, 42(3): 85-94. |
| [4] | Xiaolong Zhao, Yuhong Xie, Xujun Ma, Shaokun Wang. Vegetation structure and its relationship with soil physicochemical properties in restoring sandy grassland in Horqin Sandy Land [J]. Journal of Desert Research, 2022, 42(2): 134-141. |
| [5] | Hui Zhao, Hongyu Yang, Xingfan Wang, Keqi Wang. Geochronology of the typical sediments in the Badain Jaran Desert: the progress and issues [J]. Journal of Desert Research, 2022, 42(1): 57-65. |
| [6] | Lin Shi, Yuxing Zhao, Eerdun Hasi, Ping Zhang, Yingjun Xu, Zhuoran Wang. Changes of vegetation and soil nutrient on windward slope of dune under sand barrier environment in Mu Us Sandy Land [J]. Journal of Desert Research, 2021, 41(5): 140-146. |
| [7] | Lichao Zhuang, Naiang Wang, Xunhe Zhang, Liqiang Zhao, Xianbao Su. Analysis on the difference of the spatial model of lake ice freezing and melting in the Badain Jaran Desert [J]. Journal of Desert Research, 2021, 41(3): 214-223. |
| [8] | Yahong Li, Chongfeng Bu, Qi Guo, Yingxin Wei. Ecological functions comparison of moss crust and algae crust in the Mu Us Sand Land [J]. Journal of Desert Research, 2021, 41(2): 138-144. |
| [9] | Sarina, Zhibao Dong, Weige Nan. The Aesthetic Value of Mega-dune Lines in the Badain Jaran Desert [J]. Journal of Desert Research, 2021, 41(2): 221-230. |
| [10] | Chunyan Zhao, Jianhua Si, Qi Feng, Huan Luo, Jie Qin. Transformation of livelihood strategy for herdsman in Badain Jaran Desert and its impact on ecological environment [J]. Journal of Desert Research, 2020, 40(4): 34-42. |
| [11] | Keqi Wang, Hui Zhao, Yongwei Sheng, Shengan Zhang, Xingfan Wang, Hongyu Yang, Qian Chao. Distribution and morphological parameters of dunes in the Badain Jaran Desert based on DEM [J]. Journal of Desert Research, 2020, 40(4): 81-94. |
| [12] | Zhao Yajiao, Liu Xiaojing, Wu Yong, Tong Changchun. Rhizosphere soil nutrients, enzyme activities and microbial community characteristics in legume-cereal intercropping system in Northwest China [J]. Journal of Desert Research, 2020, 40(3): 219-228. |
| [13] | Wang Guohua, Ren Yijun, Gou Qianqian. The changes of soil physical and chemical property during the enclosure process in a typical desert oasis ecotone of the Hexi Corridor in northwestern China [J]. Journal of Desert Research, 2020, 40(2): 222-231. |
| [14] | Ma Pengli, Han Lanying, Zhang Xudong, Liu Weiping. Regional Characteristics of Drought in China under the Background of Climate Warming [J]. Journal of Desert Research, 2019, 39(6): 209-215. |
| [15] | Liu Chan, Zhao Wenzhi, Liu Bing, Meng Yangyang. Distribution Characteristics and Dynamic Changes of Vegetation in Badain Jaran Desert: Based on UAV and MODIS Data [J]. Journal of Desert Research, 2019, 39(4): 92-102. |
| Viewed | ||||||
|
Full text |
|
|||||
|
Abstract |
|
|||||
©2018Journal of Desert Research
Tel:0931-8267545
Email:caiedit@lzb.ac.cn;desert@lzb.ac.cn
Support:Magtech