中国沙漠 ›› 2021, Vol. 41 ›› Issue (4): 34-44.DOI: 10.7522/j.issn.1000-694X.2021.00023
滕泽宇1,3( ), 肖生春1, 陈小红2, 韩超1,3
收稿日期:2020-11-21
修回日期:2021-02-04
出版日期:2021-07-27
发布日期:2021-07-27
作者简介:滕泽宇(1990—),男,河北秦皇岛人,博士研究生,主要从事荒漠土壤微生物研究。E-mail: Tengzyu1990@sina.com
基金资助:
Zeyu Teng1,3(), Shengchun Xiao1, Xiaohong Chen2, Chao Han1,3
Received:2020-11-21
Revised:2021-02-04
Online:2021-07-27
Published:2021-07-27
摘要:
为了加深对阿拉善荒漠土壤环境状况的了解,并为植被生态功能的评价以及植物群落的保育与恢复提供理论依据,基于16S rDNA高通量测序和相关统计分析方法,对5种荒漠建群灌木红砂(Reaumuria soongarica)、绵刺(Potaninia mongolica)、沙冬青(Ammopiptanthus mongolicus)、霸王(Zygophyllum xanthoxylum)、白刺(Nitraria tangutorum)丛下表层和次表层的土壤细菌进行了研究。结果表明:5种灌丛下的土壤细菌以放线菌门和变形菌门为主,不同土层和灌木间的土壤细菌群落结构、多样性及群落功能均存在差异。土壤细菌群落结构与土壤中Mg2+、全碳和HCO3-含量的相关性更显著。土壤细菌群落结构的差异程度与灌木本身的发生学亲缘关系十分吻合,且表层土壤细菌受植物形态、生理特征以及具体生存策略的影响更大。
中图分类号:
滕泽宇, 肖生春, 陈小红, 韩超. 阿拉善荒漠5种灌丛下土壤细菌特征[J]. 中国沙漠, 2021, 41(4): 34-44.
Zeyu Teng, Shengchun Xiao, Xiaohong Chen, Chao Han. The soil bacterial condition beneath five shrub species in the central Alxa[J]. Journal of Desert Research, 2021, 41(4): 34-44.
| 植物 | 高度 /m | 地径 /cm | 冠幅(长轴) /m | 冠幅(短轴) /m |
|---|---|---|---|---|
| 红砂 | 0.13±0.01 | 0.52±0.10 | 0.27±0.02 | 0.21±0.02 |
| 沙冬青 | 0.52±0.09 | 0.65±0.11 | 0.69±0.18 | 0.63±0.17 |
| 绵刺 | 0.25±0.01 | 0.92±0.13 | 0.58±0.18 | 0.50±0.19 |
| 霸王 | 0.40±0.03 | 1.43±0.61 | 1.13±0.31 | 0.87±0.14 |
| 白刺 | 0.33±0.02 | 0.90±0.18 | 2.23±1.01 | 1.23±0.24 |
表1 采样灌木的形态学指标
Table 1 Morphological indicators for sampling shrubs
| 植物 | 高度 /m | 地径 /cm | 冠幅(长轴) /m | 冠幅(短轴) /m |
|---|---|---|---|---|
| 红砂 | 0.13±0.01 | 0.52±0.10 | 0.27±0.02 | 0.21±0.02 |
| 沙冬青 | 0.52±0.09 | 0.65±0.11 | 0.69±0.18 | 0.63±0.17 |
| 绵刺 | 0.25±0.01 | 0.92±0.13 | 0.58±0.18 | 0.50±0.19 |
| 霸王 | 0.40±0.03 | 1.43±0.61 | 1.13±0.31 | 0.87±0.14 |
| 白刺 | 0.33±0.02 | 0.90±0.18 | 2.23±1.01 | 1.23±0.24 |
| 对比组 | F | P |
|---|---|---|
| 红砂-白刺 | 3.348 | <0.001 |
| 红砂-霸王 | 2.737 | <0.001 |
| 红砂-沙冬青 | 2.858 | 0.002 |
| 红砂-绵刺 | 2.328 | 0.021 |
| 绵刺-白刺 | 1.859 | 0.076 |
| 绵刺-霸王 | 1.578 | 0.084 |
| 绵刺-沙冬青 | 1.488 | 0.098 |
| 沙冬青-霸王 | 1.239 | 0.173 |
| 沙冬青-白刺 | 1.281 | 0.154 |
| 霸王-白刺 | 1.680 | 0.055 |
| (0—10 cm)-(10—20 cm) | 30.278 | <0.001 |
| 全部 | 1.969 | <0.001 |
表2 灌木间土壤细菌群落结构分子方差分析(AMOVA)结果
Table 2 The AMOVA (analysis of molecular variance) results of soil bacterial community structure between different shrubs
| 对比组 | F | P |
|---|---|---|
| 红砂-白刺 | 3.348 | <0.001 |
| 红砂-霸王 | 2.737 | <0.001 |
| 红砂-沙冬青 | 2.858 | 0.002 |
| 红砂-绵刺 | 2.328 | 0.021 |
| 绵刺-白刺 | 1.859 | 0.076 |
| 绵刺-霸王 | 1.578 | 0.084 |
| 绵刺-沙冬青 | 1.488 | 0.098 |
| 沙冬青-霸王 | 1.239 | 0.173 |
| 沙冬青-白刺 | 1.281 | 0.154 |
| 霸王-白刺 | 1.680 | 0.055 |
| (0—10 cm)-(10—20 cm) | 30.278 | <0.001 |
| 全部 | 1.969 | <0.001 |
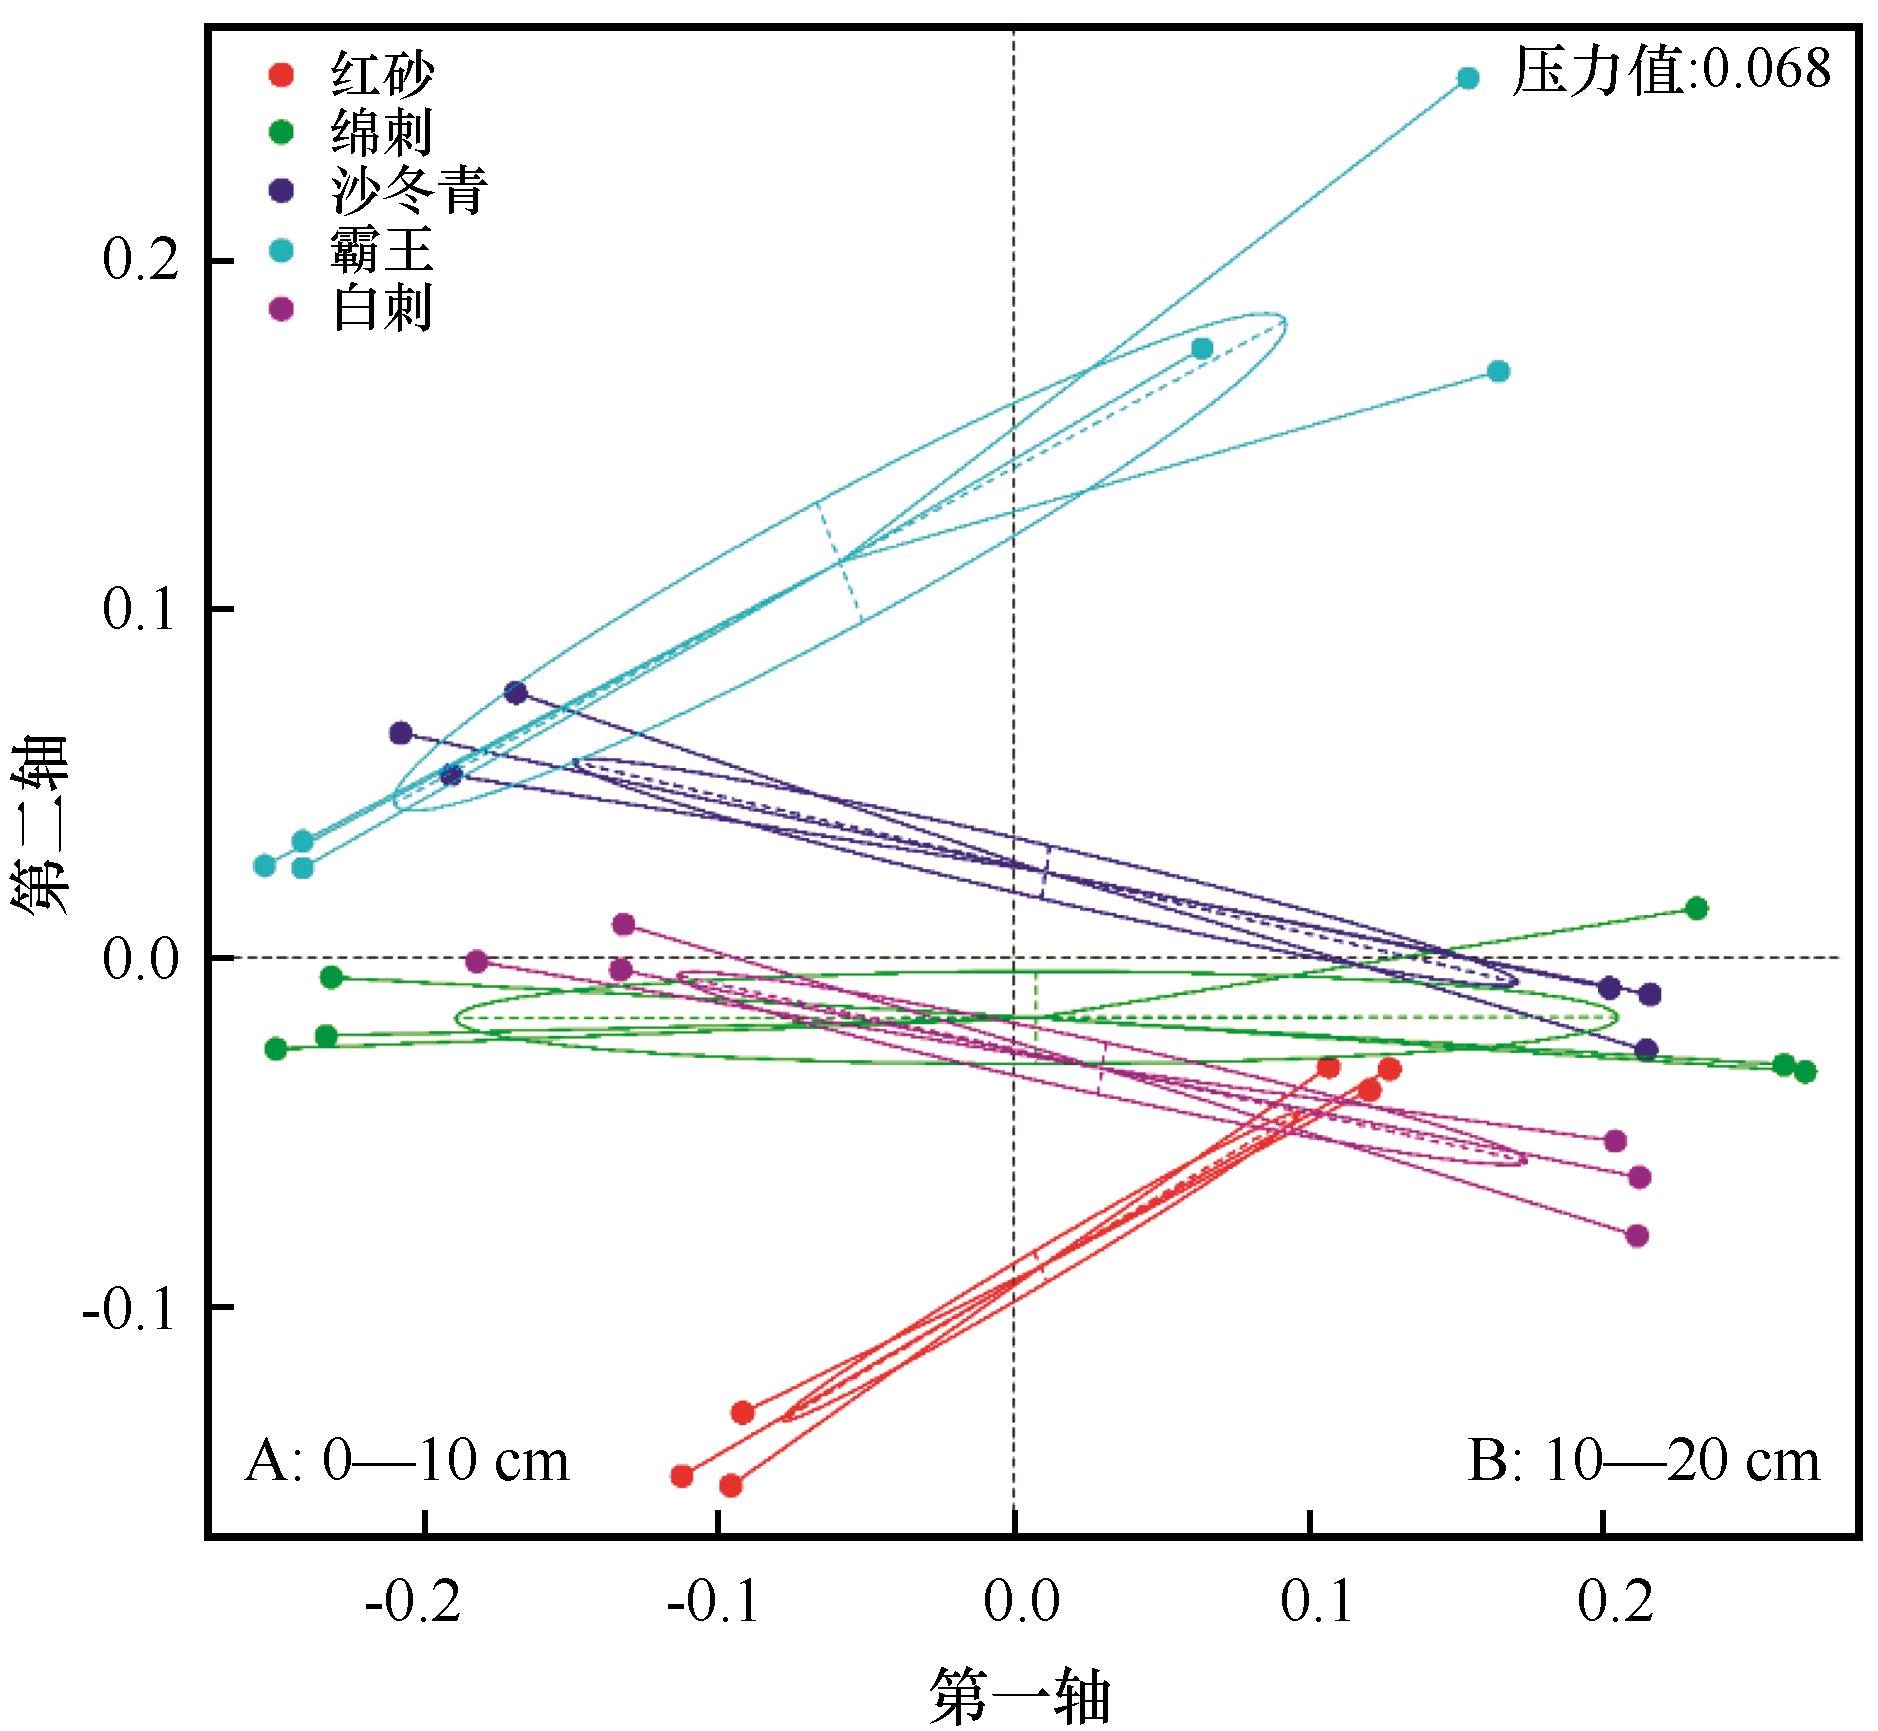
图1 非度量多维标度(NMDS)分析结果组间样点间距离越远反映细菌群落结构差异越大
Fig.1 The result of nonmetric multidimensional scaling analysis
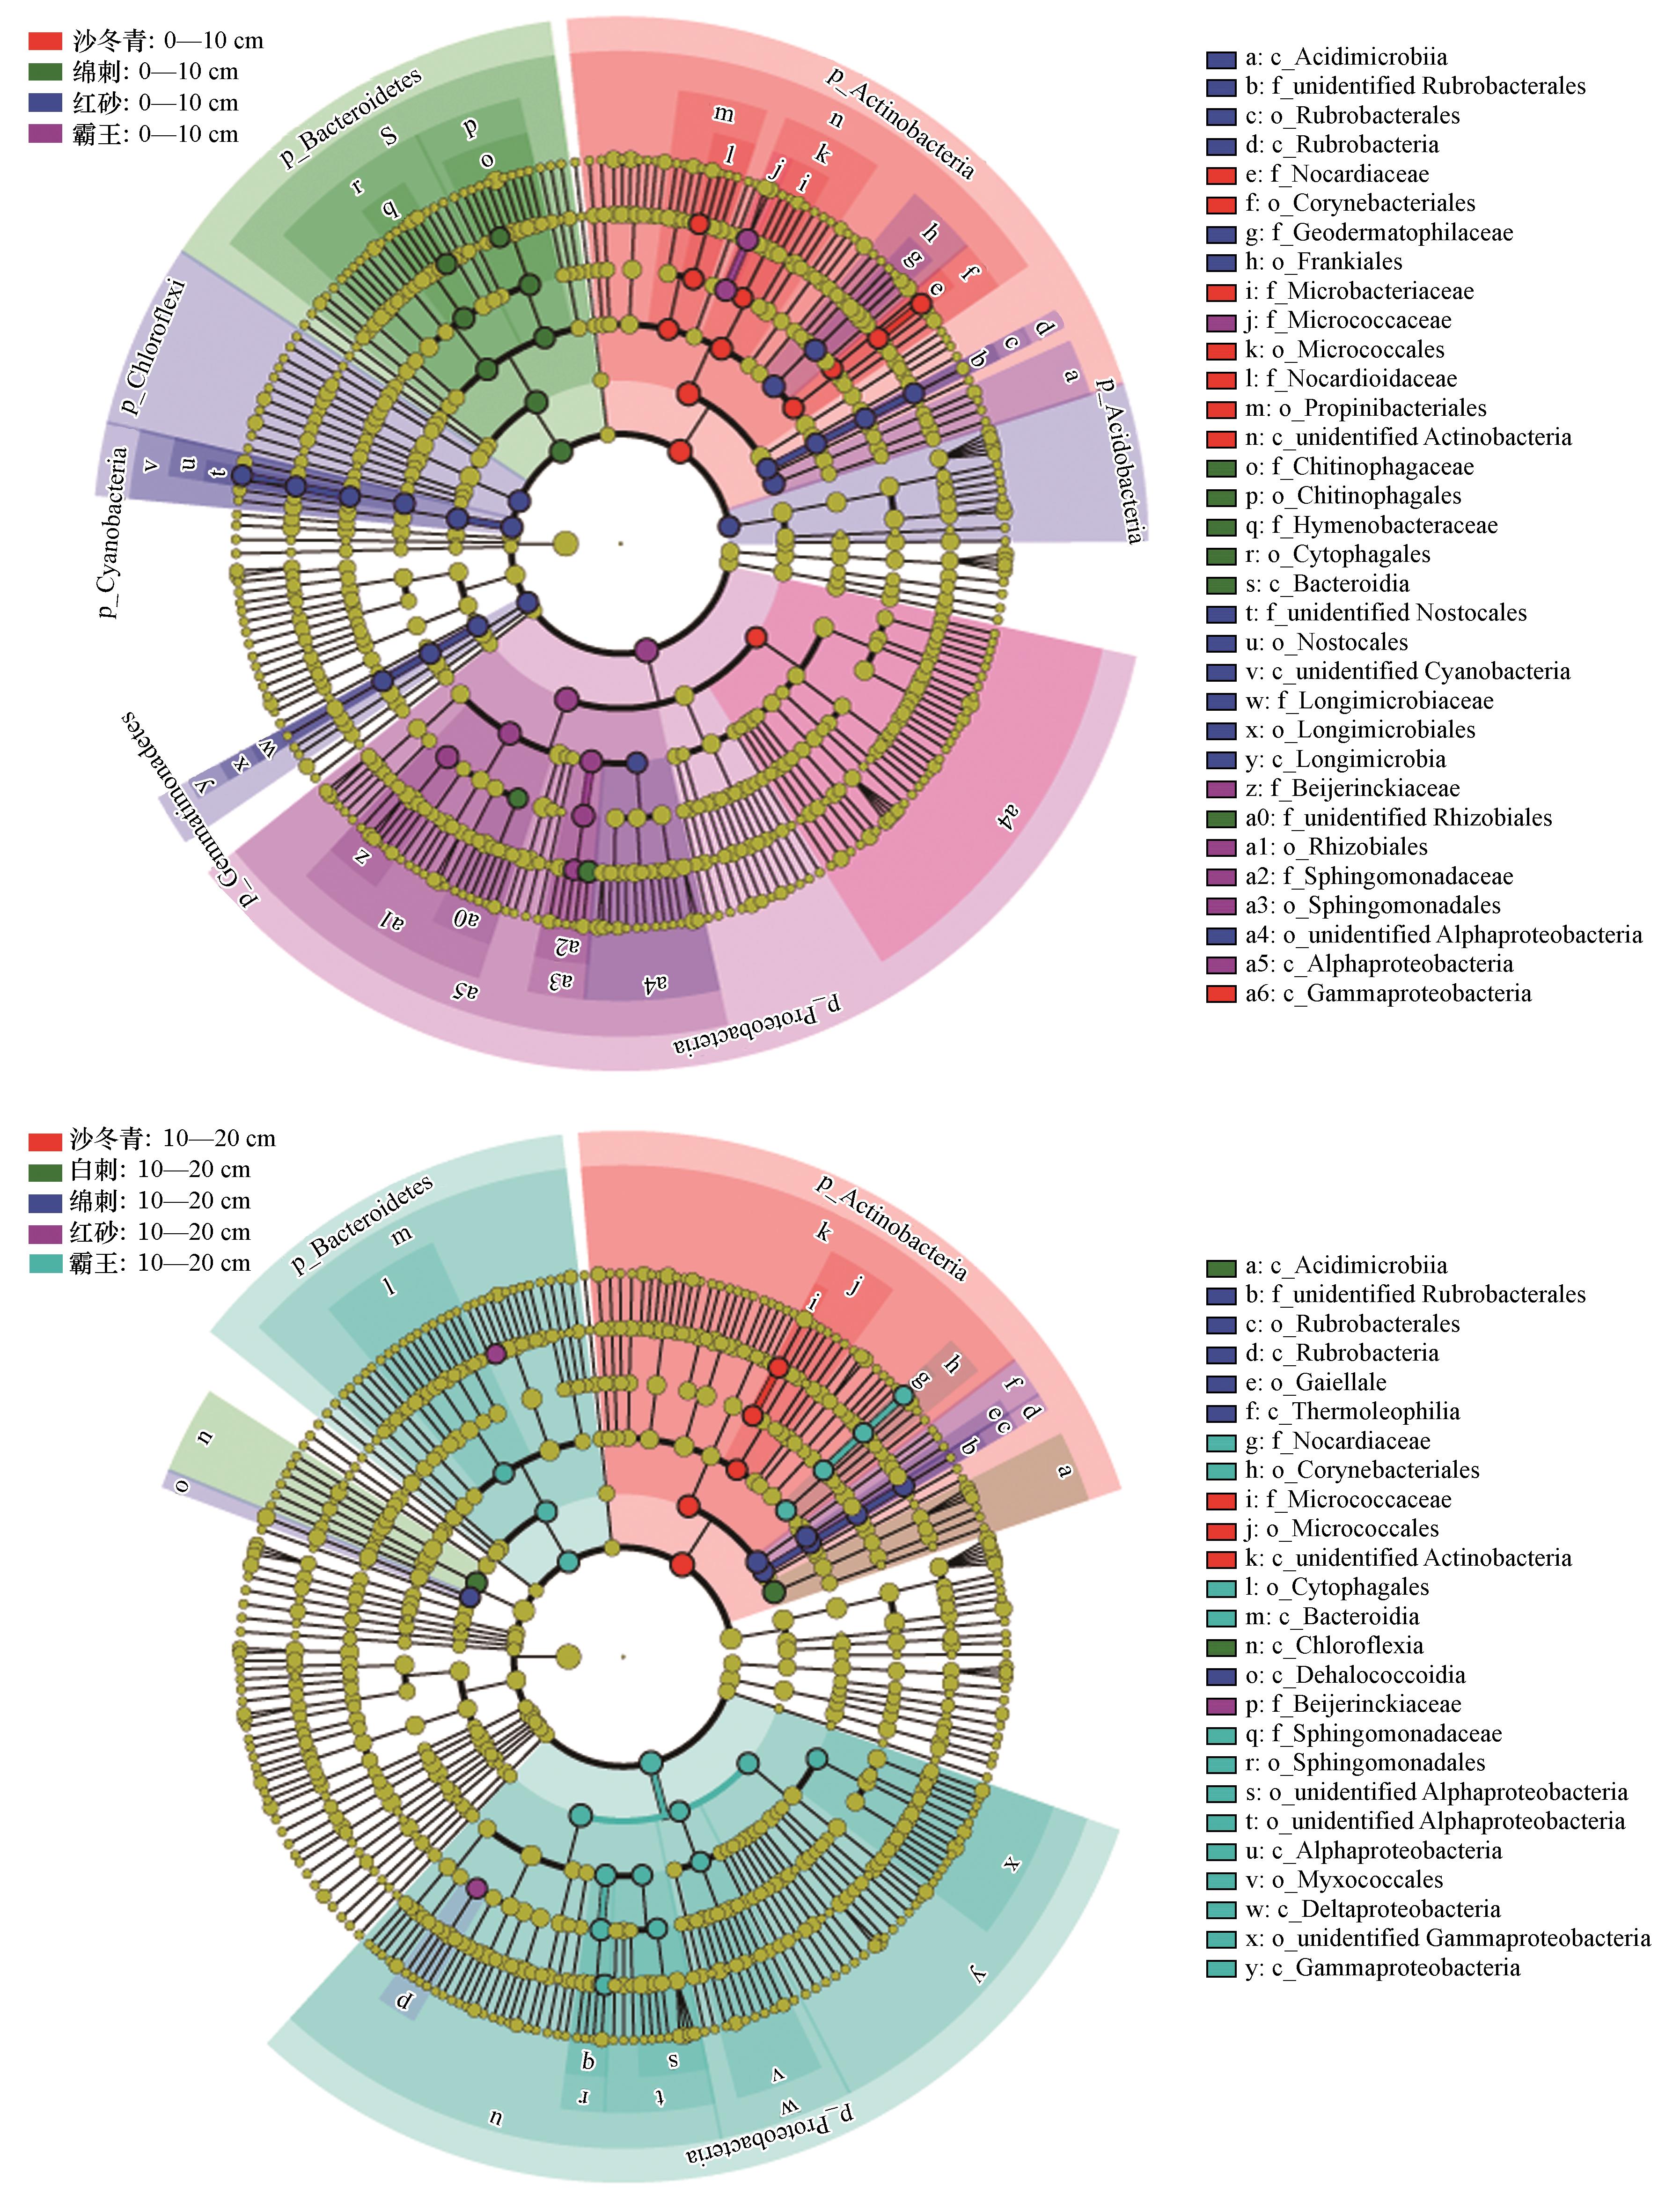
图2 表层(上)与次表层(下)灌木间土壤细菌群落结构的线性判别分析(LEfSe)结果,所标出的生物标志物表明其丰度在灌木间的差异具有统计显著性(LDA≥4)
Fig.2 The result of Linear discriminant analysis Effect Size (LEfSe) of soil bacterial community structure among shrubs in surface layer (A, upper) and subsurface layer (B, lower), the biomarkers indicates that the difference of their abundance among shrubs was statistically significant (LDA≥4)
| 土层 | 植物 | Chao1指数 | Shannon指数 | Simpson指数 | PD whole tree指数 |
|---|---|---|---|---|---|
| 0—10 cm | 红砂 | 2009.12±87.04ab | 8.68±0.05c | 0.9927±0.0004c | 127.15±1.98b |
| 绵刺 | 1768.74±62.49b | 8.45±0.11cd | 0.9895±0.0012d | 121.00±2.08b | |
| 沙冬青 | 1514.74±370.49bc | 8.39±0.36b | 0.9899±0.0021d | 113.68±23.49b | |
| 霸王 | 1765.50±190.19b | 8.19±0.08de | 0.9877±0.0011d | 127.57±15.16b | |
| 白刺 | 1538.73±303.53bc | 8.54±0.15e | 0.9906±0.0008cd | 110.63±14.21b | |
| 10—20 cm | 红砂 | 2201.70±291.70a | 9.10±0.03b | 0.9932±0.0006bc | 147.80±5.92a |
| 绵刺 | 2138.18±143.00a | 9.25±0.10a | 0.9962±0.0003a | 142.81±5.46a | |
| 沙冬青 | 1837.21±46.73b | 9.08±0.03b | 0.9951±0.0004ab | 130.48±3.82ab | |
| 霸王 | 1275.719±348.13c | 8.69±0.44ab | 0.9942±0.0002b | 104.78±22.00b | |
| 白刺 | 1781.79±103.30b | 8.75±0.05cd | 0.9936±0.0004b | 129.81±6.54ab | |
| 0—20 cm | 红砂 | 2105.39±219.52a | 8.89±0.23a | 0.9929±0.0006a | 137.47±11.97a |
| 绵刺 | 1953.46±225.14a | 8.85±0.45a | 0.9928±0.0037a | 131.91±12.51ab | |
| 沙冬青 | 1675.97±294.90b | 8.73±0.44ab | 0.9925±0.0031a | 122.08±17.64ab | |
| 霸王 | 1520.61±367.31b | 8.44±0.40b | 0.9910±0.0038a | 116.18±21.01b | |
| 白刺 | 1660.26±242.58b | 8.64±0.15ab | 0.9921±0.0017a | 120.22±14.43ab | |
| 10 cm | 1719.37±272.96a | 8.45±0.23b | 0.9901±0.0020b | 120.01±13.87b | |
| 20 cm | 1846.91±387.58a | 8.97±0.28a | 0.9945±0.0013a | 131.13±18.02a |
表3 不同灌木及土层间Alpha多样性
Table 3 Statistical table of Alpha diversities among different shrubs and soil layers
| 土层 | 植物 | Chao1指数 | Shannon指数 | Simpson指数 | PD whole tree指数 |
|---|---|---|---|---|---|
| 0—10 cm | 红砂 | 2009.12±87.04ab | 8.68±0.05c | 0.9927±0.0004c | 127.15±1.98b |
| 绵刺 | 1768.74±62.49b | 8.45±0.11cd | 0.9895±0.0012d | 121.00±2.08b | |
| 沙冬青 | 1514.74±370.49bc | 8.39±0.36b | 0.9899±0.0021d | 113.68±23.49b | |
| 霸王 | 1765.50±190.19b | 8.19±0.08de | 0.9877±0.0011d | 127.57±15.16b | |
| 白刺 | 1538.73±303.53bc | 8.54±0.15e | 0.9906±0.0008cd | 110.63±14.21b | |
| 10—20 cm | 红砂 | 2201.70±291.70a | 9.10±0.03b | 0.9932±0.0006bc | 147.80±5.92a |
| 绵刺 | 2138.18±143.00a | 9.25±0.10a | 0.9962±0.0003a | 142.81±5.46a | |
| 沙冬青 | 1837.21±46.73b | 9.08±0.03b | 0.9951±0.0004ab | 130.48±3.82ab | |
| 霸王 | 1275.719±348.13c | 8.69±0.44ab | 0.9942±0.0002b | 104.78±22.00b | |
| 白刺 | 1781.79±103.30b | 8.75±0.05cd | 0.9936±0.0004b | 129.81±6.54ab | |
| 0—20 cm | 红砂 | 2105.39±219.52a | 8.89±0.23a | 0.9929±0.0006a | 137.47±11.97a |
| 绵刺 | 1953.46±225.14a | 8.85±0.45a | 0.9928±0.0037a | 131.91±12.51ab | |
| 沙冬青 | 1675.97±294.90b | 8.73±0.44ab | 0.9925±0.0031a | 122.08±17.64ab | |
| 霸王 | 1520.61±367.31b | 8.44±0.40b | 0.9910±0.0038a | 116.18±21.01b | |
| 白刺 | 1660.26±242.58b | 8.64±0.15ab | 0.9921±0.0017a | 120.22±14.43ab | |
| 10 cm | 1719.37±272.96a | 8.45±0.23b | 0.9901±0.0020b | 120.01±13.87b | |
| 20 cm | 1846.91±387.58a | 8.97±0.28a | 0.9945±0.0013a | 131.13±18.02a |
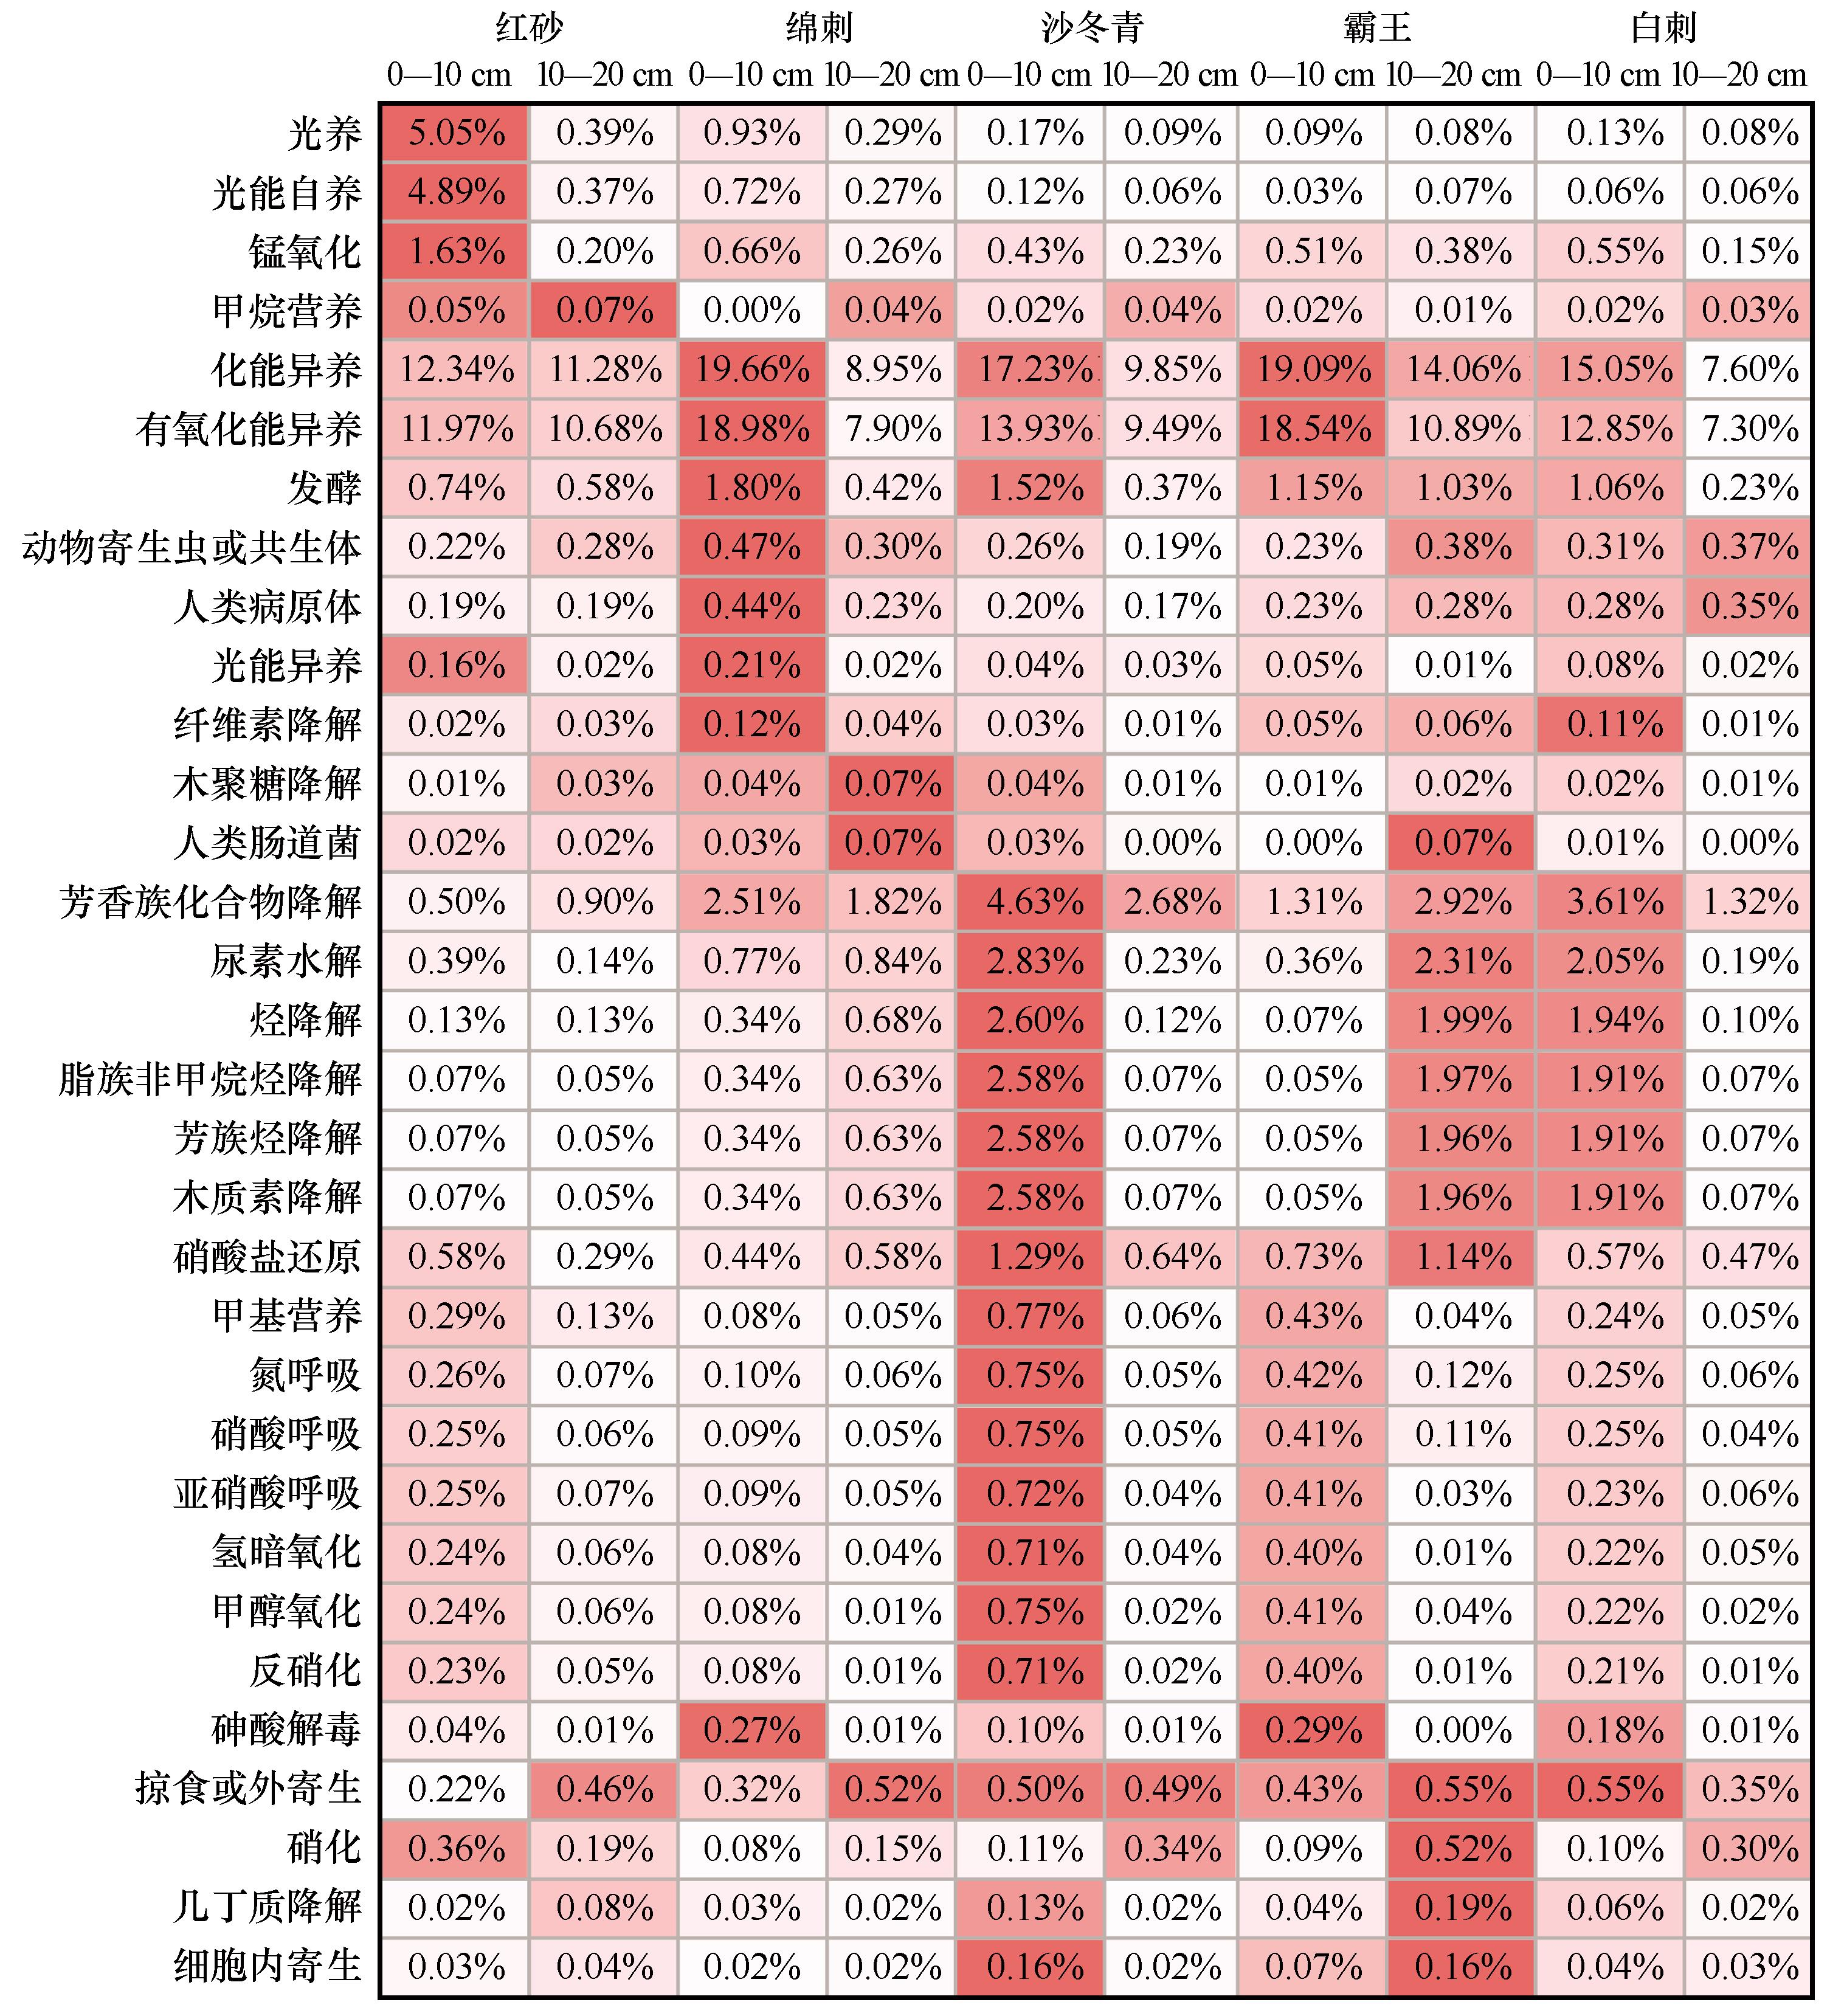
图3 基于原核生物功能数据库(FAPROTAX)的组间功能注释热度图,数值为具有该功能细菌的平均丰度之和
Fig.3 The functional annotation heat map based on Functional Annotation of Prokaryotic Taxa (FAPROTAX), the data is the sum of the bacterial average abundance with this function
| 环境因子 | 红砂 | 绵刺 | 沙冬青 | 霸王 | 白刺 | |||||||||
|---|---|---|---|---|---|---|---|---|---|---|---|---|---|---|
| 0—10 cm | 10—20 cm | 0—10 cm | 10—20 cm | 0—10 cm | 10—20 cm | 0—10 cm | 10—20 cm | 0—10 cm | 10—20 cm | |||||
| MBC/(mg·kg-1) | 65.99±12.66 | 58.42±11.38 | 80.51±15.14 | 65.11±10.36 | 45.79±8.11 | 38.12±6.93 | 84.02±17.21 | 62.09±11.44 | 57.70±9.91 | 45.77±8.36 | ||||
| MBN/(mg·kg-1) | 9.11±1.02 | 7.99±0.86 | 12.95±1.17 | 8.88±0.99 | 5.96±0.41 | 5.19±0.39 | 12.18±1.33 | 9.58±0.81 | 8.94±0.75 | 6.52±0.55 | ||||
| TC/(g·kg-1) | 5.56±0.27 | 4.71±0.21 | 4.94±0.39 | 7.28±0.44 | 2.91±0.13 | 8.38±0.47 | 4.96±0.35 | 6.82±0.37 | 2.93±0.11 | 8.07±0.42 | ||||
| TN/(g·kg-1) | 0.19±0.01 | 0.18±0.00 | 0.29±0.02 | 0.22±0.01 | 0.11±0.00 | 0.13±0.00 | 0.19±0.01 | 0.19±0.01 | 0.09±0.01 | 0.14±0.00 | ||||
| TP/(g·kg-1) | 0.35±0.03 | 0.37±0.04 | 0.30±0.03 | 0.34±0.04 | 0.24±0.02 | 0.30±0.02 | 0.30±0.03 | 0.34±0.03 | 0.19±0.01 | 0.24±0.03 | ||||
| SOC/(g·kg-1) | 2.15±0.19 | 2.22±0.21 | 3.83±0.33 | 3.02±0.32 | 1.29±0.10 | 1.55±0.14 | 2.45±0.23 | 2.13±0.22 | 1.18±0.11 | 1.74±0.14 | ||||
| AN/(mg·kg-1) | 10.53±2.76 | 6.27±2.28 | 19.29±3.92 | 10.17±3.13 | 3.04±1.04 | 12.84±3.06 | 15.97±3.47 | 11.86±3.36 | 8.19±2.11 | 3.72±1.17 | ||||
| AP/(mg·kg-1) | 1.28±0.20 | 2.03±0.42 | 3.80±0.57 | 0.96±0.21 | 0.84±0.19 | 0.85±0.21 | 1.87±0.24 | 1.19±0.17 | 0.63±0.07 | 1.08±0.18 | ||||
| Cl-/(mg·kg-1) | 116.53±3.41 | 118.07±3.37 | 27.68±1.03 | 30.55±1.24 | 25.14±1.08 | 36.26±1.42 | 113.78±3.03 | 93.06±2.94 | 33.06±1.38 | 49.66±1.90 | ||||
| HCO | 75.68±1.36 | 81.38±1.42 | 50.62±0.93 | 68.76±1.44 | 44.24±0.52 | 88.29±2.04 | 50.54±0.88 | 73.5±1.82 | 48.88±0.47 | 68.98±1.96 | ||||
| SO | 134.55±9.38 | 55.99±5.03 | 38.88±4.02 | 41.21±4.50 | 154.40±11.66 | 149.58±12.05 | 193.77±15.44 | 85.09±6.14 | 43.64±4.16 | 39.02±4.42 | ||||
| Ca2+/(mg·kg-1) | 35.79±2.84 | 36.10±2.55 | 66.98±5.72 | 84.23±6.11 | 56.86±4.06 | 77.8±5.30 | 75.14±5.22 | 68.63±4.93 | 63.27±5.71 | 86.44±6.16 | ||||
| K+/(mg·kg-1) | 33.58±1.09 | 25.62±1.26 | 24.92±1.07 | 22.29±0.94 | 22.29±1.23 | 22.27±1.10 | 36.51±1.24 | 30.33±1.37 | 16.77±0.77 | 25.85±1.45 | ||||
| Mg2+/(mg·kg-1) | 10.15±0.98 | 13.20±1.52 | 11.39±1.07 | 15.80±1.39 | 11.75±1.25 | 15.46±1.41 | 12.91±1.35 | 18.6±1.83 | 11.01±1.22 | 18.08±2.00 | ||||
| Na+/(mg·kg-1) | 186.78±20.03 | 221.38±19.37 | 34.78±2.94 | 33.46±3.44 | 22.05±2.19 | 80.11±9.92 | 95.84±12.56 | 122.68±15.34 | 13.57±0.84 | 28.7±3.24 | ||||
| EC/(μS·cm-1) | 217.67±2.06 | 248.10±1.55 | 106.33±1.07 | 140.67±1.24 | 100.17±0.82 | 171.90±0.64 | 231.00±2.55 | 202.10±1.29 | 100.23±0.71 | 143..83±0.70 | ||||
| MOI/% | 0.87±0.06 | 1.65±0.09 | 1.68±0.42 | 1.48±0.08 | 1.07±0.06 | 1.78±0.07 | 2.07±0.51 | 1.96±0.10 | 1.69±0.10 | 1.83±0.06 | ||||
| pH | 8.98±0.05 | 9.20±0.06 | 8.33±0.04 | 8.61±0.03 | 8.28±0.04 | 8.55±0.04 | 7.87±0.04 | 8.77±0.04 | 8.65±0.05 | 8.58±0.05 | ||||
表4 组间微生物量及环境因子统计表
Table 4 Statistical table of microbial biomass and environmental factors between groups
| 环境因子 | 红砂 | 绵刺 | 沙冬青 | 霸王 | 白刺 | |||||||||
|---|---|---|---|---|---|---|---|---|---|---|---|---|---|---|
| 0—10 cm | 10—20 cm | 0—10 cm | 10—20 cm | 0—10 cm | 10—20 cm | 0—10 cm | 10—20 cm | 0—10 cm | 10—20 cm | |||||
| MBC/(mg·kg-1) | 65.99±12.66 | 58.42±11.38 | 80.51±15.14 | 65.11±10.36 | 45.79±8.11 | 38.12±6.93 | 84.02±17.21 | 62.09±11.44 | 57.70±9.91 | 45.77±8.36 | ||||
| MBN/(mg·kg-1) | 9.11±1.02 | 7.99±0.86 | 12.95±1.17 | 8.88±0.99 | 5.96±0.41 | 5.19±0.39 | 12.18±1.33 | 9.58±0.81 | 8.94±0.75 | 6.52±0.55 | ||||
| TC/(g·kg-1) | 5.56±0.27 | 4.71±0.21 | 4.94±0.39 | 7.28±0.44 | 2.91±0.13 | 8.38±0.47 | 4.96±0.35 | 6.82±0.37 | 2.93±0.11 | 8.07±0.42 | ||||
| TN/(g·kg-1) | 0.19±0.01 | 0.18±0.00 | 0.29±0.02 | 0.22±0.01 | 0.11±0.00 | 0.13±0.00 | 0.19±0.01 | 0.19±0.01 | 0.09±0.01 | 0.14±0.00 | ||||
| TP/(g·kg-1) | 0.35±0.03 | 0.37±0.04 | 0.30±0.03 | 0.34±0.04 | 0.24±0.02 | 0.30±0.02 | 0.30±0.03 | 0.34±0.03 | 0.19±0.01 | 0.24±0.03 | ||||
| SOC/(g·kg-1) | 2.15±0.19 | 2.22±0.21 | 3.83±0.33 | 3.02±0.32 | 1.29±0.10 | 1.55±0.14 | 2.45±0.23 | 2.13±0.22 | 1.18±0.11 | 1.74±0.14 | ||||
| AN/(mg·kg-1) | 10.53±2.76 | 6.27±2.28 | 19.29±3.92 | 10.17±3.13 | 3.04±1.04 | 12.84±3.06 | 15.97±3.47 | 11.86±3.36 | 8.19±2.11 | 3.72±1.17 | ||||
| AP/(mg·kg-1) | 1.28±0.20 | 2.03±0.42 | 3.80±0.57 | 0.96±0.21 | 0.84±0.19 | 0.85±0.21 | 1.87±0.24 | 1.19±0.17 | 0.63±0.07 | 1.08±0.18 | ||||
| Cl-/(mg·kg-1) | 116.53±3.41 | 118.07±3.37 | 27.68±1.03 | 30.55±1.24 | 25.14±1.08 | 36.26±1.42 | 113.78±3.03 | 93.06±2.94 | 33.06±1.38 | 49.66±1.90 | ||||
| HCO | 75.68±1.36 | 81.38±1.42 | 50.62±0.93 | 68.76±1.44 | 44.24±0.52 | 88.29±2.04 | 50.54±0.88 | 73.5±1.82 | 48.88±0.47 | 68.98±1.96 | ||||
| SO | 134.55±9.38 | 55.99±5.03 | 38.88±4.02 | 41.21±4.50 | 154.40±11.66 | 149.58±12.05 | 193.77±15.44 | 85.09±6.14 | 43.64±4.16 | 39.02±4.42 | ||||
| Ca2+/(mg·kg-1) | 35.79±2.84 | 36.10±2.55 | 66.98±5.72 | 84.23±6.11 | 56.86±4.06 | 77.8±5.30 | 75.14±5.22 | 68.63±4.93 | 63.27±5.71 | 86.44±6.16 | ||||
| K+/(mg·kg-1) | 33.58±1.09 | 25.62±1.26 | 24.92±1.07 | 22.29±0.94 | 22.29±1.23 | 22.27±1.10 | 36.51±1.24 | 30.33±1.37 | 16.77±0.77 | 25.85±1.45 | ||||
| Mg2+/(mg·kg-1) | 10.15±0.98 | 13.20±1.52 | 11.39±1.07 | 15.80±1.39 | 11.75±1.25 | 15.46±1.41 | 12.91±1.35 | 18.6±1.83 | 11.01±1.22 | 18.08±2.00 | ||||
| Na+/(mg·kg-1) | 186.78±20.03 | 221.38±19.37 | 34.78±2.94 | 33.46±3.44 | 22.05±2.19 | 80.11±9.92 | 95.84±12.56 | 122.68±15.34 | 13.57±0.84 | 28.7±3.24 | ||||
| EC/(μS·cm-1) | 217.67±2.06 | 248.10±1.55 | 106.33±1.07 | 140.67±1.24 | 100.17±0.82 | 171.90±0.64 | 231.00±2.55 | 202.10±1.29 | 100.23±0.71 | 143..83±0.70 | ||||
| MOI/% | 0.87±0.06 | 1.65±0.09 | 1.68±0.42 | 1.48±0.08 | 1.07±0.06 | 1.78±0.07 | 2.07±0.51 | 1.96±0.10 | 1.69±0.10 | 1.83±0.06 | ||||
| pH | 8.98±0.05 | 9.20±0.06 | 8.33±0.04 | 8.61±0.03 | 8.28±0.04 | 8.55±0.04 | 7.87±0.04 | 8.77±0.04 | 8.65±0.05 | 8.58±0.05 | ||||
| 环境因子 | r | P |
|---|---|---|
| Mg2+ | 0.7084 | <0.001 |
| TC | 0.5294 | <0.001 |
| HCO | 0.4575 | <0.001 |
| Ca2+ | 0.2455 | 0.002 |
| pH | 0.1806 | 0.007 |
| MOI | 0.1779 | 0.008 |
| EC | 0.1539 | 0.011 |
| SOC | 0.1529 | 0.013 |
| TN | 0.1371 | 0.018 |
表5 Mantel检验中与土壤细菌群落相关性最高的9个环境因子
Table 5 The nine environmental factors most associated with soil bacterial community by Mantel test
| 环境因子 | r | P |
|---|---|---|
| Mg2+ | 0.7084 | <0.001 |
| TC | 0.5294 | <0.001 |
| HCO | 0.4575 | <0.001 |
| Ca2+ | 0.2455 | 0.002 |
| pH | 0.1806 | 0.007 |
| MOI | 0.1779 | 0.008 |
| EC | 0.1539 | 0.011 |
| SOC | 0.1529 | 0.013 |
| TN | 0.1371 | 0.018 |
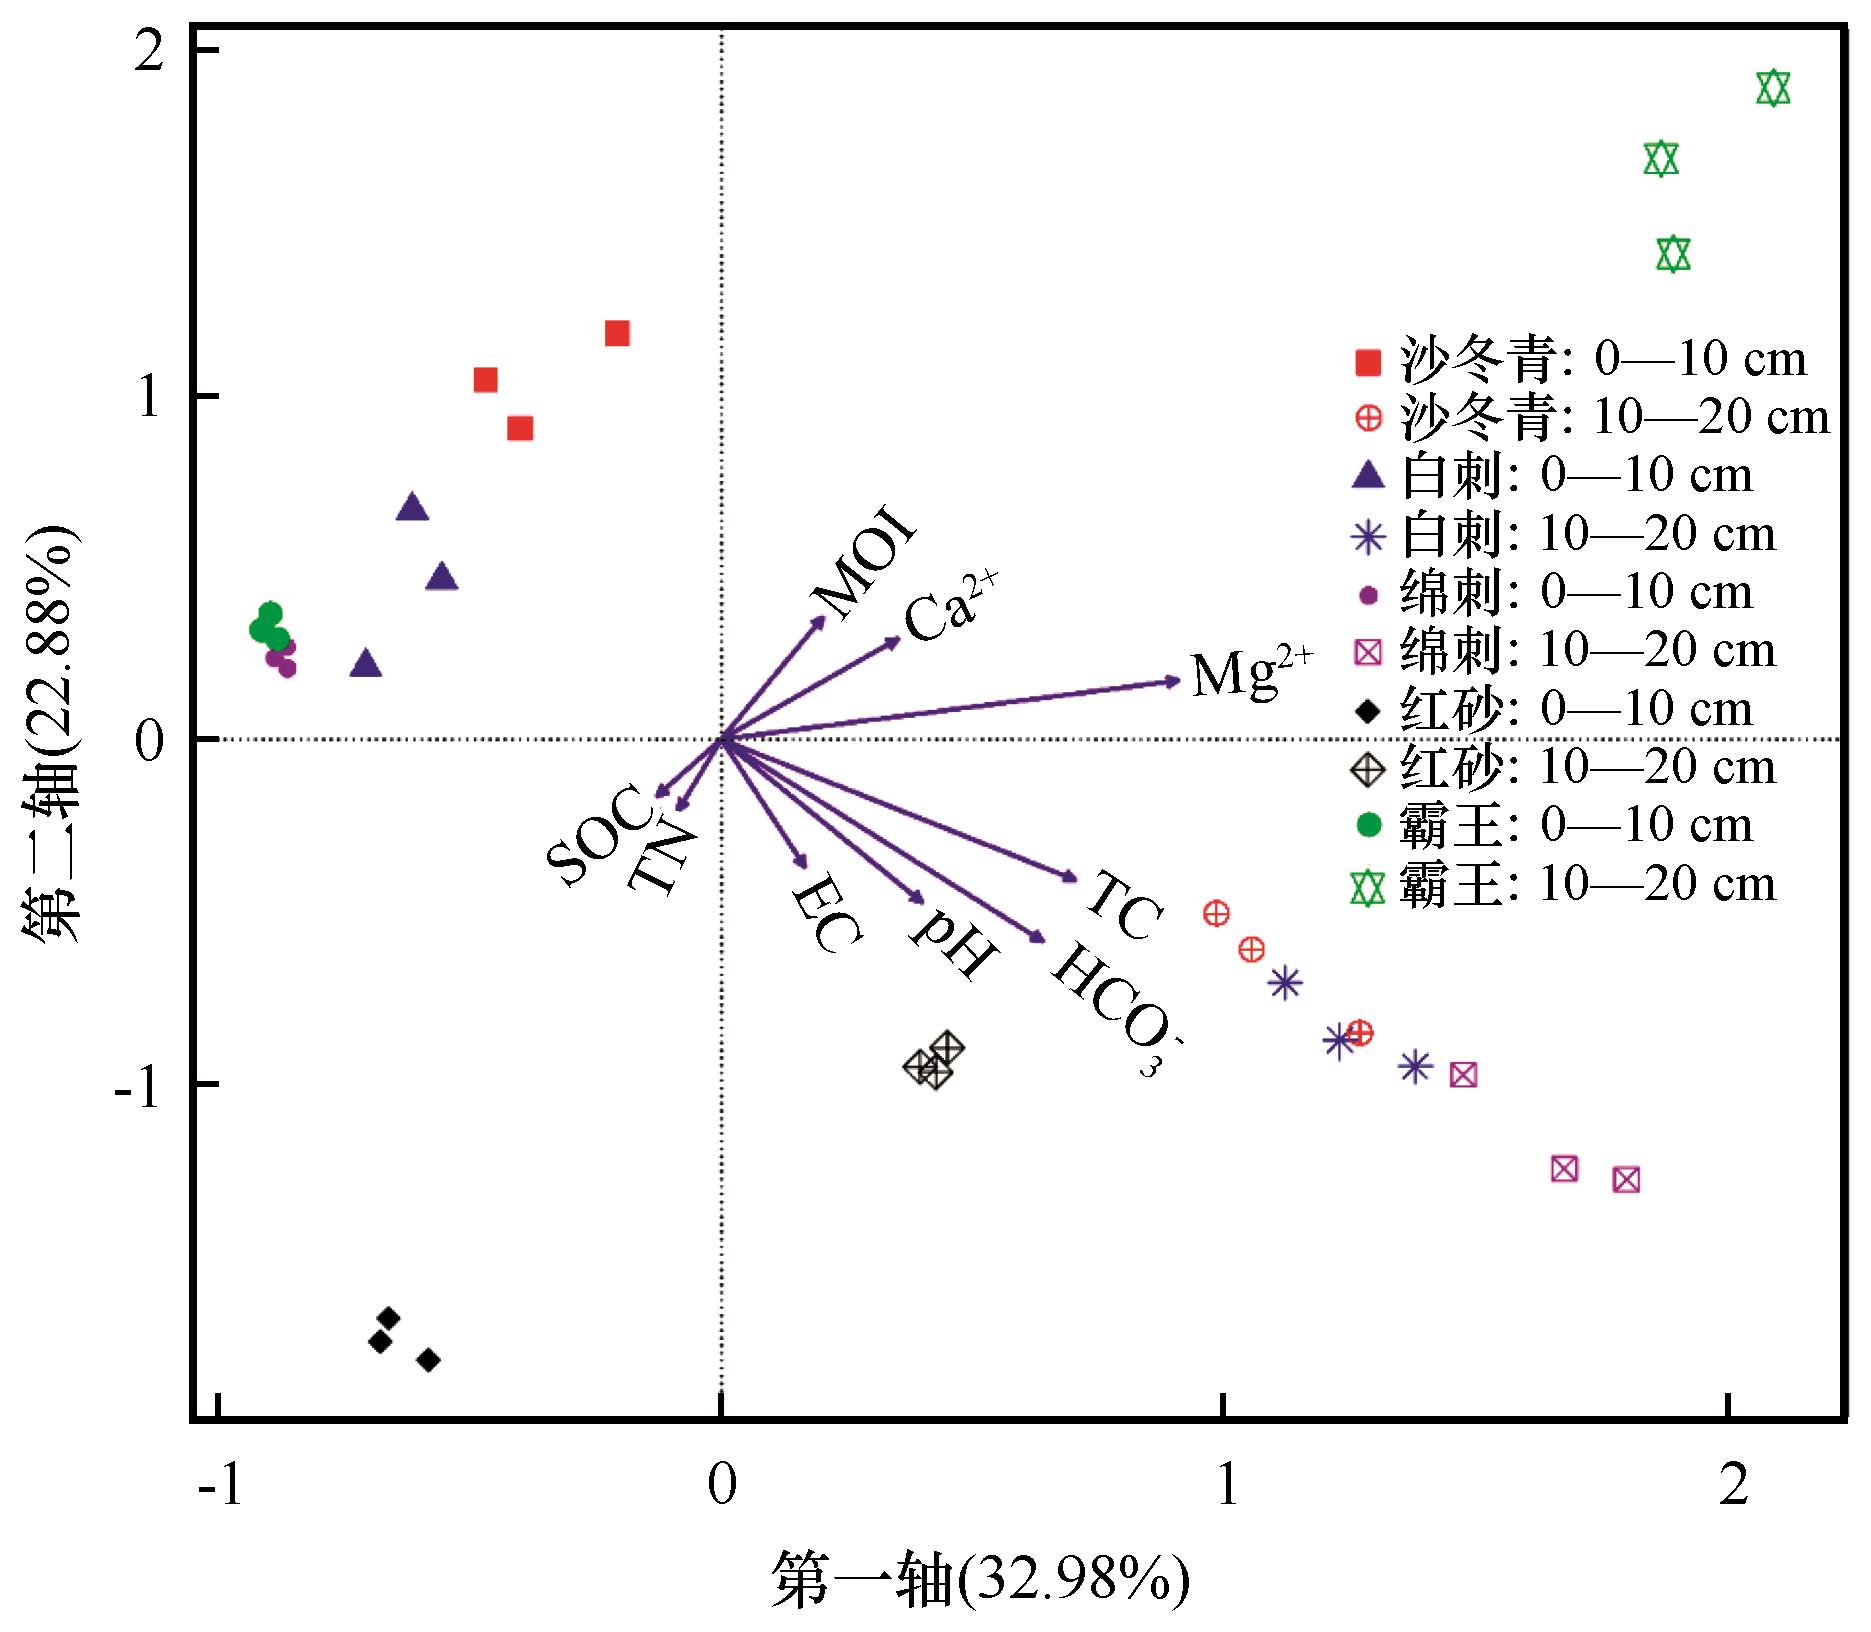
图4 9种环境因子与全样本土壤细菌群落的典型相关分析(CCA)排序TC=土壤全碳,MOI=土壤含水量,EC=土壤电导率,SOC=土壤有机碳,TN=土壤全氮
Fig.4 Ordination diagram of canonical correlation analysis of nine environmental factors and soil bacterial communities in all samples,
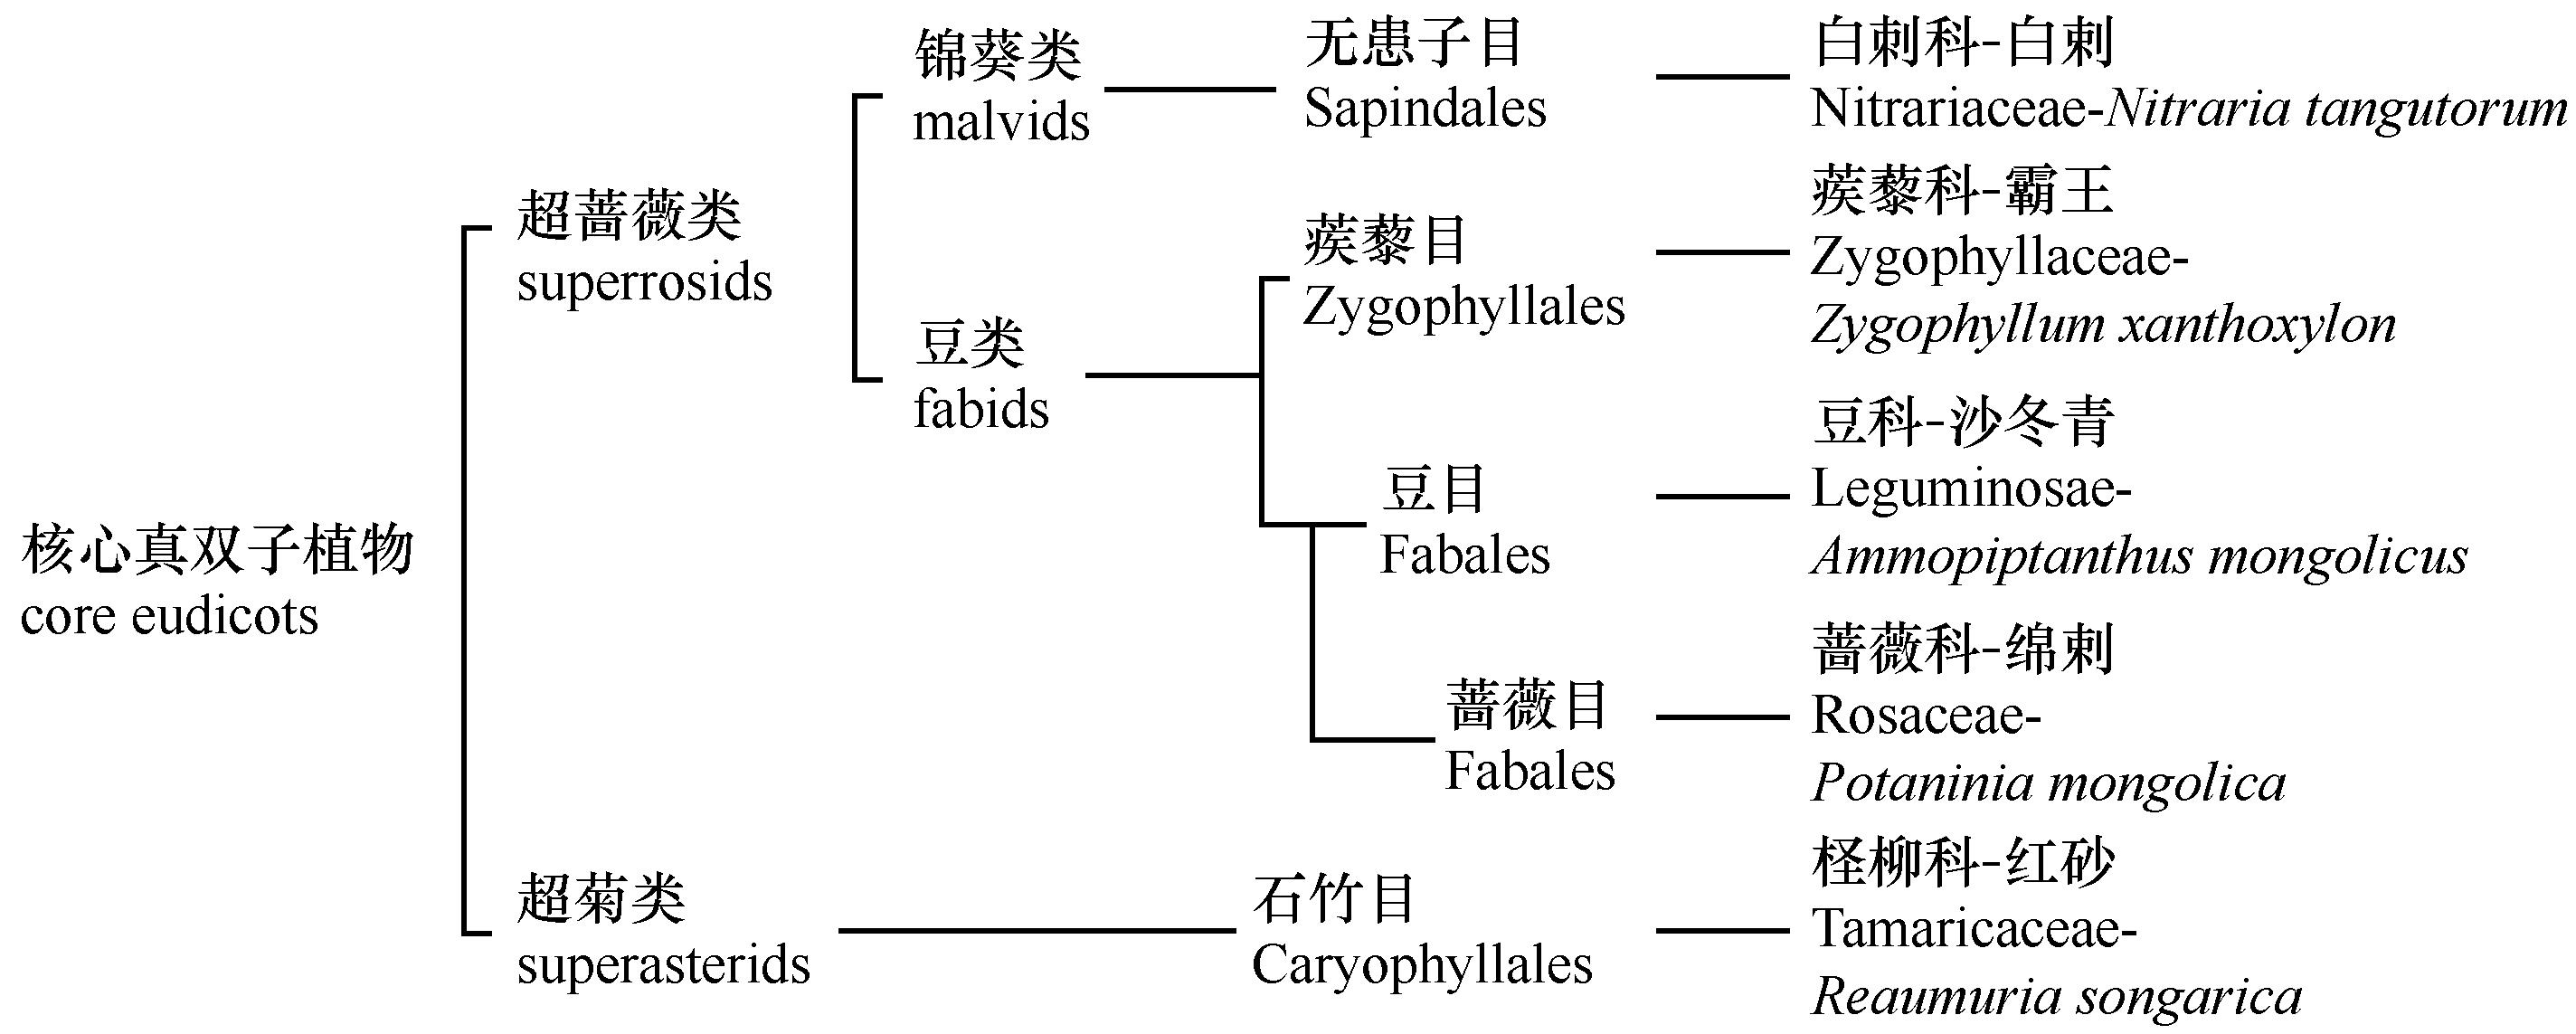
图5 5种灌木种系发生学亲缘关系(基于APG Ⅳ)
Fig.5 The phylogeny genetic relationship of five shrubs by APG Ⅳ
| 1 | 李骁,王迎春.土壤微生物多样性与植物多样性[J].内蒙古大学学报(自然科学版),2006,37(6):708-713. |
| 2 | 鲁海燕,徐艾诗,曹靖.微生物多样性对植物群落影响的研究进展[J].长春理工大学学报(自然科学版),2010,33(3):103-106. |
| 3 | 毕江涛,贺达汉.植物对土壤微生物多样性的影响研究进展[J].中国农学通报,2009,25(9):244-250. |
| 4 | Wardle D A,Bardgett R D,Klironomos J N,et al.Ecological linkages between aboveground and belowground biota[J].Science,2004,304:1629-1633. |
| 5 | Berg G,Smalla K.Plant species and soil type cooperatively shape the structure and function of microbial communities in the rhizosphere[J].FEMS Microbiology Ecology,2009,68:1-13. |
| 6 | Leloup J,Baude M,Nunan N,et al.Unravelling the effects of plant species diversity and aboveground litter input on soil bacterial communities[J].Geoderma,2018,317:1-7. |
| 7 | Barness G,Zaragoza S R,Shmueli I,et al.Vertical distribution of a soil microbial community as affected by plant ecophysiological adaptation in a desert system[J].Microbial Ecology,2009,57:36-49. |
| 8 | Sherman C,Marais E,Maggs-Kölling G,et al.Abiotic and plant gender effects on the structure and function of soil microbial communities associated with Acanthosicyos horridus (Nara) in the Namibian sand-dune desert ecosystem[J].Journal of Arid Environments,2019,163:50-58. |
| 9 | Li H,Xu Z,Yan Q,et al.Soil microbial beta-diversity is linked with compositional variation in aboveground plant biomass in a semi-arid grassland[J].Plant and Soil,2018,423:465-480. |
| 10 | 陈广生,曾德慧,陈伏生,等.干旱和半干旱地区灌木下土壤“肥岛”研究进展[J].应用生态学报,2003(12):2295-2300. |
| 11 | Dunbar J,Barns S M,Ticknor L O,et al.Empirical and theoretical bacterial diversity in four Arizona soils[J].Applied and Environmental Microbiology,2002,68(6):3035-3045. |
| 12 | Huang J,Yu H,Guan X,et al.Accelerated dryland expansion under climate change[J].Nature Climate Change,2015,6(2):2837-2842. |
| 13 | Yi C,Wei S,Hendrey G.Warming climate extends dryness-controlled areas of terrestrial carbon sequestration[J].Scientific Reports,2014,4:5472-5477. |
| 14 | Zhou Z Y,Yan S Y,Qin Y,et al.The characters of shrub by diversity of Alxa arid desert region[J].Journal of Arid Land Resources and Environment,2009,23(9):146-150. |
| 15 | 胡亚林,汪思龙,颜绍馗.影响土壤微生物活性与群落结构因素研究进展[J].土壤通报,2006,37(1):170-176. |
| 16 | Pointing S B,Belnap J.Microbial colonization and controls in dryland systems[J].Nature Reviews Microbiology,2012,10:551-562. |
| 17 | Kennedy A C,Smith K L.Soil microbial diversity and the sustainability of agricultural soils[J].Plant & Soil,1995,170:75-86. |
| 18 | Somova L A,Pechurkin N S.Functional,regulatory and indicator features of microorganisms in man-made ecosystems[J].Advances in Space Research,2001,27(9):1563-1570. |
| 19 | 肖生春,陈小红,丁爱军.近现代阿拉善荒漠气候变化与环境演变机制研究进展[J].中国沙漠,2017,37(6):1102-1110. |
| 20 | 乌仁塔娜,王玉霞,高润宏.阿拉善荒漠功能灌木群分布格局[J].中国农学通报,2013,29(19):79-83. |
| 21 | 卢琦,王继和,褚建民,等.中国荒漠植物图鉴[M].北京:中国林业出版社,2012:206-369. |
| 22 | 孙艳霞,杨九艳,乔宜青,等.阿拉善高原红砂(Reaumuria songarica)种群空间分布格局[J].中国沙漠,2020,40(1):105-115. |
| 23 | 周航宇,包爱科,杜宝强,等.荒漠植物红砂响应高浓度NaCl的生理机制[J].草业科学,2012,29(1):77-81. |
| 24 | 王继和,吴春荣.甘肃荒漠区濒危植物绵刺生理生态学特性的研究[J].中国沙漠,2000,20(4):397-403. |
| 25 | 肖星卉,高润宏,王树森,等.西鄂尔多斯古地中海孑遗植物干旱胁迫与保护酶响应研究[J].内蒙古科技与经济,2018(12):58-60. |
| 26 | 郭丁,裴世芳,俞斌华,等.阿拉善荒漠草地几种灌木对土壤有效态养分的影响[J].中国沙漠,2009,29(1):95-100. |
| 27 | 王彦阁,杨晓晖,于春堂,等.白刺属植物现状、生态功能及保护策略[J].水土保持研究,2007,14(3):74-79. |
| 28 | 杨鑫光,傅华,李晓东.干旱胁迫对霸王水分生理特征及细胞膜透性的影响[J].西北植物学报,2009,29(10):2076-2083. |
| 29 | 王静娅,王明亮,张凤华.干旱区典型盐生植物群落下土壤微生物群落特征[J].生态学报,2016,36(8):2363-2372. |
| 30 | 李欣玫,左易灵,薛子可,等.不同荒漠植物根际土壤微生物群落结构特征[J].生态学报,2018,38(8):2855-2863. |
| 31 | 席军强,杨自辉,郭树江,等.民勤绿洲-沙漠过渡带土壤微生物数量特征[J].干旱区资源与环境,2015,29(7):116-121. |
| 32 | 裴浩,朱宗元,梁存柱,等.阿拉善荒漠区生态环境特征与环境保护[M].北京:气象出版社,2011:15-16. |
| 33 | Zhou J,Bruns M V,Tiedje J M.DNA recovery from soils of diverse composition[J].Applied and Environmental Microbiology,1996,62:316-322. |
| 34 | Michelsen C F,Pedas P,Glaring M A,et al.Bacterial diversity in Greenlandic soils as affected by potato cropping and inorganic versus organic fertilization[J].Polar Biology,2014,37:61-71. |
| 35 | Martin M.Cutadapt removes adapter sequences from high-throughput sequencing reads[J].Embnet Journal,2011,17:10-12. |
| 36 | Edgar R C,Haas B J,Clemente J C,et al.UCHIME improves sensitivity and speed of chimera detection[J].Bioinformatics,2011,27:2194-2200. |
| 37 | Vance E D,Brooks P C,Jenkinson D S.An extraction method for measuring soil microbial biomass C[J].Soil Biology & Biochemistry,1987,19(6):703-707. |
| 38 | 李月飞,陈林,李学斌,等.荒漠草原灌丛沃岛的结构特征和生态效应[J].草业科学,2018,35(10):2327-2335. |
| 39 | 尹传华,董积忠,石秋梅,等.不同生境下盐生灌木盐岛效应的变化及生态学意义[J].土壤学报,2012,49(2):289-295. |
| 40 | Lozupone C,Lladser M E,Knights D,et al.UniFrac: an effective distance metric for microbial community comparison[J].The ISME Journal,2011,5:169-172. |
| 41 | Angiosperm Phylogeny Group.An update of the Angiosperm Phylogeny Group classification for the orders and families of flowering plants:APG IV[J].Botanical Journal of the Linnean Society,2016,181(1):1-20. |
| 42 | Jones P,Garcia B J,Furches A,et al.Plant host-associated mechanisms for microbial selection[J].Frontiers in Plant Science,2019,10:862. |
| 43 | Chen M Y,Wu S H,Lin G H,et al.Rubrobacter taiwanensis sp.nov.a novel thermophilic,radiation-resistant species isolated from hot springs[J].International Journal of Systematic & Evolutionary Microbiology,2004,54(5):1849-1855. |
| 44 | Sun H M,Zhang T,Yu L Y,et al.Ubiquity,diversity and physiological characteristics of Geodermatophilaceae in Shapotou National Desert Ecological Reserve[J].Frontiers in Microbiology,2015,6:Article1059. |
| 45 | Yoshida N,Inaba S,Takagi H.Utilization of atmospheric ammonia by an extremely oligotrophic bacterium,Rhodococcus erythropolis N9T-4[J].Journal of Bioence & Bioengineering,2014,117(1):28-32. |
| 46 | Wang S M,Wan C G,Wang Y R,et al.The characteristics of Na+,K+ and free proline distribution in several drought-resistant plants of the Alxa Desert,China[J].Journal of Arid Environments,2004,56:525-539. |
| 47 | Duval C,Thomazeau S,Drelin Y,et al.Phylogeny and salt-tolerance of freshwater Nostocales strains: contribution to their systematics and evolution[J].Harmful Algae,2018,73:58-71. |
| 48 | Gilbert P,Rickard A H.Adhaeribacter[M]//Whitman W B.Bergey’s Manual of Systematics of Archaea and Bacteria.Hoboken:John Wiley & Sons,Inc,2015. |
| 49 | 刘光琇,陈拓,李师翁,等.极端环境微生物学[M].北京:科学出版社,2016:34-36. |
| [1] | 董六文, 韩佳龙, 赵文智, 刘继亮, 巴义彬. 黑河流域湖泊湿地及毗邻沙丘地表节肢动物群落结构比较[J]. 中国沙漠, 2020, 40(6): 250-258. |
| [2] | 刘任涛, 张安宁. 固沙灌丛林营造初期地面节肢动物群落结构特征[J]. 中国沙漠, 2020, 40(5): 190-199. |
| [3] | 周子渊, 于明含, 丁国栋, 高广磊, 何莹莹. 毛乌素沙地锦鸡儿(Caragana)根系微域细菌群落多样性特征[J]. 中国沙漠, 2020, 40(4): 128-137. |
| [4] | 李得禄, 马全林, 张锦春, 陈芳, 李新荣, 袁宏波, 魏林源, 杨昊天, 张忠. 腾格里沙漠植被特征[J]. 中国沙漠, 2020, 40(4): 223-233. |
| [5] | 王昱, 刘娟娟, 冯起, 刘贤德, 王之君, 郭亚敏, 孔德星. 黑河底栖动物群落结构及生物多样性[J]. 中国沙漠, 2020, 40(1): 125-135. |
| [6] | 熊炳桥, 赵丽娅, 高丹丹. 围封对退化沙质草地植物群落的影响[J]. 中国沙漠, 2018, 38(2): 324-328. |
| [7] | 李婷, 张威, 刘光琇, 陈拓. 荒漠土壤微生物群落结构特征研究进展[J]. 中国沙漠, 2018, 38(2): 329-338. |
| [8] | 丁爱军, 肖生春, 彭小梅, 田全彦. 霸王(Sarcozygium xanthoxylon)灌木年轮记录的1902-2015年阿拉善荒漠中部气候干湿变化[J]. 中国沙漠, 2018, 38(2): 401-409. |
| [9] | 刘任涛, 郗伟华, 刘佳楠, 赵娟, 常海涛. 沙地柠条(Caragana)灌丛微生境节肢动物群落特征[J]. 中国沙漠, 2018, 38(1): 117-125. |
| [10] | 肖生春, 陈小红, 丁爱军. 近现代阿拉善荒漠气候变化与环境演变机制研究进展[J]. 中国沙漠, 2017, 37(6): 1102-1110. |
| [11] | 王少昆, 赵学勇, 贾昆峰, 高宝兰, 曲浩, 毛伟, 连杰, 陈敏, 朱阳春. 乌拉特荒漠草原小针茅(Stipa klemenzii)群落土壤细菌多样性及垂直分布特征[J]. 中国沙漠, 2016, 36(6): 1564-1570. |
| [12] | 赵光辉, 苏芳莉, 李海福, 李一鸣. 辽河干流上游流域土地利用对土壤颗粒分形维数影响[J]. 中国沙漠, 2016, 36(6): 1622-1627. |
| [13] | 殷玲, 张德平, 成永会, 赵家明, 靳立宁, 海军, 巴日斯, 祁晓燕, 屈建新. 车辆碾压对沙质草原表土物理力学性质的影响[J]. 中国沙漠, 2015, 35(5): 1177-1182. |
| [14] | 殷玲, 张德平, 成永会, 靳立宁, 赵家明, 巴日斯, 海军, 祁晓燕, 屈建新. 呼伦贝尔沙质草原表土物理力学性质[J]. 中国沙漠, 2015, 35(4): 930-936. |
| [15] | 徐正金, 罗明, 王卫霞, 王纯利. 3种典型荒漠灌木内生固氮菌及固氮酶基因nifH多样性分析[J]. 中国沙漠, 2014, 34(2): 472-480. |
| 阅读次数 | ||||||
|
全文 |
|
|||||
|
摘要 |
|
|||||
©2018中国沙漠 编辑部
地址: 兰州市天水中路8号 (730000)
电话:0931-8267545
Email:caiedit@lzb.ac.cn;desert@lzb.ac.cn

 甘公网安备 62010202000688号