
- CN 62-1070/P
- ISSN 1000-694X
- Bimonthly 1981
Journal of Desert Research ›› 2021, Vol. 41 ›› Issue (6): 29-40.DOI: 10.7522/j.issn.1000-694X.2021.00085
Previous Articles Next Articles
Yanhui Lei1( ), Guodong Ding1, Zimeng Li1, Wenfeng Chi2, Guanglei Gao1, Yuanyuan Zhao1()
Received:2021-02-10
Revised:2021-06-28
Online:2021-11-20
Published:2021-12-17
Contact:
Yuanyuan Zhao
CLC Number:
Yanhui Lei, Guodong Ding, Zimeng Li, Wenfeng Chi, Guanglei Gao, Yuanyuan Zhao. Land use/cover change and its ecosystem service value response in the Beijing-Tianjin sandstorm source control project area[J]. Journal of Desert Research, 2021, 41(6): 29-40.
Add to citation manager EndNote|Ris|BibTeX
URL: http://www.desert.ac.cn/EN/10.7522/j.issn.1000-694X.2021.00085
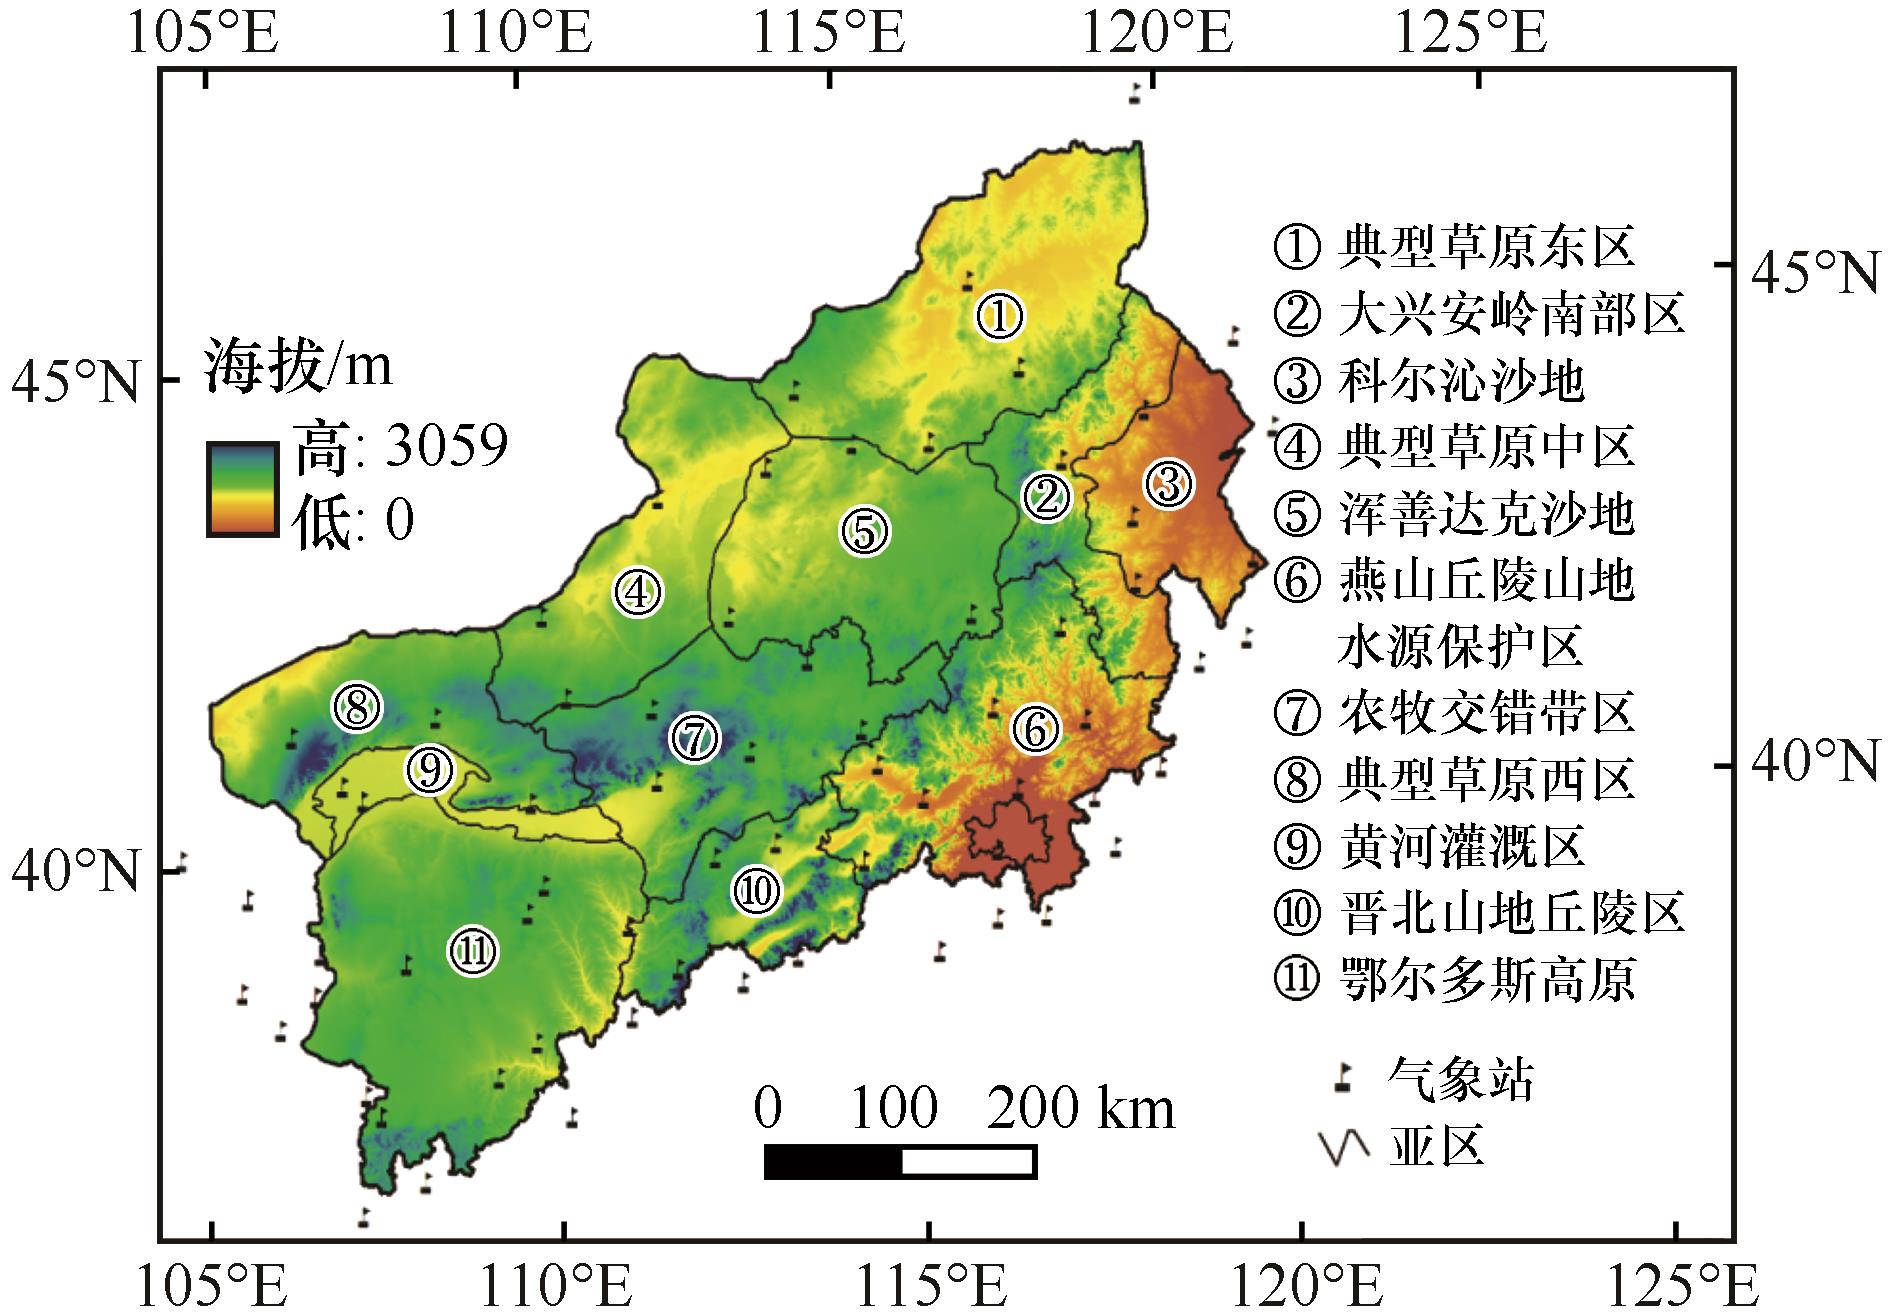
Fig.1 The studied area
| 一级类型 | 二级类型 | 森林 | 草地 | 农田 | 水域 | 沙地 | |||
|---|---|---|---|---|---|---|---|---|---|
| 高覆盖度 | 中覆盖度 | 低覆盖度 | 高流动性 | 低流动性 | |||||
| 供给服务 | 食物生产 | 0.33 | 0.68 | 0.43 | 0.18 | 1 | 0.53 | 0.02 | 0.01 |
| 原材料生产 | 2.98 | 0.57 | 0.36 | 0.15 | 0.39 | 0.35 | 0.05 | 0.02 | |
| 调节服务 | 气体调节 | 4.32 | 2.39 | 1.5 | 0.62 | 0.72 | 0.51 | 0.07 | 0.03 |
| 气候调节 | 4.07 | 2.48 | 1.56 | 0.64 | 0.97 | 2.06 | 0.16 | 0.07 | |
| 水文调节 | 4.09 | 2.42 | 1.52 | 0.62 | 0.77 | 18.77 | 0.09 | 0.04 | |
| 废物处理 | 1.72 | 2.10 | 1.32 | 0.54 | 1.39 | 14.85 | 0.32 | 0.14 | |
| 支持服务 | 保持土壤 | 4.02 | 3.56 | 2.24 | 0.92 | 1.47 | 0.41 | 0.21 | 0.09 |
| 文化服务 | 维持生物多样性 | 4.51 | 2.97 | 1.87 | 0.77 | 1.02 | 3.43 | 0.49 | 0.22 |
| 提供美学景观 | 2.08 | 1.38 | 0.87 | 0.36 | 0.17 | 4.44 | 0.30 | 0.13 | |
| 合计 | 28.12 | 18.56 | 11.67 | 4.78 | 7.9 | 45.35 | 1.71 | 0.75 | |
Table 1 Ecosystem service equivalent per unit area
| 一级类型 | 二级类型 | 森林 | 草地 | 农田 | 水域 | 沙地 | |||
|---|---|---|---|---|---|---|---|---|---|
| 高覆盖度 | 中覆盖度 | 低覆盖度 | 高流动性 | 低流动性 | |||||
| 供给服务 | 食物生产 | 0.33 | 0.68 | 0.43 | 0.18 | 1 | 0.53 | 0.02 | 0.01 |
| 原材料生产 | 2.98 | 0.57 | 0.36 | 0.15 | 0.39 | 0.35 | 0.05 | 0.02 | |
| 调节服务 | 气体调节 | 4.32 | 2.39 | 1.5 | 0.62 | 0.72 | 0.51 | 0.07 | 0.03 |
| 气候调节 | 4.07 | 2.48 | 1.56 | 0.64 | 0.97 | 2.06 | 0.16 | 0.07 | |
| 水文调节 | 4.09 | 2.42 | 1.52 | 0.62 | 0.77 | 18.77 | 0.09 | 0.04 | |
| 废物处理 | 1.72 | 2.10 | 1.32 | 0.54 | 1.39 | 14.85 | 0.32 | 0.14 | |
| 支持服务 | 保持土壤 | 4.02 | 3.56 | 2.24 | 0.92 | 1.47 | 0.41 | 0.21 | 0.09 |
| 文化服务 | 维持生物多样性 | 4.51 | 2.97 | 1.87 | 0.77 | 1.02 | 3.43 | 0.49 | 0.22 |
| 提供美学景观 | 2.08 | 1.38 | 0.87 | 0.36 | 0.17 | 4.44 | 0.30 | 0.13 | |
| 合计 | 28.12 | 18.56 | 11.67 | 4.78 | 7.9 | 45.35 | 1.71 | 0.75 | |
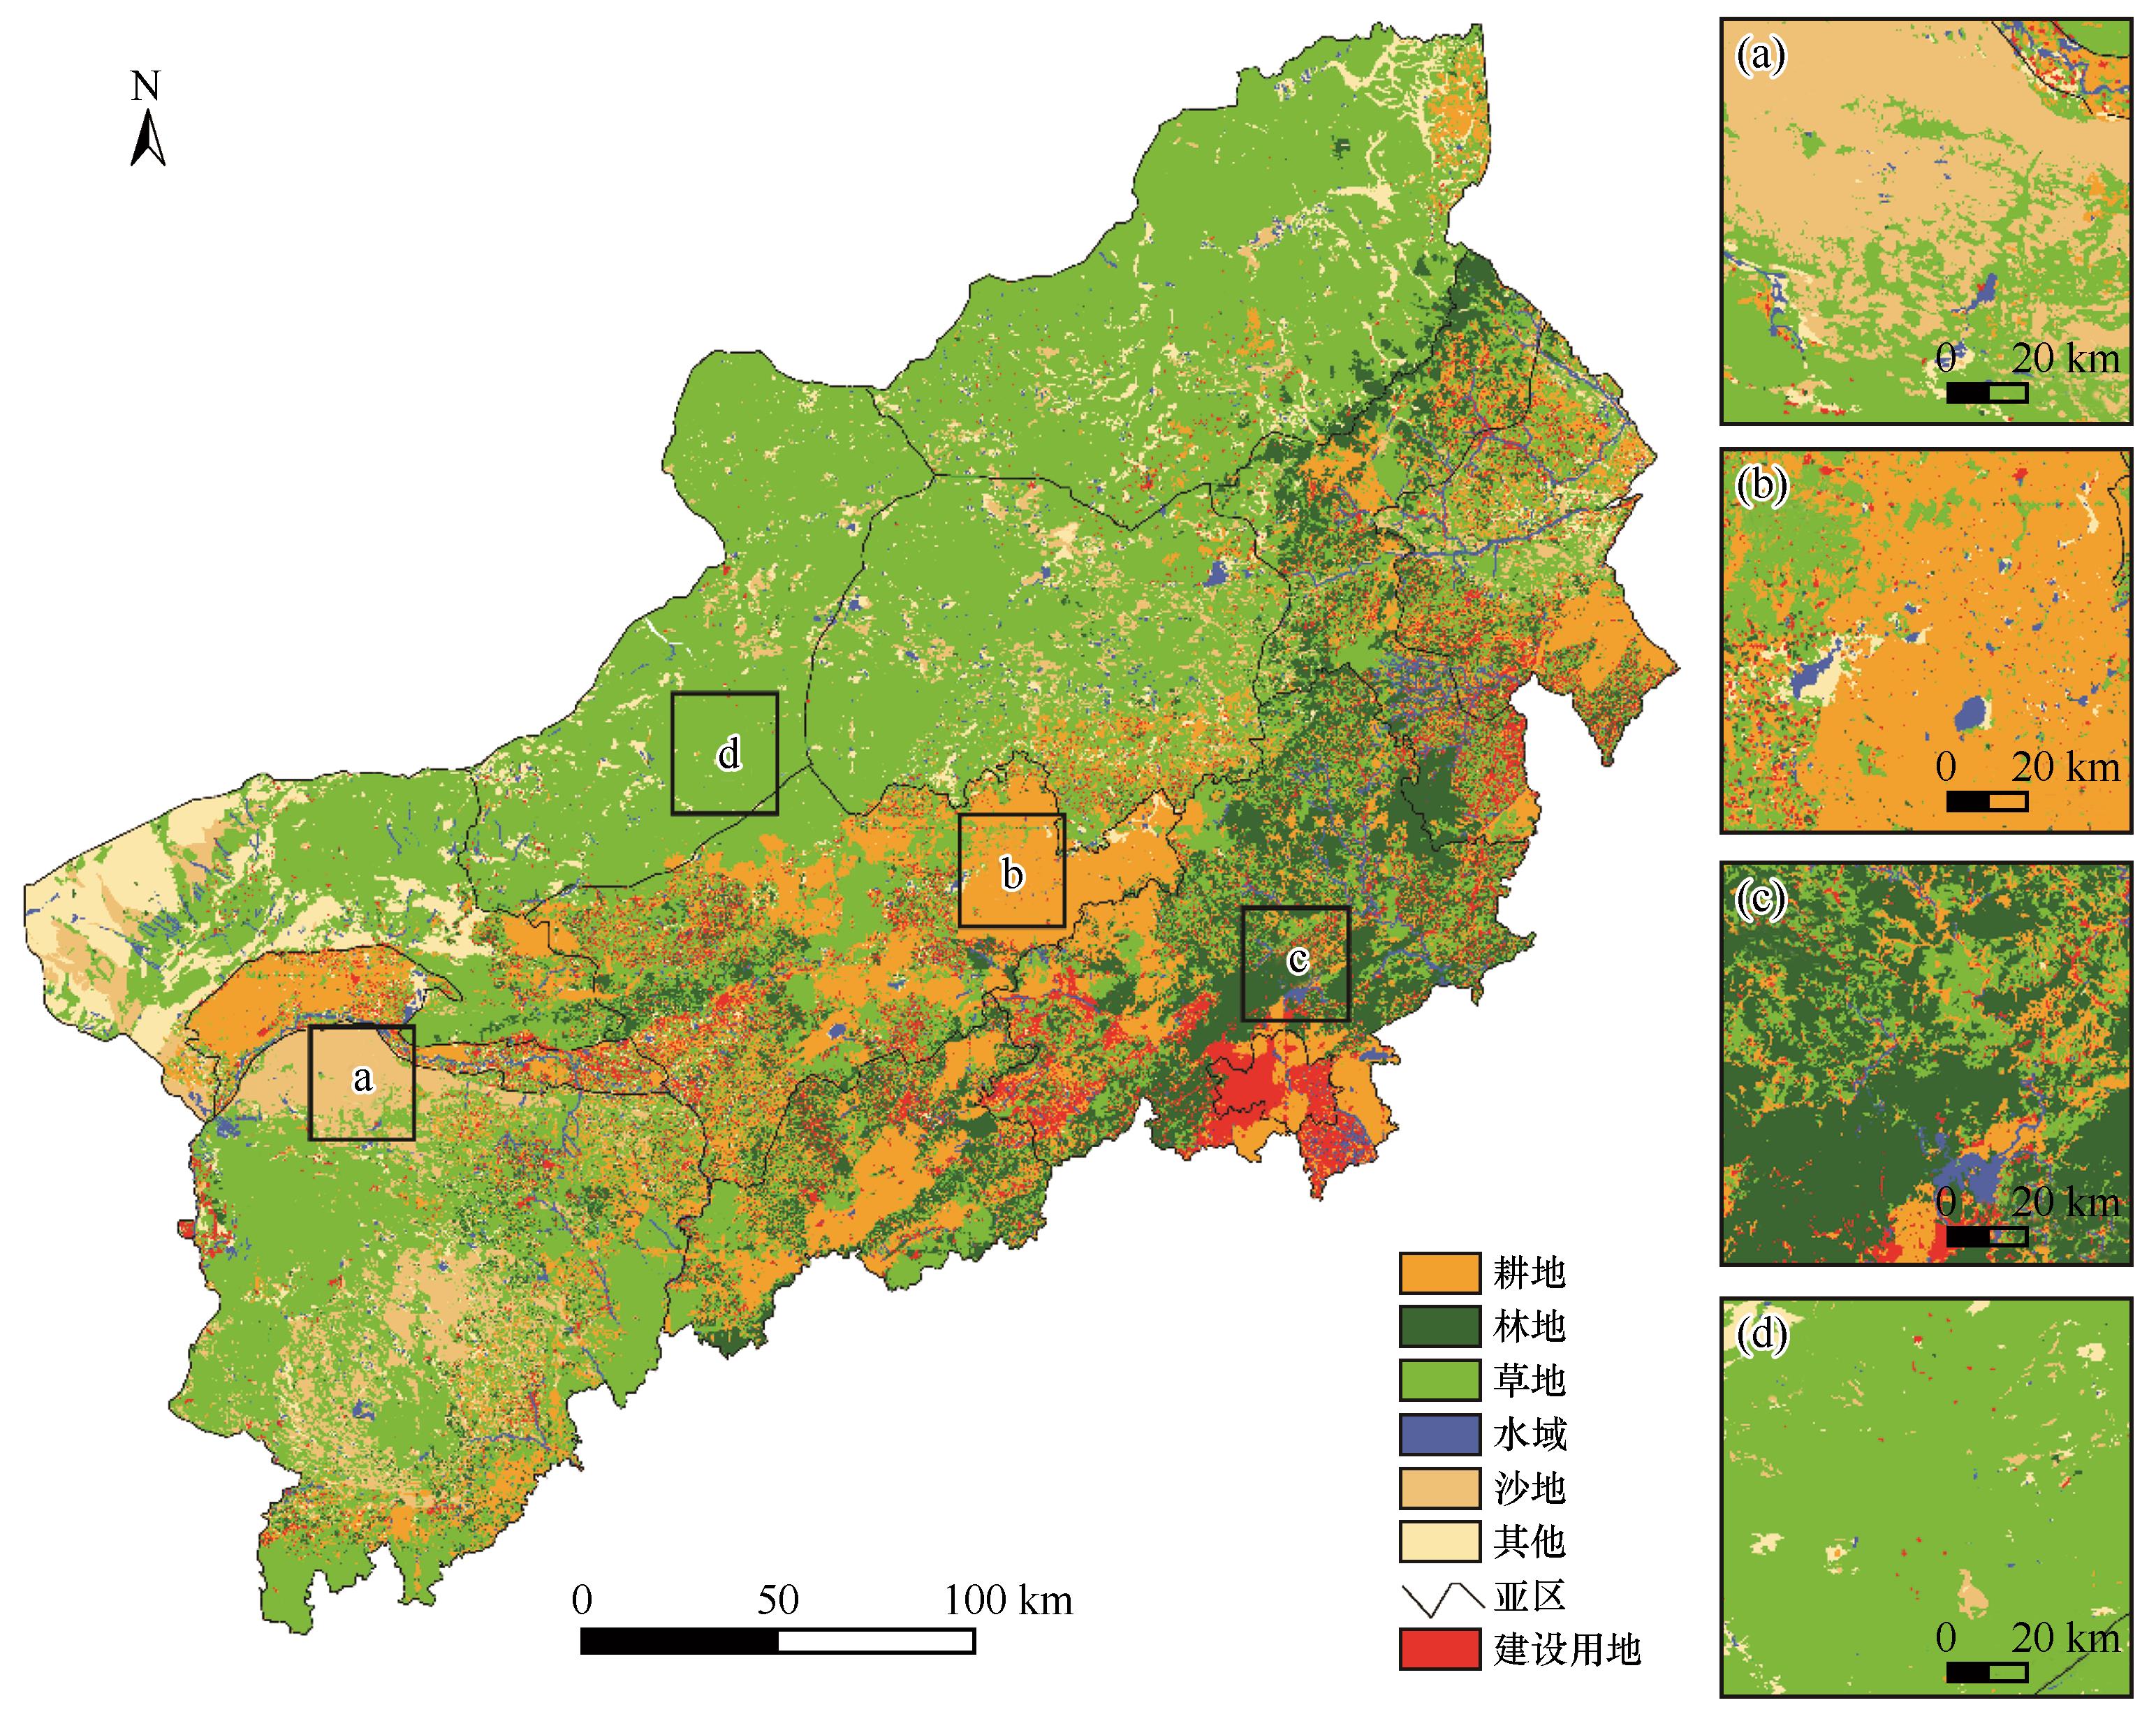
Fig.2 Land use/cover pattern of the Beijing-Tianjin sandstorm source control project area in 2018
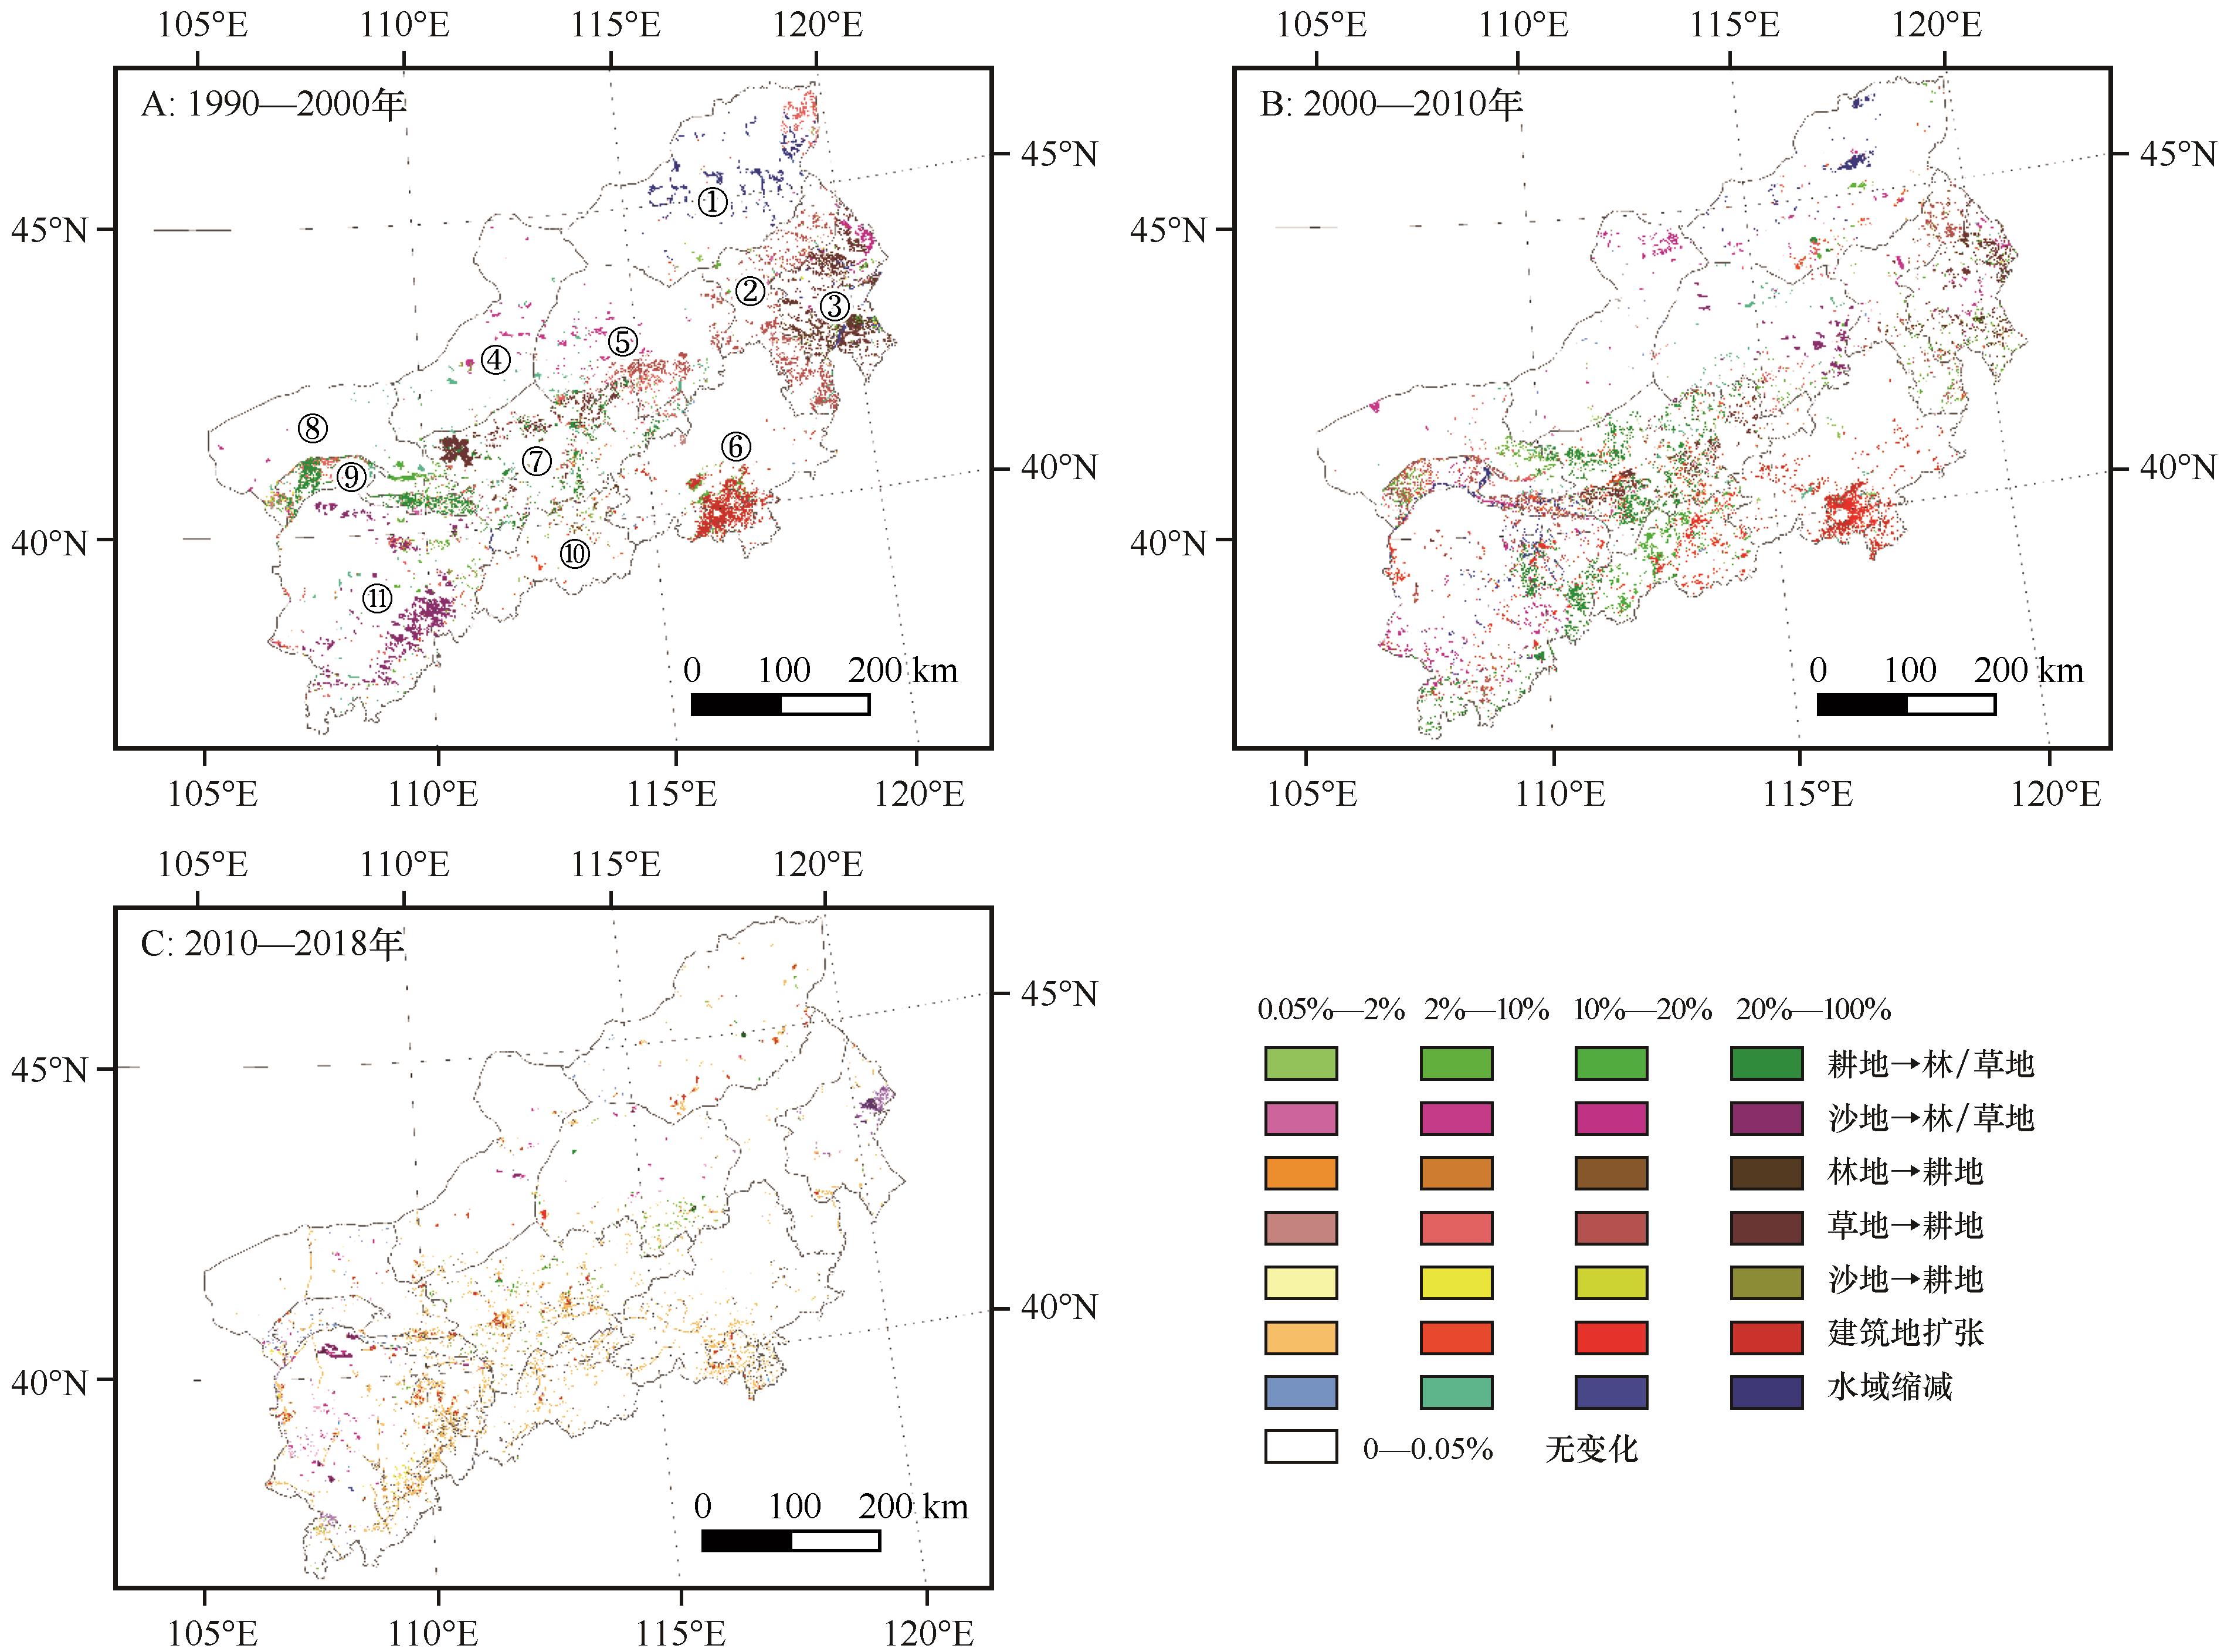
Fig.3 Changes in land use/cover types in the Beijing-Tianjin sandstorm source control project area from 1990 to 2018
| 地类 | 沙地 | 草地 | 耕地 | 林地 |
|---|---|---|---|---|
| 全区 | 10.96* | 1.10 | 7.65 | -2.95 |
| 大兴安岭南部区 | -29.77** | -17.92* | -17.31* | -21.89** |
| 典型草原东区 | -31.05** | -5.18 | -4.72 | -20.67 |
| 典型草原西区 | 2.23 | 4.90 | 17.10** | 13.48* |
| 典型草原中区 | -6.83 | -1.79 | -11.05 | |
| 科尔沁沙地 | -8.14* | -14.38 | -6.86 | -6.94 |
| 浑善达克沙地 | 5.10 | -3.40 | 2.74 | 8.66 |
| 黄河灌溉区 | 11.13 | 29.48** | 22.71** | -11.28 |
| 燕山丘陵山地水源保护区 | -7.83 | 5.30 | 6.00 | 1.06 |
| 鄂尔多斯高原 | 19.48** | 24.28** | 46.20** | 34.43** |
| 晋北山地丘陵区 | 28.31** | 25.28** | 20.57** | |
| 农牧交错带区 | -38.43** | -3.60 | -3.02 | -12.01 |
Table 2 The slope of vegetation cover change of different land types in the Beijing-Tianjin sandstorm source control project area and each sub-region from 1990 to 2018
| 地类 | 沙地 | 草地 | 耕地 | 林地 |
|---|---|---|---|---|
| 全区 | 10.96* | 1.10 | 7.65 | -2.95 |
| 大兴安岭南部区 | -29.77** | -17.92* | -17.31* | -21.89** |
| 典型草原东区 | -31.05** | -5.18 | -4.72 | -20.67 |
| 典型草原西区 | 2.23 | 4.90 | 17.10** | 13.48* |
| 典型草原中区 | -6.83 | -1.79 | -11.05 | |
| 科尔沁沙地 | -8.14* | -14.38 | -6.86 | -6.94 |
| 浑善达克沙地 | 5.10 | -3.40 | 2.74 | 8.66 |
| 黄河灌溉区 | 11.13 | 29.48** | 22.71** | -11.28 |
| 燕山丘陵山地水源保护区 | -7.83 | 5.30 | 6.00 | 1.06 |
| 鄂尔多斯高原 | 19.48** | 24.28** | 46.20** | 34.43** |
| 晋北山地丘陵区 | 28.31** | 25.28** | 20.57** | |
| 农牧交错带区 | -38.43** | -3.60 | -3.02 | -12.01 |
| 生态系统 服务价值 | 年份 | 森林 | 草地 | 农田 | 水域 | 沙地 | 总计 | |||
|---|---|---|---|---|---|---|---|---|---|---|
| 高覆盖度 | 中覆盖度 | 低覆盖度 | 高流动性 | 低流动性 | ||||||
| ESV/亿元 | 1990 | 6 387.25 | 8 449.63 | 10 390.41 | 827.84 | 3 315.51 | 1 714.54 | 185.40 | 47.87 | 31 318.45 |
| 2000 | 6 405.30 | 5 644.79 | 11 729.61 | 946.75 | 3 368.87 | 1 789.86 | 163.73 | 48.40 | 30 097.31 | |
| 2010 | 7 235.87 | 5 540.25 | 10 176.80 | 1 335.99 | 3 374.98 | 1 600.82 | 190.61 | 42.77 | 29 498.09 | |
| 2018 | 7 315.39 | 20 438.16 | 1 540.79 | 479.76 | 3 349.75 | 1 667.06 | 127.18 | 55.57 | 34 973.66 | |
| 贡献率/% | 1990 | 20.39 | 26.98 | 33.18 | 2.64 | 10.59 | 5.47 | 0.59 | 0.15 | 100.00 |
| 2000 | 21.28 | 18.76 | 38.97 | 3.15 | 11.19 | 5.95 | 0.54 | 0.16 | 100.00 | |
| 2010 | 24.53 | 18.78 | 34.50 | 4.53 | 11.44 | 5.43 | 0.65 | 0.14 | 100.00 | |
| 2018 | 20.92 | 58.44 | 4.41 | 1.37 | 9.58 | 4.77 | 0.36 | 0.16 | 100.00 | |
| 变化量/亿元 | 1990—2000 | 18.05 | -2 804.84 | 1 339.20 | 118.91 | 53.36 | 75.32 | -21.67 | 0.53 | -1 221.14 |
| 2000—2010 | 830.57 | -104.54 | -1 552.81 | 389.24 | 6.11 | -189.04 | 26.88 | -5.63 | -599.22 | |
| 2010—2018 | 79.52 | 14 897.91 | -8 636.01 | -856.23 | -25.23 | 66.24 | -63.43 | 12.80 | 5 475.57 | |
| 1990—2018 | 928.14 | 11 988.53 | -8 849.62 | -348.08 | 34.24 | -47.48 | -58.22 | 7.70 | 3 655.21 | |
| 变化率/% | 1990—2000 | 0.28 | -33.19 | 12.89 | 14.36 | 1.61 | 4.39 | -11.69 | 1.11 | -3.90 |
| 2000—2010 | 12.97 | -1.85 | -13.24 | 41.11 | 0.18 | -10.56 | 16.42 | -11.63 | -1.99 | |
| 2010—2018 | 1.10 | 268.90 | -84.86 | -64.09 | -0.75 | 4.14 | -33.28 | 29.93 | 18.56 | |
| 1990—2018 | 14.53 | 141.88 | -85.17 | -42.05 | 1.03 | -2.77 | -31.40 | 16.09 | 11.67 | |
Table 3 Changes in the ecosysterm services value of different land use/covers
| 生态系统 服务价值 | 年份 | 森林 | 草地 | 农田 | 水域 | 沙地 | 总计 | |||
|---|---|---|---|---|---|---|---|---|---|---|
| 高覆盖度 | 中覆盖度 | 低覆盖度 | 高流动性 | 低流动性 | ||||||
| ESV/亿元 | 1990 | 6 387.25 | 8 449.63 | 10 390.41 | 827.84 | 3 315.51 | 1 714.54 | 185.40 | 47.87 | 31 318.45 |
| 2000 | 6 405.30 | 5 644.79 | 11 729.61 | 946.75 | 3 368.87 | 1 789.86 | 163.73 | 48.40 | 30 097.31 | |
| 2010 | 7 235.87 | 5 540.25 | 10 176.80 | 1 335.99 | 3 374.98 | 1 600.82 | 190.61 | 42.77 | 29 498.09 | |
| 2018 | 7 315.39 | 20 438.16 | 1 540.79 | 479.76 | 3 349.75 | 1 667.06 | 127.18 | 55.57 | 34 973.66 | |
| 贡献率/% | 1990 | 20.39 | 26.98 | 33.18 | 2.64 | 10.59 | 5.47 | 0.59 | 0.15 | 100.00 |
| 2000 | 21.28 | 18.76 | 38.97 | 3.15 | 11.19 | 5.95 | 0.54 | 0.16 | 100.00 | |
| 2010 | 24.53 | 18.78 | 34.50 | 4.53 | 11.44 | 5.43 | 0.65 | 0.14 | 100.00 | |
| 2018 | 20.92 | 58.44 | 4.41 | 1.37 | 9.58 | 4.77 | 0.36 | 0.16 | 100.00 | |
| 变化量/亿元 | 1990—2000 | 18.05 | -2 804.84 | 1 339.20 | 118.91 | 53.36 | 75.32 | -21.67 | 0.53 | -1 221.14 |
| 2000—2010 | 830.57 | -104.54 | -1 552.81 | 389.24 | 6.11 | -189.04 | 26.88 | -5.63 | -599.22 | |
| 2010—2018 | 79.52 | 14 897.91 | -8 636.01 | -856.23 | -25.23 | 66.24 | -63.43 | 12.80 | 5 475.57 | |
| 1990—2018 | 928.14 | 11 988.53 | -8 849.62 | -348.08 | 34.24 | -47.48 | -58.22 | 7.70 | 3 655.21 | |
| 变化率/% | 1990—2000 | 0.28 | -33.19 | 12.89 | 14.36 | 1.61 | 4.39 | -11.69 | 1.11 | -3.90 |
| 2000—2010 | 12.97 | -1.85 | -13.24 | 41.11 | 0.18 | -10.56 | 16.42 | -11.63 | -1.99 | |
| 2010—2018 | 1.10 | 268.90 | -84.86 | -64.09 | -0.75 | 4.14 | -33.28 | 29.93 | 18.56 | |
| 1990—2018 | 14.53 | 141.88 | -85.17 | -42.05 | 1.03 | -2.77 | -31.40 | 16.09 | 11.67 | |
| 生态系统 服务价值 | 年份 | 草地 | 沙地 | ||
|---|---|---|---|---|---|
| 原系数 | 系数修订后 | 原系数 | 系数修订后 | ||
| ESV | 1990 | 16 265.98 | 19 667.88 | 223.72 | 233.27 |
| 2000 | 16 167.62 | 18 321.15 | 219.12 | 1 212.13 | |
| 2010 | 15 631.10 | 17 053.04 | 212.78 | 233.38 | |
| 2018 | 15 562.90 | 22 458.71 | 206.36 | 182.75 | |
| 变化量 | 1990—2000 | -98.36 | -1 346.73 | -4.6 | -21.14 |
| 2000—2010 | -536.52 | -1 268.11 | -6.34 | 21.25 | |
| 2010—2018 | -68.20 | 5 405.67 | -6.42 | -50.63 | |
| 1990—2018 | -703.08 | 2 790.83 | -17.36 | -50.52 | |
Table 4 The ecosystem service value of grasslands and sand dunes before and after the coefficient revision
| 生态系统 服务价值 | 年份 | 草地 | 沙地 | ||
|---|---|---|---|---|---|
| 原系数 | 系数修订后 | 原系数 | 系数修订后 | ||
| ESV | 1990 | 16 265.98 | 19 667.88 | 223.72 | 233.27 |
| 2000 | 16 167.62 | 18 321.15 | 219.12 | 1 212.13 | |
| 2010 | 15 631.10 | 17 053.04 | 212.78 | 233.38 | |
| 2018 | 15 562.90 | 22 458.71 | 206.36 | 182.75 | |
| 变化量 | 1990—2000 | -98.36 | -1 346.73 | -4.6 | -21.14 |
| 2000—2010 | -536.52 | -1 268.11 | -6.34 | 21.25 | |
| 2010—2018 | -68.20 | 5 405.67 | -6.42 | -50.63 | |
| 1990—2018 | -703.08 | 2 790.83 | -17.36 | -50.52 | |
| 年份 | 类型变化 | 土地覆盖渐变 | 净变化 |
|---|---|---|---|
| 1990—2000 | 146.73 | -1 367.87 | -221.14 |
| 2000—2010 | 647.64 | -1 246.86 | -599.22 |
| 2010—2018 | 120.53 | 5 355.04 | 5 475.57 |
| 1990—2018 | 914.90 | 2 740.31 | 3 655.21 |
Table 5 Changes in the ecosystem service value caused by land use/cover type conversion and land cover modification
| 年份 | 类型变化 | 土地覆盖渐变 | 净变化 |
|---|---|---|---|
| 1990—2000 | 146.73 | -1 367.87 | -221.14 |
| 2000—2010 | 647.64 | -1 246.86 | -599.22 |
| 2010—2018 | 120.53 | 5 355.04 | 5 475.57 |
| 1990—2018 | 914.90 | 2 740.31 | 3 655.21 |
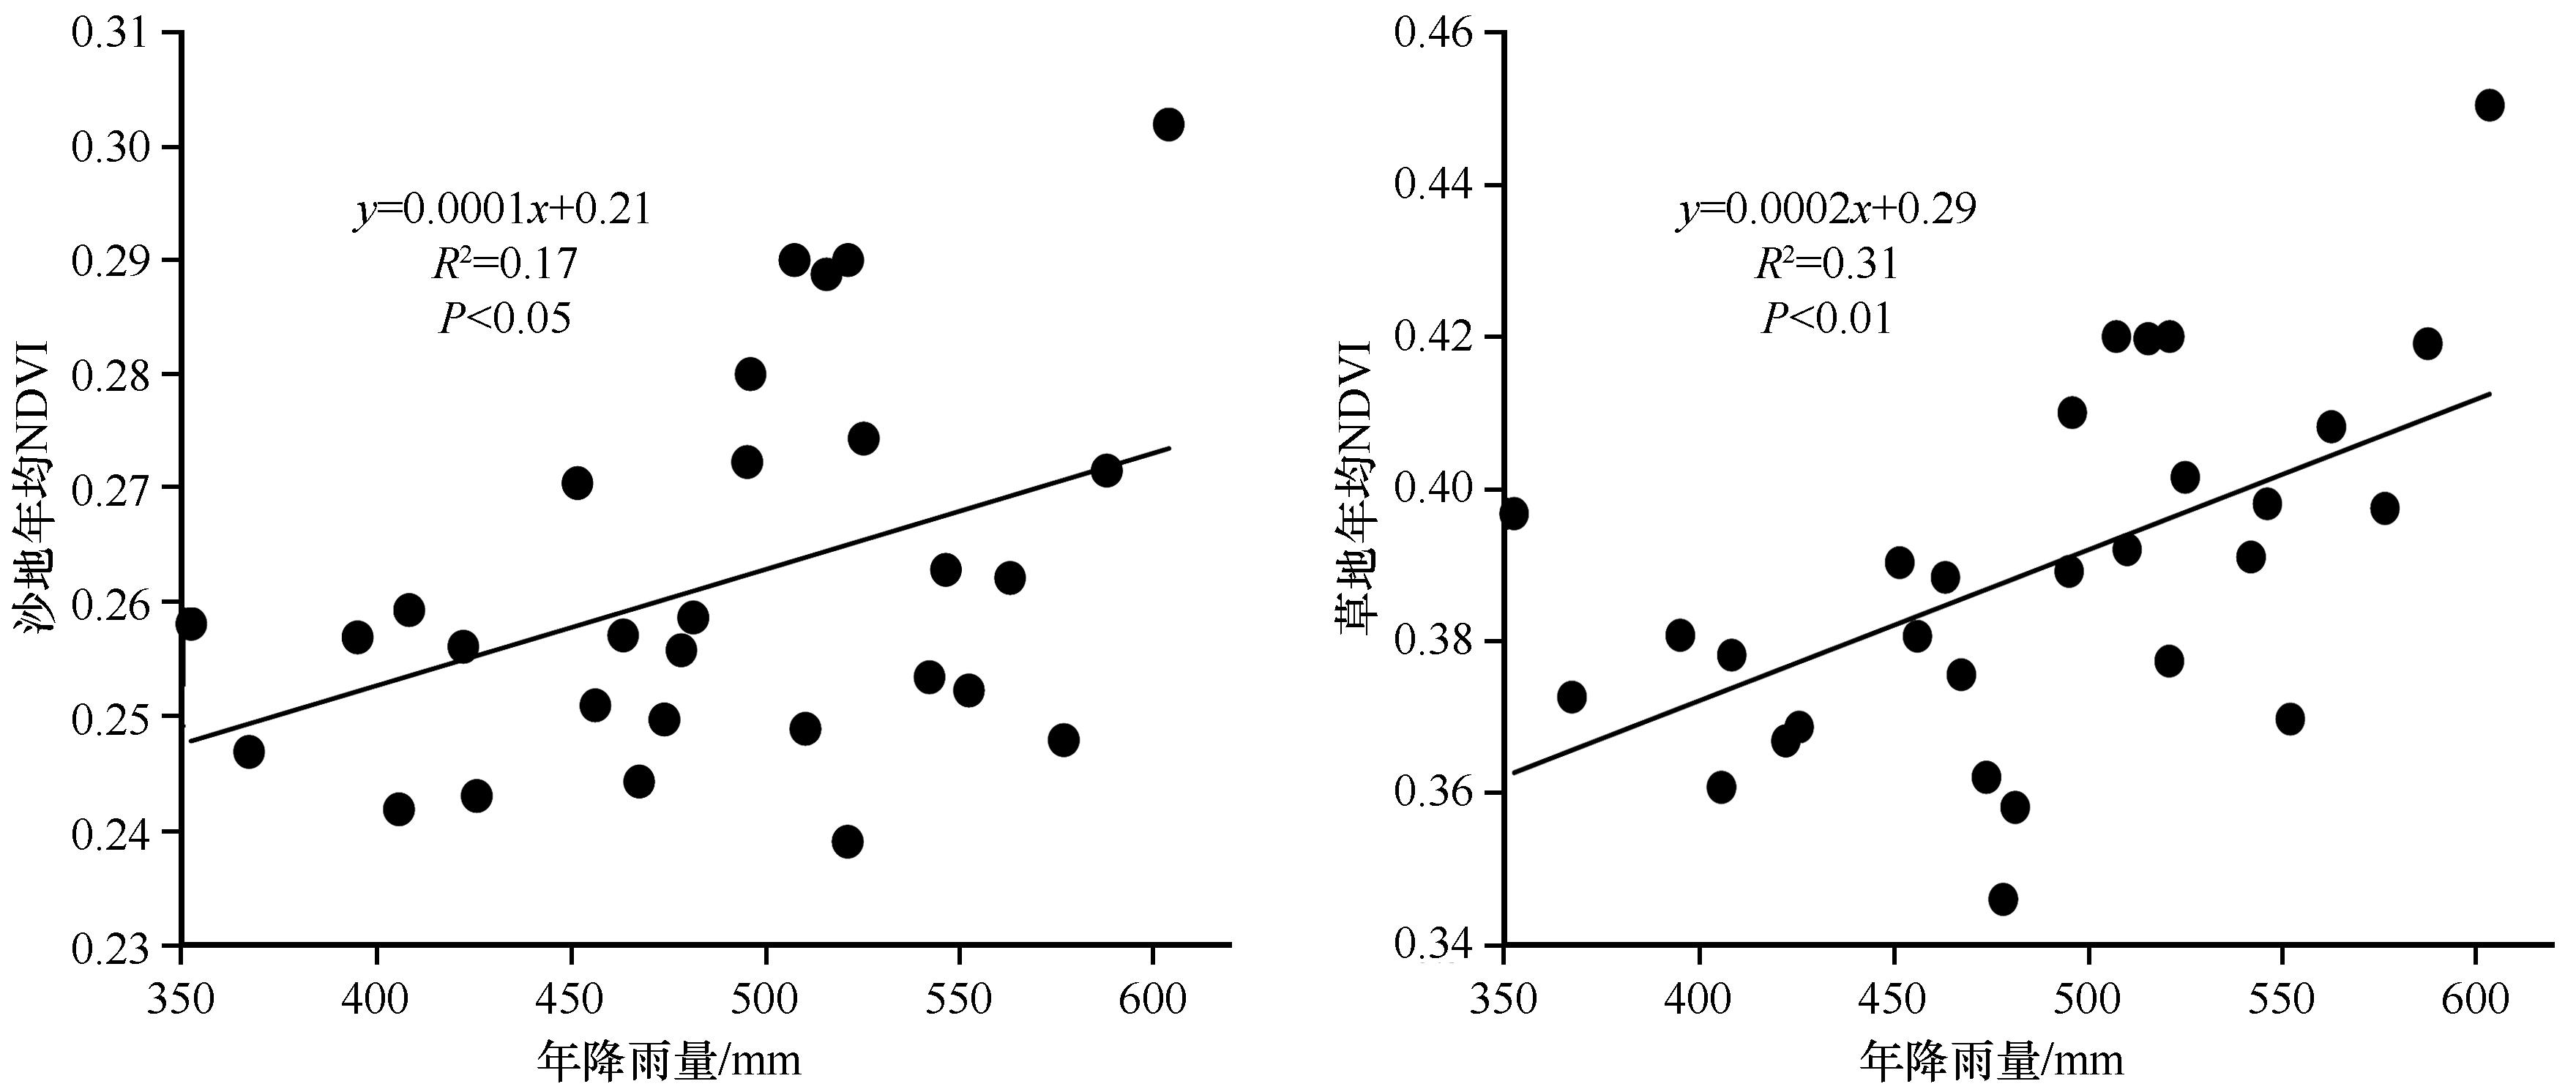
Fig.4 Relationship between sandy land/grassland and the annual precipitation from 1990 to 2018
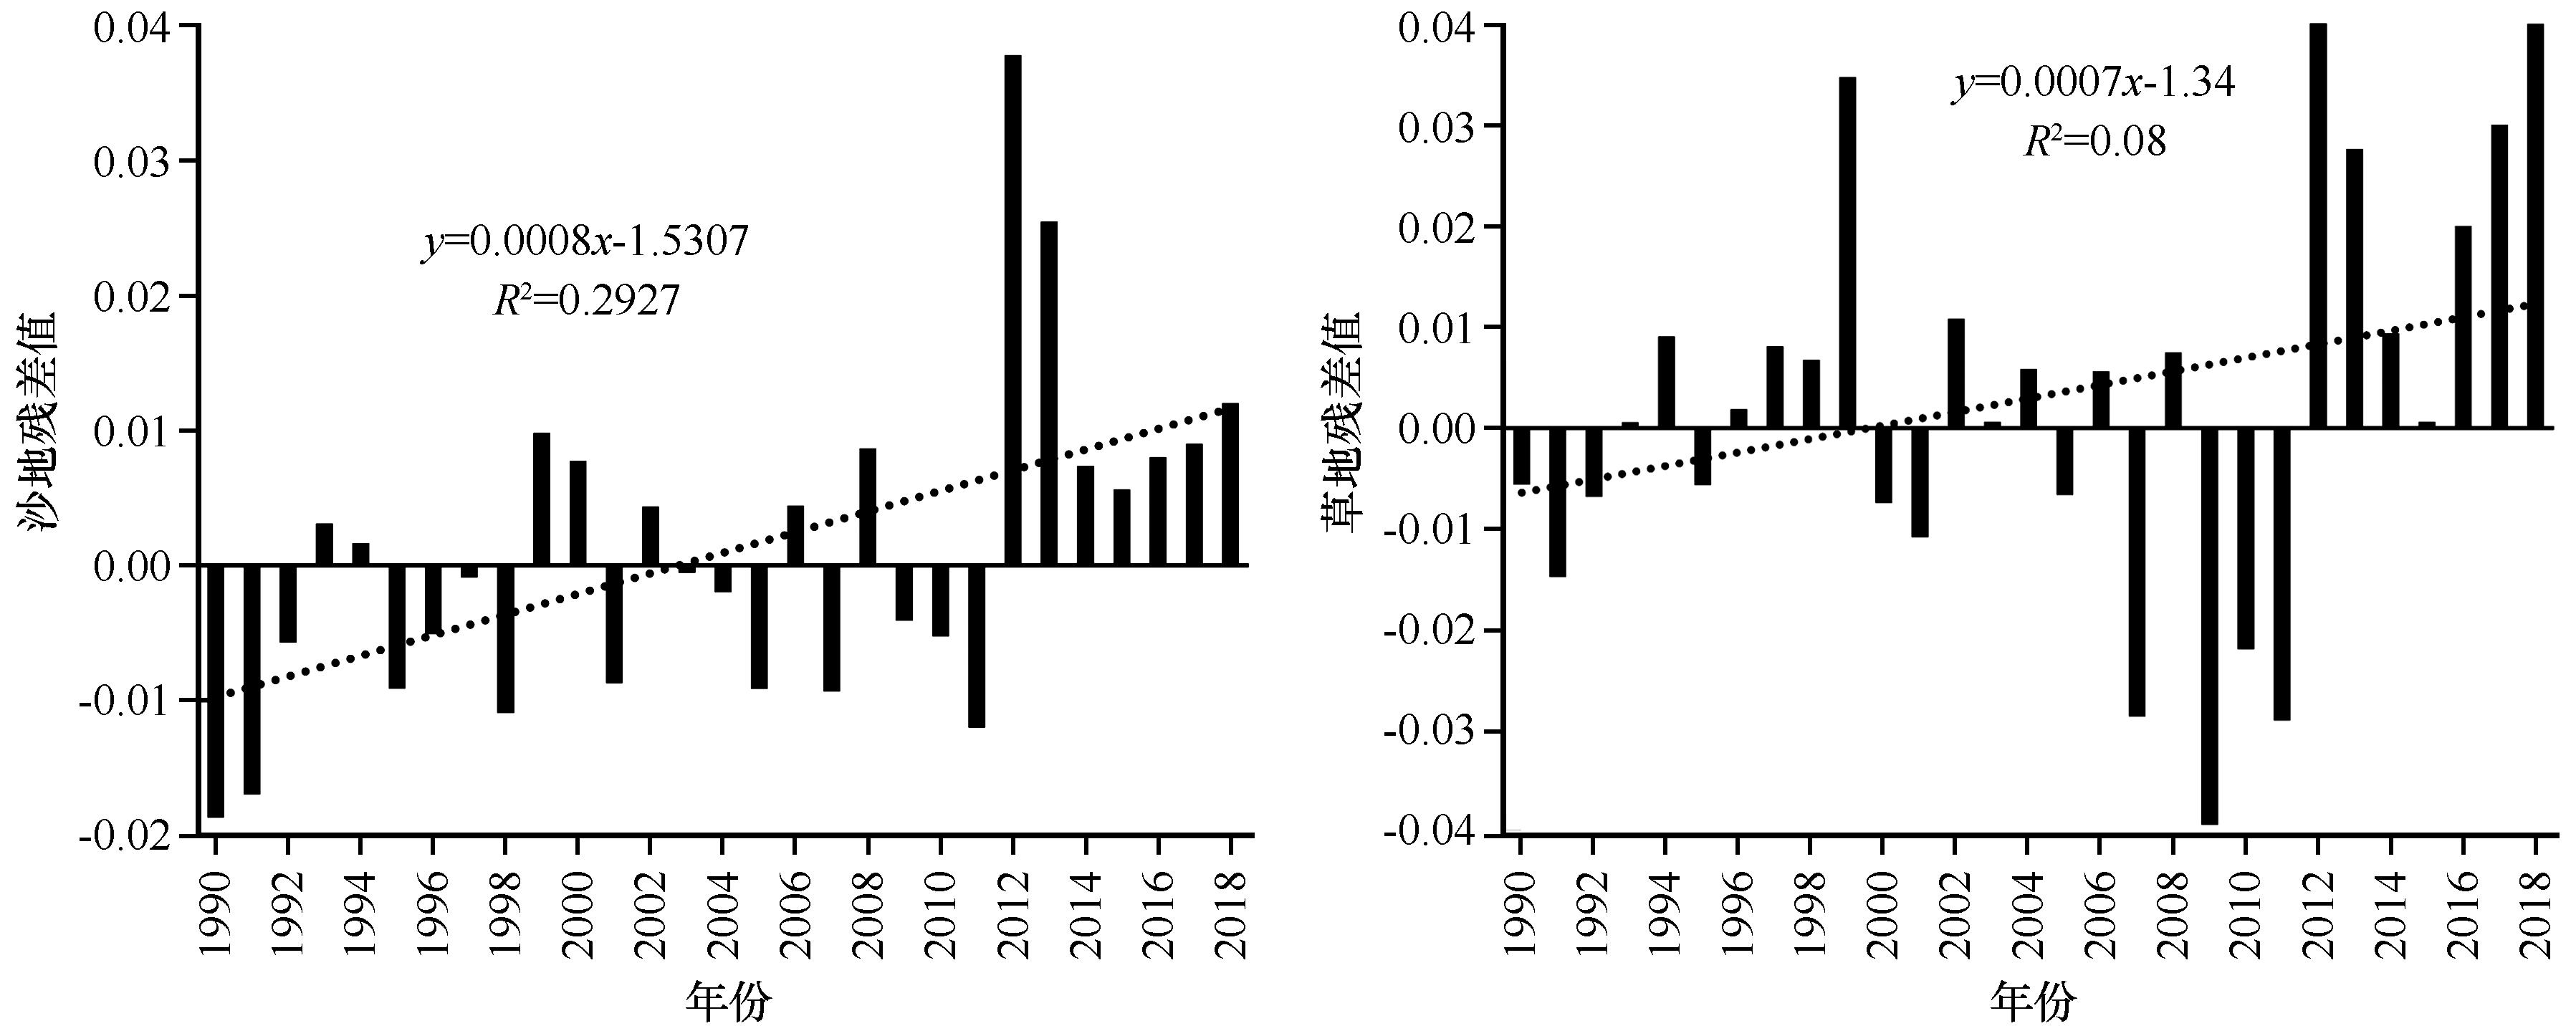
Fig.5 Temporal variation of residual changes in vegetation coverage of sandy land and grassland from 1990 to 2018
| 年份 | 措施 | 区域 | 目标 | 来源 |
|---|---|---|---|---|
| 2000—2005 | 封沙育林、农防林、荒山荒地造林 | 内蒙古克什克腾旗 | 治理沙源 | http://www.nmg.gov.cn/ |
| 2013 | 人工造林、飞播造林、飞播牧草,工程固沙 | 陕西省 | 加强林草植被保护 | http://www.shaanxi.gov.cn/ |
| 2015 | “植树造林绿化”工程 | 山西省 | 构筑京津绿色屏障 | http://lcj.shanxi.gov.cn/ |
| 2018 | “人工造林”项目 | 内蒙古鄂尔多斯市 | 提高贫困农牧民在生态建设中的参与度、受益度 | http://www.ordos.gov.cn/ |
| 2020 | 探索建立“草长制” | 河北省 | 加强草原生态保护,构筑生态安全屏障 | http://lycy.hebei.gov.cn/ |
Table 6 Ecological engineering measures in the Beijing-Tianjin sandstorm source control project area
| 年份 | 措施 | 区域 | 目标 | 来源 |
|---|---|---|---|---|
| 2000—2005 | 封沙育林、农防林、荒山荒地造林 | 内蒙古克什克腾旗 | 治理沙源 | http://www.nmg.gov.cn/ |
| 2013 | 人工造林、飞播造林、飞播牧草,工程固沙 | 陕西省 | 加强林草植被保护 | http://www.shaanxi.gov.cn/ |
| 2015 | “植树造林绿化”工程 | 山西省 | 构筑京津绿色屏障 | http://lcj.shanxi.gov.cn/ |
| 2018 | “人工造林”项目 | 内蒙古鄂尔多斯市 | 提高贫困农牧民在生态建设中的参与度、受益度 | http://www.ordos.gov.cn/ |
| 2020 | 探索建立“草长制” | 河北省 | 加强草原生态保护,构筑生态安全屏障 | http://lycy.hebei.gov.cn/ |
| 1 | 陈杰,赵素平,殷代英,等.沙尘天气过程对中国北方城市空气质量的影响[J].中国沙漠,2015,35(2):423-430. |
| 2 | Zhao Y,Xin Z,Ding G,et al.Spatiotemporal variation in the occurrence of sand-dust events and its influencing factors in the Beijing-Tianjin Sand Source Region,China,1982-2013[J].Regional Environmental Change,2018,18(8):2433-2444. |
| 3 | 魏巍,张稳定,陈焕盛,等.库布齐沙漠治理对京津冀地区空气质量影响:2017年5月3-6日沙尘天气模拟[J].中国沙漠,2020,40(1):77-87. |
| 4 | Bryan B A,Gao L,Ye Y,et al.China's response to a national land-system sustainability emergency[J].Nature,2018,559(12):193-204. |
| 5 | 吴丹,巩国丽,邵全琴,等.京津风沙源治理工程生态效应评估[J].干旱区资源与环境,2016,30(11):117-123. |
| 6 | 黄麟,吴丹,孙朝阳.基于规划目标的京津风沙源治理区生态保护与修复效应[J].生态学报,2020,40(6):1923-1932. |
| 7 | Lambin E,Geist Helmut J.Land-Use and Land-Cover Change:Local Processes and Global Impacts[M].Switzerland:Springer,2006:11-25. |
| 8 | Steffen W,Sanderson A,Tyson P D,et al.Global Change and the Earth System:A Planet under Pressure[M].Berlin,Germany:Springer,2004:32-36. |
| 9 | 盛晓雯,曹银贵,周伟,等.京津冀地区土地利用变化对生态系统服务价值的影响[J].中国农业资源与区划,2018,39(6):79-86. |
| 10 | Costanza R,d’Arge R,de Groot R,et al.The value of the world’s ecosystem services and nature[J].Nature,1997,387(15):253-260. |
| 11 | 欧阳志云,王效科,苗鸿.中国陆地生态系统服务功能及其生态经济价值的初步研究[J].生态学报,1999,19(5):19-25. |
| 12 | 欧阳志云,王如松,赵景柱.生态系统服务功能及其生态经济价值评价[J].应用生态学报,1999,10(5):635-640. |
| 13 | 谢高地,张钇锂,鲁春霞,等.中国自然草地生态系统服务价值[J].自然资源学报,2001,16(1):47-53. |
| 14 | 谢高地,鲁春霞,冷允法,等.青藏高原生态资产的价值评估[J].自然资源学报, 2003,18(2):189-196. |
| 15 | 谢高地,肖玉.农田生态系统服务及其价值的研究进展[J].中国生态农业学报,2013,21(6):645-651. |
| 16 | 谢高地,张彩霞,张雷明,等.基于单位面积价值当量因子的生态系统服务价值化方法改进[J].自然资源学报,2015,30(8):1243-1254. |
| 17 | 郝林华,何帅,陈尚,等.海洋生态系统调节服务价值评估方法及应用:以温州市为例[J].生态学报,2020,40(13):4264-4278. |
| 18 | 严恩萍,林辉,党永峰,等.2000-2012年京津风沙源治理区植被覆盖时空演变特征[J].生态学报,2014,34(17):5007-5020. |
| 19 | 崔晓,赵媛媛,丁国栋,等.京津风沙源治理工程区植被对沙尘天气的时空影响[J].农业工程学报,2018,34(12):171-179. |
| 20 | 迟文峰,匡文慧,贾静,等.京津风沙源治理工程区LUCC及土壤风蚀强度动态遥感监测研究[J].遥感技术与应用,2018,33(5):965-974. |
| 21 | 李愈哲,樊江文,于海玲.京津风沙源治理工程不同恢复措施对草地恢复过程的差异性影响[J].草业学报,2018,27(5):1-14. |
| 22 | Zhao Y,Chi W,Kuang W,et al.Ecological and environmental consequences of ecological projects in the Beijing-Tianjin sand source region[J].Ecological Indicators,2020,11(2):106-111. |
| 23 | Wu Z,Wu J,Liu J,et al.Increasing terrestrial vegetation activity of ecological restoration program in the Beijing-Tianjin Sand Source Region of China[J].Ecological Engineering,2013,5(2):37-50. |
| 24 | Yang X,Xu B,Jin Y,et al.Remote sensing monitoring of grassland vegetation growth in the Beijing-Tianjin sandstorm source project area from 2000 to 2010[J].Ecological Indicators,2014,44(4):244-252. |
| 25 | 李屹峰,罗跃初,刘纲,等.土地利用变化对生态系统服务功能的影响:以密云水库流域为例[J].生态学报,2013,33(3):726-736. |
| 26 | 江凌,肖燚,饶恩明,等.内蒙古土地利用变化对生态系统防风固沙功能的影响[J].生态学报,2016,36(12):3734-3747. |
| 27 | 吴波,李晓松,刘文,等.京津风沙源工程区沙漠化防治区划与治理对策研究[J].林业科学,2006,52(10):65-70. |
| 28 | Liu J,Kuang W,Zhang Z,et al.Spatiotemporal characteristics,patterns,and causes of land-use changes in China since the late 1980s[J].Journal of Geography Sinica,2014,24(2):195-210. |
| 29 | Liu J,Ning J,Kuang W,et al.Spatiotemporal patterns and characteristics of land-use change in China during 2010-2015[J].Acta Geography Sinica,2018,73(5):789-802. |
| 30 | Tucker C J,Pinzon J E,Brown M E,et al.An extended AVHRR 8-km NDVI dataset compatible with MODIS and SPOT vegetation NDVI data[J].International Journal of Remote Sensing,2005,26(20):4485-4498. |
| 31 | Holben B N.Characteristics of maximum value composite images from temporal AVHRR data[J].International Journal of Remote Sensing,1986,7(11):1417-1434. |
| 32 | Gutman G,Ignatov A.The derivation of the green vegetation fraction from NOAA/AVHRR data for use in numerical weather prediction models[J].International Journal of Remote Sensing,1998,19(8):1533-1543. |
| 33 | 何立恒,周寅康,杨强.延安市2000—2013年植被覆盖时空变化及特征分析[J].干旱区资源与环境,2015,29(11):174-179. |
| 34 | 史培军,陈晋,潘耀忠.深圳市土地利用变化机制分析[J].地理学报,2000,67(2):151-160. |
| 35 | Zhao Y,He C,Zhang Q.Monitoring vegetation dynamics by coupling linear trend analysis with change vector analysis:a case study in the Xilingol steppe in northern China[J].International Journal of Remote Sensing,2012,33(1):287-308. |
| 36 | Millennium Ecosystem Assessment.Ecosystems and Human Well-being:Synthesis[M].Washington DC,USA:Island Press,2005:5-10. |
| 37 | 王希义,彭淑贞,徐海量,等.基于生物量的塔里木河下游胡杨(Populus euphratica)生态服务价值评估[J].生态学报,2019,39(4):1441-1451. |
| 38 | 赖炽敏,赖日文,薛娴,等.基于植被盖度和高度的不同退化程度高寒草地地上生物量估算[J].中国沙漠,2019,39(5):127-134. |
| 39 | 刘纪远,邵全琴,樊江文.三江源区草地生态系统综合评估指标体系[J].地理研究,2009,28(2):273-283. |
| 40 | 董治宝,陈渭南,李振山,等.植被对土壤风蚀影响作用的实验研究[J].土壤侵蚀与水土保持学报,1996,10(2):1-8. |
| 41 | 谢高地,甄霖,鲁春霞,等.一个基于专家知识的生态系统服务价值化方法[J].自然资源学报,2008,23(5):911-919. |
| 42 | 傅伯杰,张立伟.土地利用变化与生态系统服务:概念、方法与进展[J].地理科学进展,2014,33(4):441-446. |
| 43 | 邹欣怡,赵伟,蒲海霞.三峡库区重庆段土地利用转型及生态服务功能价值时空分异特征[J].水土保持研究,2021,28(2):267-275. |
| 44 | 孙斌,高志海,王红岩,等.近30年京津风沙源区气候干湿变化分析[J].干旱区资源与环境,2014,28(11):164-170. |
| 45 | 汪滨,张志强.黄土高原典型流域退耕还林土地利用变化及其合理性评价[J].农业工程学报,2017,33(7):235-245. |
| 46 | 黄露,周伟,李浩然,等.土地利用/覆被变化对鄂尔多斯市草地生态系统净初级生产力的影响[J].水土保持通报,2018,38(4):46-52. |
| [1] | Xiaomei Zhang, Heling Jin, Bing Liu. Environment changes in the Hobq Desert since the Last Glacial Maximum [J]. Journal of Desert Research, 2021, 41(5): 81-93. |
| [2] | Xiaohui Ma, Jiangli Pang, Xiaokang Liu, Dan Ding, Xiaoxiao Yue, Feifei Jia. Early and Middle Holocene climate change inferred by Wayaogou Section in the Southeastern Mu Us Desert [J]. Journal of Desert Research, 2021, 41(5): 71-80. |
| [3] | Mengtao Han, Jianjun Tu, Guiping Xu, Li Jiang. Spatio-temporal coordination between aquatic ecosystem services and economic development in the Yellow River Basin [J]. Journal of Desert Research, 2021, 41(4): 167-176. |
| [4] | Yongtao Ma, Xiaozong Ren, Huifang Hu, Min Liu, Qi Meng. Vegetation dynamics and its driving force in Otindag Sandy Land based on Geodetector [J]. Journal of Desert Research, 2021, 41(4): 195-204. |
| [5] | Lanying Han, Qiang Zhang, Pengli Ma, Youheng Wang, Tao Huang, Jianying Jia, Xin Wang, Xiaowei Wang, Weiping Liu, Danhua Li, Guoyang Lu, Pengcheng Huang, Bing Bai. Characteristics of drought disasters risk in the Yellow River Basin under the climate warming [J]. Journal of Desert Research, 2021, 41(4): 225-234. |
| [6] | Youheng Wang, Dan Tan, Lanying Han, Danhua Li, xin Wang, Guoyang Lu, Jingjing Lin. Review of climate change in the Yellow River Basin [J]. Journal of Desert Research, 2021, 41(4): 235-246. |
| [7] | Xiaohui He, Jianhua Si, Chunyan Zhao, Chunlin Wang, Dongmeng Zhou. Potential distribution of Hippophae thibetana and its predicted responses to climate change [J]. Journal of Desert Research, 2021, 41(3): 101-109. |
| [8] | Yiran Zhang, Tingxi Liu, Xin Tong, Limin Duan, Xin Wang. Extraction and influencing factors of vegetation coverage using unmanned aerial vehicle images in dune-meadow transitional area [J]. Journal of Desert Research, 2021, 41(3): 16-24. |
| [9] | Wenbing Yang, Tao Wang, Wei Xiong, Hui Zou, Wei Feng, Yiben Cheng, Honglin Lian. Overview of hydrological principle of low vegetation coverage sand control [J]. Journal of Desert Research, 2021, 41(3): 75-80. |
| [10] | Li Li, Qingqing Zhang, Yamei Wang, Hong Li, Xinfeng Zhao. Comprehensive assessment of ecosystem vulnerability, the value of service function and risk in Kezi River Basin in 2000-2018 [J]. Journal of Desert Research, 2021, 41(2): 164-172. |
| [11] | Xuyang Wang, Yulin Li, Jie Lian, Yulong Duan, Lilong Wang. Relationship between vegetation coverage and climate change in semi-arid sandy land and the significance to ecological construction [J]. Journal of Desert Research, 2021, 41(1): 183-194. |
| [12] | Yuanzheng He, Wenda Huang, Xin Zhao, Peng Lv, Huaihai Wang. Review on the impact of climate change on plant diversity [J]. Journal of Desert Research, 2021, 41(1): 59-66. |
| [13] | Yongxiang Cao, Donglei Mao, Fuyan Cai, Xuemei Wang, Abulaiti Kaimaierguli, Songling Su. Spatial difference of microclimate over typical underlying surface in process of oasisization in Cele, Xinjiang [J]. Journal of Desert Research, 2020, 40(6): 180-189. |
| [14] | Di Deng, Zebin Zhao, Yuan Ma. Modeling of species distribution with GIS in arid regions: take Caragana korshinskii for example [J]. Journal of Desert Research, 2020, 40(5): 74-80. |
| [15] | Han Chao, Xiao Shengchun, Ding Aijun, Teng Zeyu. Radial growth climatic response characteristics and tree ring climate records of conifer species at south margin of Tengger Desert, China [J]. Journal of Desert Research, 2020, 40(2): 50-58. |
| Viewed | ||||||
|
Full text |
|
|||||
|
Abstract |
|
|||||
©2018Journal of Desert Research
Tel:0931-8267545
Email:caiedit@lzb.ac.cn;desert@lzb.ac.cn
Support:Magtech