
- CN 62-1070/P
- ISSN 1000-694X
- Bimonthly 1981
Journal of Desert Research ›› 2025, Vol. 45 ›› Issue (2): 47-60.DOI: 10.7522/j.issn.1000-694X.2024.00146
Previous Articles Next Articles
Xingyu Cheng1( ), Zhiwei Xu1(), Yan Yu2, Xiaoxiao Zhang3
Received:2024-08-22
Revised:2024-10-30
Online:2025-03-20
Published:2025-03-26
Contact:
Zhiwei Xu
CLC Number:
Xingyu Cheng, Zhiwei Xu, Yan Yu, Xiaoxiao Zhang. Changes in frequency and possible causes of dust occurrence in northern China and Mongolia since 2001 revealed by remote sensing[J]. Journal of Desert Research, 2025, 45(2): 47-60.
Add to citation manager EndNote|Ris|BibTeX
URL: http://www.desert.ac.cn/EN/10.7522/j.issn.1000-694X.2024.00146
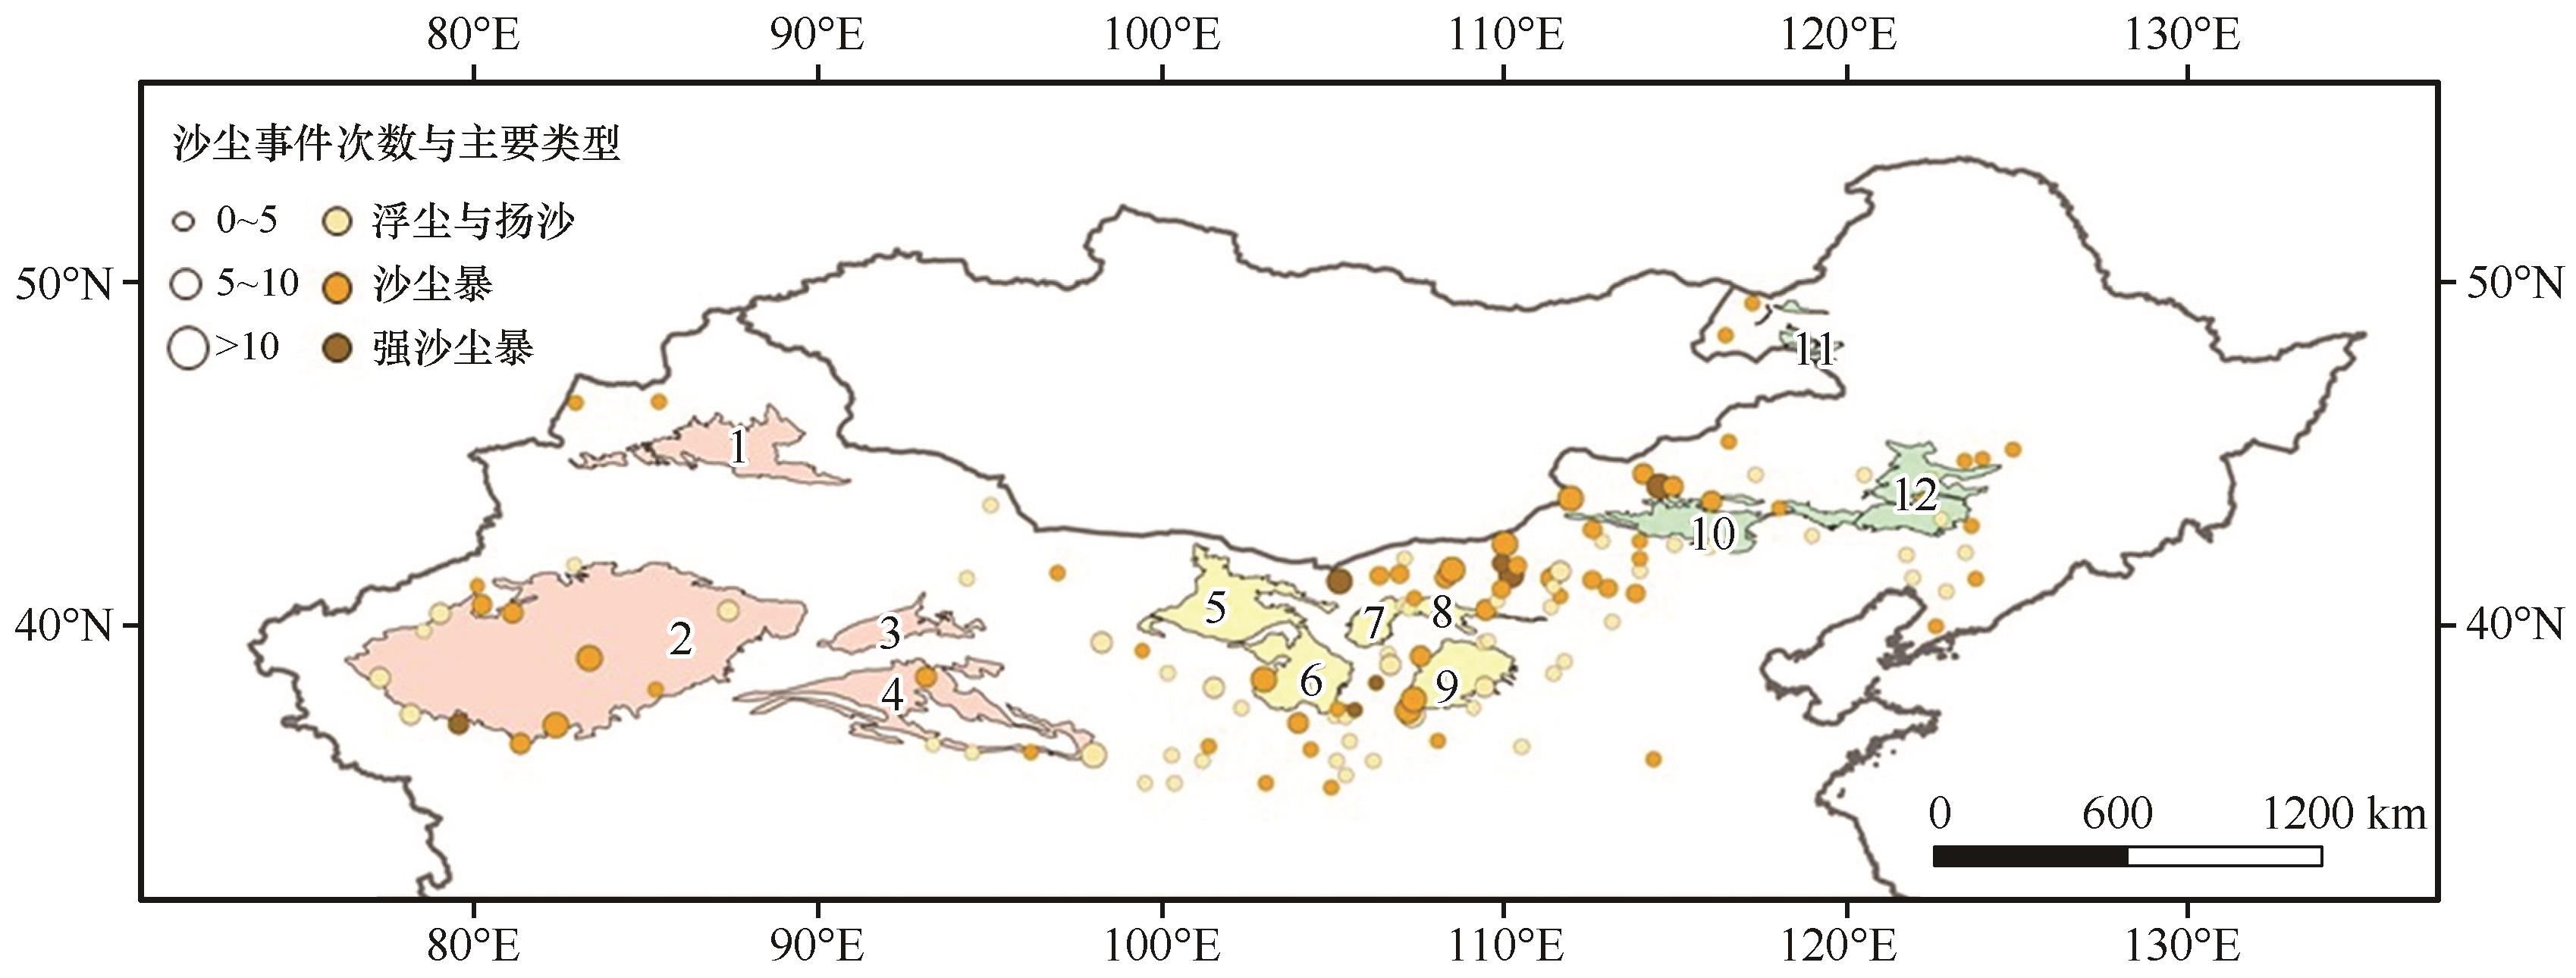
Fig.1 The number of sand and dust storms and their main types observed by meteorological stations in North China from 2001 to 2007
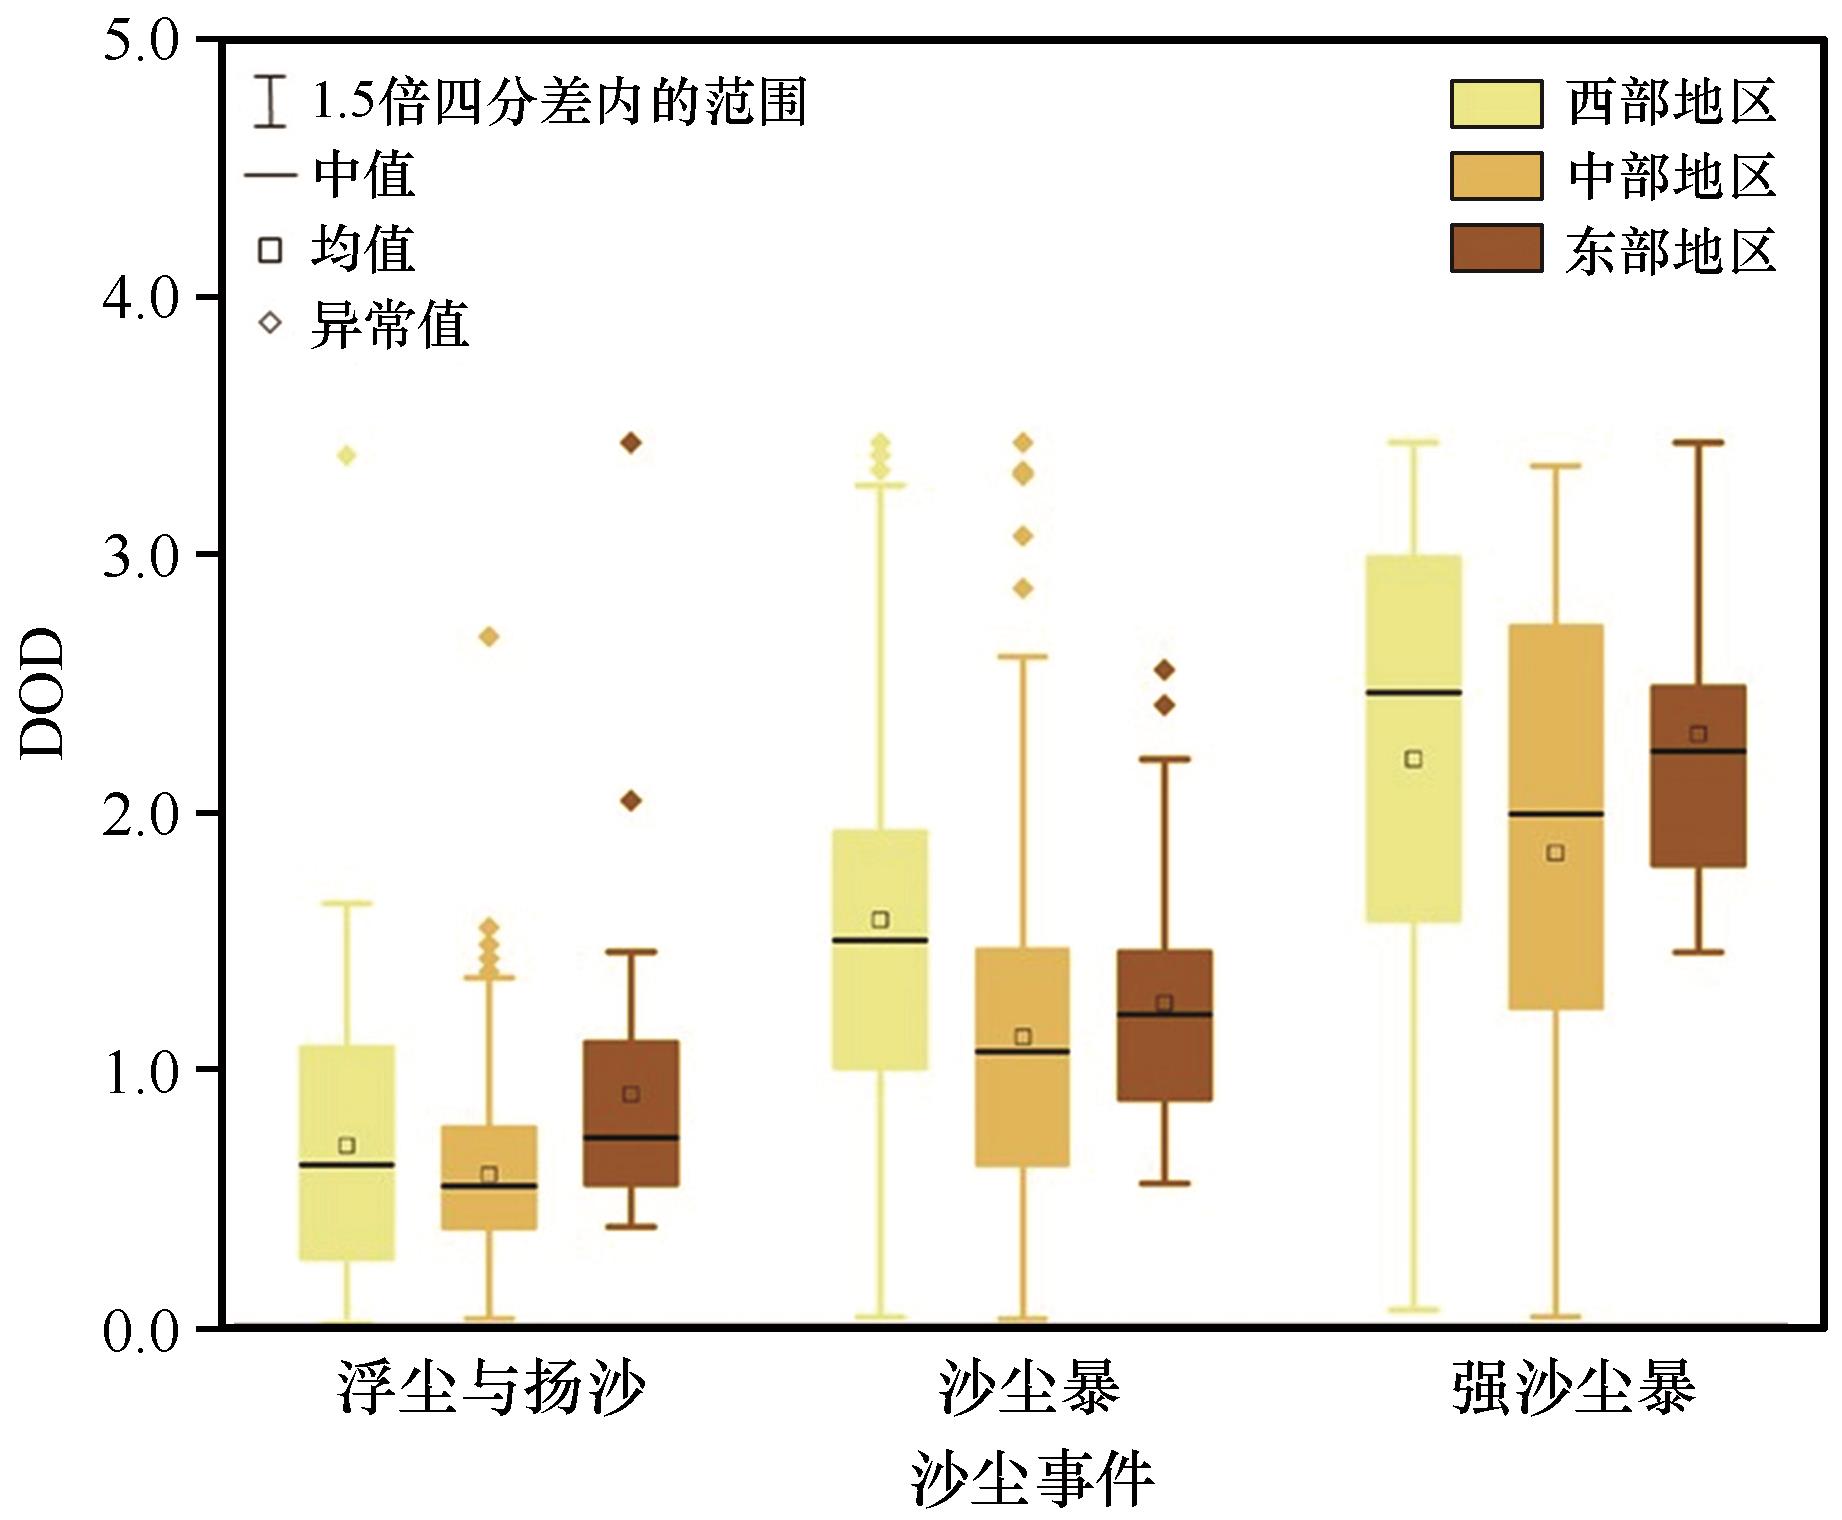
Fig.2 Statistical distribution of daily DOD values for different sand and dust storms in western, central, and eastern parts of North China
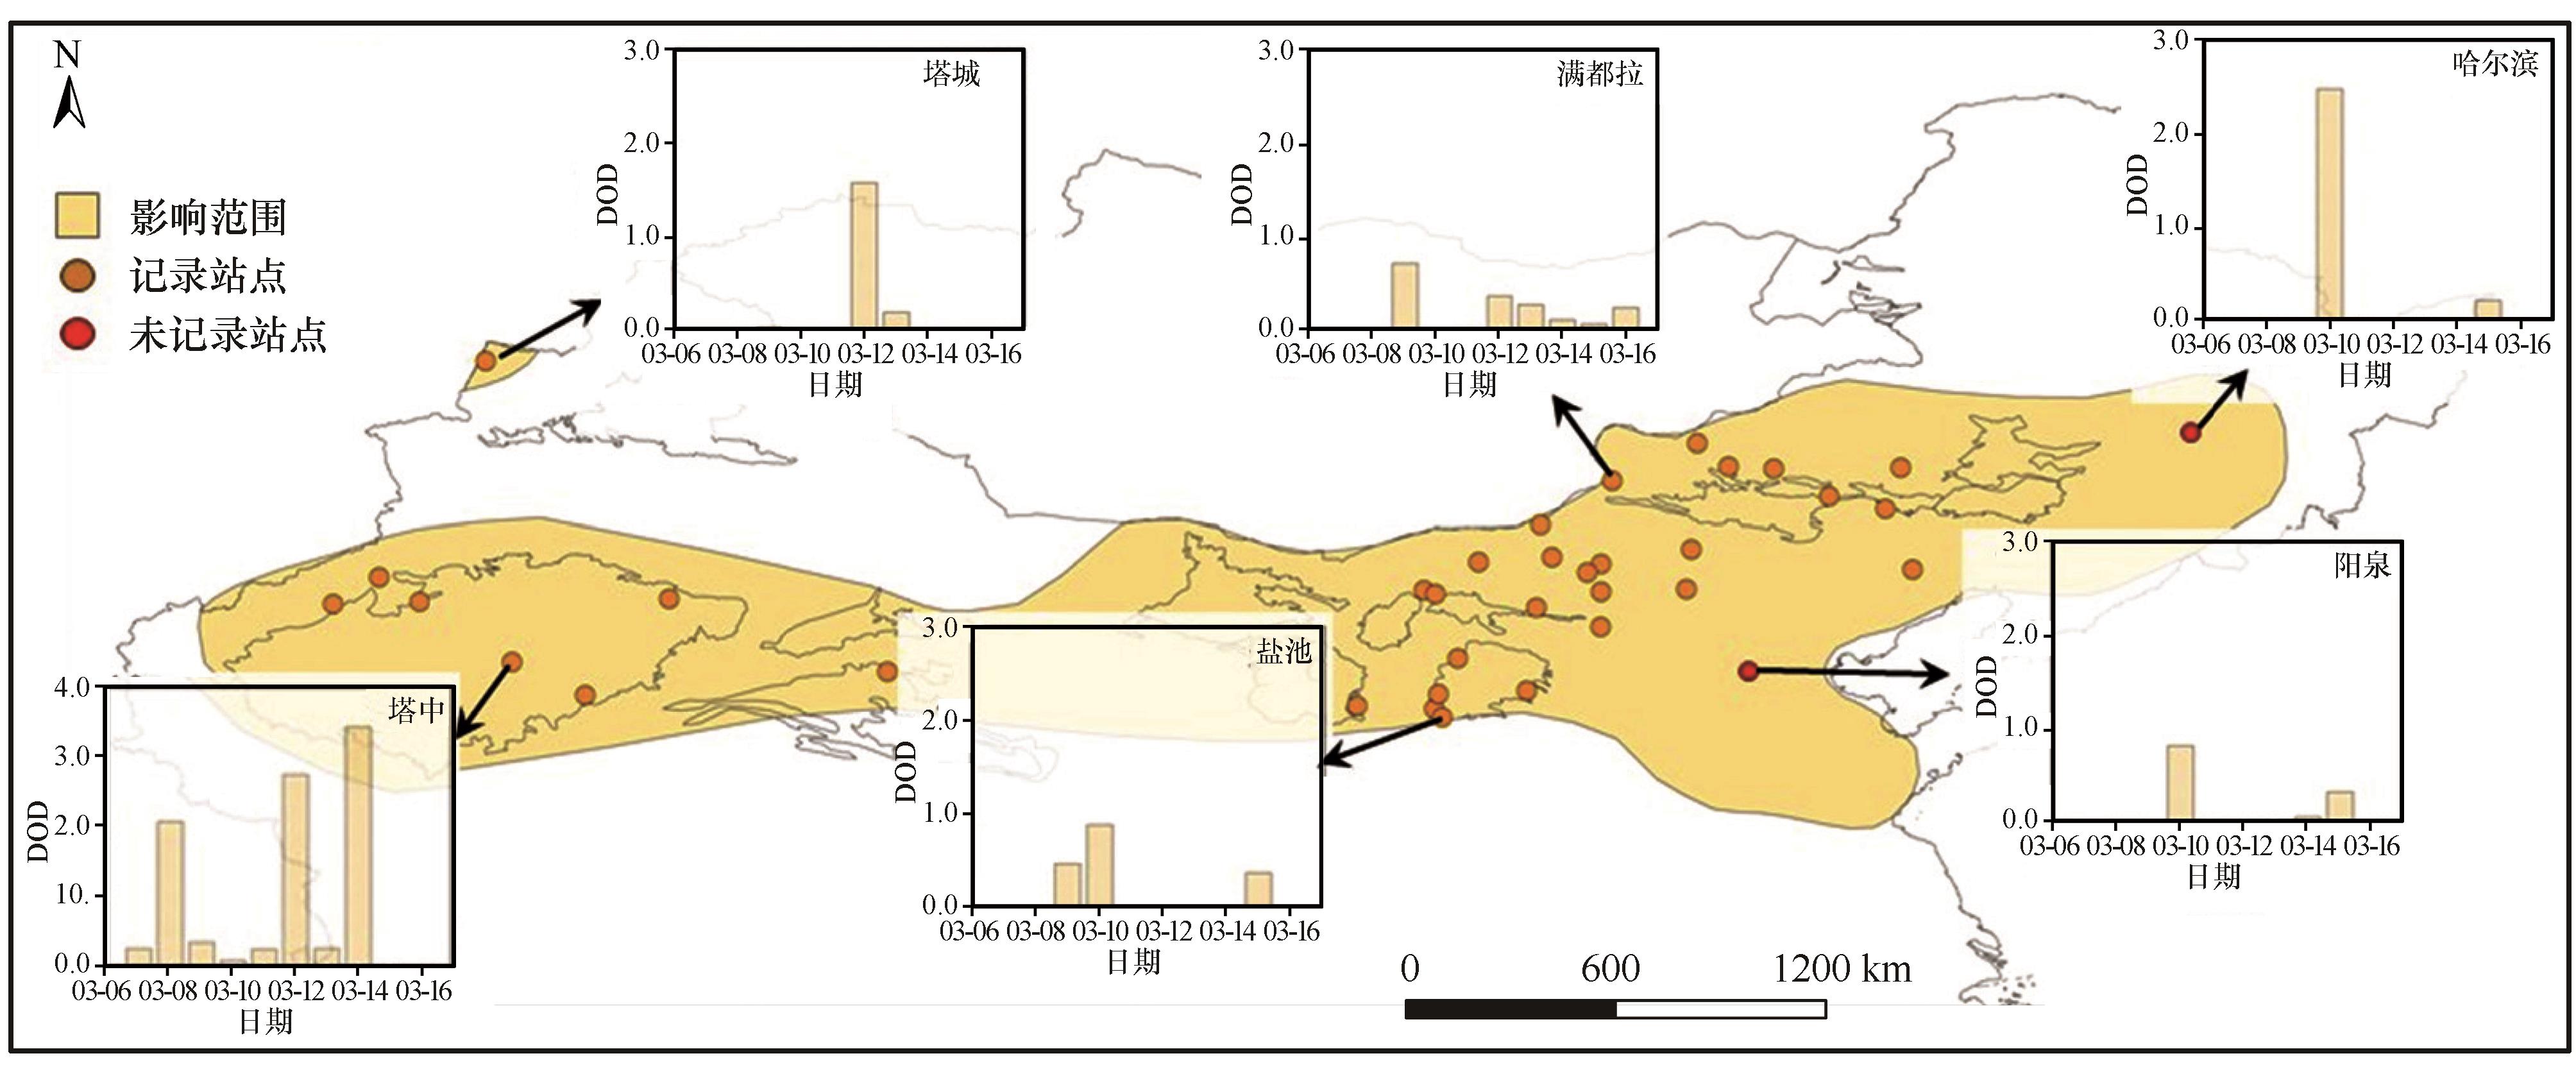
Fig.3 The influence area of a sand and dust storm in North China from March 9 to 12, 2006, and the variations in DOD at typical stations
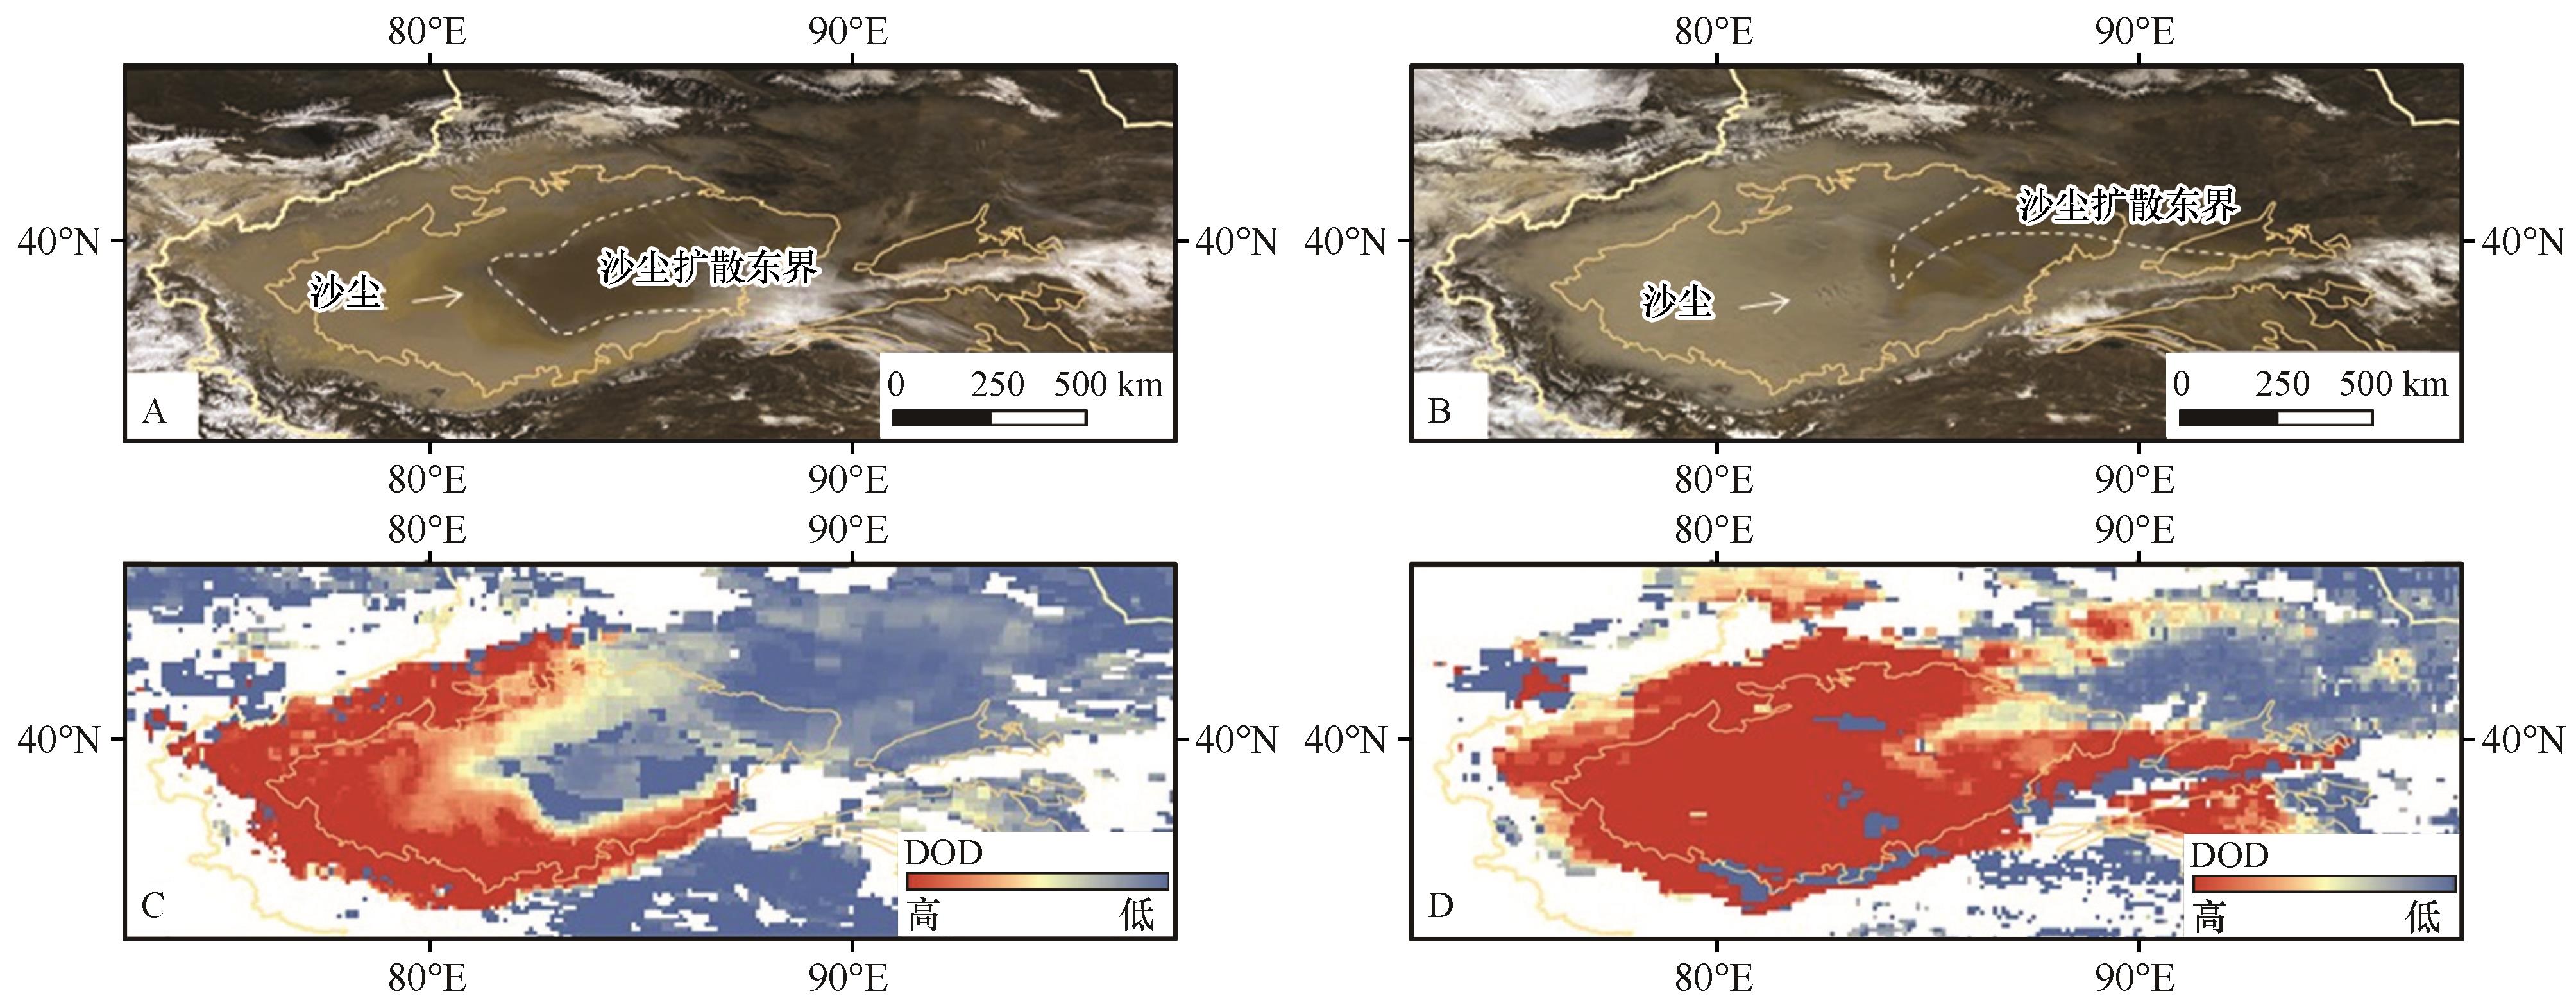
Fig.4 Dust activity and its diffusion in Tarim Basin revealed by MODIS images (A, B) and DOD distribution (C, D) on March 13 (A, C) and March 14 (B, D) in the year 2006
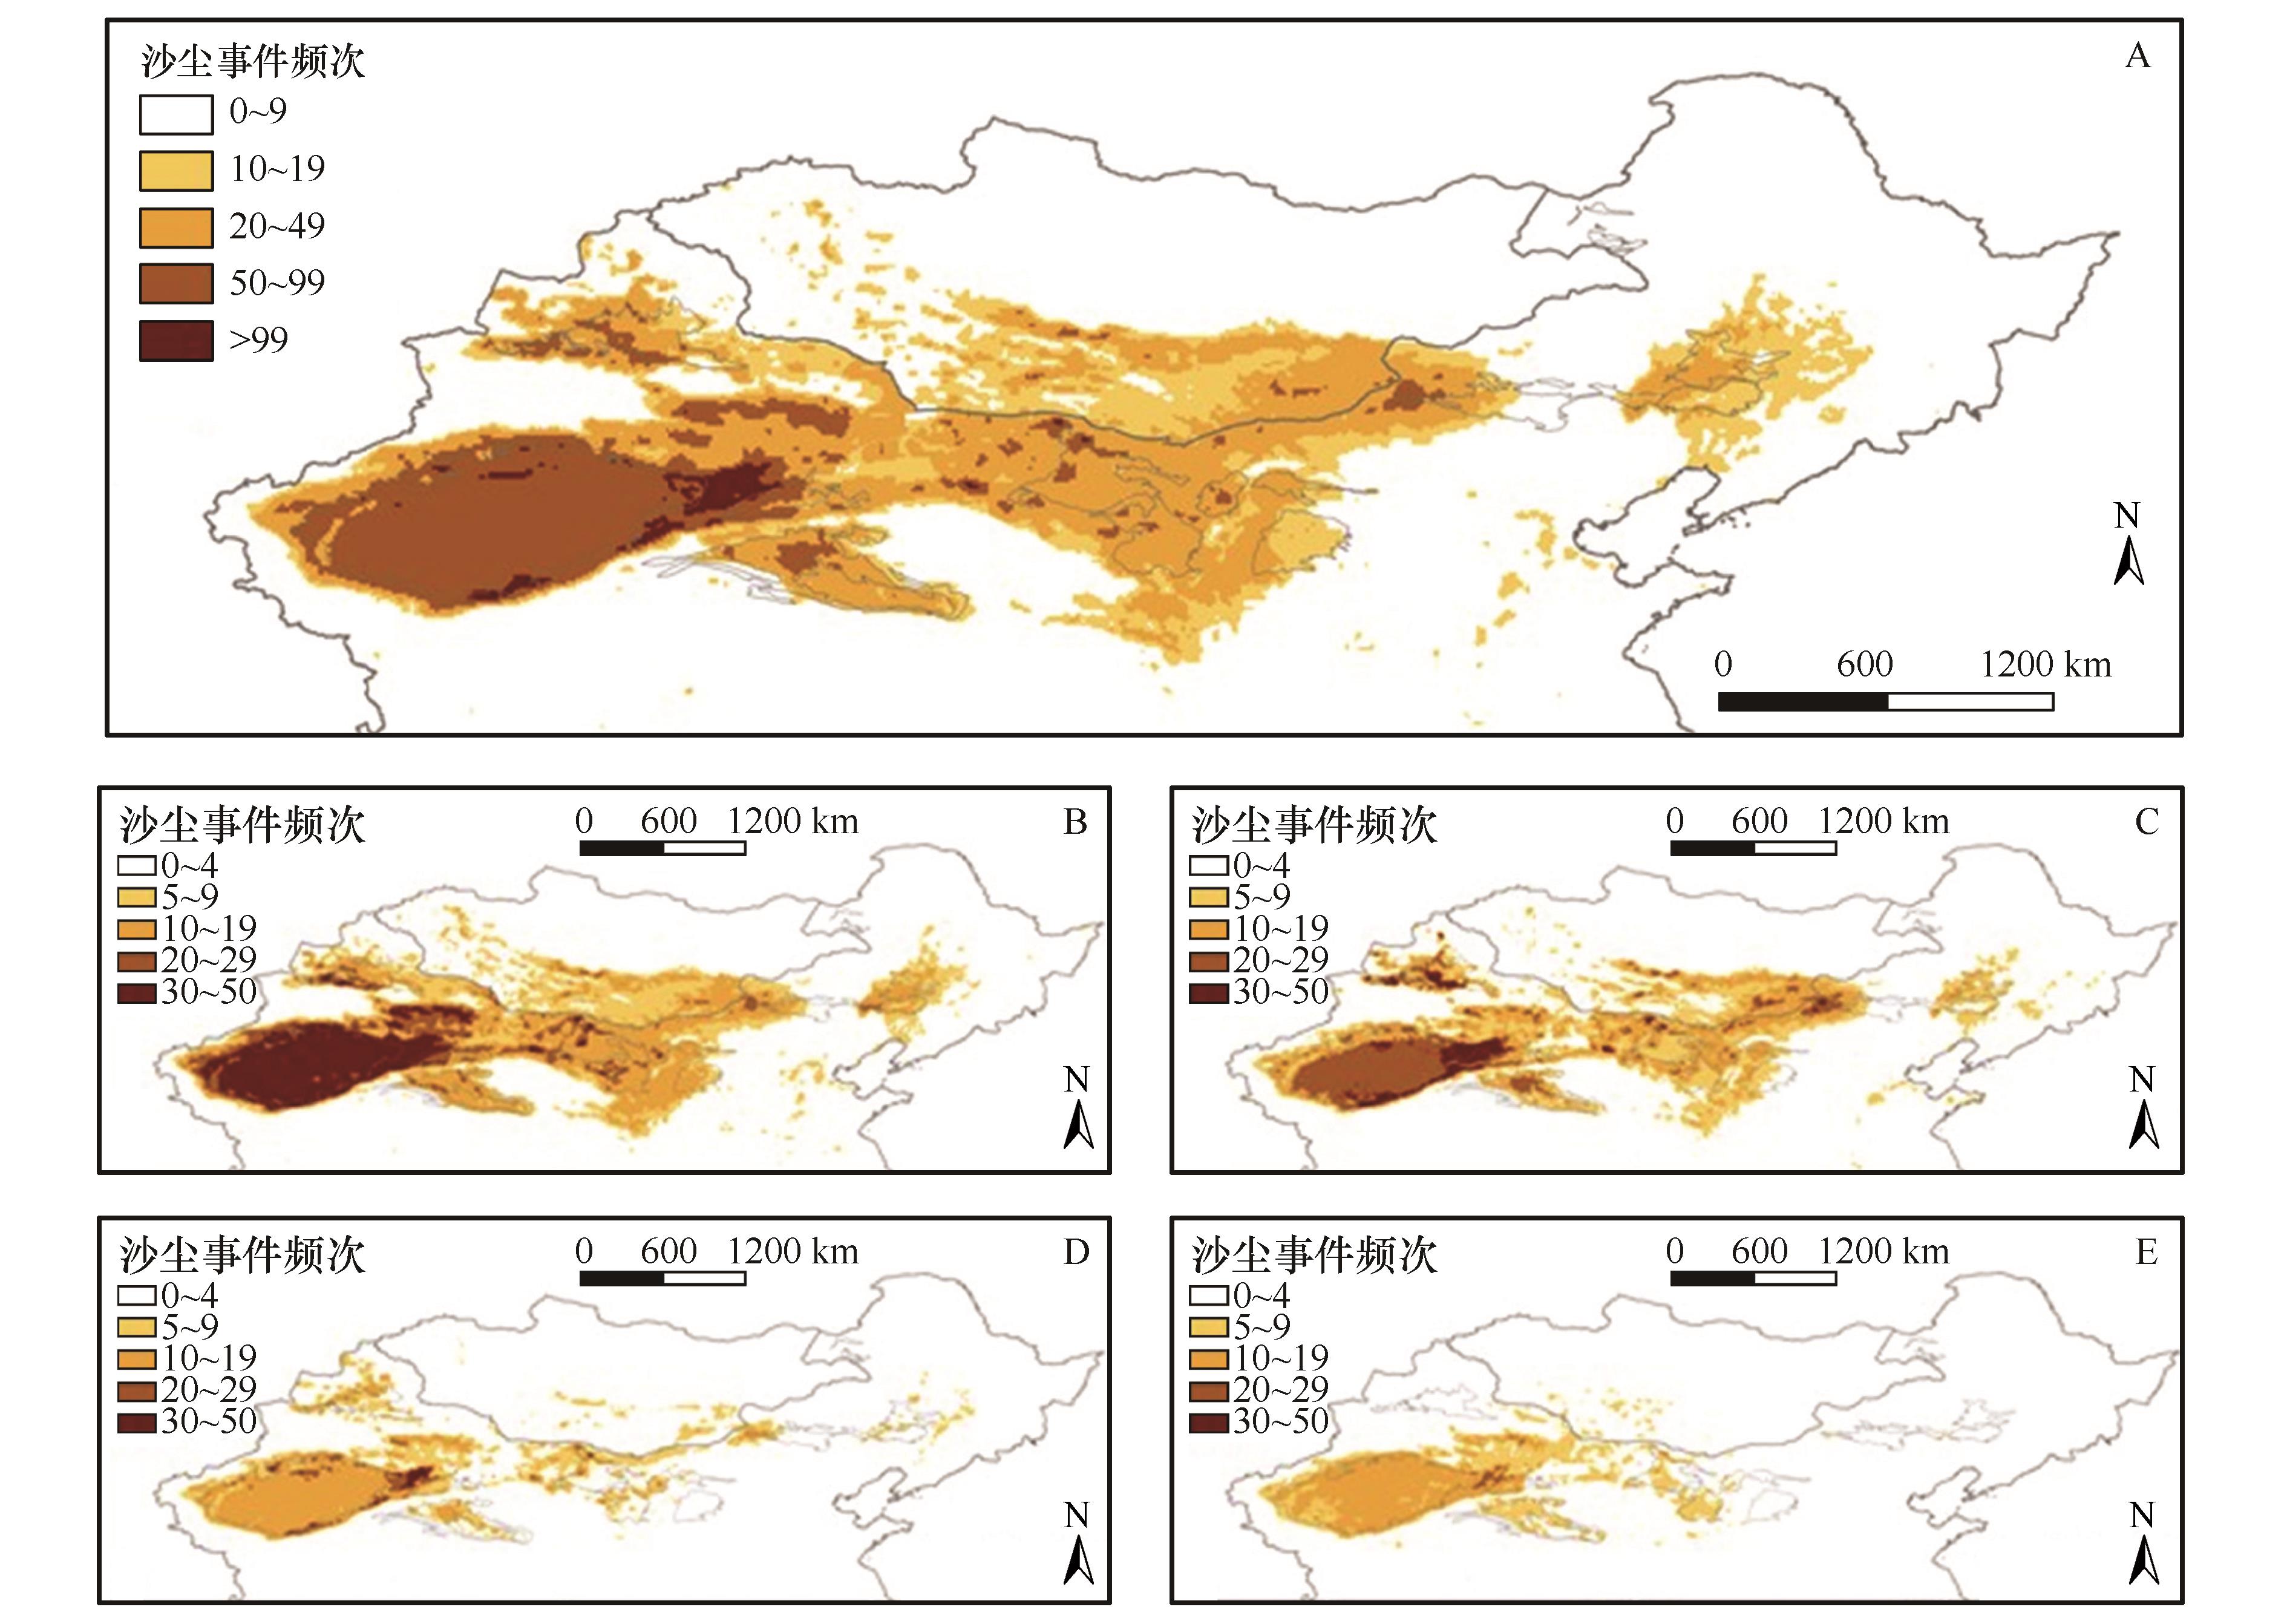
Fig.5 Spatial distribution of annual mean FoO (A) and seasonal mean FoO in spring (B), summer (C), autumn (D), and winter (E) in North China and Mongolia from 2001 to 2022
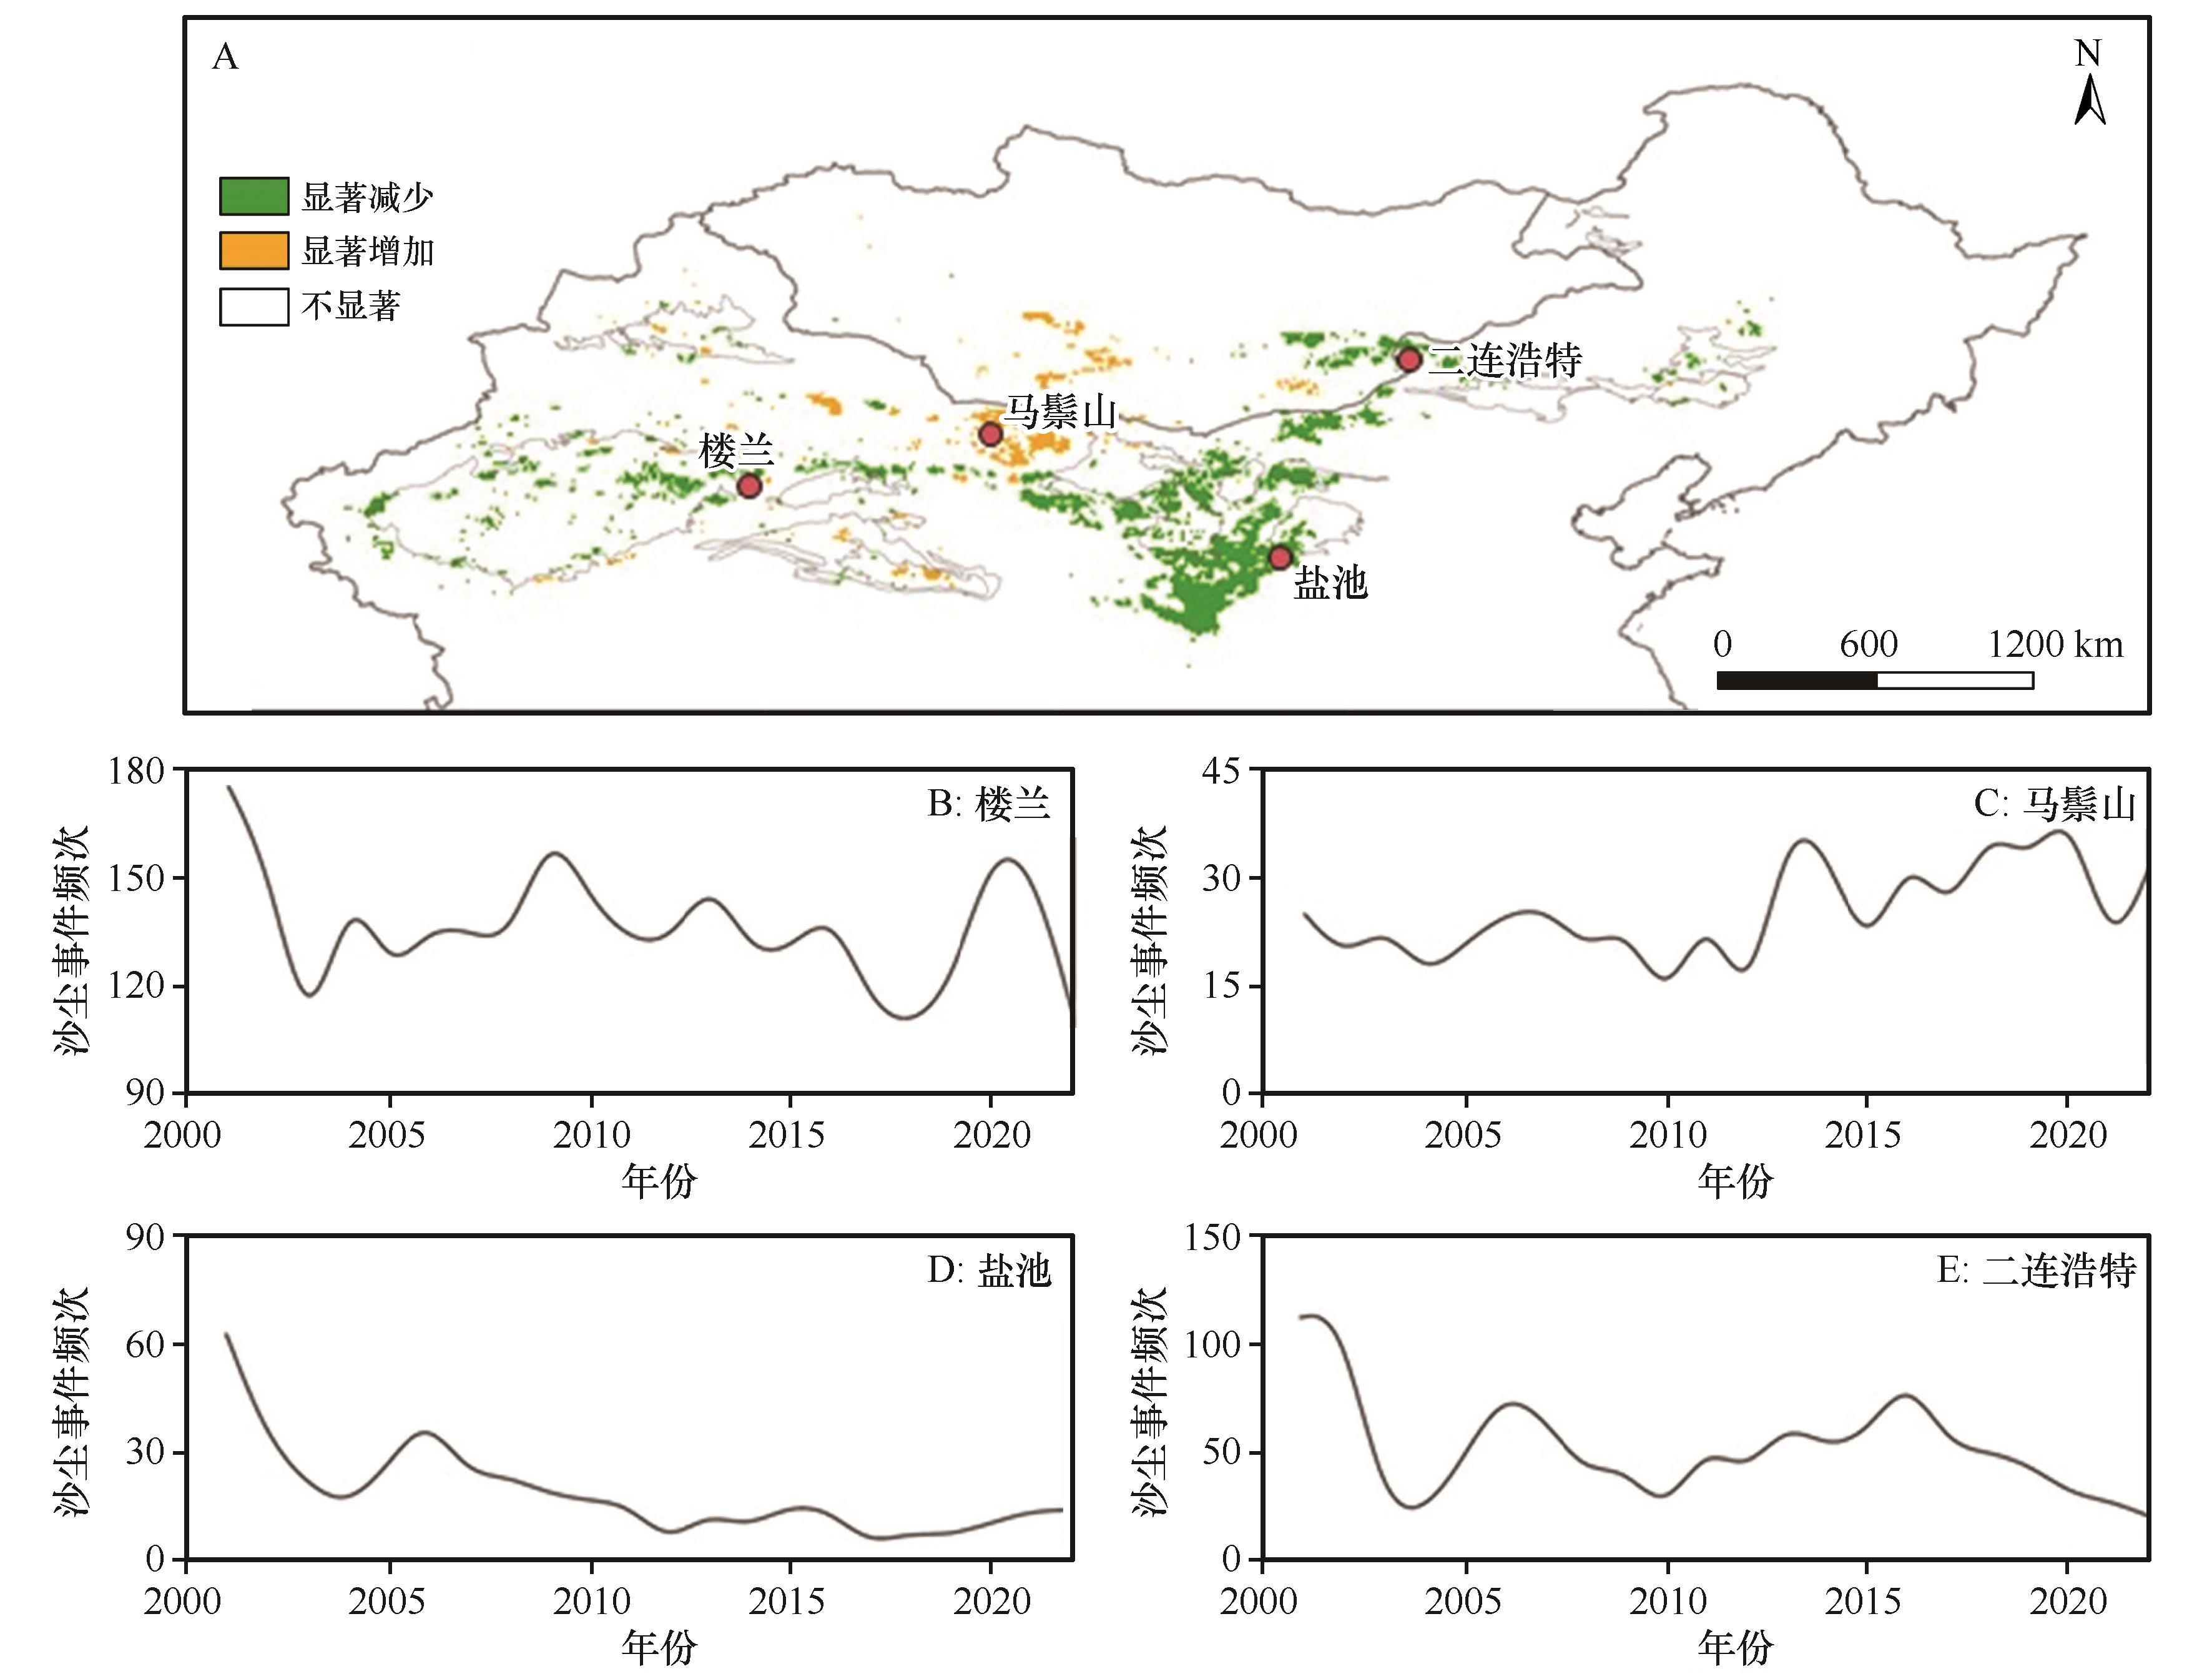
Fig.6 Trend of annual FoO in the dust-active regions of North China and Mongolia (A) and variations in FoO at typical stations (B-E) from 2001 to 2022
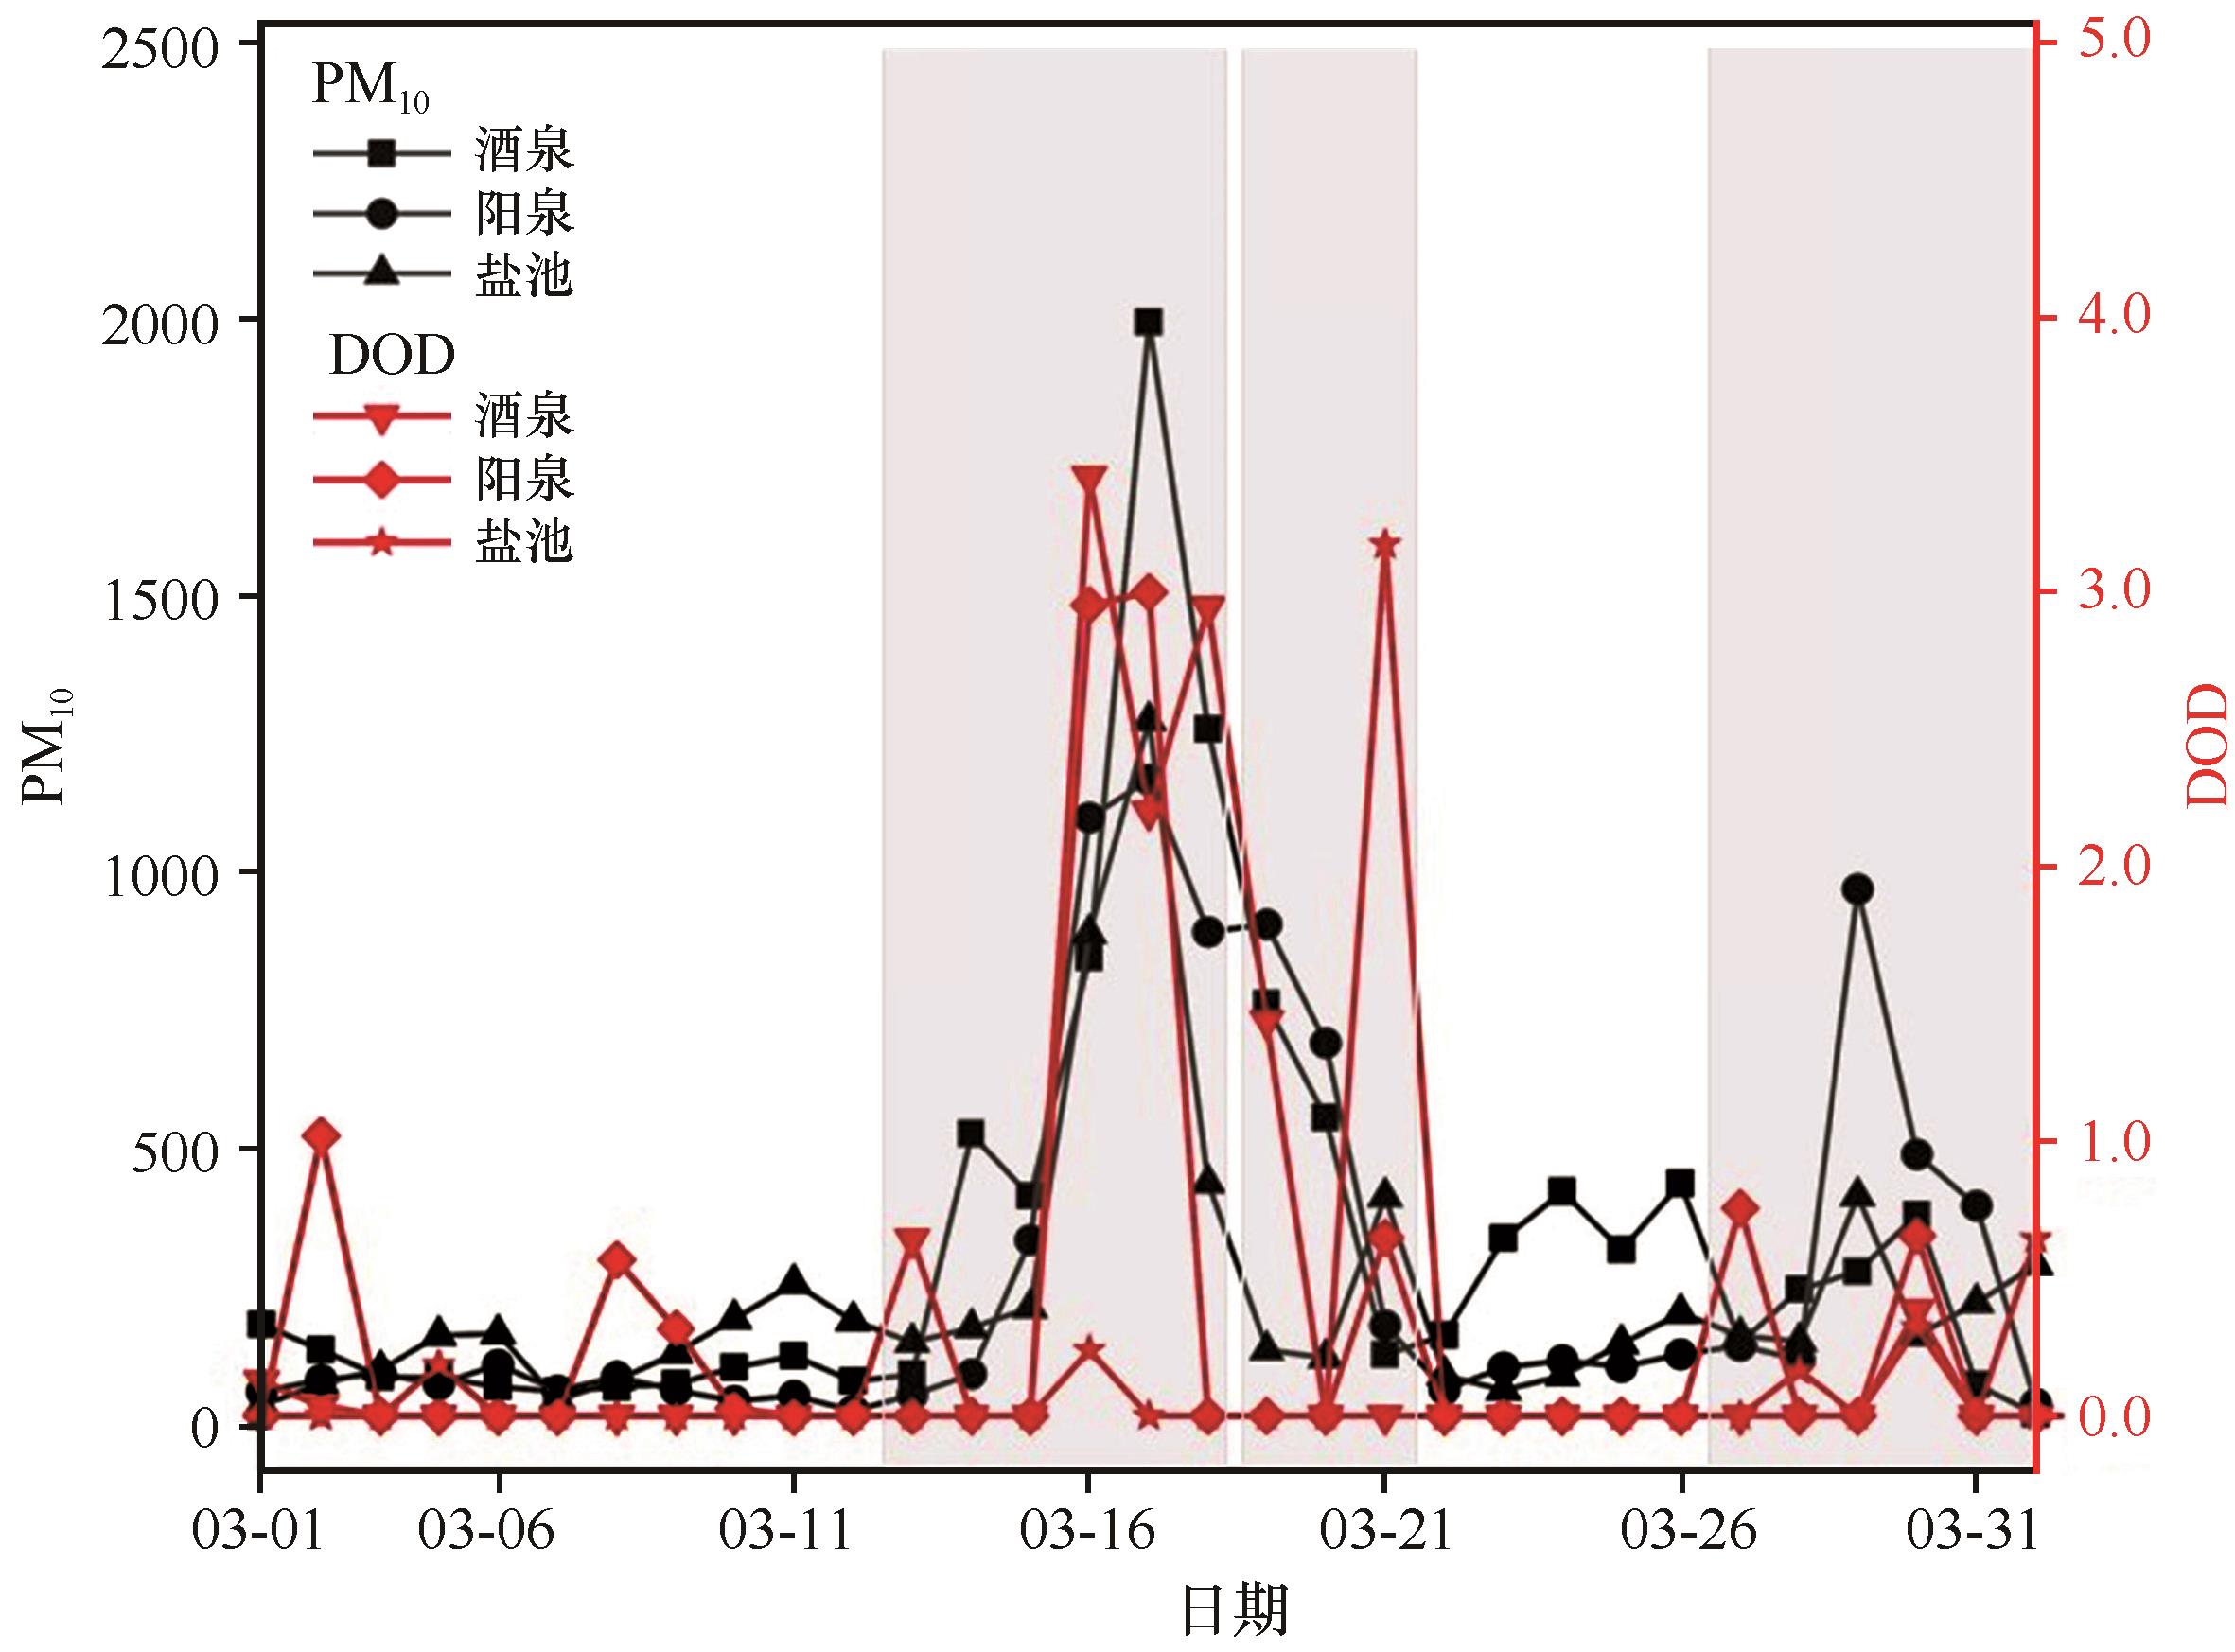
Fig.7 Changes in PM10 and DOD at typical stations in March 2021 (the periods of observed sand and dust storms are indicated by gray shading)
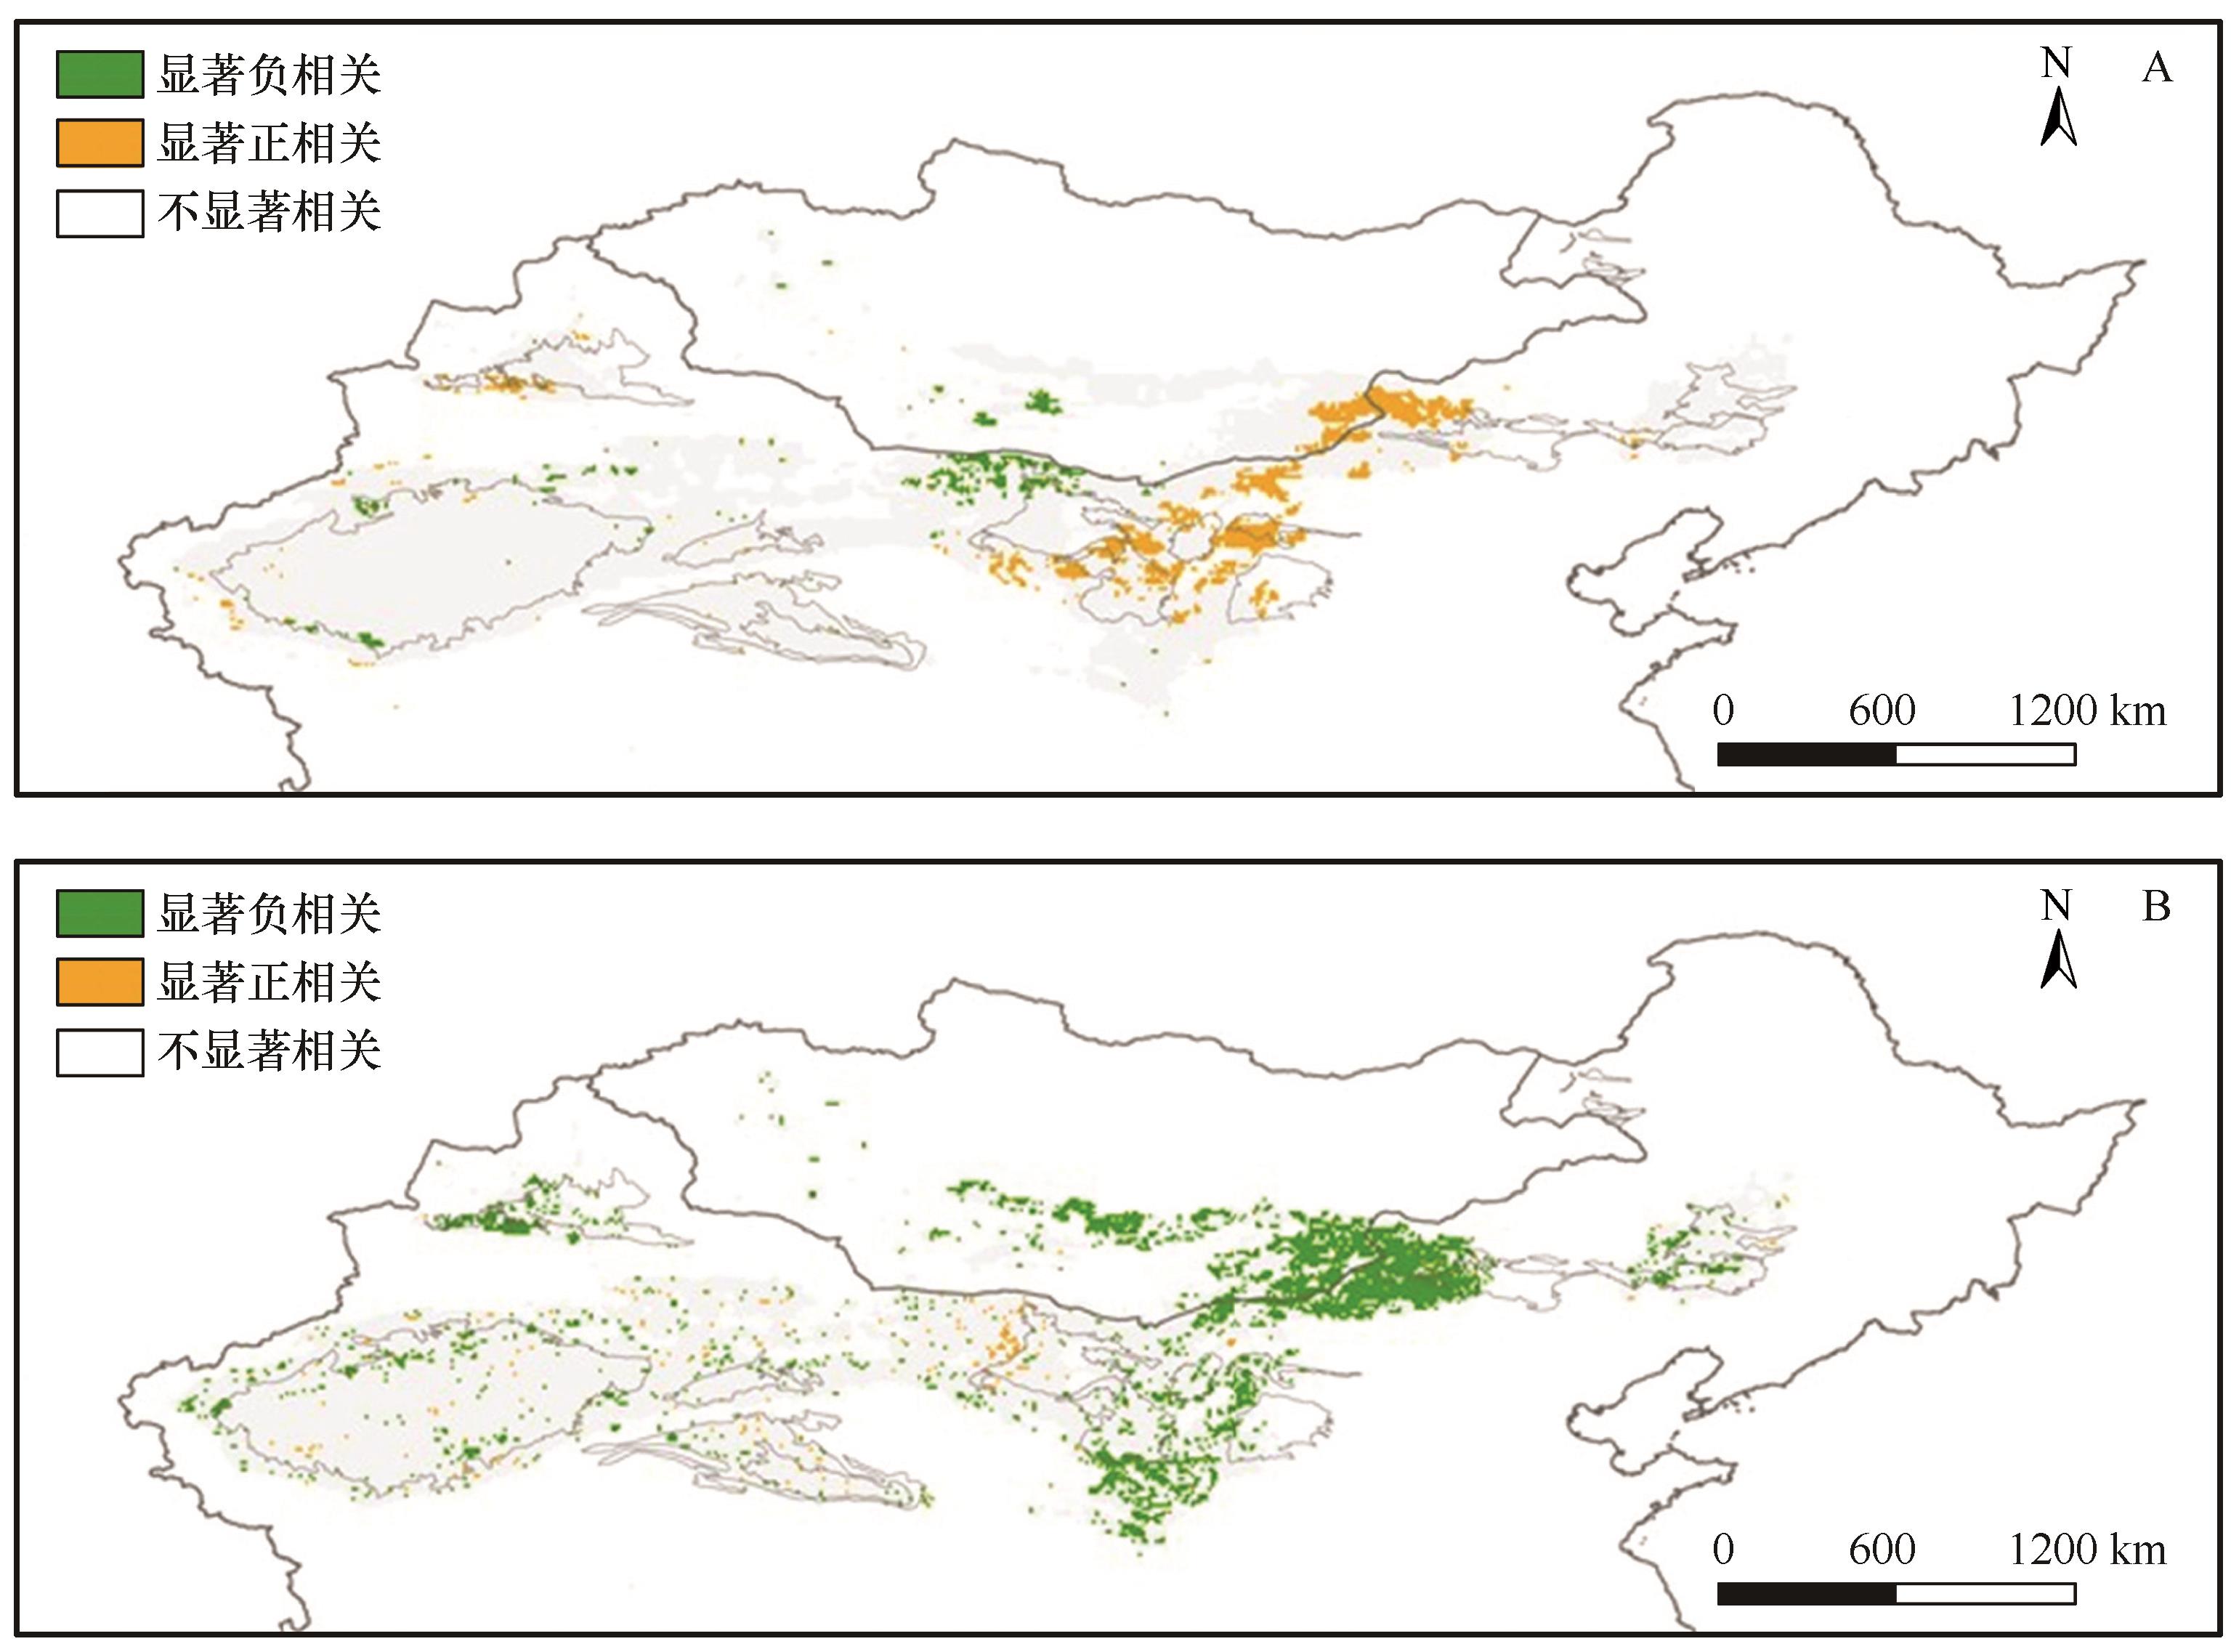
Fig.8 Correlation of FoO with spring wind speed (A) and growing season NDVI (B) in dust-active region of North China and Mongolia from 2001 to 2022
| 1 | 邱新法,曾燕,缪启龙.我国沙尘暴的时空分布规律及其源地和移动路径[J].地理学报,2001,56(3):316-322. |
| 2 | Liang P, Chen B, Yang X,et al.Revealing the dust transport processes of the 2021 mega dust storm event in northern China[J].Chinese Science Bulletin,2022,67(1):21-24. |
| 3 | Tan S, Li J, Che H,et al.Transport of East Asian dust storms to the marginal seas of China and the southern North Pacific in spring 2010[J].Atmospheric Environment,2017,148:316-328. |
| 4 | Chen S, Zhao D, Huang J,et al.Mongolia contributed more than 42% of the dust concentrations in Northern China in March and April 2023[J].Advances in Atmospheric Sciences,2023,40(9):1549-1557. |
| 5 | 郭彩贇,韩致文,李爱敏.塔克拉玛干沙漠地区沙尘暴研究进展[J].中国沙漠,2016,36(6):1646-1652. |
| 6 | McGillicuddy D J, Sedwick P N, Dinniman M S,et al.Iron supply and demand in an Antarctic shelf ecosystem[J].Geophysical Research Letters,2015,42(19):8088-8097. |
| 7 | Zhang S, Yang S, Xiong S,et al.Origin and depositional background of the Holocene black soil in Northeast China:evidence from grain-size analysis and optically stimulated luminescence dating[J].Catena,2024,239:107963. |
| 8 | Yang F, Zhang G, Yang F,et al.Pedogenetic interpretations of particle-size distribution curves for an alpine environment[J].Geoderma,2016,282:9-15. |
| 9 | Xu Z, Hu R, Wang K,et al.Recent greening (1981-2013) in the Mu Us dune field,north-central China,and its potential causes[J].Land Degradation & Development,2018,29(5):1509-1520. |
| 10 | Wang L, Qiu Y, Han Z,et al.Climate,topography and anthropogenic effects on desert greening:a 40-year satellite monitoring in the Tengger Desert,northern China[J].Catena,2022,209:105851. |
| 11 | Wang S, Yu Y, Zhang X,et al.Weakened dust activity over China and Mongolia from 2001 to 2020 associated with climate change and land-use management[J].Environmental Research Letters,2021,16(12):124056. |
| 12 | Prospero J M, Nees R T.Dust concentration in the atmosphere of the equatorial North Atlantic; possible relationship to the Sahelian drought[J].Science,1977,196(4295):1196-1198. |
| 13 | Wu C, Lin Z, Shao Y,et al.Drivers of recent decline in dust activity over East Asia[J].Nature Communications,2022,13(1):7105. |
| 14 | Huang J, Lin B, Minnis P,et al.Satellite-based assessment of possible dust aerosols semi‐direct effect on cloud water path over East Asia[J].Geophysical Research Letters,2006,33(19):026561. |
| 15 | Wang T, Tang J, Sun M,et al.Identifying a transport mechanism of dust aerosols over South Asia to the Tibetan Plateau:a case study[J].Science of The Total Environment,2021,758:143714. |
| 16 | Yu Y, Kalashnikova O V, Garay M J,et al.Identification and characterization of dust source regions across North Africa and the Middle East using MISR satellite observations[J].Geophysical Research Letters,2018,45(13):6690-6701. |
| 17 | Minamoto Y, Nakamura K, Wang M,et al.Large-scale dust event in East Asia in May 2017:dust emission and transport from multiple source regions[J].SOLA,2018,14:33-38. |
| 18 | Li J, He Q, Jin L,et al.Three-dimensional distribution of dust aerosols over the Tarim Basin and the Tibet Plateau during 2007-2021 derived from CALIPSO lidar observations[J].Journal of Cleaner Production,2023,400:136746. |
| 19 | Kaufman Y J, Tanre D, Boucher O.A satellite view of aerosols in the climate system[J].Nature,2002,419(6903):215-223. |
| 20 | Ginoux P, Prospero J M, Gill T E,et al.Global-scale attribution of anthropogenic and natural dust sources and their emission rates based on MODIS Deep Blue aerosol products[J].Reviews of Geophysics,2012,50(3):000388. |
| 21 | Prospero J M, Ginoux P, Torres O,et al.Environmental characterization of global sources of atmospheric soil dust identified with the nimbus 7 total ozone mapping spectrometer(TOMS) absorbing aerosol product[J].Reviews of Geophysics,2002,40(1):1-2. |
| 22 | Liu J, Ding J, Rexiding M,et al.Characteristics of dust aerosols and identification of dust sources in Xinjiang,China[J].Atmospheric Environment,2021,262:118651. |
| 23 | Tian X, Tang C, Wu X,et al.The global spatial-temporal distribution and EOF analysis of AOD based on MODIS data during 2003-2021[J].Atmospheric Environment,2023,302:119722. |
| 24 | Miller S D.A consolidated technique for enhancing desert dust storms with MODIS[J].Geophysical Research Letters,2003,30(20):018279. |
| 25 | King M D, Kaufman Y J, Menzel W P,et al.Remote sensing of cloud,aerosol,and water vapor properties from the moderate resolution imaging spectrometer (MODIS)[J].IEEE Transactions on Geoscience and Remote Sensing,1992,30(1):2-27. |
| 26 | Levy R C, Mattoo S, Munchak L A,et al.The Collection 6 MODIS aerosol products over land and ocean[J].Atmospheric Measurement Techniques,2013,6(11):2989-3034. |
| 27 | Hsu N C, Tsay S, King M D,et al.Aerosol properties over bright-reflecting source regions[J].IEEE Transactions on Geoscience and Remote Sensing,2004,42(3):557-569. |
| 28 | Pu B, Ginoux P.How reliable are CMIP5 models in simulating dust optical depth?[J].Atmospheric Chemistry and Physics,2018,18(16):12491-12510. |
| 29 | Anderson T L.Testing the MODIS satellite retrieval of aerosol fine-mode fraction[J].Journal of Geophysical Research:Atmospheres,2005,110(D18):18204. |
| 30 | Eck T F, Holben B N, Reid J S,et al.Wavelength dependence of the optical depth of biomass burning,urban,and desert dust aerosols[J].Journal of Geophysical Research:Atmospheres,1999,104(D24):31333-31349. |
| 31 | 王式功,王金艳,周自江,等.中国沙尘天气的区域特征[J].地理学报,2003,58(2):193-200. |
| 32 | Hamed K H.Trend detection in hydrologic data:the Mann-Kendall trend test under the scaling hypothesis[J].Journal of Hydrology,2008,349(3/4):350-363. |
| 33 | Hamed K H, Ramachandra Rao A.A modified Mann-Kendall trend test for autocorrelated data[J].Journal of Hydrology,1998,204(1):182-196. |
| 34 | 张咪,段菁春,殷丽娜,等.北京市2018年春季一次沙尘回流过程的污染特征[J].中国环境科学,2021,41(11):4990-4998. |
| 35 | Wang L, Chen Y, Niu Y,et al.Analysis of atmospheric turbidity in clear skies at Wuhan,Central China[J].Journal of Earth Science,2017,28(4):729-738. |
| 36 | Zhang Y, Li Z, Bai K,et al.Satellite remote sensing of atmospheric particulate matter mass concentration:advances,challenges,and perspectives[J].Fundamental Research,2021,1(3):240-258. |
| 37 | Lin Q, Liu Y, Guo J,et al.Simulated dust activity in typical time periods of the past 250 million years[J/OL].Fundamental Research, 2024.DOI:10.1016/j.fmre.2024.02.00 . |
| 38 | Baddock M C, Ginoux P, Bullard J E,et al.Do MODIS‐defined dust sources have a geomorphological signature?[J].Geophysical Research Letters,2016,43(6):2606-2613. |
| 39 | Wang S, Wang J, Zhou Z,et al.Regional characteristics of three kinds of dust storm events in China[J].Atmospheric Environment,2005,39(3):509-520. |
| 40 | Liu X, Yin Z, Zhang X,et al.Analyses of the spring dust storm frequency of northern China in relation to antecedent and concurrent wind,precipitation,vegetation,and soil moisture conditions[J].Journal of Geophysical Research:Atmospheres,2004,109(D16):D16210-D16211. |
| 41 | Qian W, Quan L, Shi S.Variations of the dust storm in China and its climatic control[J].Journal of Climate,2002,15(10):1216-1229. |
| 42 | Goudie A S.Dust storms in space and time[J].Progress in Physical Geography,1983,7(4):502-530. |
| 43 | 张小曳.亚洲粉尘的源区分布、释放、输送、沉降与黄土堆积[J].第四纪研究,2001,21(1):29-40. |
| 44 | Zhang X, Arimoto R, An Z.Dust emission from Chinese desert sources linked to variations in atmospheric circulation[J].Journal of Geophysical Research:Atmospheres,1997,102(D23):28041-28047. |
| 45 | 王伊蒙,范亚秋,龙川,等.基于文献记录的敦煌地区历史时期沙尘天气序列重建[J].中国沙漠,2024,44(2):162-171. |
| 46 | 李晋昌,董治宝,王训明,等.塔里木盆地沙尘天气的季节变化及成因分析[J].中国沙漠,2008,28(1):142-148. |
| 47 | Yin Z, Wan Y, Zhang Y,et al.Why super sandstorm 2021 in North China?[J].National Science Review,2022,9(3):nwab165. |
| 48 | Zhang X, Gong S, Zhao T,et al.Sources of Asian dust and role of climate change versus desertification in Asian dust emission[J].Geophysical Research Letters,2003,30(24):ASC1-ASC8. |
| 49 | Sun J, Zhang M, Liu T.Spatial and temporal characteristics of dust storms in China and its surrounding regions,1960-1999:Relations to source area and climate[J].Journal of Geophysical Research:Atmospheres,2001,106(D10):325-333. |
| 50 | Wang X, Dong Z, Zhang J,et al.Modern dust storms in China:an overview[J].Journal of Arid Environments,2004,58(4):559-574. |
| 51 | 古丽斯坦·阿卜杜克热木,丁建丽,马雯.南疆地区不同类型沙尘天气及相关因素对气溶胶光学厚度影响研究[J].环境科学学报,2024,44(6):259-269. |
| 52 | Cui M, Lu H, Wiggs G F S,et al.Quantifying the effect of geomorphology on aeolian dust emission potential in northern China[J].Earth Surface Processes and Landforms,2019,44(14):2872-2884. |
| 53 | 侯承志,黄丹青,桂东伟,等.1961-2019年中国北方沙漠沙地极端气候变化特征及其影响因素[J].地理科学,2023,43(8):1495-1505. |
| 54 | Hou C, Huang D, Xu H,et al.Evaluation of ERA5 reanalysis over the deserts in northern China[J].Theoretical and Applied Climatology,2023,151(1/2):801-816. |
| 55 | Gou J, Xu H, Liu L,et al.The trend reversal of dust aerosol over East Asia and the North Pacific Ocean attributed to large-scale meteorology,deposition,and soil moisture[J].Journal of Geophysical Research:Atmospheres,2019,124(19):10450-10466. |
| 56 | Wang X, Zhang C.Sensitivity of soil dust emissions to driving factor variability in earth's main drylands[J].Geoderma,2024,445:116876. |
| 57 | Qiu Y, Xu Z, Xu C,et al.Can remotely sensed vegetation patterns signal dryland restoration success?[J].Restoration Ecology,2023,31(3):e13760. |
| 58 | Zhang L, Zhou B, Song B,et al.Significant carbon isotopic fractionation during early formation of biological soil crusts with indications for dryland carbon cycling[J].iScience,2024,27(3):109114. |
| 59 | Song B, Fang J, Yu Z,et al.The development of biological soil crust along the time series is mediated by archaeal communities[J].Geoderma,2024,449:117022. |
| 60 | Tian Q, Huang G, Hu K,et al.Observed and global climate model based changes in wind power potential over the Northern Hemisphere during 1979-2016[J].Energy,2019,167:1224-1235. |
| 61 | 卜凡蕊,刘颖,邹学勇.中国东部典型沙地植被覆盖度对降水变化的响应[J].中国沙漠,2023,43(3):9-20. |
| 62 | Zhao W, Liu B.The response of sap flow in shrubs to rainfall pulses in the desert region of China[J].Agricultural and Forest Meteorology,2010,150(9):1297-1306. |
| 63 | 张强,杨金虎,王朋岭,等.西北地区气候暖湿化的研究进展与展望[J].科学通报,2023,68(14):1814-1828. |
| 64 | 董祝雷,姜学恭,衣娜娜,等.风速和植被对内蒙古地区沙尘天气影响的数值模拟[J].中国沙漠,2023,43(6):29-39. |
| 65 | Wang S, Li R, Wu Y,et al.Effects of multi-temporal scale drought on vegetation dynamics in Inner Mongolia from 1982 to 2015,China[J].Ecological Indicators,2022,136:108666. |
| 66 | Zhang H, Fan J, Cao W,et al.Response of wind erosion dynamics to climate change and human activity in Inner Mongolia,China during 1990 to 2015[J].Science of The Total Environment,2018,639:1038-1050. |
| [1] | Ying Zhai, Jiangli Pang, Chunchang Huang, Xiaochun Zha, Yali Zhou, Yuqin Li, Yuzhu Zhang, Xueqing Sun, Xiaokang Zhao. Particle endmembers characteristics of Amiola-South profile in the Zoige Basin and recorded climate change since 15 ka BP [J]. Journal of Desert Research, 2025, 45(2): 111-118. |
| [2] | Xin Hu, Sawut Mamat, Feng Zhang, Jintao Cui, Aimaier Ainiwan, Manlike Asiya. Hyperspectral remote sensing estimation of Fe2O3 content in desert soil based on dandelion-optimized random forest model [J]. Journal of Desert Research, 2025, 45(2): 191-204. |
| [3] | Yanxi Wang, Jianjun Qu, Cheng Shen, Shuai Zhong, Jun Li. Erosion and prevention of the sandy coast of Dengloujiao, Leizhou Peninsula, China [J]. Journal of Desert Research, 2025, 45(1): 10-19. |
| [4] | Yiying Yang, Silin Su, Enzhi Cao, Hongyou Li, Hongming Chi, Kai Lin, Xudong Wu, Wenqiang He, Haotian Yang. Impacts of large-scale desert photovoltaic power stations on the phenotype and biomass distribution characteristics of sand-fixing plants [J]. Journal of Desert Research, 2025, 45(1): 162-172. |
| [5] | Bin Li, Xiaolong Sun, Yuechen Zhao, Qi Jiang, Shiqing Lu, Jiaqi Tang. Prediction model of dust mass generation in dust source by random forest [J]. Journal of Desert Research, 2025, 45(1): 292-303. |
| [6] | Zhenliang Yin, Rui Zhu, Chunshuang Fang, Huaqing Yang, Zexia Chen. Attribution analysis of runoff variations in the Changma River Basin based on the Budyko hypothesis [J]. Journal of Desert Research, 2024, 44(6): 110-121. |
| [7] | Bingbing Chen, Yingchun Ge, Zhonghang Song, Xiangnan Wu, Yu Ai, Ying Yang, Shengtang Wang, Yushuo Liu. Spatio-temporal evolution and driving forces of ecological quality in Qilian Mountains [J]. Journal of Desert Research, 2024, 44(6): 258-267. |
| [8] | Sen Li, Zongying Yang, Hongyan Zhao, Narentuya, Guixiang An, Jiali Xie, Xiaopeng Jia, Changzhen Yan. Spatio-temporal changes of aeolian desertification in the Jiziwan of the Yellow River from 1975 to 2020 [J]. Journal of Desert Research, 2024, 44(5): 13-22. |
| [9] | Lang Zhang, Guofeng Dang, Tengfei Yu, Tuo Han, Yidan Yin, Yong Chen. Monitoring and change analysis of vegetation coverage in Ejin Oasis based on UAV-LiDAR [J]. Journal of Desert Research, 2024, 44(5): 170-181. |
| [10] | Yuqiang Li, Xuyang Wang, Chengzhuo Zheng, Jie Lian, Xinping Liu, Xiangwen Gong, Yulong Duan, Xiaoming Mu, Lilong Wang. The practice on prevention and control of aeolian desertification and suggestion on the ecologically sustainable restoration in the Horqin Sandy Land [J]. Journal of Desert Research, 2024, 44(4): 302-314. |
| [11] | Teng Zhang, Yunfa Miao, Yaguo Zou, Ziyue Zhang, Guoping Feng. Classification and changes of vegetation in Sugan Lake wetland in the extreme arid region [J]. Journal of Desert Research, 2024, 44(4): 81-90. |
| [12] | Jiayu Du, Xianfeng Liu, Gaopeng Sun, Shuangshuang Li. Spatiotemporal variation in vegetation optical depth and its influencing factors over the Loess Plateau during 2003-2018 [J]. Journal of Desert Research, 2024, 44(3): 222-230. |
| [13] | Zhenzi He, Bingxin Xu, Wenjing Liu, Yigang Hu. Carbon exchange of desert soil crust in response to simulated warming and changes of precipitation [J]. Journal of Desert Research, 2024, 44(3): 269-278. |
| [14] | Jianhui Ge, Bing Liu, Yujie Xu, Aijun Sun, Keqi Wang, Dongxue Li, hui Zhao. Interrelationships between climate change and surface processes in the First Meander of the Yellow River since the Last Deglaciation [J]. Journal of Desert Research, 2024, 44(2): 121-132. |
| [15] | Yu Yan, Hejun Zuo, Min Yan, Cheng Xi, Jiaqi Dong, Limei Niu. Lake number and area in Kubuqi Desert from 1986 to 2020 [J]. Journal of Desert Research, 2024, 44(2): 151-161. |
| Viewed | ||||||
|
Full text |
|
|||||
|
Abstract |
|
|||||
©2018Journal of Desert Research
Tel:0931-8267545
Email:caiedit@lzb.ac.cn;desert@lzb.ac.cn
Support:Magtech