img

官方微信

高级检索

中国沙漠 ›› 2024, Vol. 44 ›› Issue (5): 84-94.DOI: 10.7522/j.issn.1000-694X.2024.00048

• • 上一篇    下一篇

20012022年祁连山南坡地表温度时空变化特征及驱动因素

李晓燕1(), 曹广超1,2, 陈宗颜1,2, 袁杰1,2(), 孙子婷1, 唐建亭1   

  1. 1.青海师范大学 青藏高原地表过程与生态保育教育部重点实验室/地理科学学院/青海省自然地理与环境过程重点实验室,青海 西宁 810008
    2.青海省人民政府-北京师范大学高原科学与可持续发展研究院,青海 西宁 810008
  • 收稿日期:2023-12-26 修回日期:2024-04-02 出版日期:2024-09-20 发布日期:2024-10-15
  • 通讯作者: 袁杰
  • 作者简介:袁杰(E-mail: yuanjie8903@126.com
    李晓燕(1997—),女,甘肃会宁人,硕士研究生,研究方向为地表环境过程。E-mail: 3460150742@qq.com
  • 基金资助:
    青海省自然科学基金项目(2023-ZJ-907M);青海省“昆仑英才·高端创新创业人才”计划项目(青人才字〔2023〕01号);青海省“高端创新人才千人计划”(青人才字〔2019〕06号)

Spatial-temporal characteristics and influencing factors of land surface temperature on the southern slope of Qilian Mountains from 2001 to 2022

Xiaoyan Li1(), Guangchao Cao1,2, Zongyan Chen1,2, Jie Yuan1,2(), Ziting Sun1, Jianting Tang1   

  1. 1.Ministry of Education Key Laboratory of Tibetan Plateau Land Surface Processes and Ecological Conservation / College of Geographical Science / Qinghai Provincial Key Laboratory of Physical Geography and Environmental Process,Qinghai Normal University,Xining 810008,China
    2.Academy of Plateau Science and Sustainability,People's Government of Qinghai Province and Beijing Normal University,Xining 810008,China
  • Received:2023-12-26 Revised:2024-04-02 Online:2024-09-20 Published:2024-10-15
  • Contact: Jie Yuan

摘要:

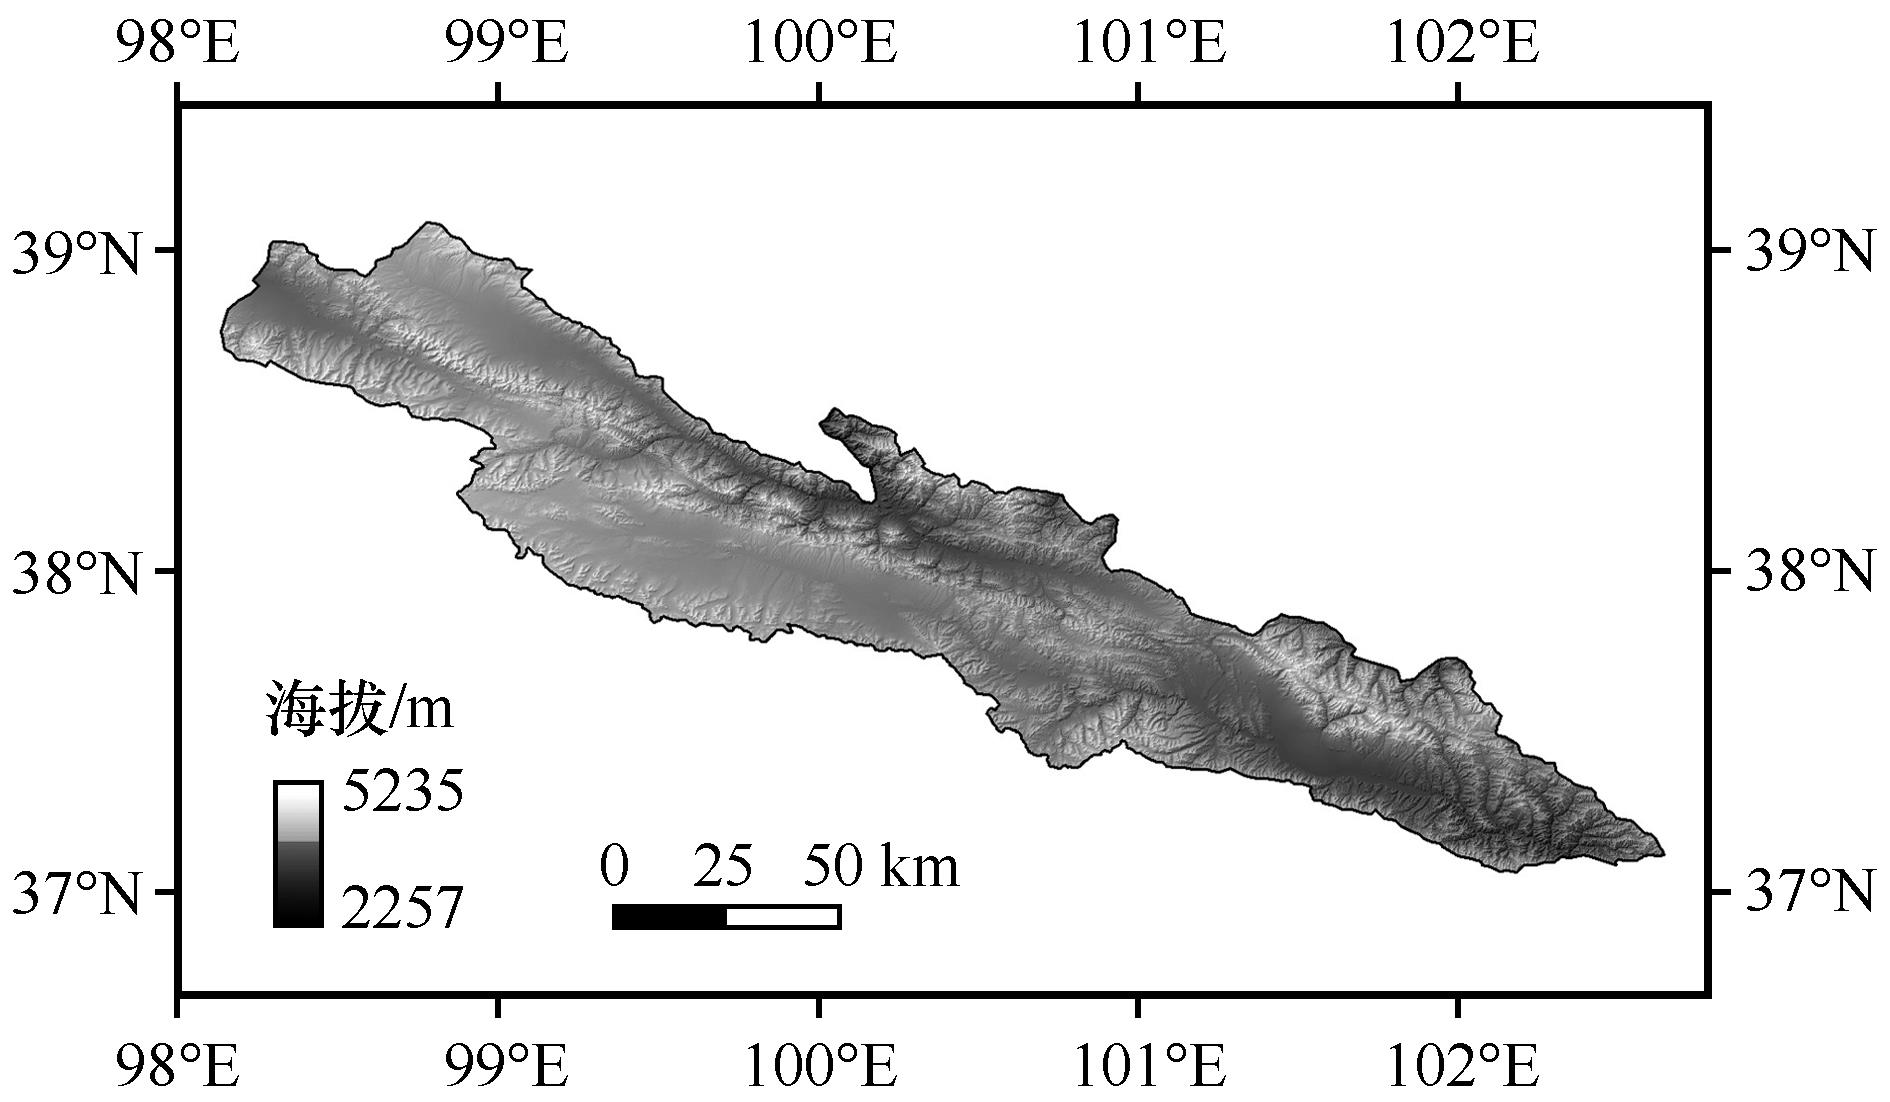
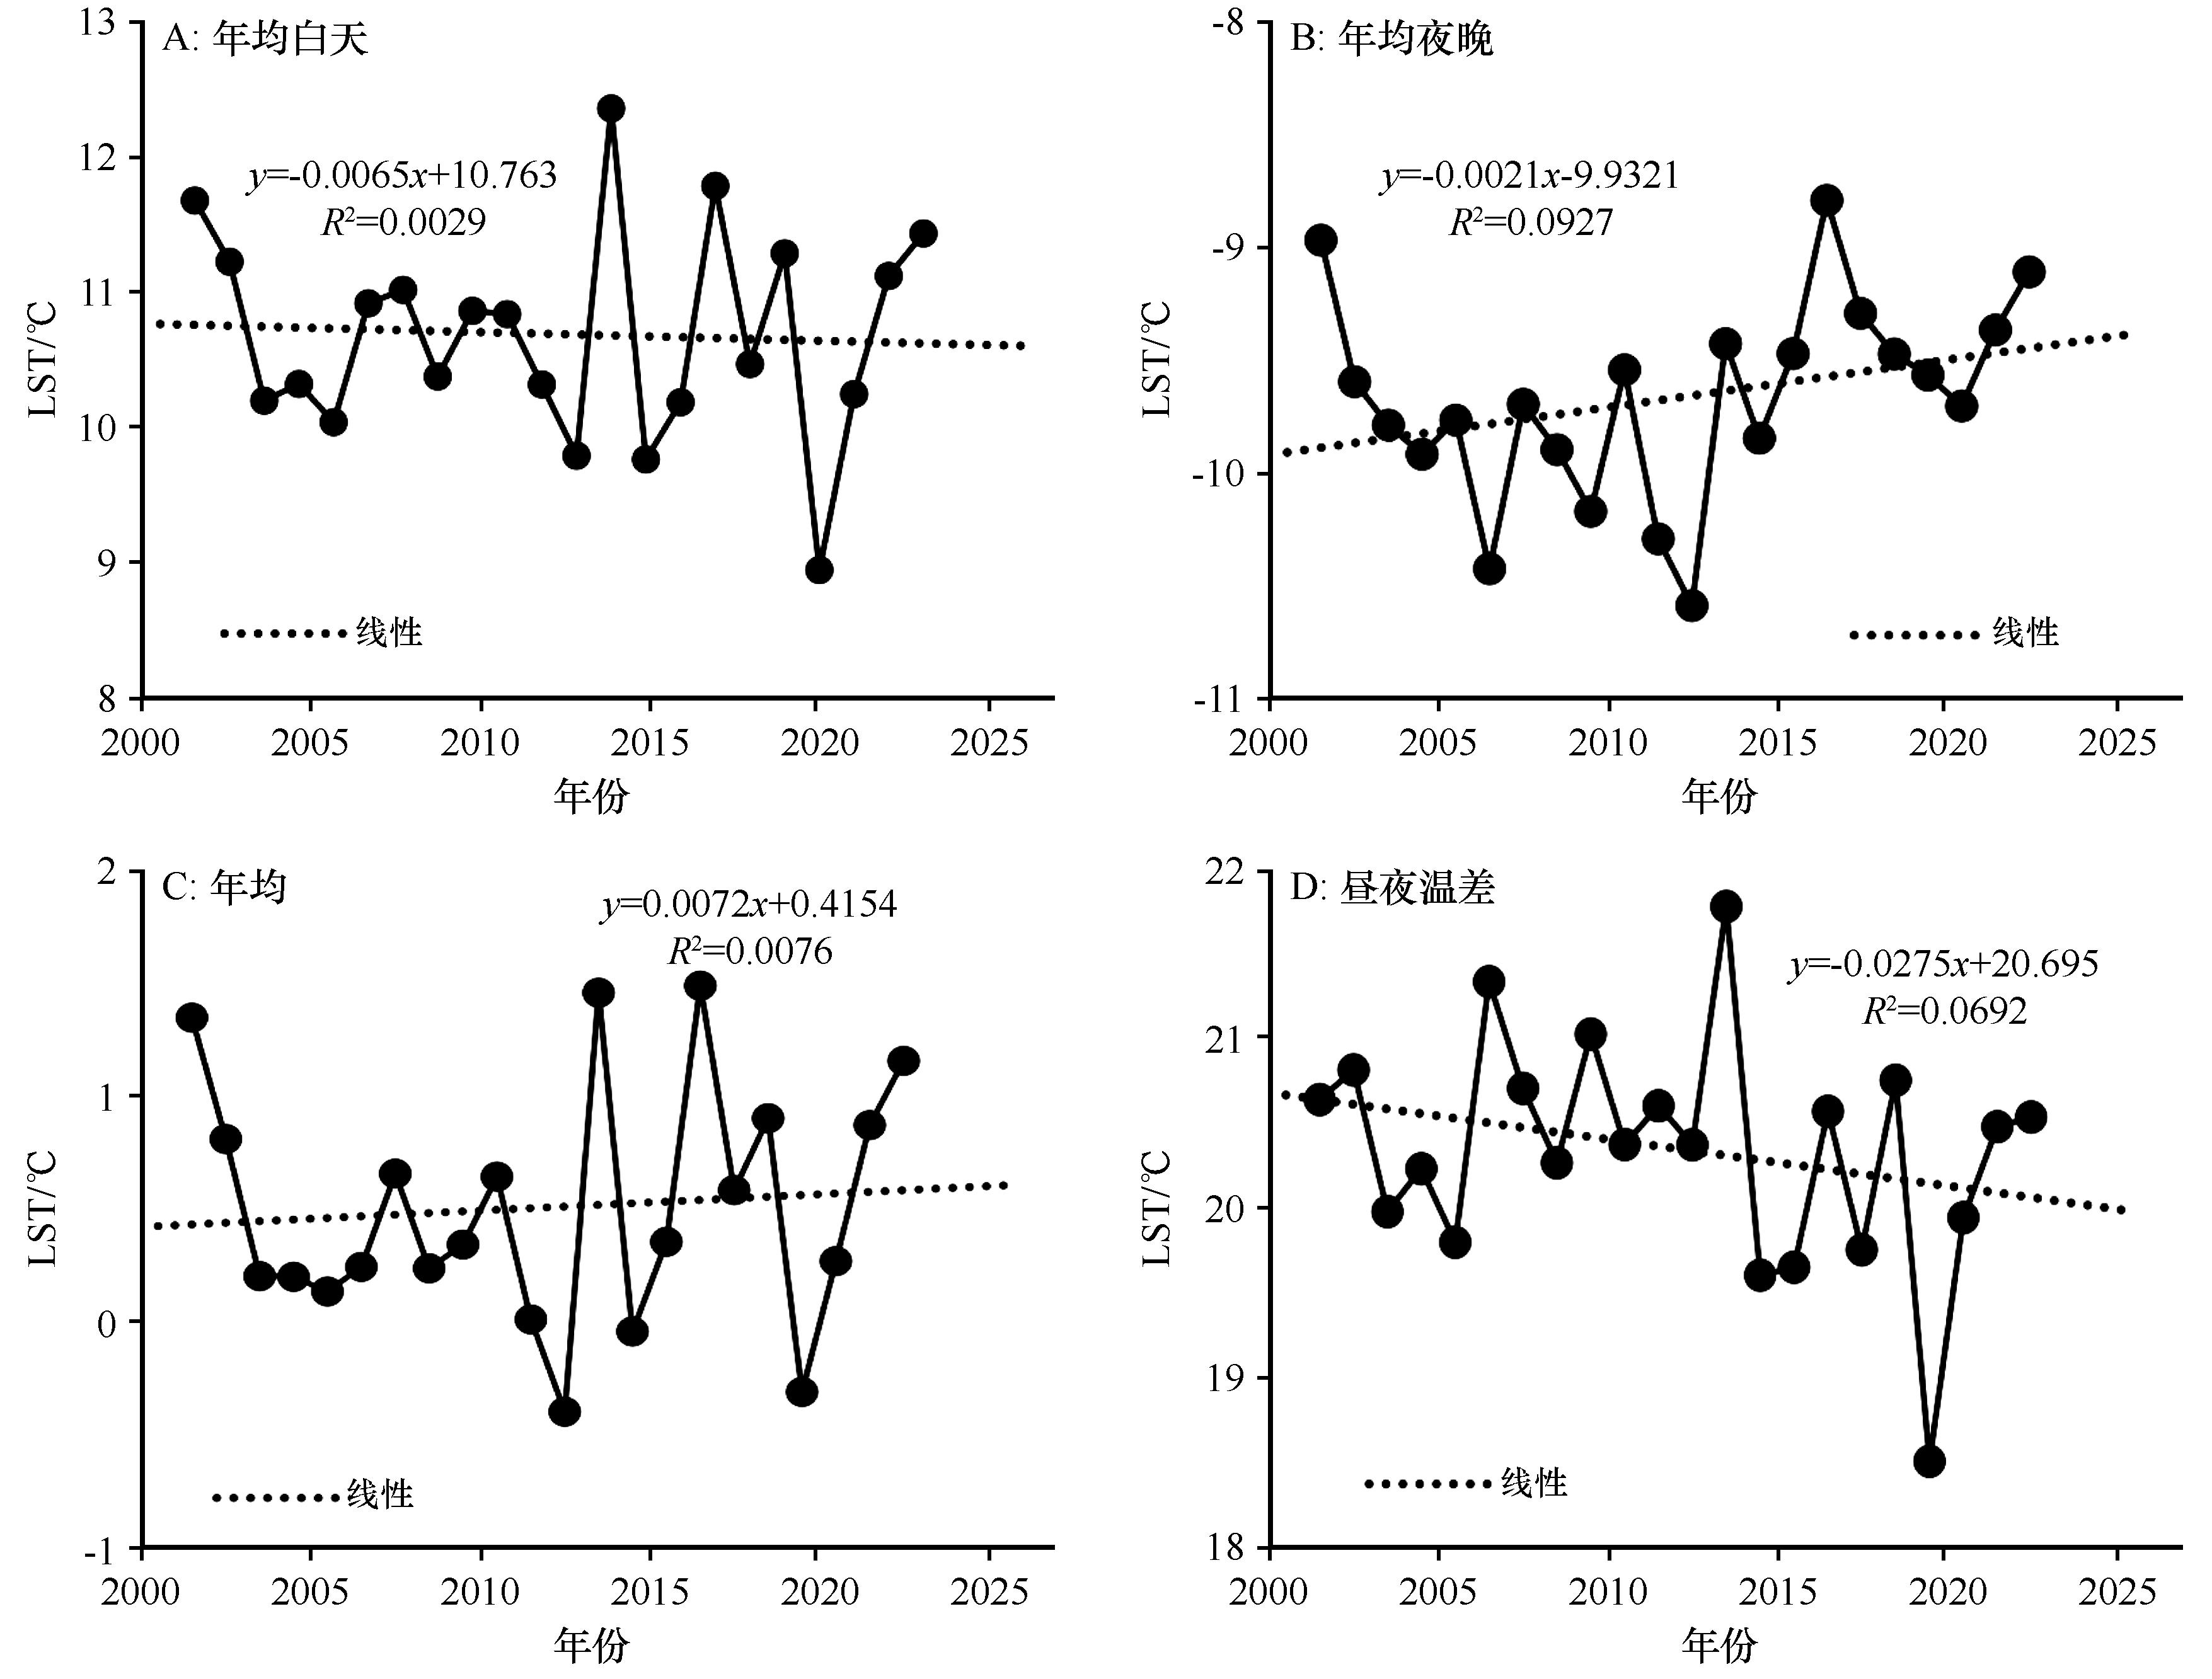
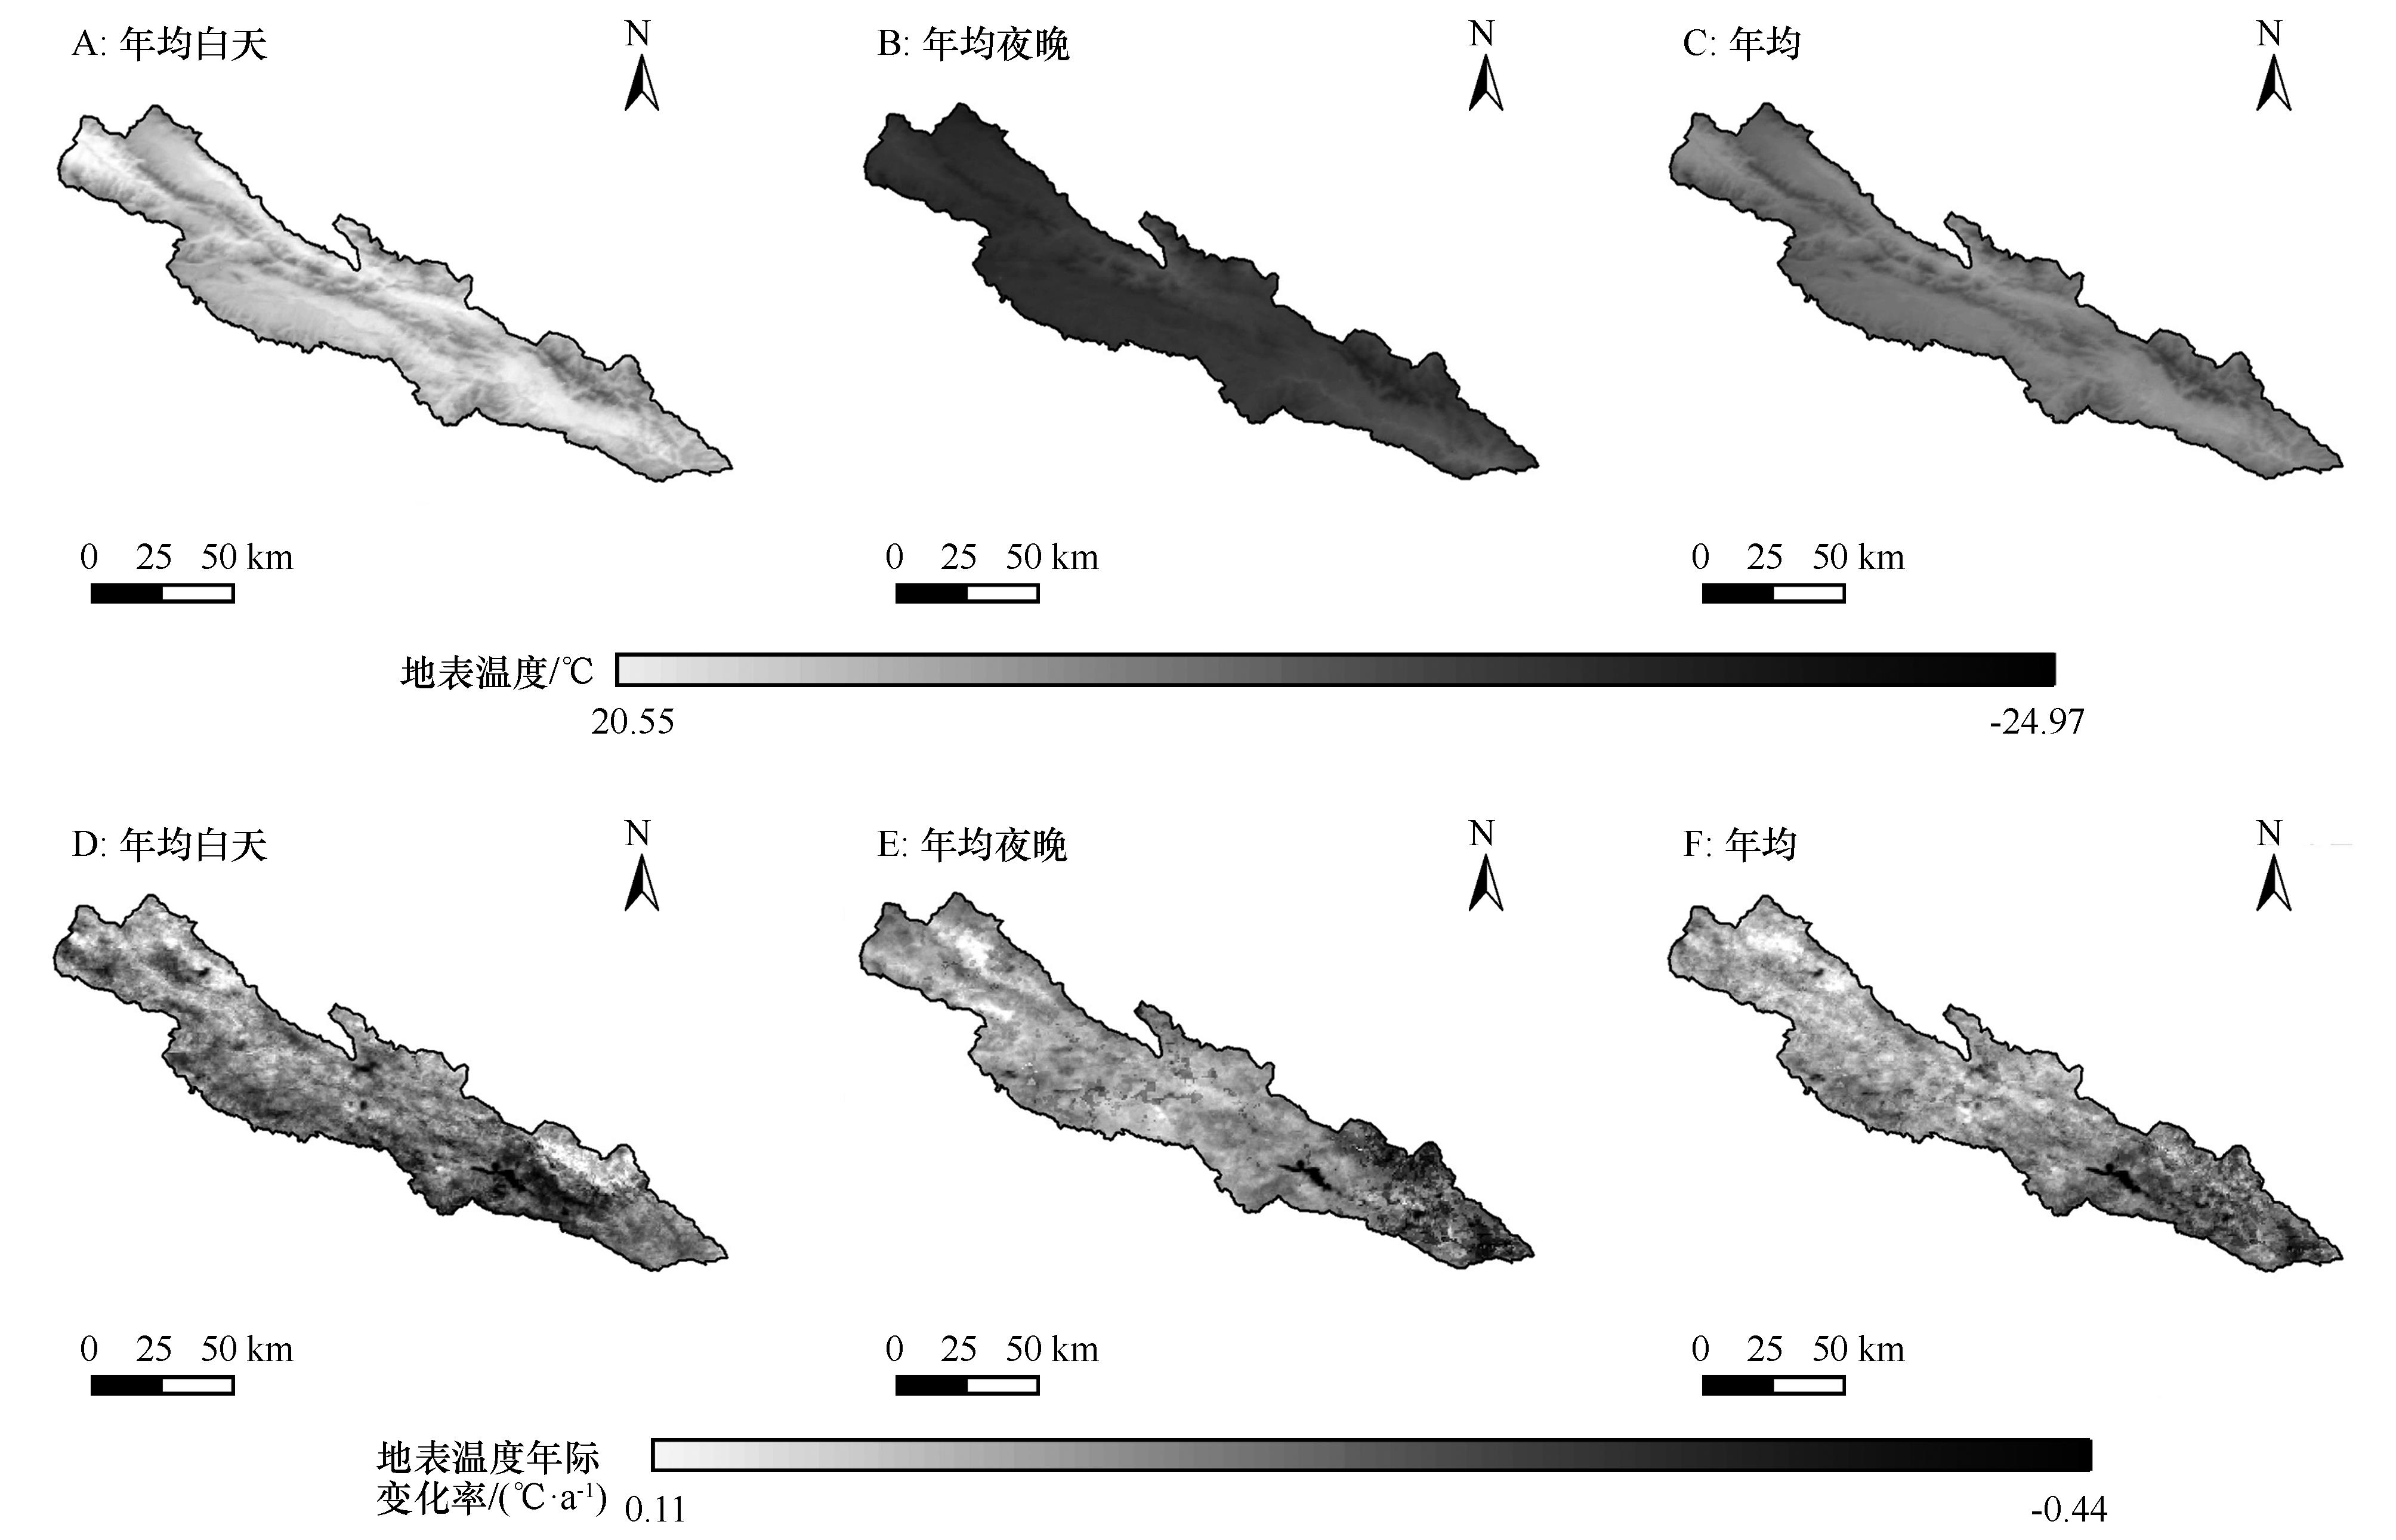
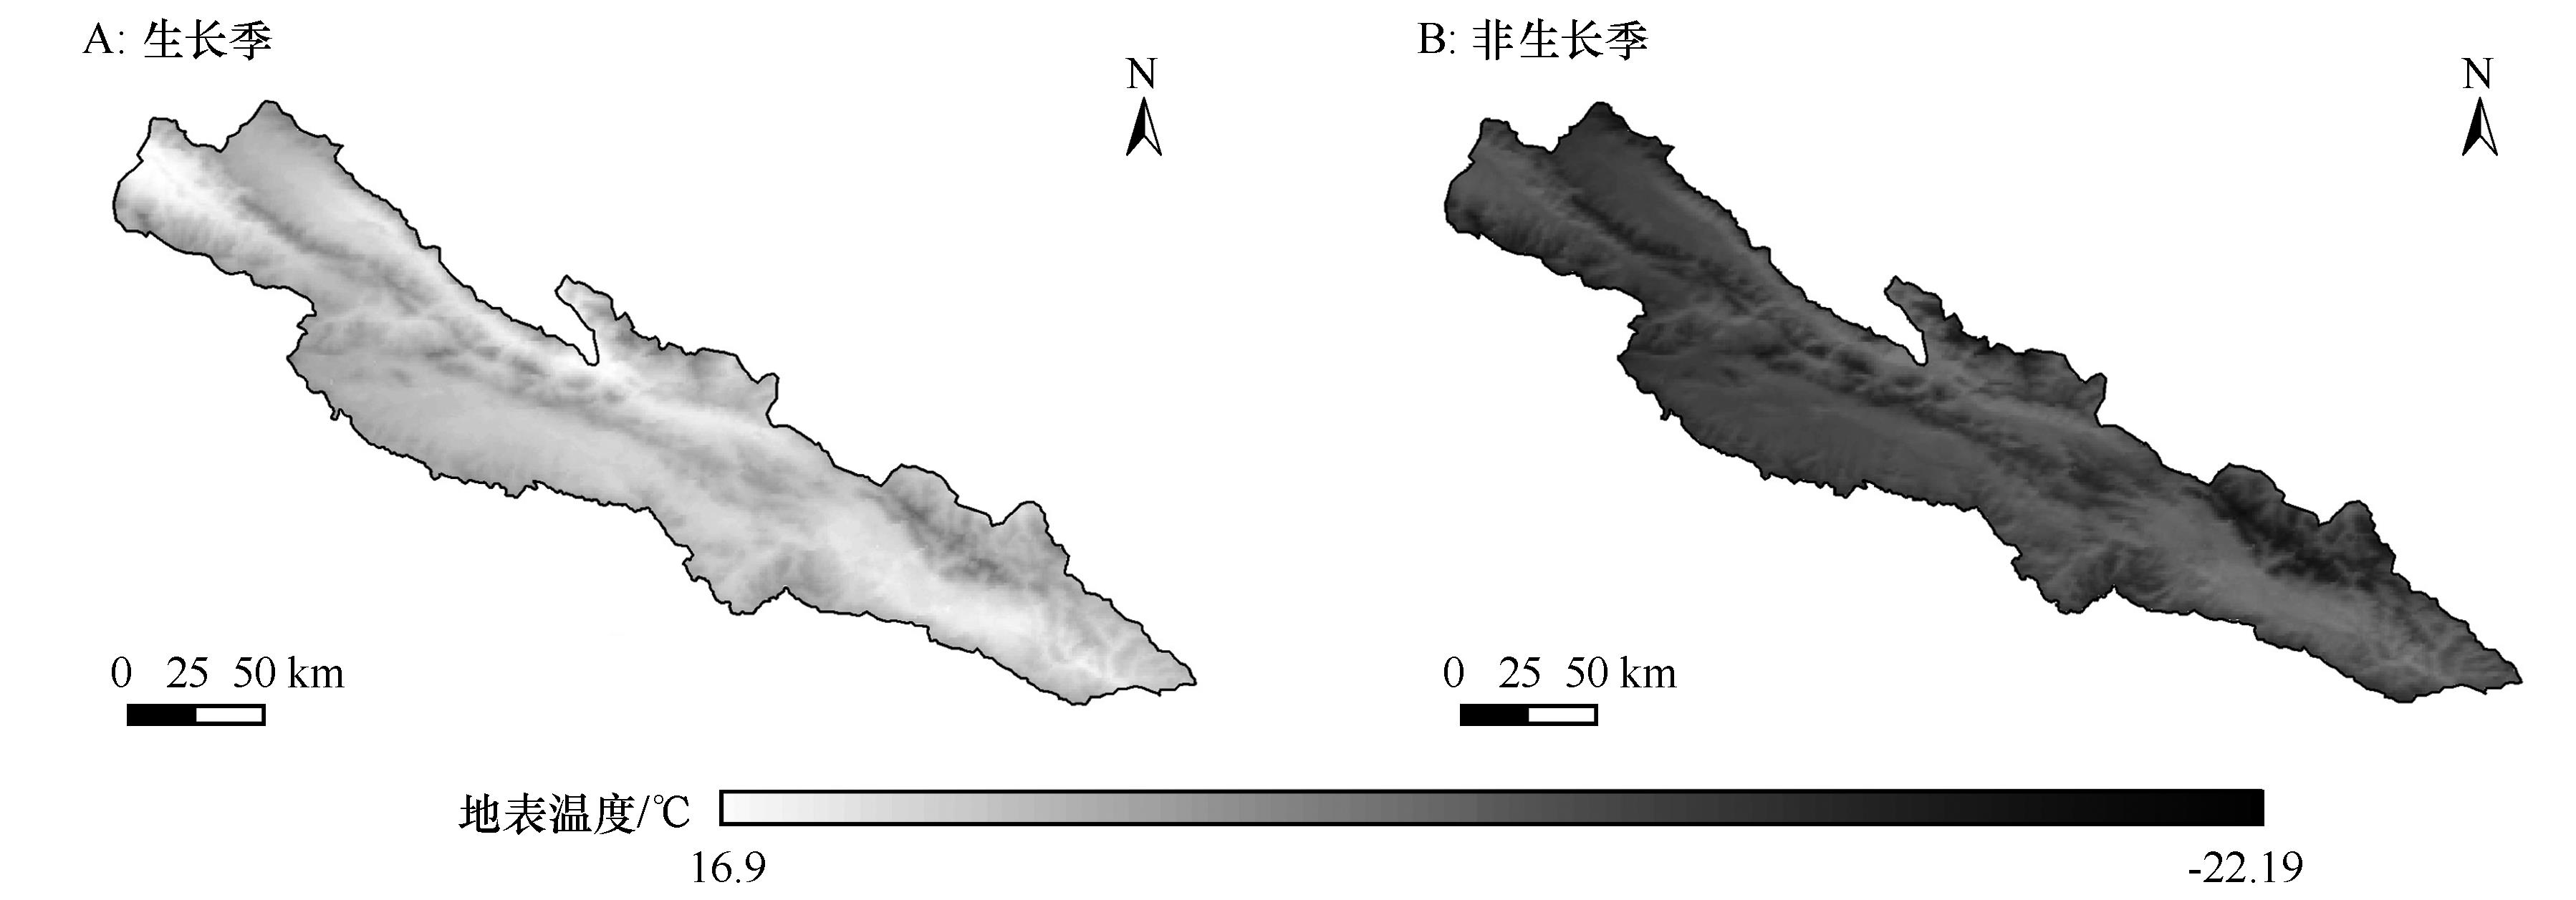
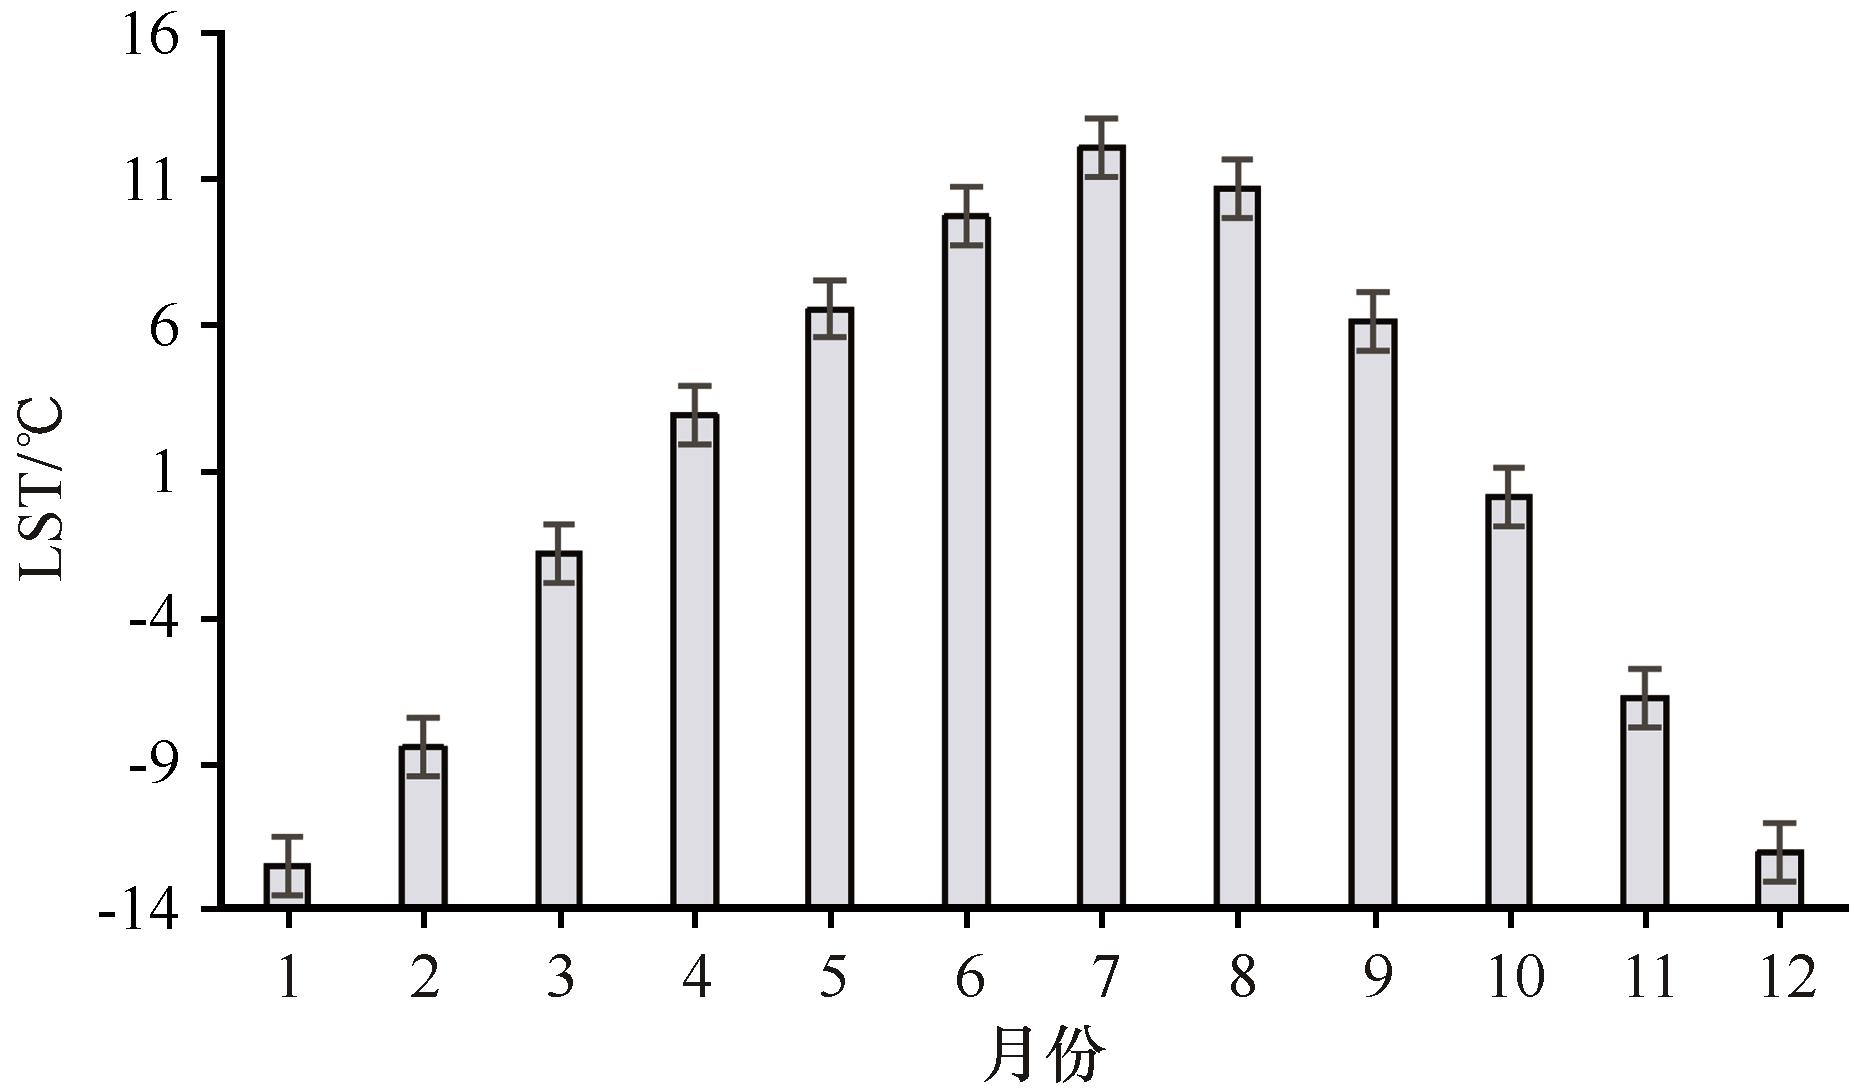
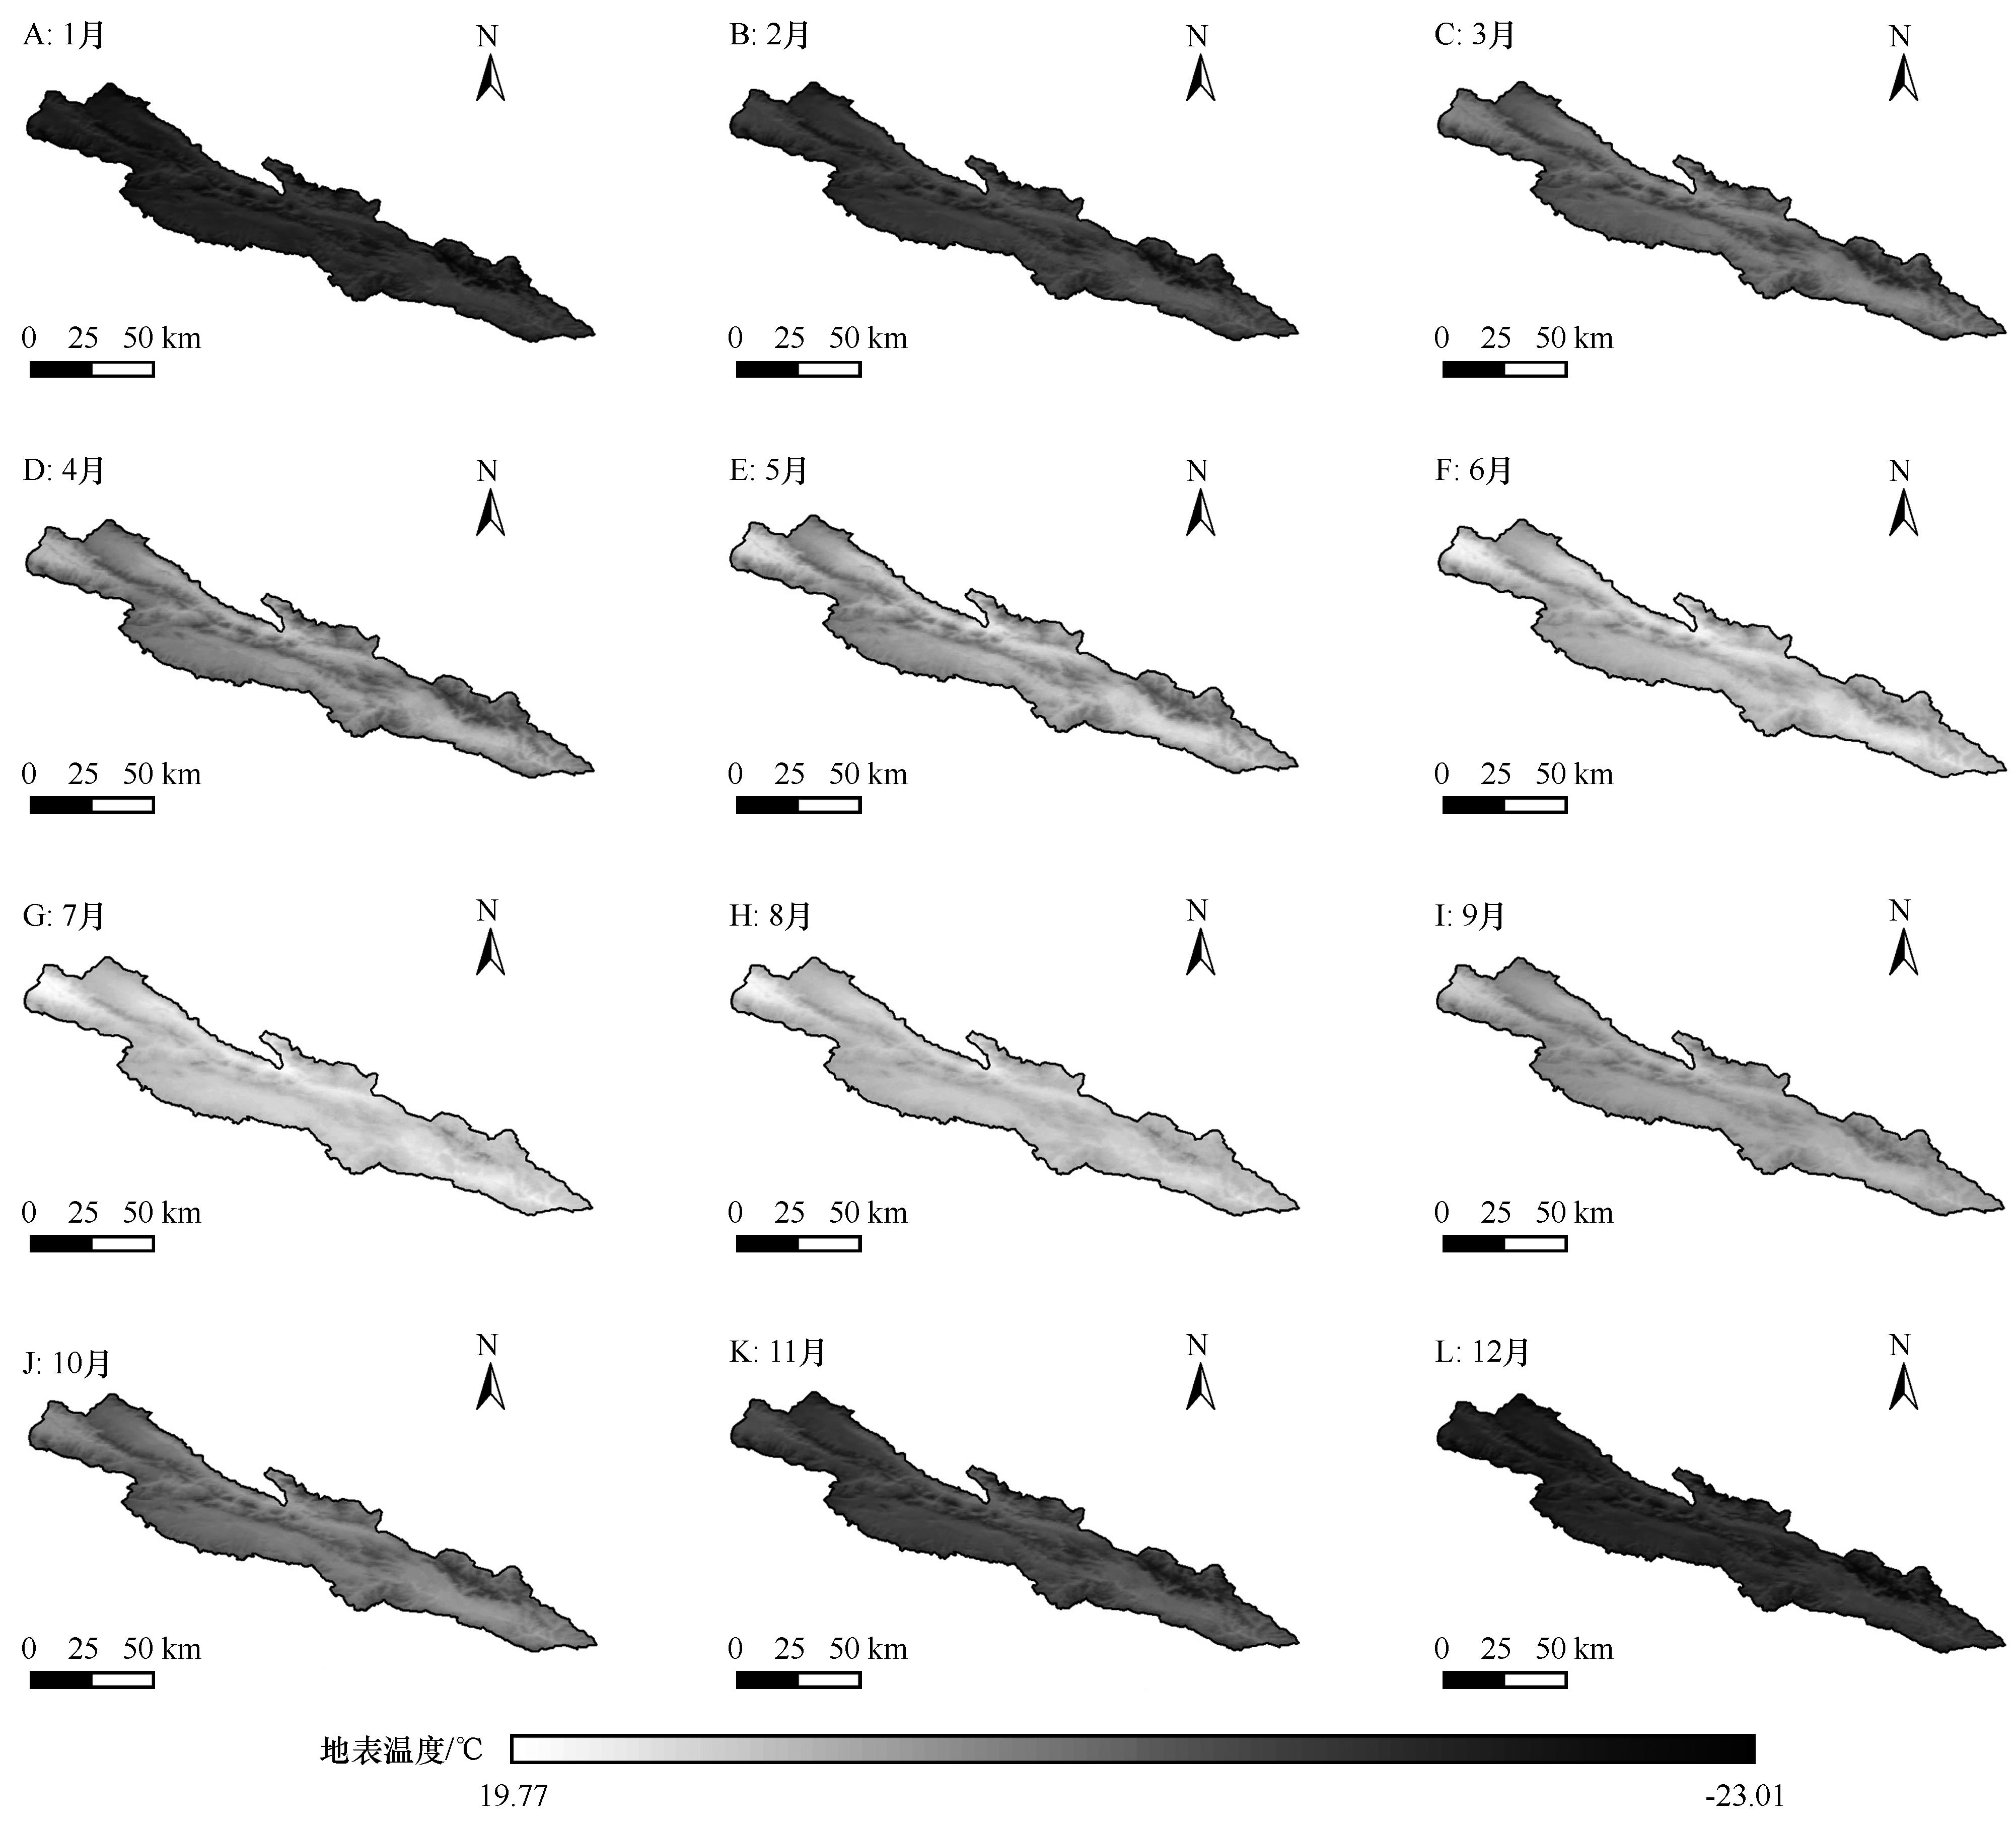
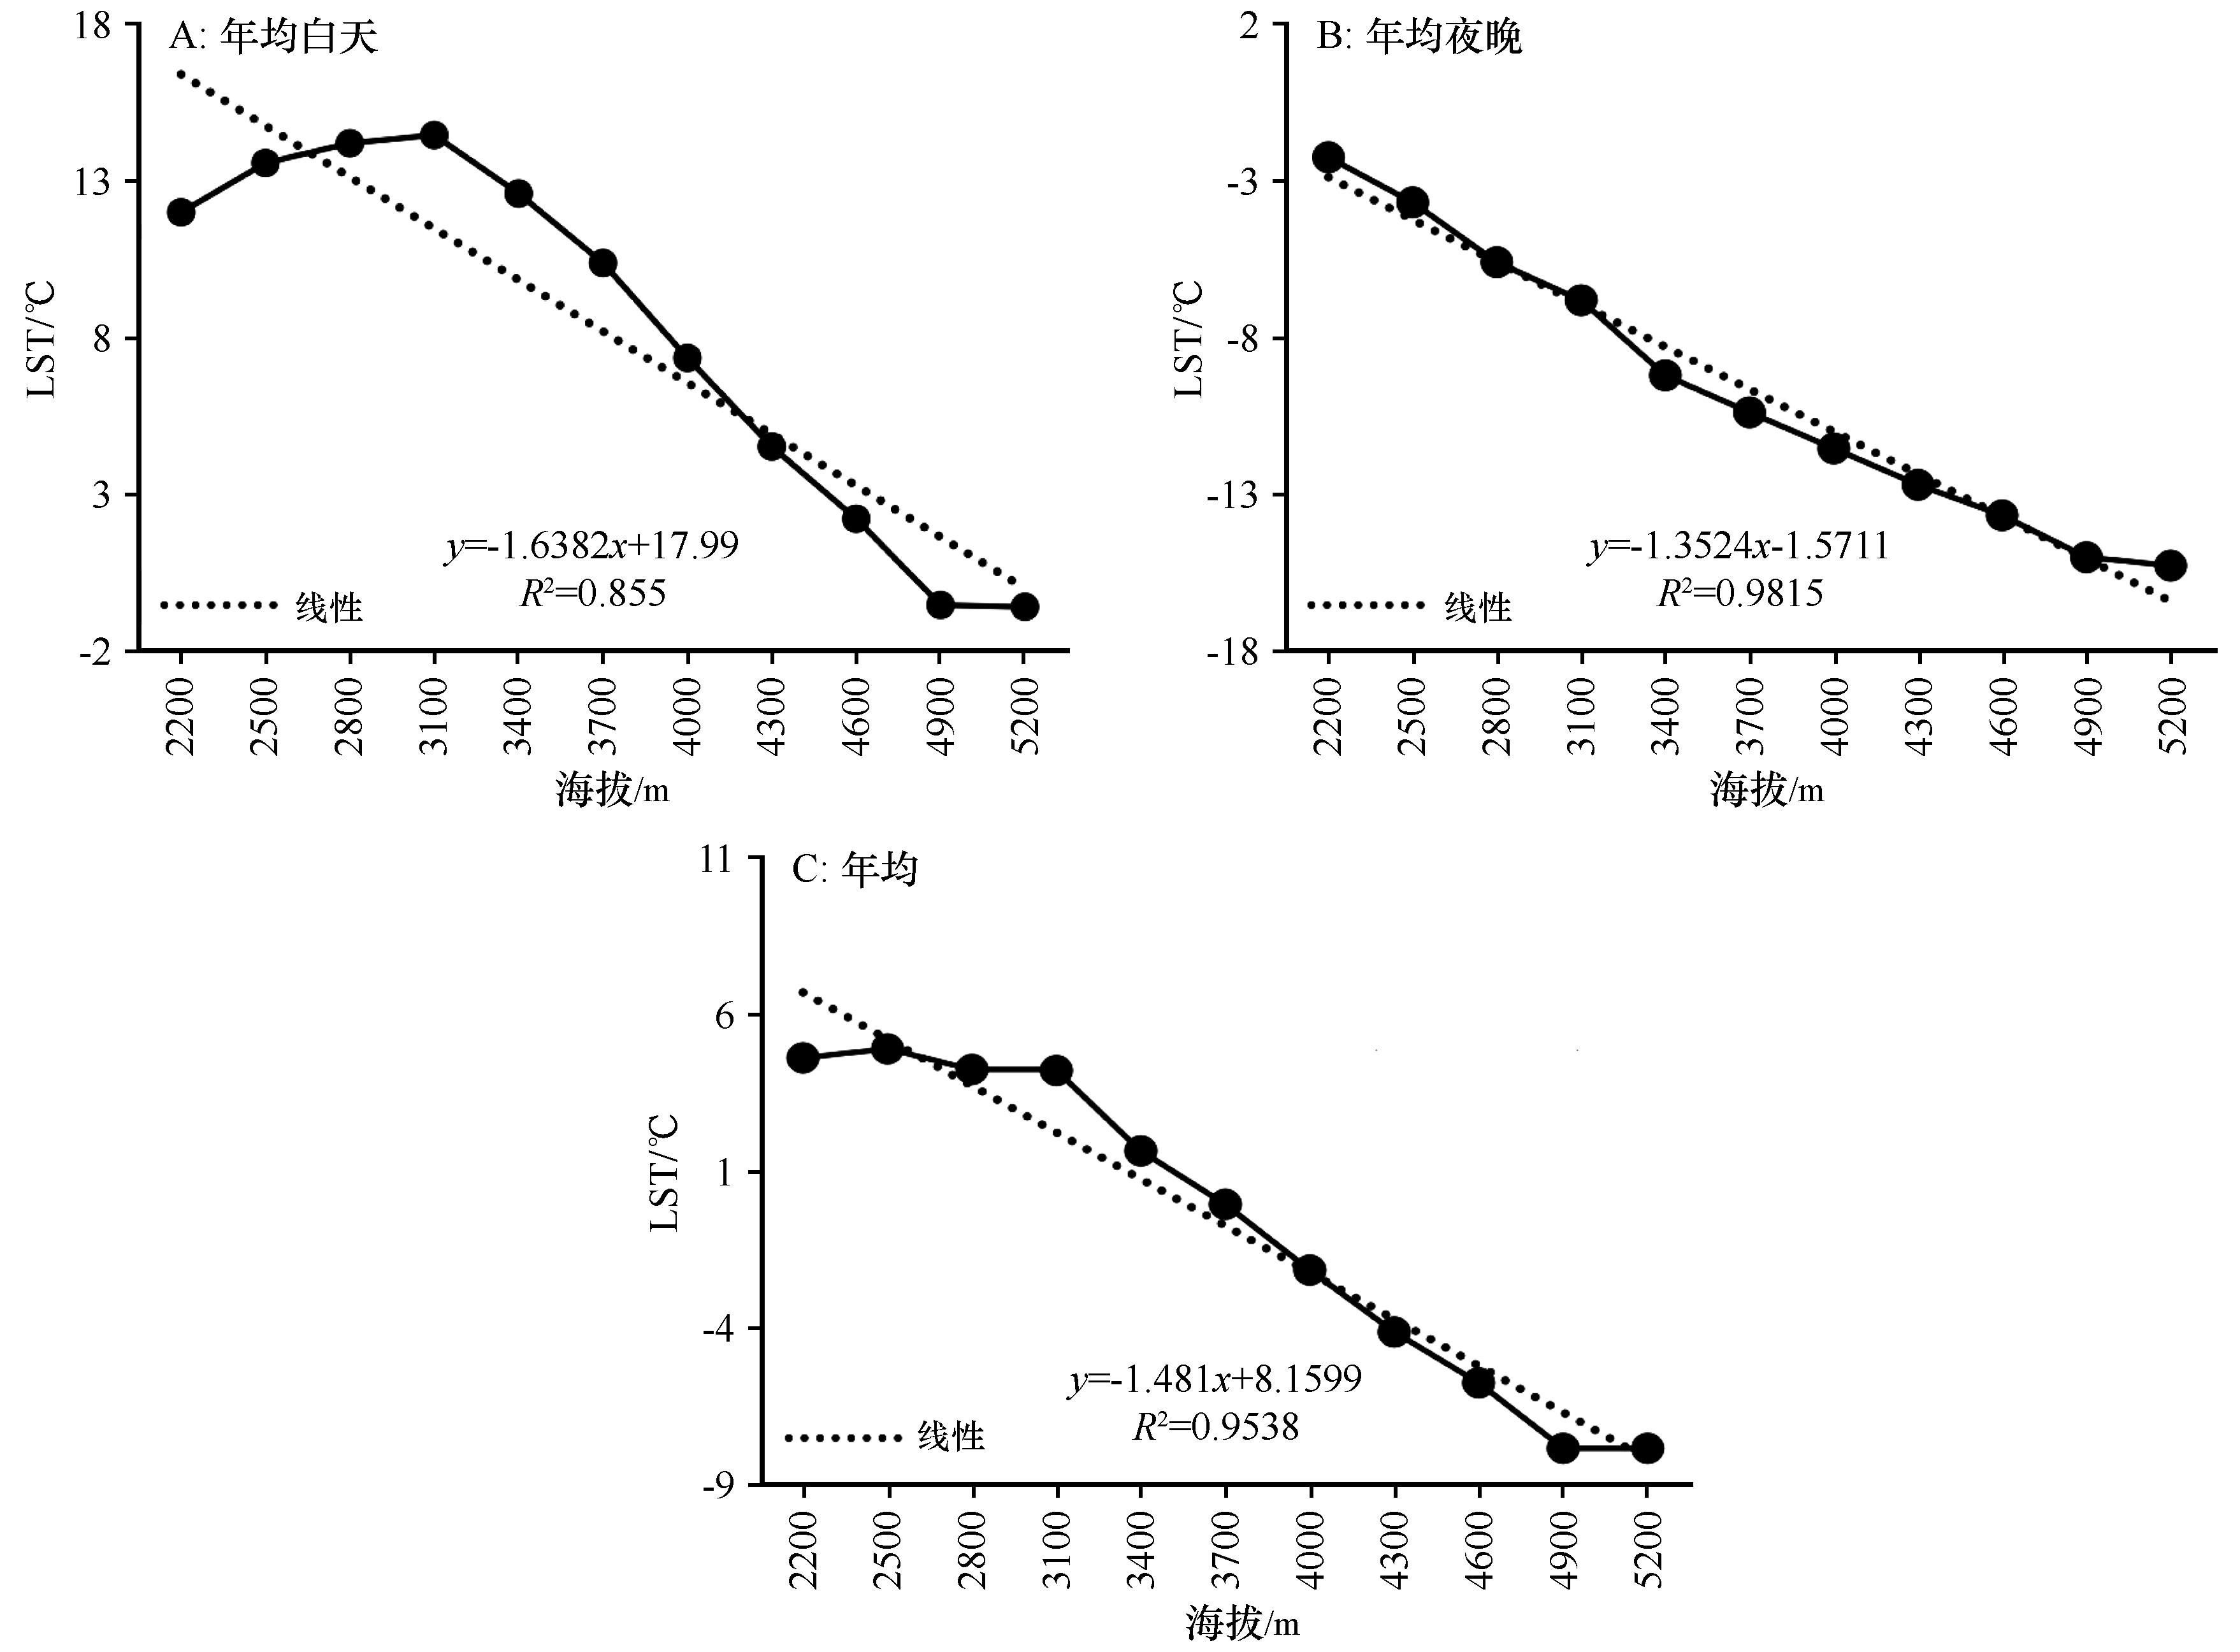
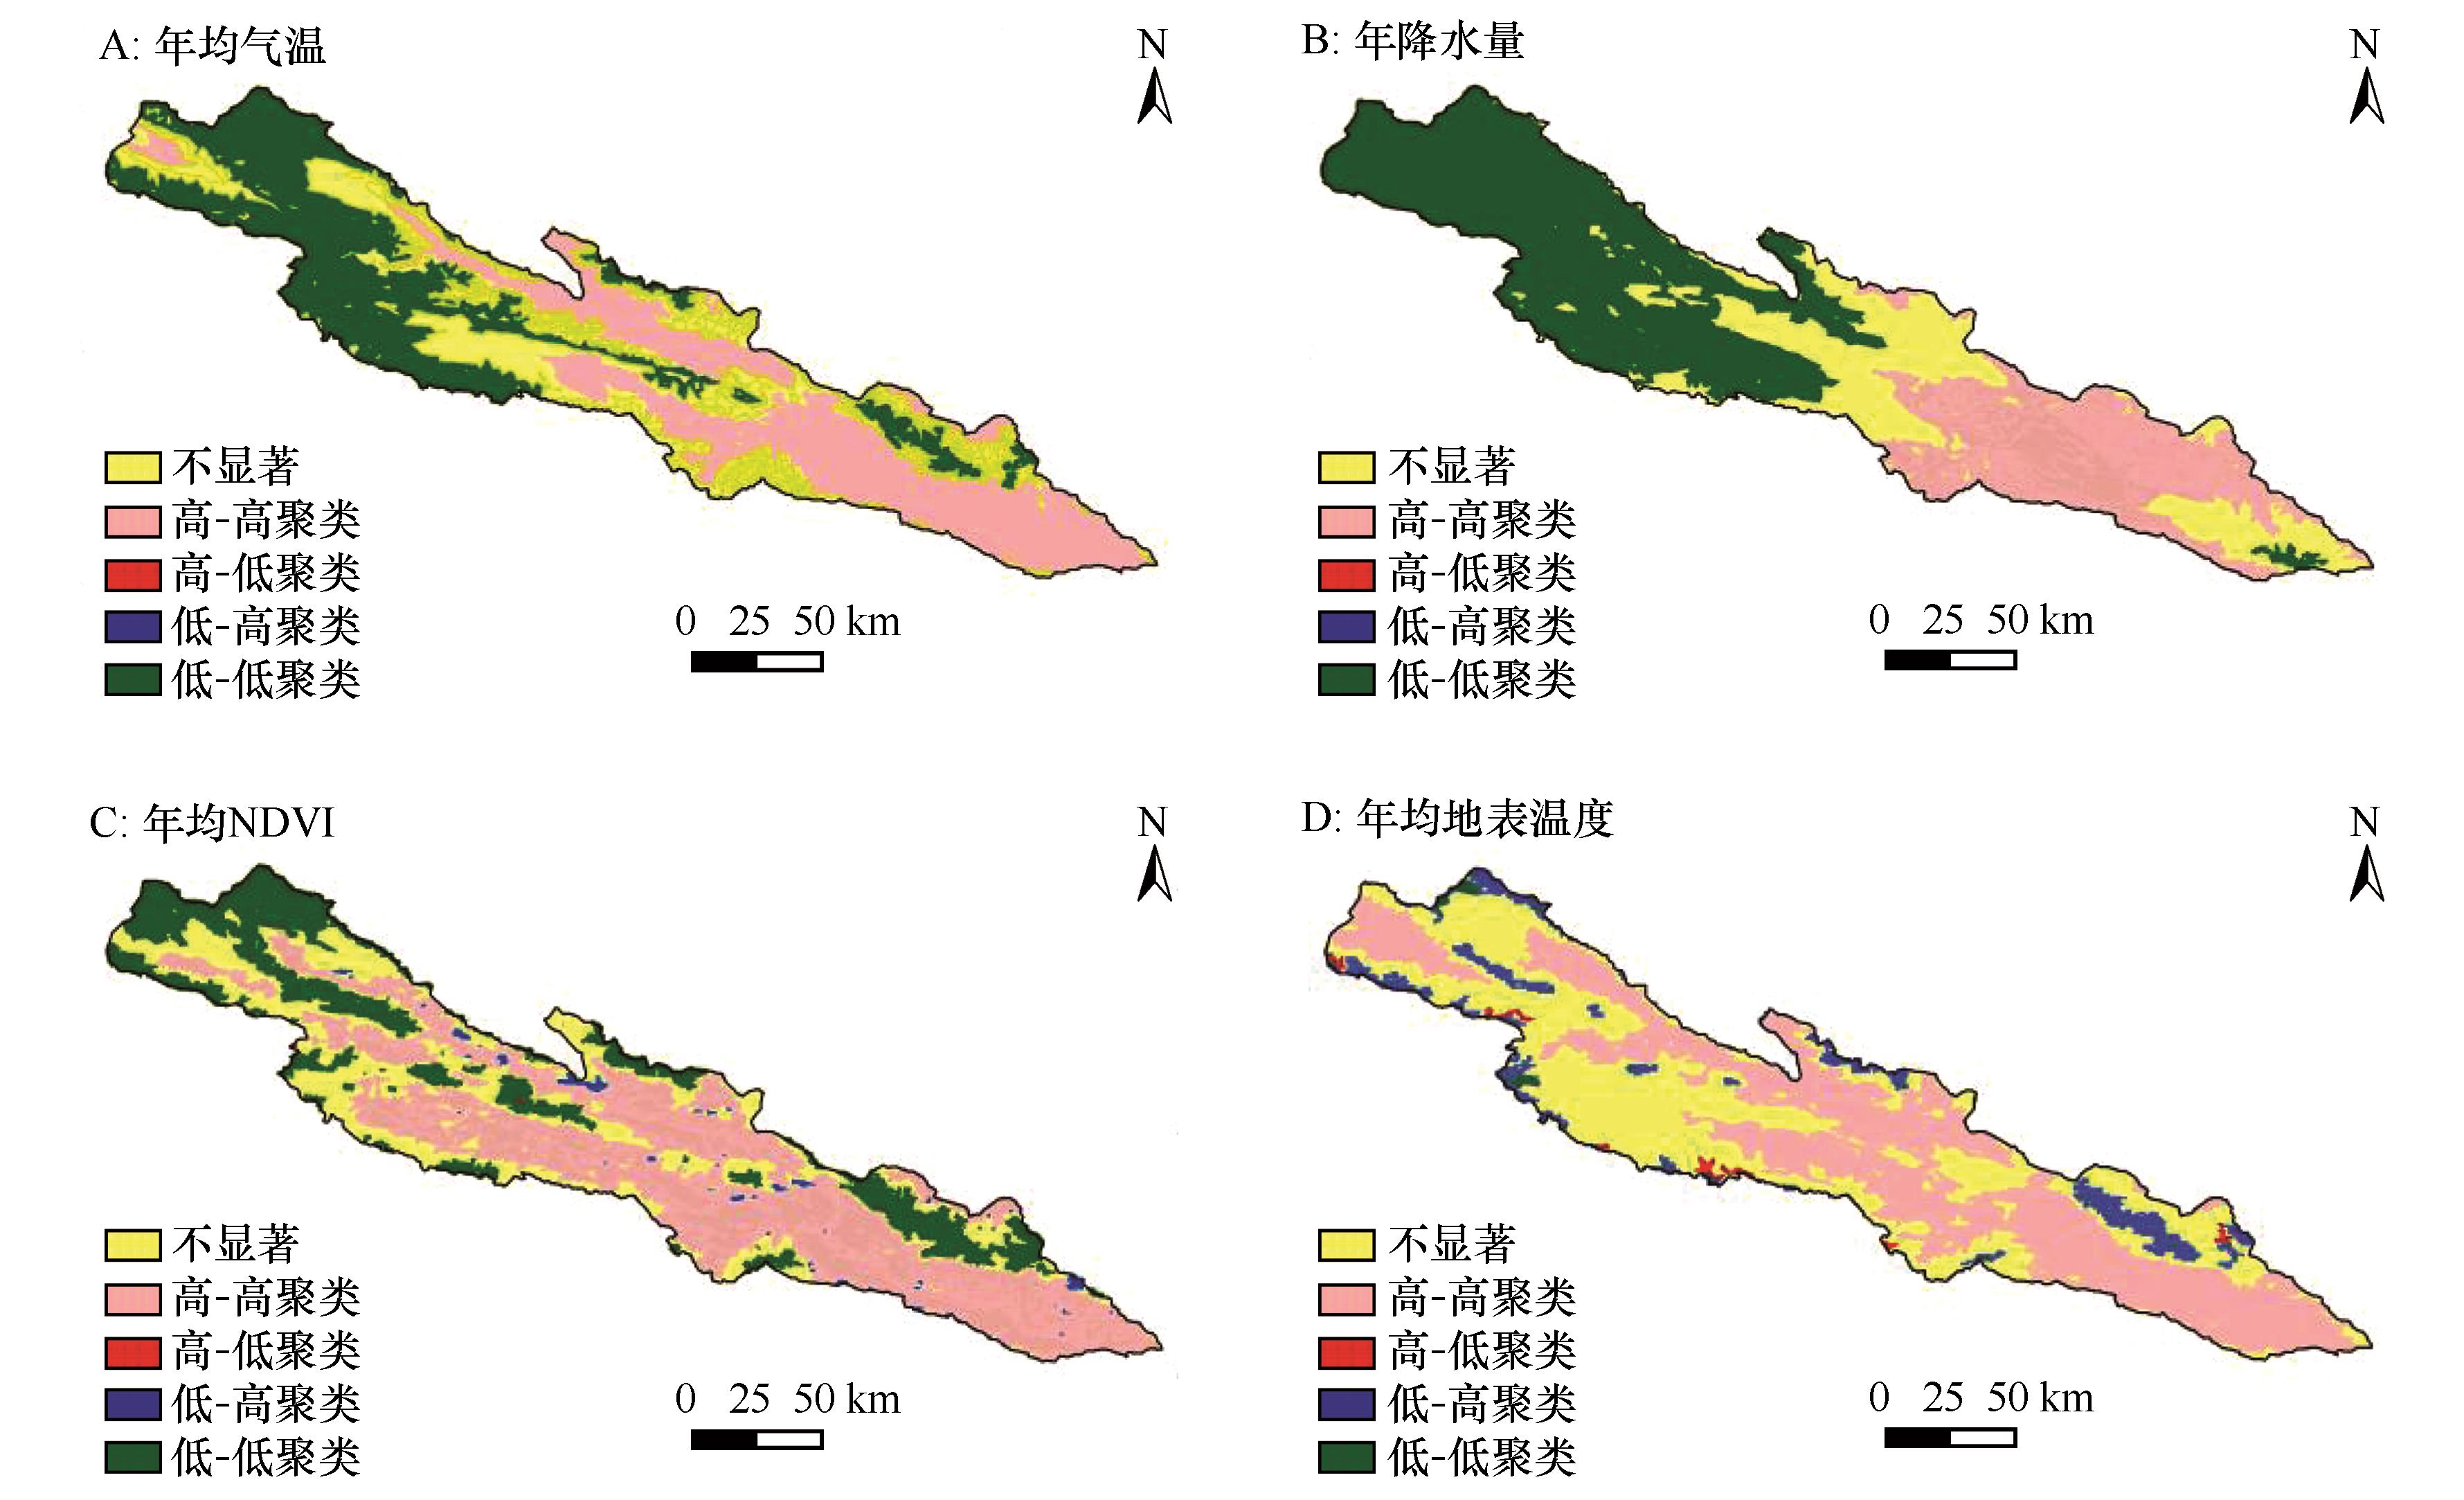
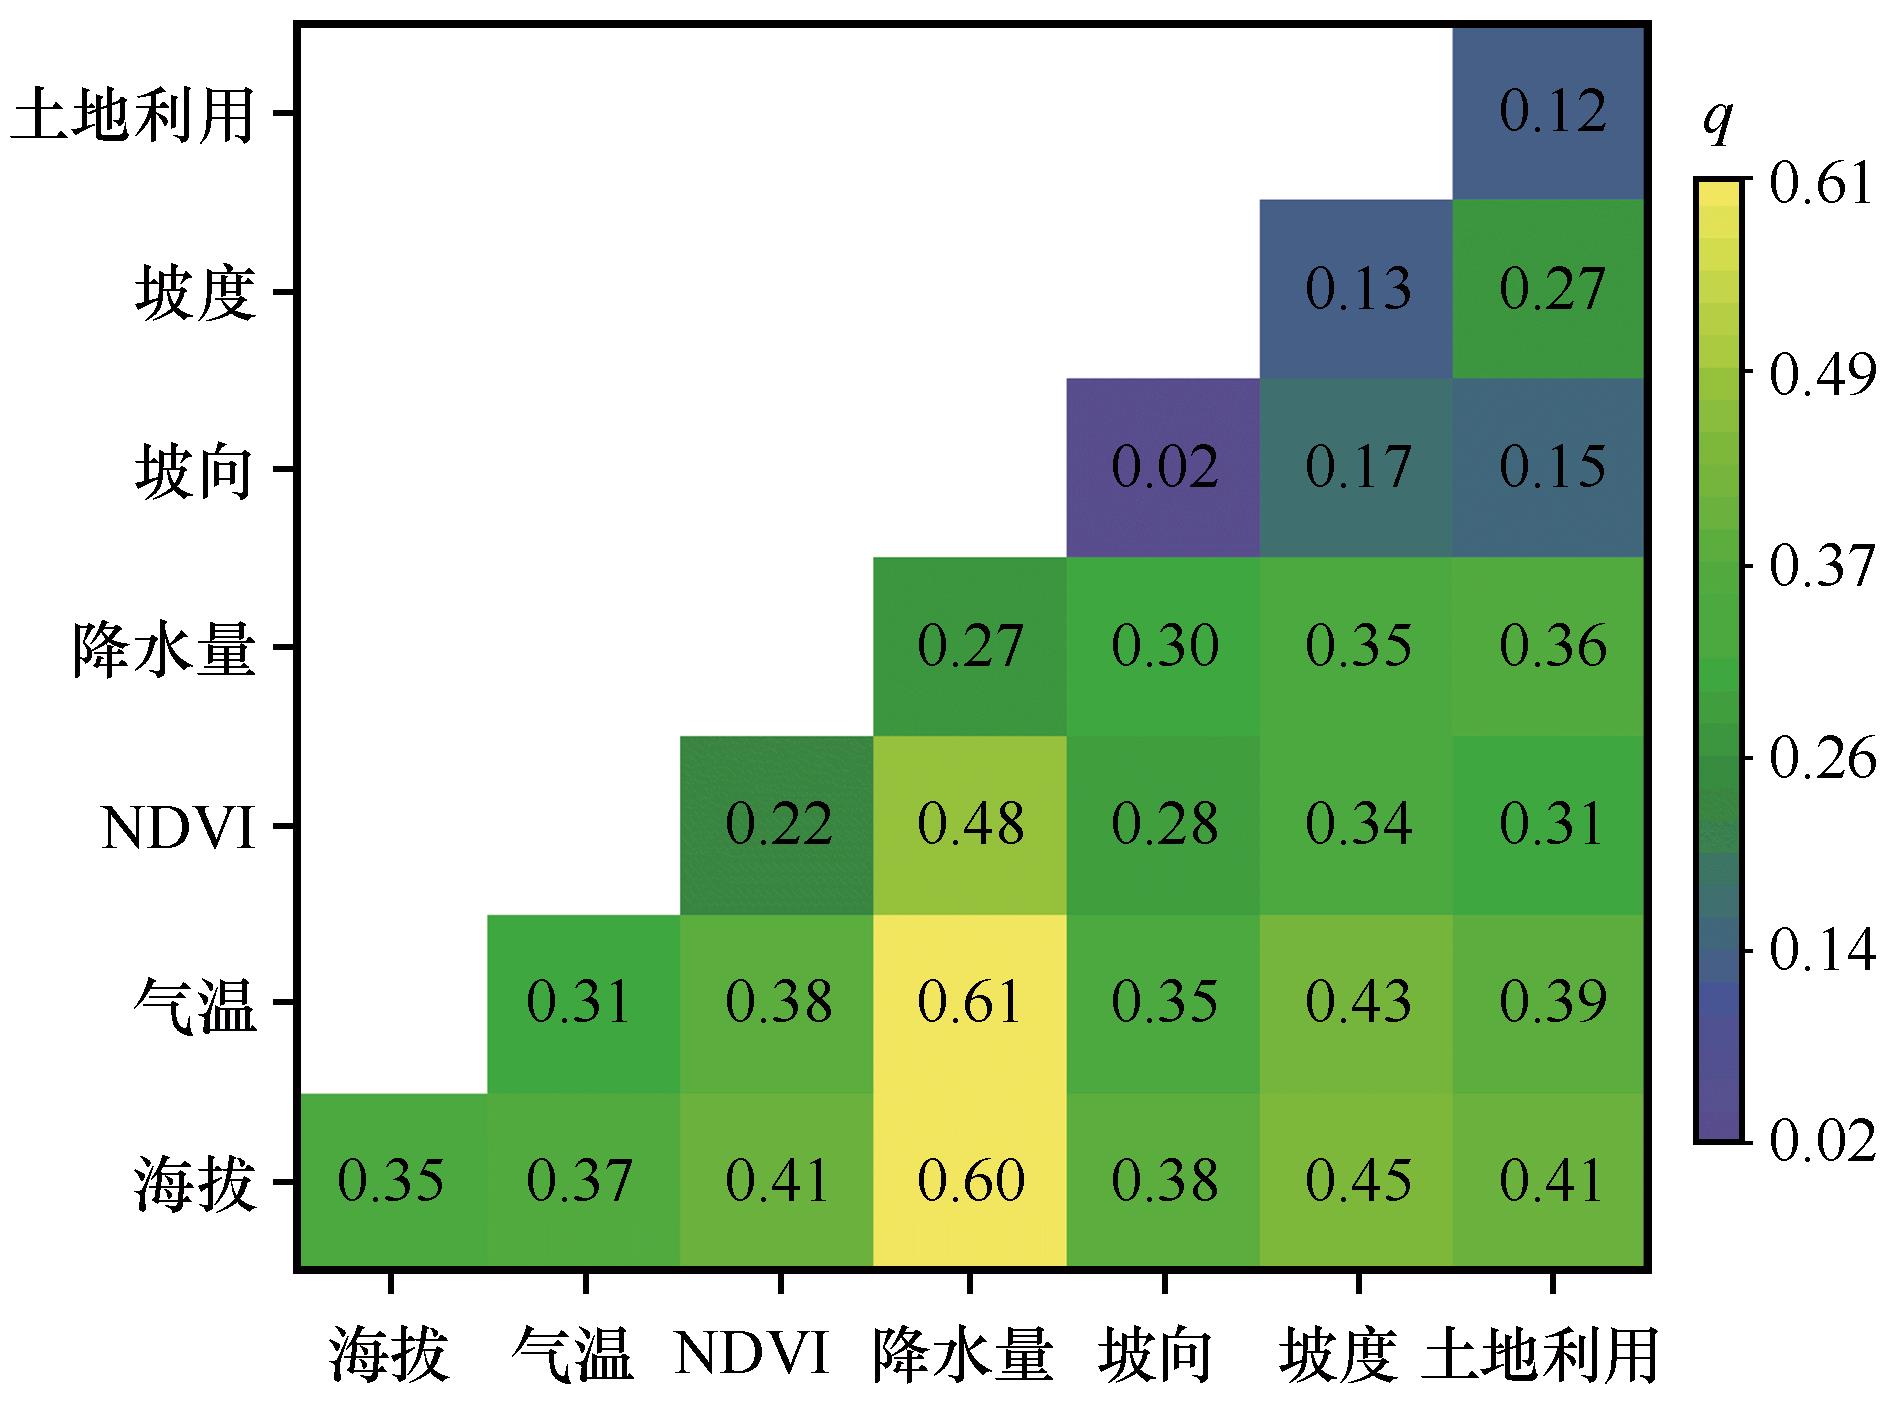
基于MOD11A2、数字高程模型(DEM)、土地利用类型、气象(降水量、气温)及归一化植被指数等数据,利用趋势分析、线性回归、地理探测器等方法,对2001―2022年祁连山南坡地表温度(Land Surface Temperature,LST)进行分析,探讨了影响LST变化的驱动因素。结果表明:(1)在时间维度上,2001―2022年祁连山南坡LST总体呈上升趋势,且表现出明显的时段变化,生长季(5—9月)LST增温率高于非生长季。白天LST呈不显著下降趋势(-0.065 ℃/10a),夜间LST呈显著上升趋势(0.21 ℃/10a),而年均LST以0.072 ℃/10a的速率上升。月平均LST先增大后减小,并以7月为转折点呈对称分布。(2)在空间维度上,LST高值区主要分布在河谷区域。平均LST随海拔升高递减率为0.59 ℃/100 m。不同覆盖类型LST排序为:裸地<水域<草地<林地<建设用地<耕地。(3)在单一因子影响下,海拔是影响LST变化的主要因素,气温次之。在因子组合控制下,气温∩降水量解释力最大(q=0.61),表明气温与降水量耦合是该区LST的主要影响因素。

关键词: 地表温度, 时空变化, 影响因子, 祁连山南坡

Abstract:

Based on MOD11A2 data, DEM, land use type data, meteorological data (precipitation, air temperature and normalized difference vegetation index (NDVI) of Qilian Mountains from 2001 to 2022, land surface temperature (LST) were analyzed using trend analysis, linear regression and geographic probe model, and the driving factors of LST were discussed. The results show that: (1) In the time dimension, the LST on the southern slope of Qilian Mountains show upward trend from 2001 to 2022, and the LST warming rate in growing season (from May to September) is higher than that in non-growing season. The daytime LST showed an insignificant decline trend (-0.065 ℃/10a), the nighttime LST showed a significant increase trend (0.21 ℃/10a), while the annual LST increased at the rate of 0.072 ℃/10a. The monthly LST increased first and then decreased, and it was symmetrical with July as the turning point. (2) In the spatial dimension, the high LST regions are mainly distributed in the valley area. The decreasing rate of LST with elevation was 0.59 ℃/100 m. The order of LST from low to high was as follows: bare land < water < grassland < forest land < land of construction < cultivated land. (3) Under the influence of single factor, altitude is the main factor affecting the change of LST, and air temperature is the second. The coupling of air temperature and precipitation had the greatest explanatory power (q = 0.61).

Key words: land surface temperature, spatial and temporal variations, impact factors, southern slope of Qilian Mountains

中图分类号: