中国沙漠 ›› 2024, Vol. 44 ›› Issue (6): 195-206.DOI: 10.7522/j.issn.1000-694X.2024.00075
王悦1( ), 衣娜娜2(), 姜学恭3, 宁贵财1, 苏练1, 夏海云1()
收稿日期:2024-04-26
修回日期:2024-08-28
出版日期:2024-11-20
发布日期:2024-12-06
通讯作者:
衣娜娜,夏海云
作者简介:夏海云(E-mail: 003333@nuist.edu.cn)基金资助:
Yue Wang1(), Nana Yi2(), Xuegong Jiang3, Guicai Ning1, Lian Su1, Haiyun Xia1()
Received:2024-04-26
Revised:2024-08-28
Online:2024-11-20
Published:2024-12-06
Contact:
Nana Yi,Haiyun Xia
摘要:
利用激光雷达垂直观测、大气污染和气象常规观测、卫星观测及再分析等多源数据,结合后向轨迹模拟和天气学诊断等方法分析了2023年3月21─23日发生在中国北方地区的一次强沙尘过程结构特征并探究了其演变机制。结果表明:此次事件在蒙古气旋的影响下自西北向东南地区扩散,途经巴彦淖尔市—呼和浩特市—张家口市,最终抵达北京市。期间,北京市PM10浓度峰值1 667 μg?m-3,显著小于其邻近上风向张家口市的峰值浓度(9 993 μg?m-3)。沙尘越过张家口后受燕山阻挡,浓度显著衰减,后向轨迹结果表明,受气旋前部西南气流作用,部分沙尘离开张家口后沿东北路径传输至东北。沙尘事件垂直结构表明,北京上空沙尘传输高度可达6 000 m,且对流层垂直运动呈三明治结构,即近地面~920 hPa下沉、920~700 hPa上升、650~450 hPa下沉。上述三明治结构不利于沙尘在北京地区沉降,是北京沙尘浓度偏低的关键原因。沙尘事件时间演变特征表明,北京雷达数据反演后向散射系数快速升高后缓慢降低,同时PM2.5/PM10比值从0.73降至0.18。
中图分类号:
王悦, 衣娜娜, 姜学恭, 宁贵财, 苏练, 夏海云. 基于多源观测数据的强沙尘天气过程诊断[J]. 中国沙漠, 2024, 44(6): 195-206.
Yue Wang, Nana Yi, Xuegong Jiang, Guicai Ning, Lian Su, Haiyun Xia. Diagnosis of severe dust weather process based on multi-source observational data[J]. Journal of Desert Research, 2024, 44(6): 195-206.
| 参数 | 值 |
|---|---|
| 波长 | 1.5 μm |
| 脉冲能量 | 150 μJ |
| 望远镜口径 | 70 mm |
| 脉冲重复频率 | 10 kHz |
| 时间分辨率 | 1 s |
| 空间分辨率 | 30 m |
| 最大探测距离 | 15 km |
| 方位角 | 0°~360° |
| 俯仰角 | 0°~90° |
表1 相干多普勒测风激光雷达参数
Table 1 Key parameters of the CDWL
| 参数 | 值 |
|---|---|
| 波长 | 1.5 μm |
| 脉冲能量 | 150 μJ |
| 望远镜口径 | 70 mm |
| 脉冲重复频率 | 10 kHz |
| 时间分辨率 | 1 s |
| 空间分辨率 | 30 m |
| 最大探测距离 | 15 km |
| 方位角 | 0°~360° |
| 俯仰角 | 0°~90° |
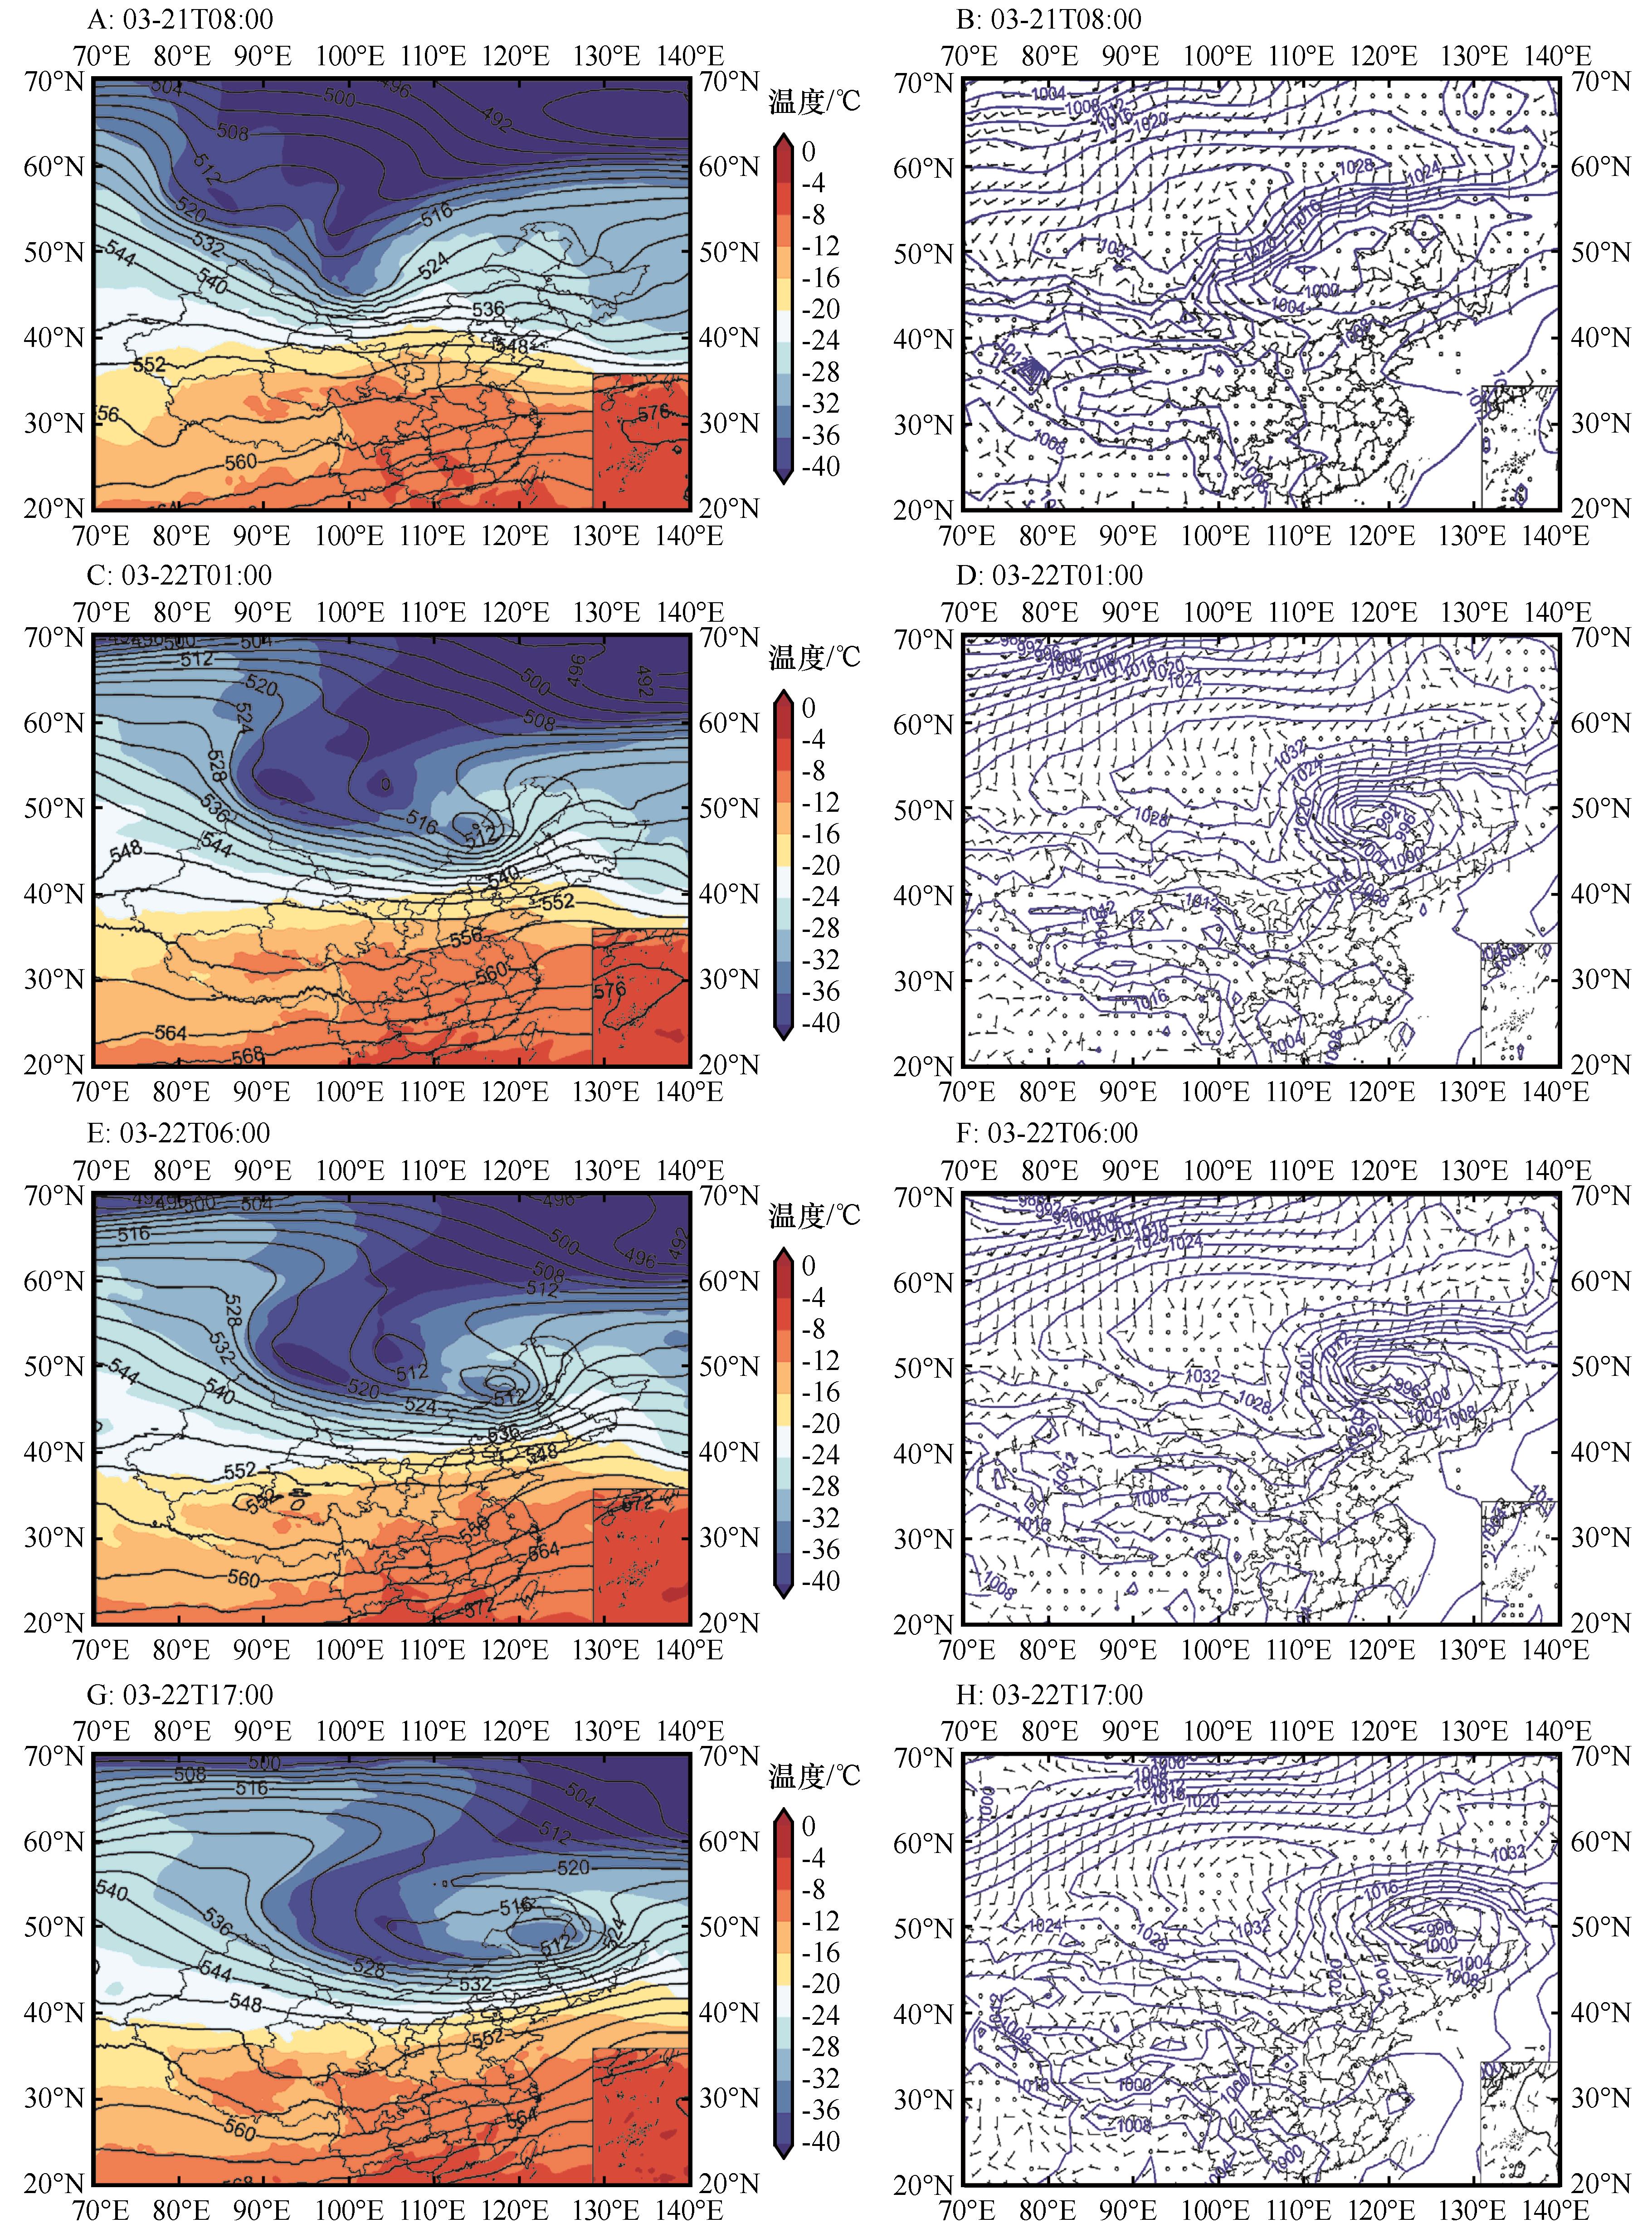
图1 2023年3月21日08:00(A,B)、3月22日01:00(C,D)、3月22日06:00(E,F)、3月22日17:00(G,H)500 hPa温度(阴影;单位:℃;A,C,E,G)、500 hPa位势高度(等值线;单位:gpm;A,C,E,G)和海平面气压场(等值线;B,D,F,H)、地面10 m阵风(风羽,单位:m·s-1;B,D,F,H)
Fig.1 500 hPa temperature (shading; units: ℃;A,C,E,G), 500 hPa geopotential height (contours; units: gpm;A,C,E,G), sea level pressure (contours;B,D,F,H), 10 m gust wind plume (B,D,F,H;unit:m·s-1) at 08:00 BJT on 21(A,B), 01:00 BJT on 22(C,D), 06:00 BJT on 22 (E,F) and 17:00 BJT on 22(G,H), March 2023
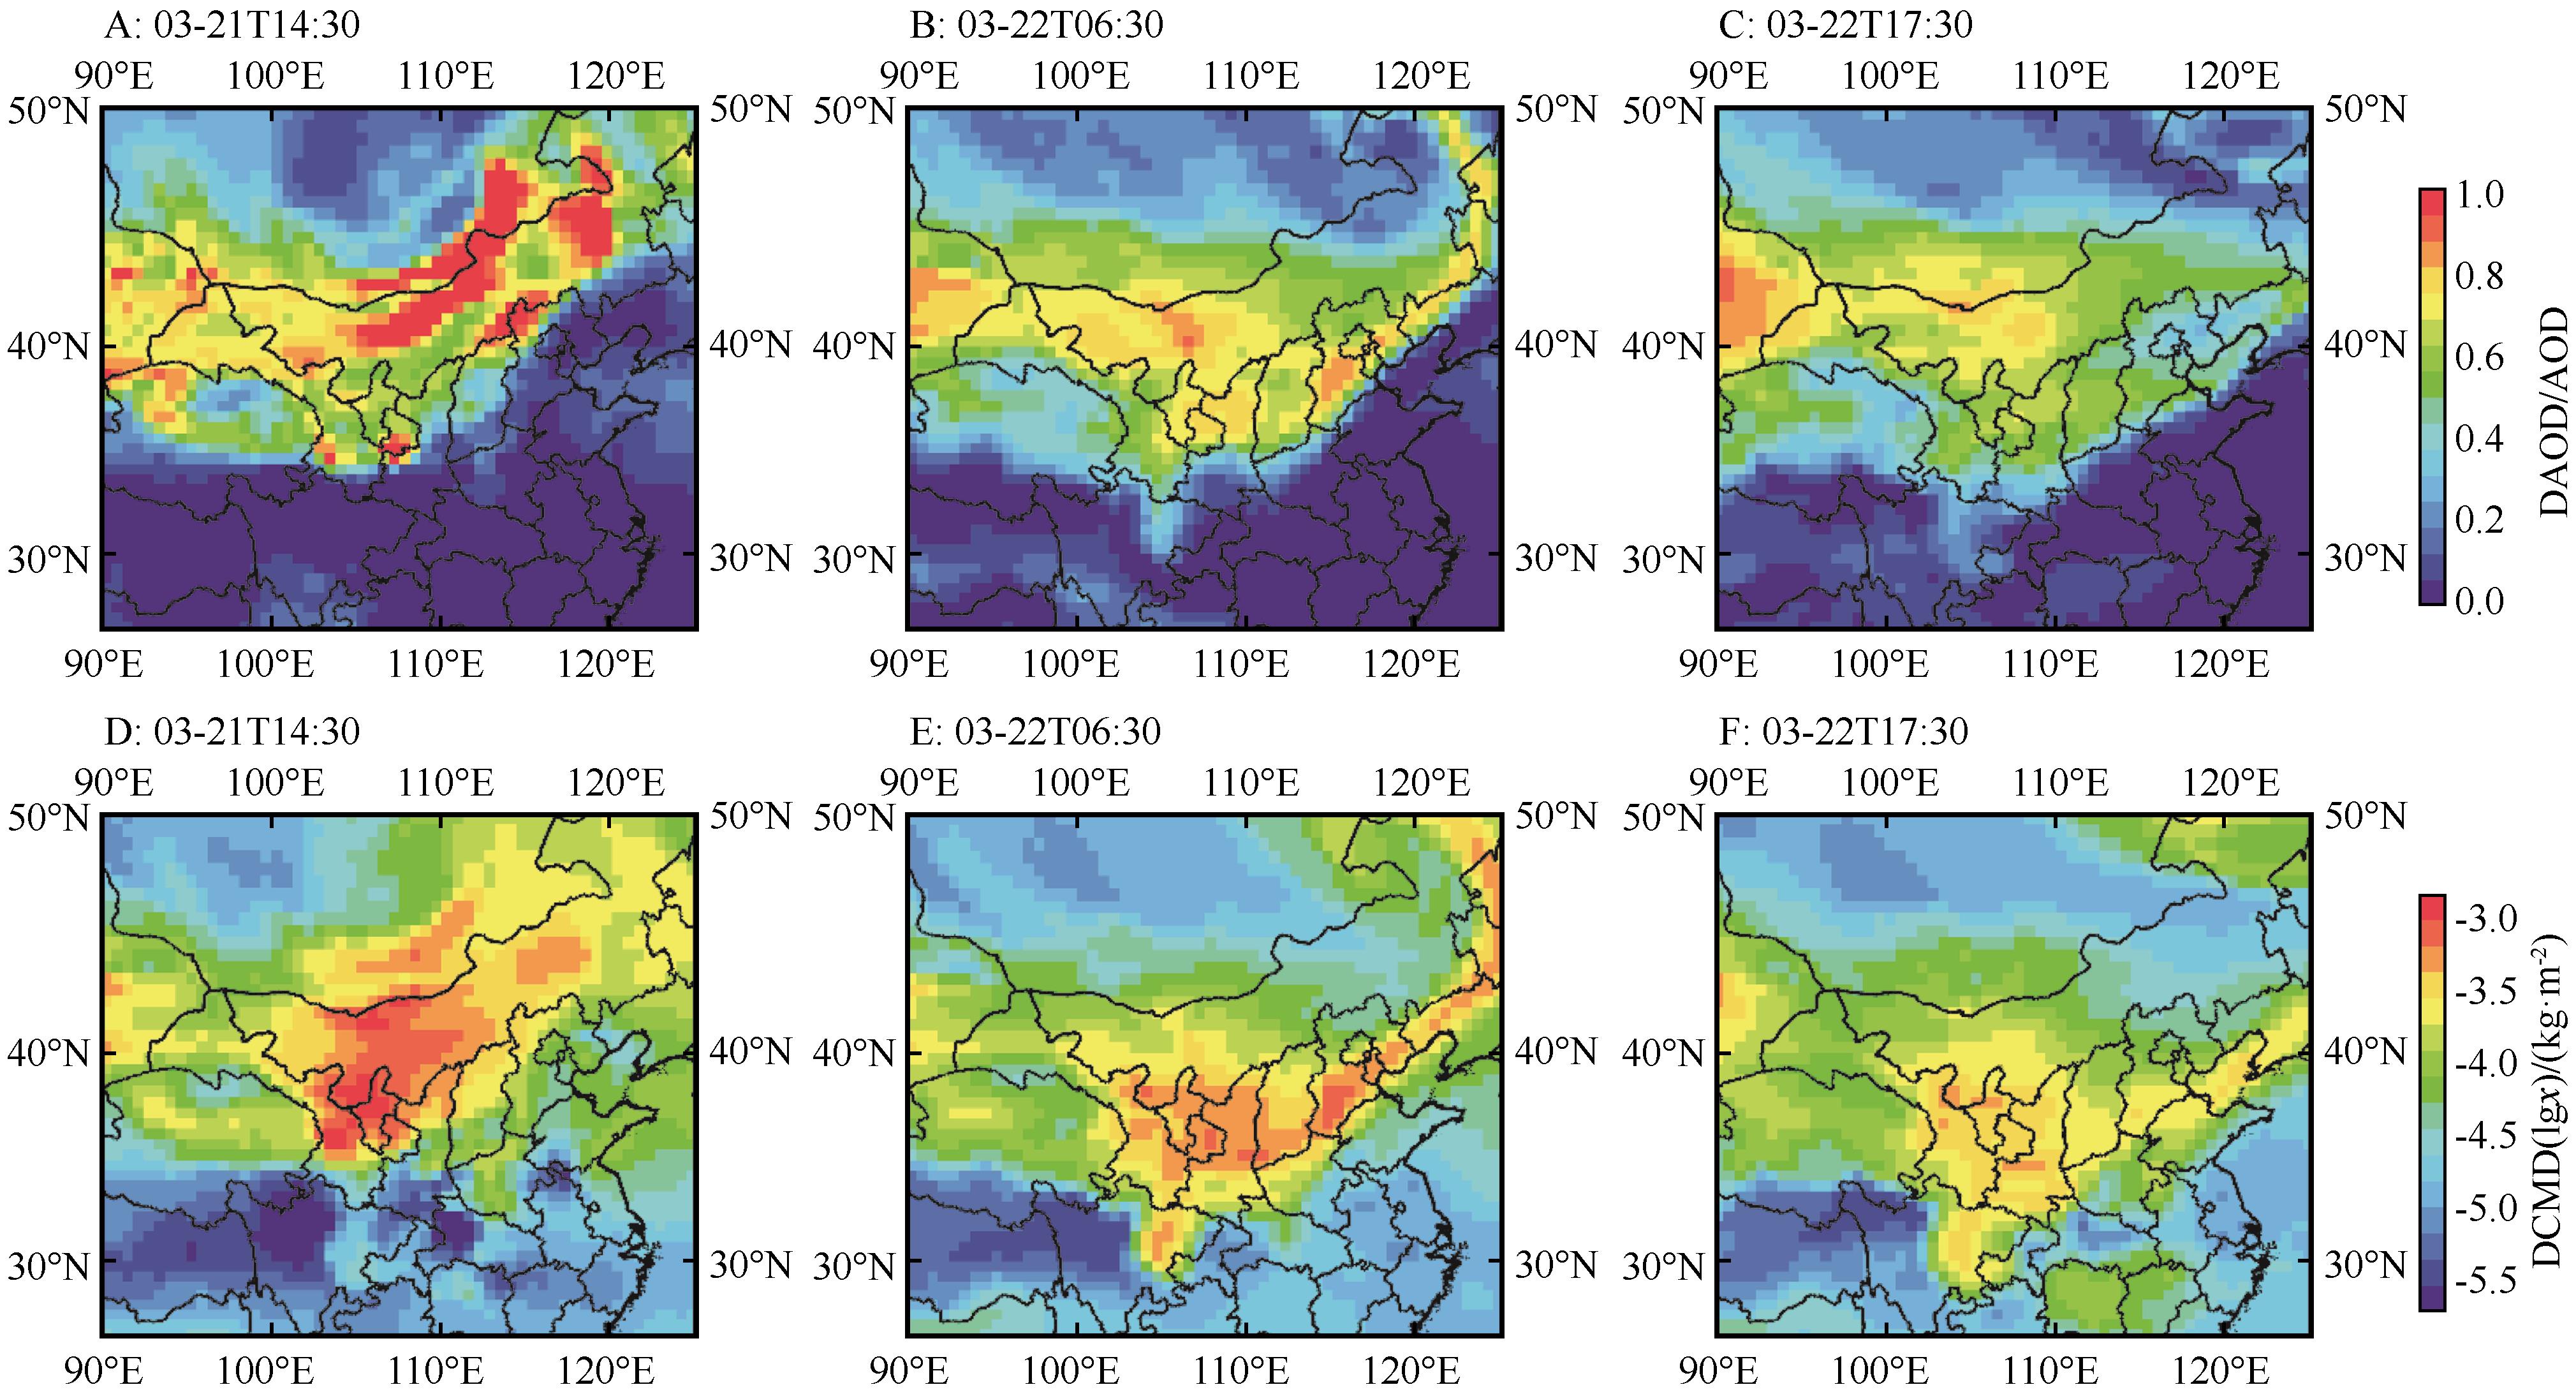
图2 2023年3月21日14:30(A,D),22日06:30(B,E),22日17:30的(C,F)沙尘天气DAOD/AOD时空分布和DCMD时空分布
Fig.2 Spatial distribution of the typical dust storm occurred for multi-source datasets (DAOD/AOD, DCMD) at (A, D) 14:30 BJT on 21 March, (B, E) 06:30 BJT and (C, F) 17:30 BJT on 22, March 2023

图3 2023年3月21日15:00(A),22日06:00(B),22日18:00(C)的PM10浓度时空分布
Fig.3 Spatial distribution of the typical dust storm occurred for PM10 concentration at (A) 15:00 BJT on 21 March, (B) 06:00 BJT and (C) 18:00 BJT on 22, March 2023
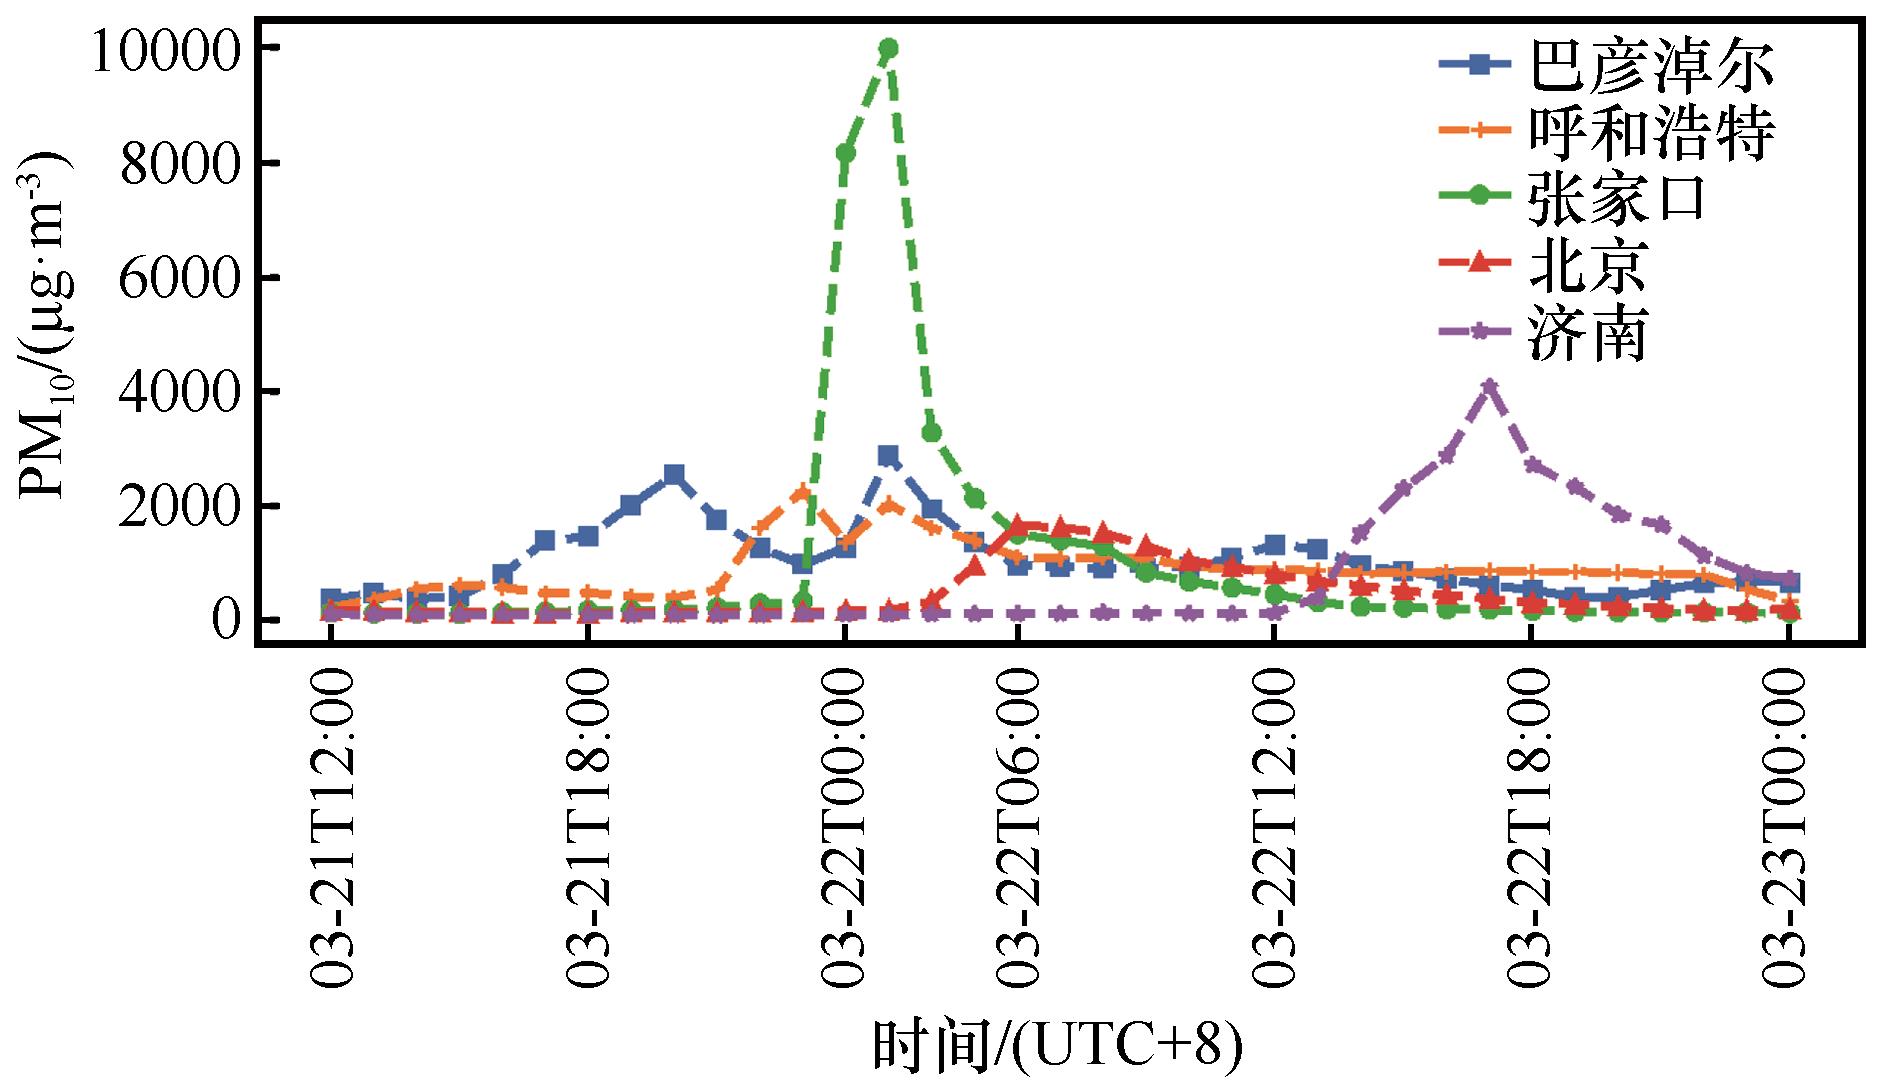
图4 2023年3月21日12:00—2023年3月23日00:00沙尘途经城市PM10浓度逐小时变化(3月22日02:00和05:00的值缺测)
Fig.4 Hourly variation characteristics of PM10 concentration during sand and dust pollution weather events in cities along the route of dust pollution weather event from 12:00 BJT 21 to 00:00 BJT 23, March 2023 (Missing values at 02:00 and 05:00 on March 22)
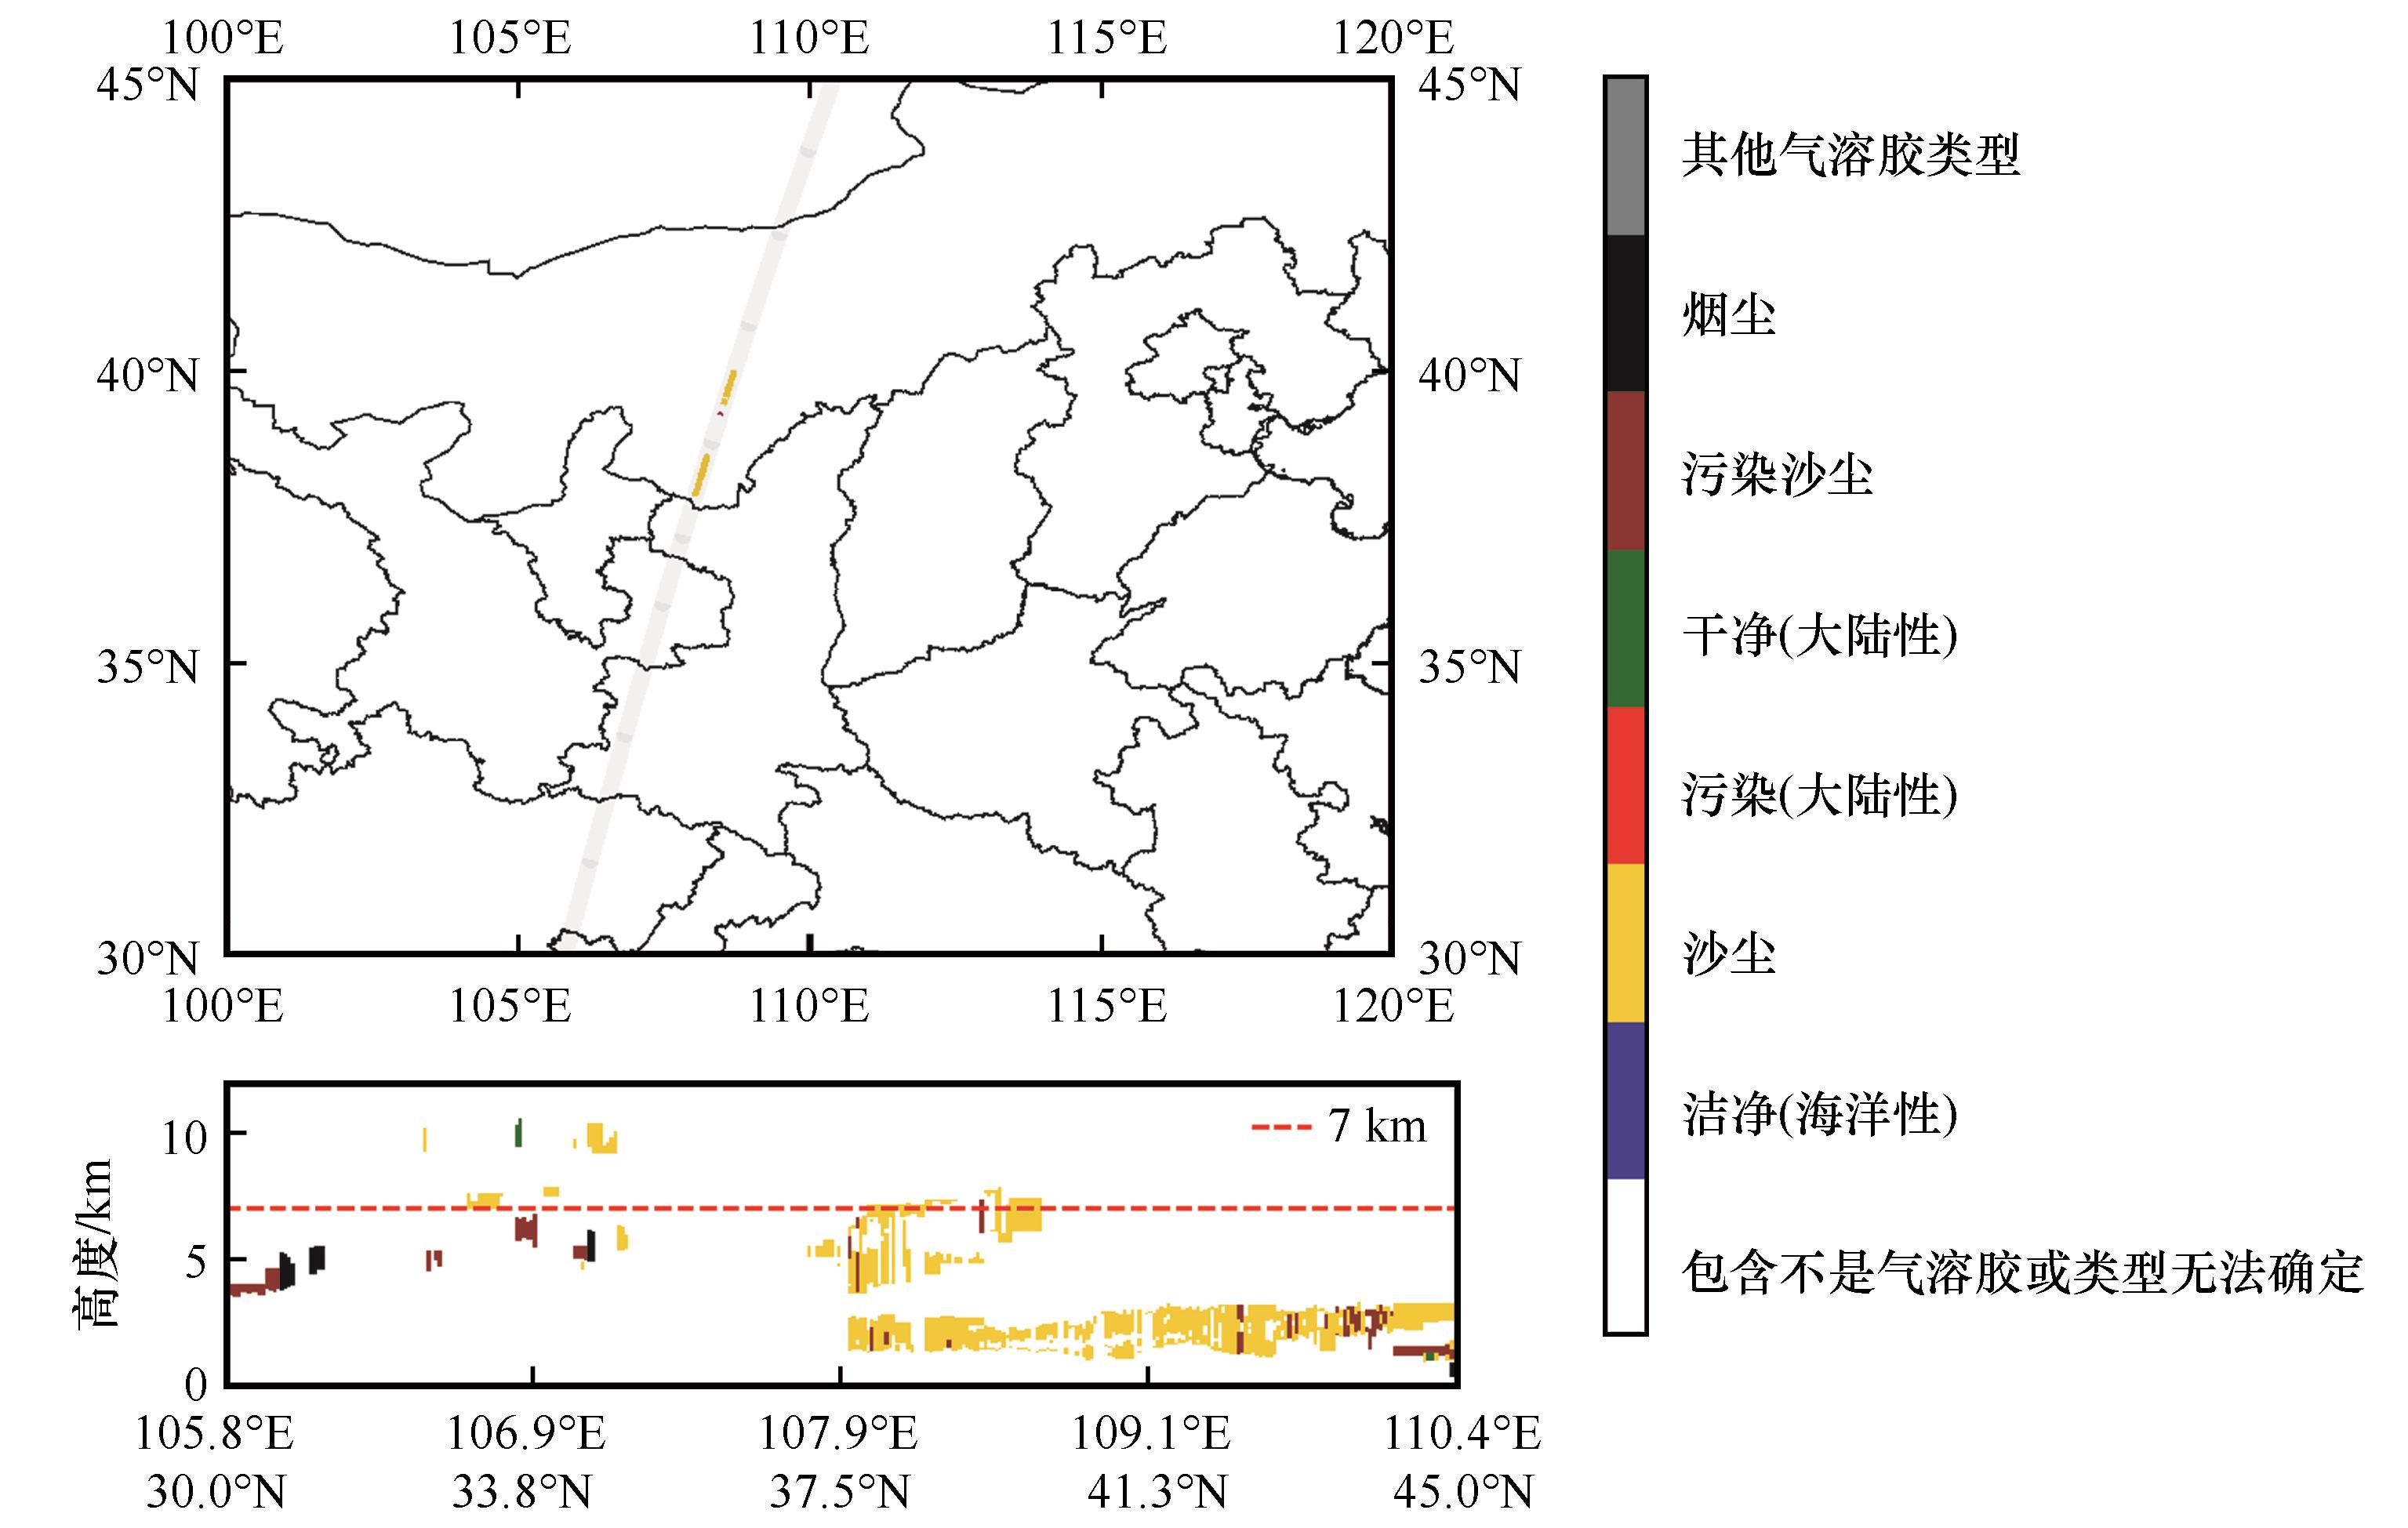
图5 CALIPSO卫星在2023年3月22日04:32观测的气溶胶类型(卫星运行轨迹:灰色阴影)
Fig.5 The type of aerosol observed by CALIPSO satellite at 04:32 BJT on 22, March 2023 (Satellite trajectory: grey shading)
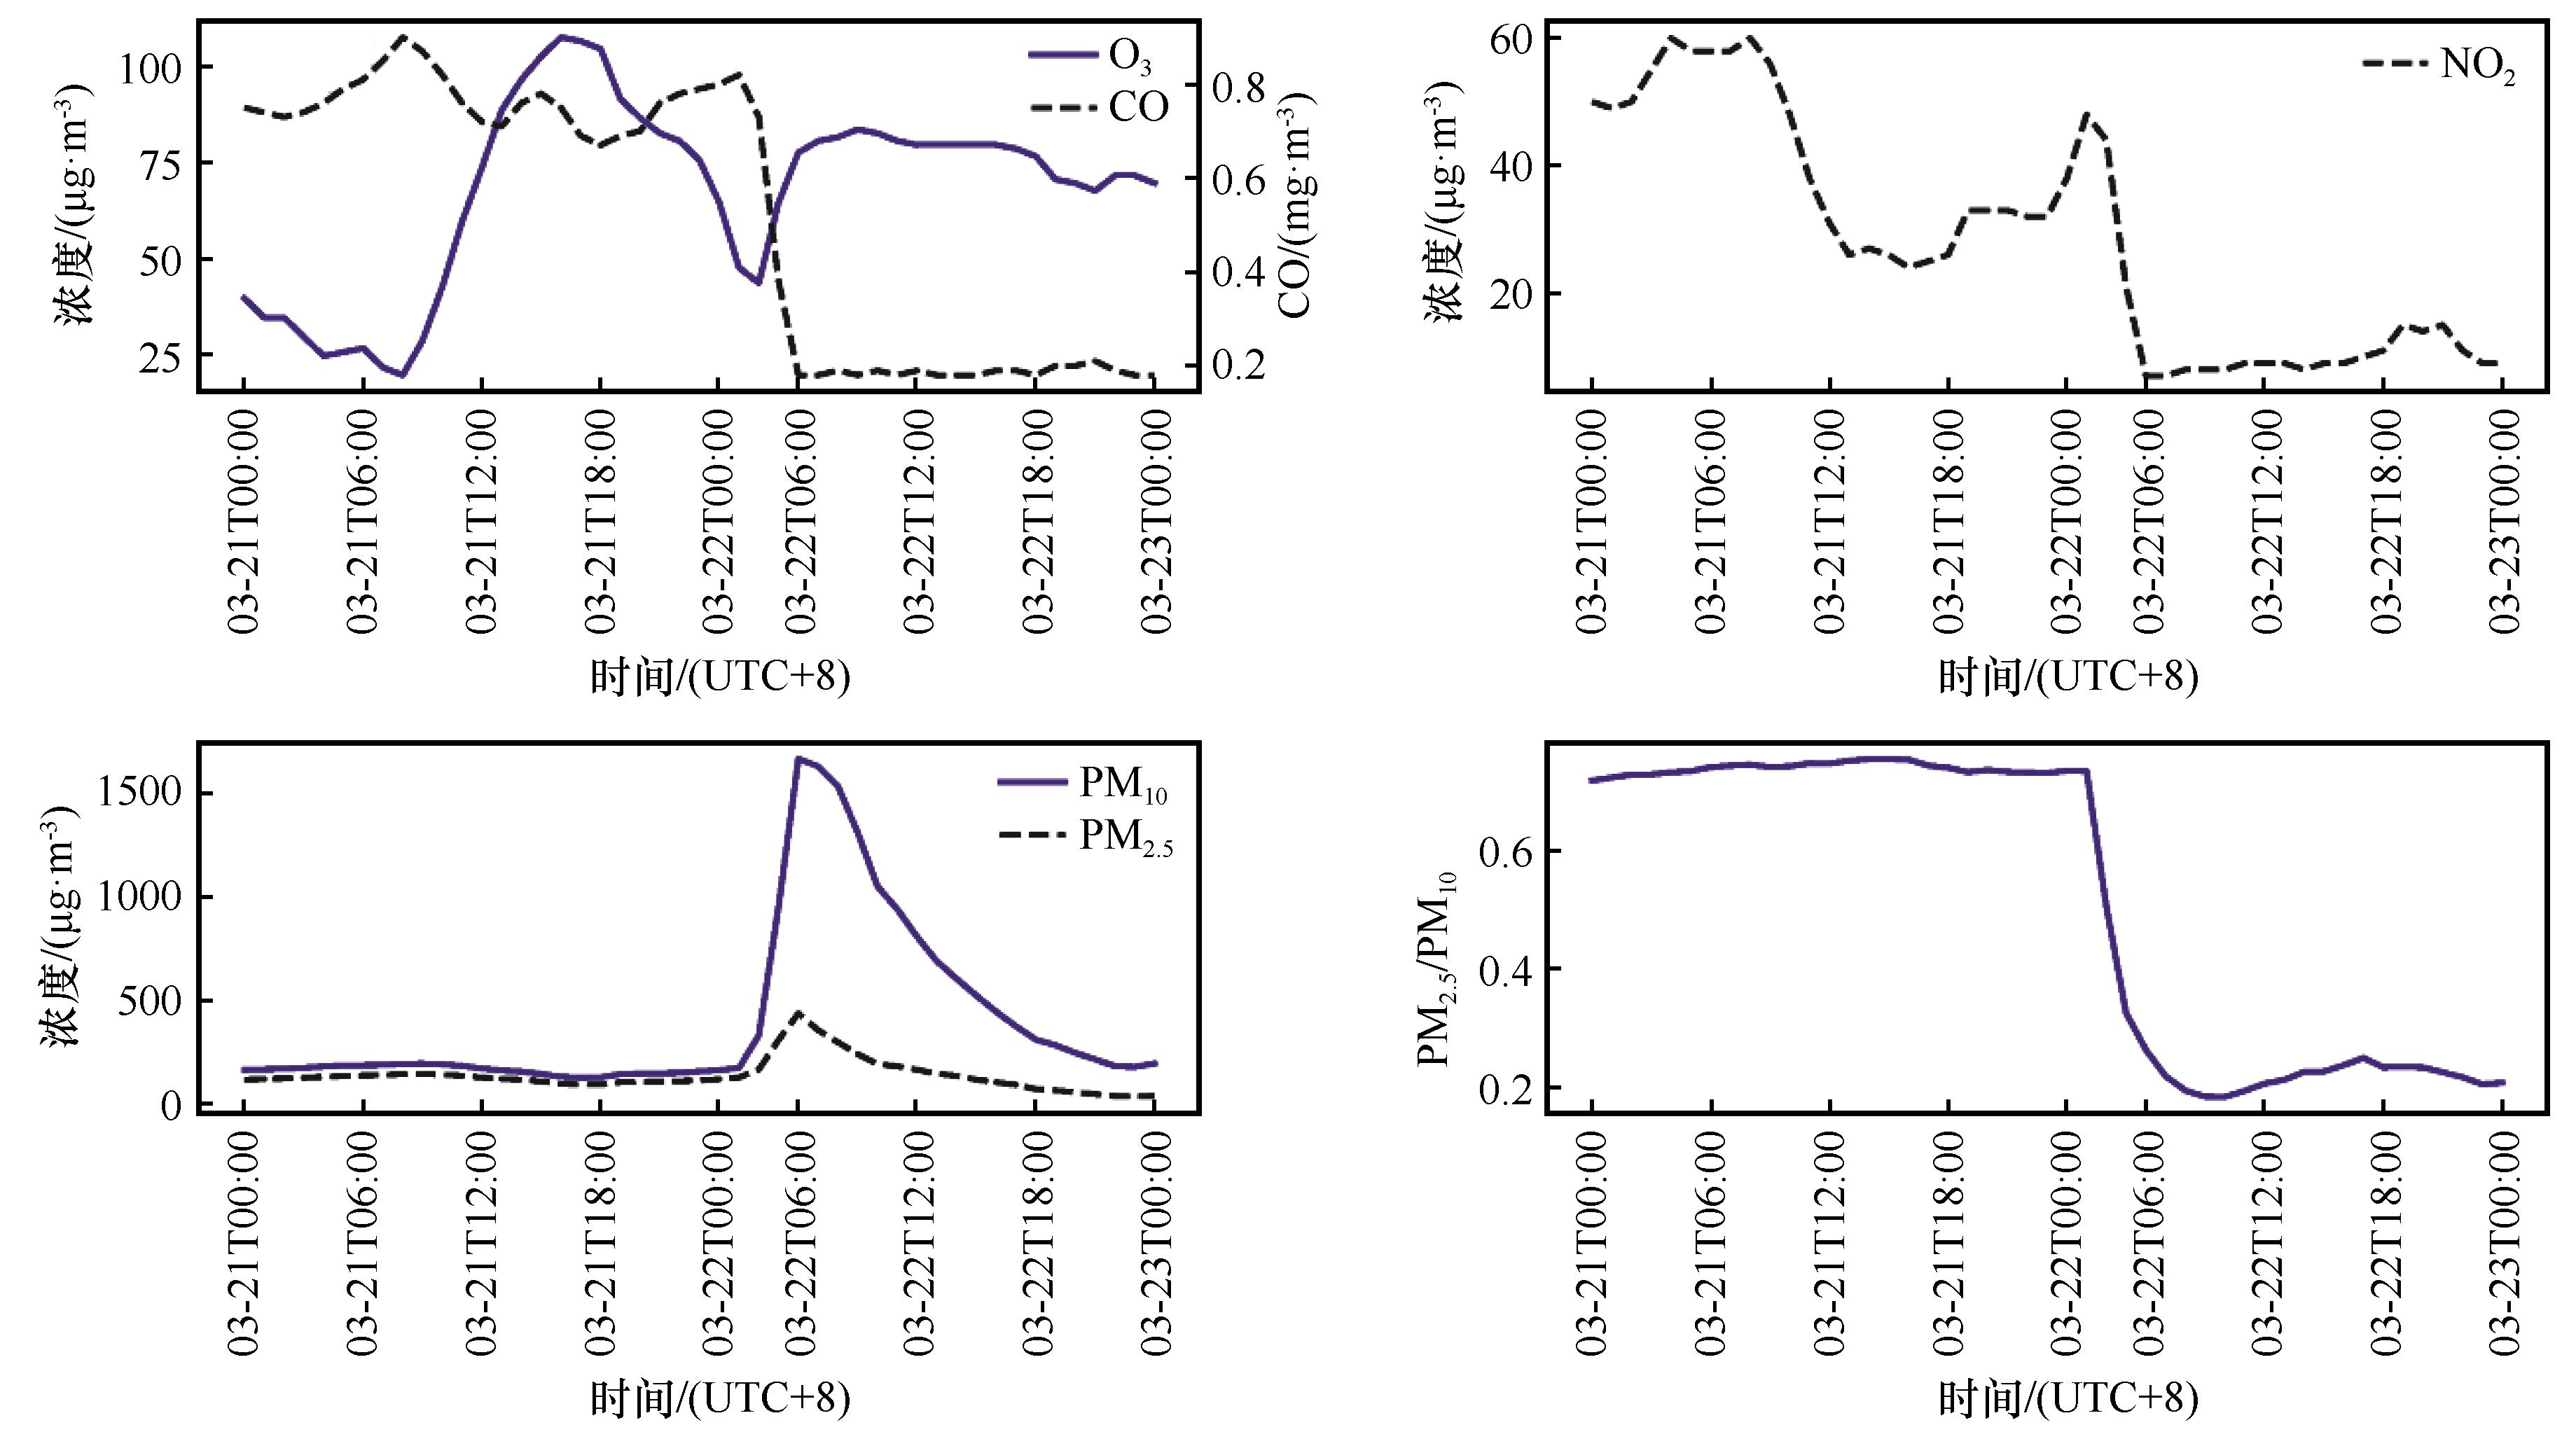
图6 沙尘影响前后北京市颗粒物浓度、比例与气态污染物浓度时间变化(3月22日02:00和05:00的值缺测)
Fig.6 Time series of particle concentration, proportion and gaseous pollutant concentration in Beijing City before and after the impact of dust (Missing values at 02:00 and 05:00 on March 22)
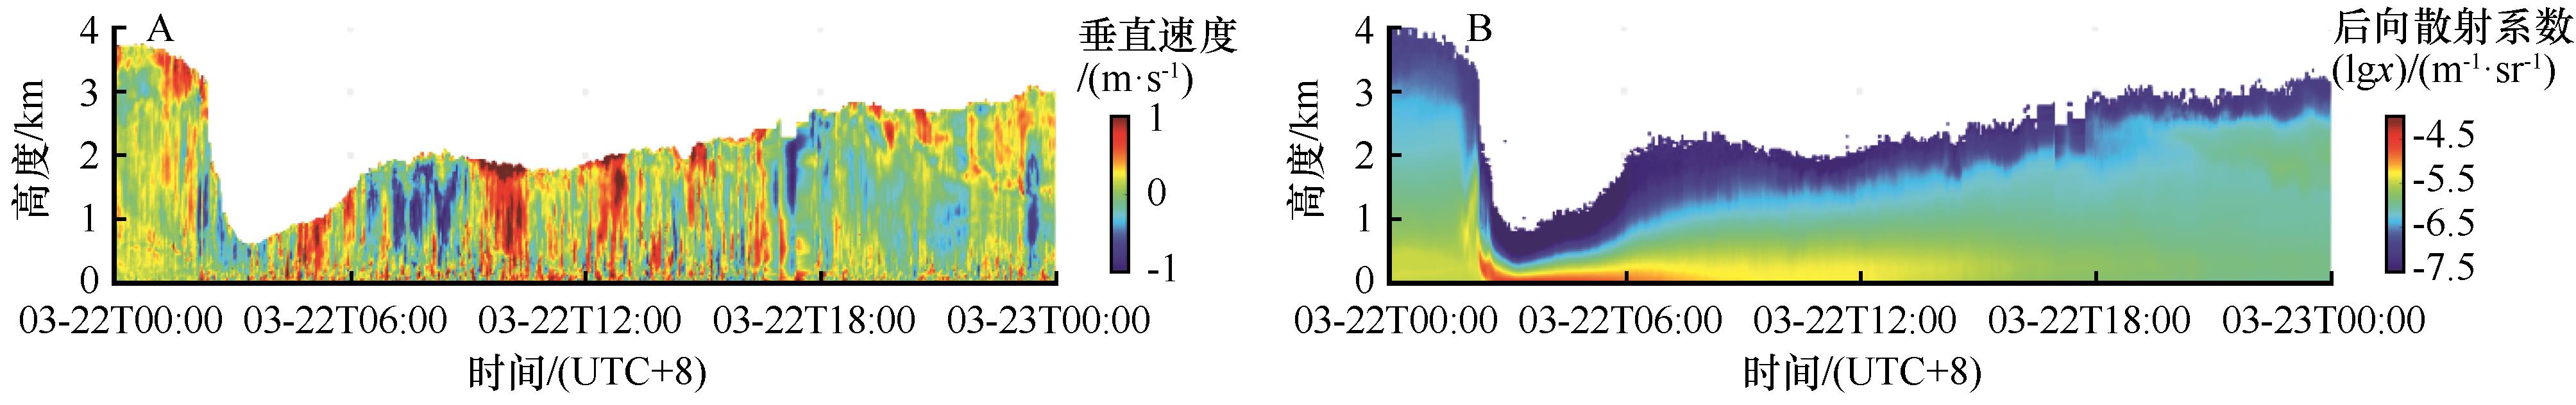
图7 沙尘影响前后激光雷达反演垂直速度剖面(A)与后向散射系数剖面(B)
Fig.7 Vertical profiles of vertical velocity (A), backscattering coefficient (B) by lidar before and after the impact of dust
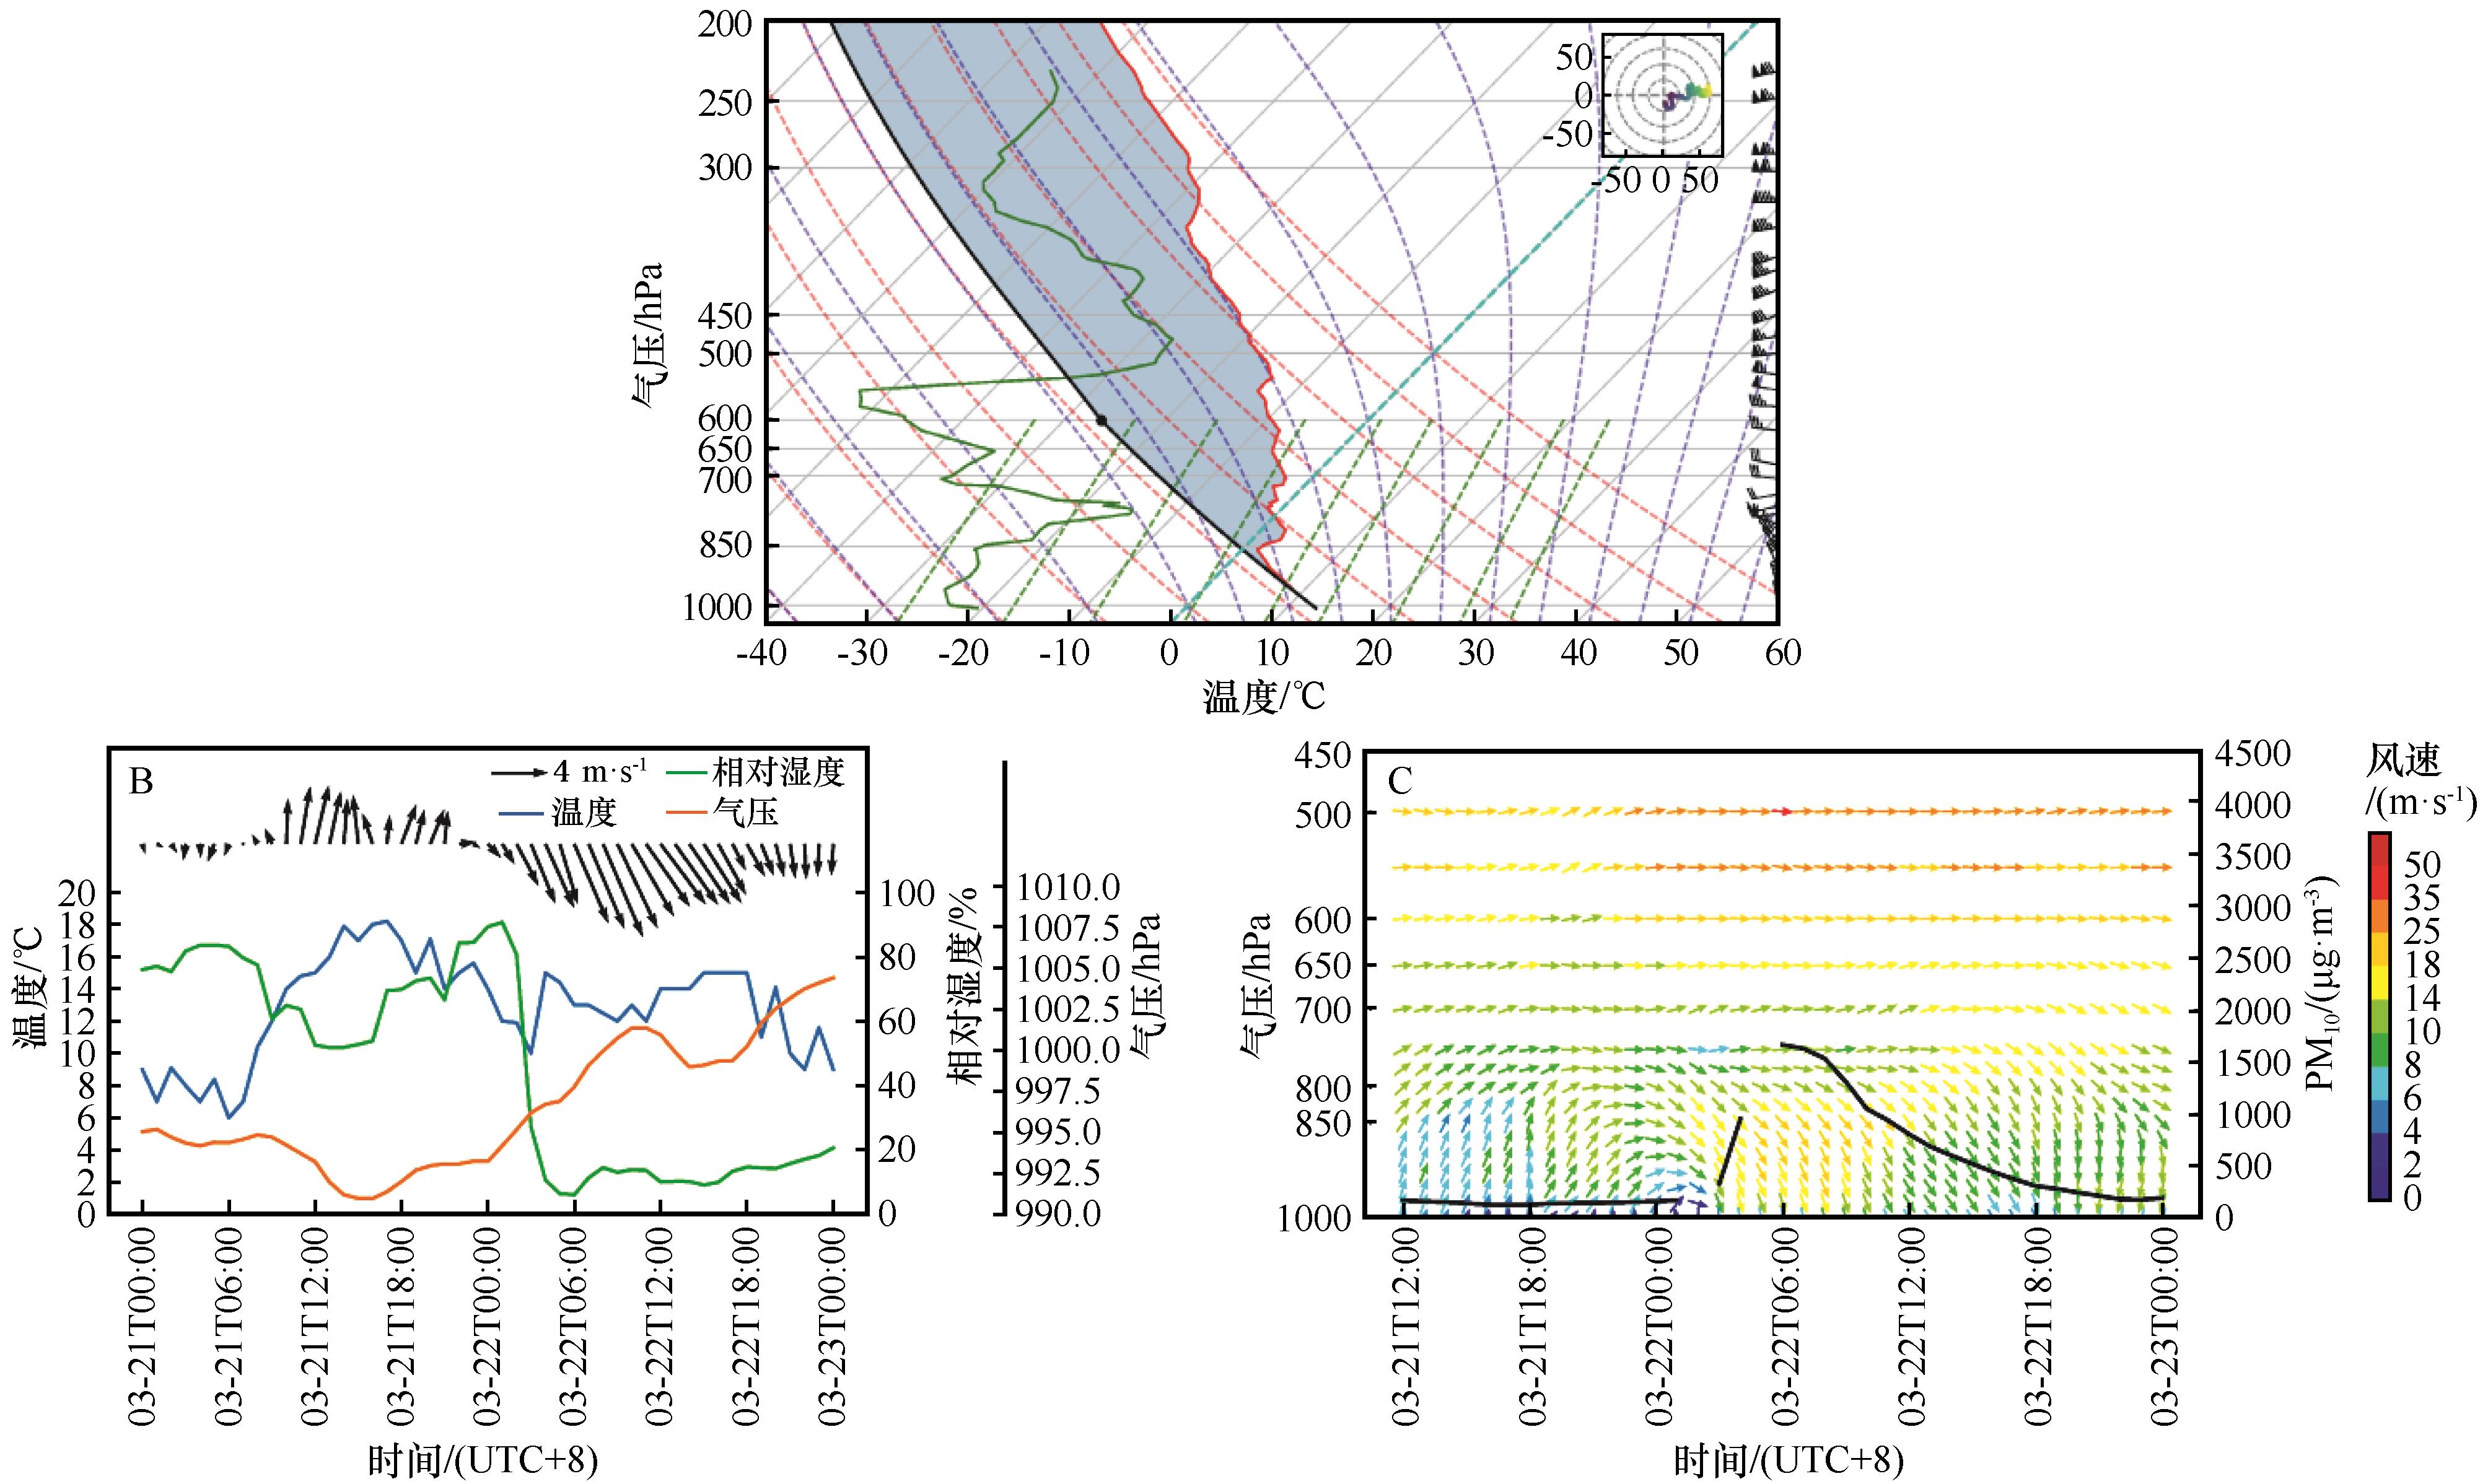
图8 北京市(A)2023年3月22日08:00探空曲线,(B)21日00:00—23日00:00风速、风向、温度、相对湿度,地面气压时间变化,(C)21日12:00—23日00:00 PM10和风场(u,v)时间变化(3月22日02:00和05:00的PM10值缺测)
Fig.8 (A) The Skew T-lnP diagram of Beijing Sounding Station at 08:00 BJT on 22, March 2023, (B) Time series of wind speed, wind direction, temperature, relative humidity, ground pressure in Beijing City from 00:00 BJT 21 to 00:00 BJT 23, March 2023, (C) The temporal changes of PM10 and wind field (u,v) during sand and dust pollution weather events in cities along the route of dust pollution weather event from 12:00 BJT 21 to 00:00 BJT 23, March 2023 (Missing PM10 values at 02:00 and 05:00 on March 22)
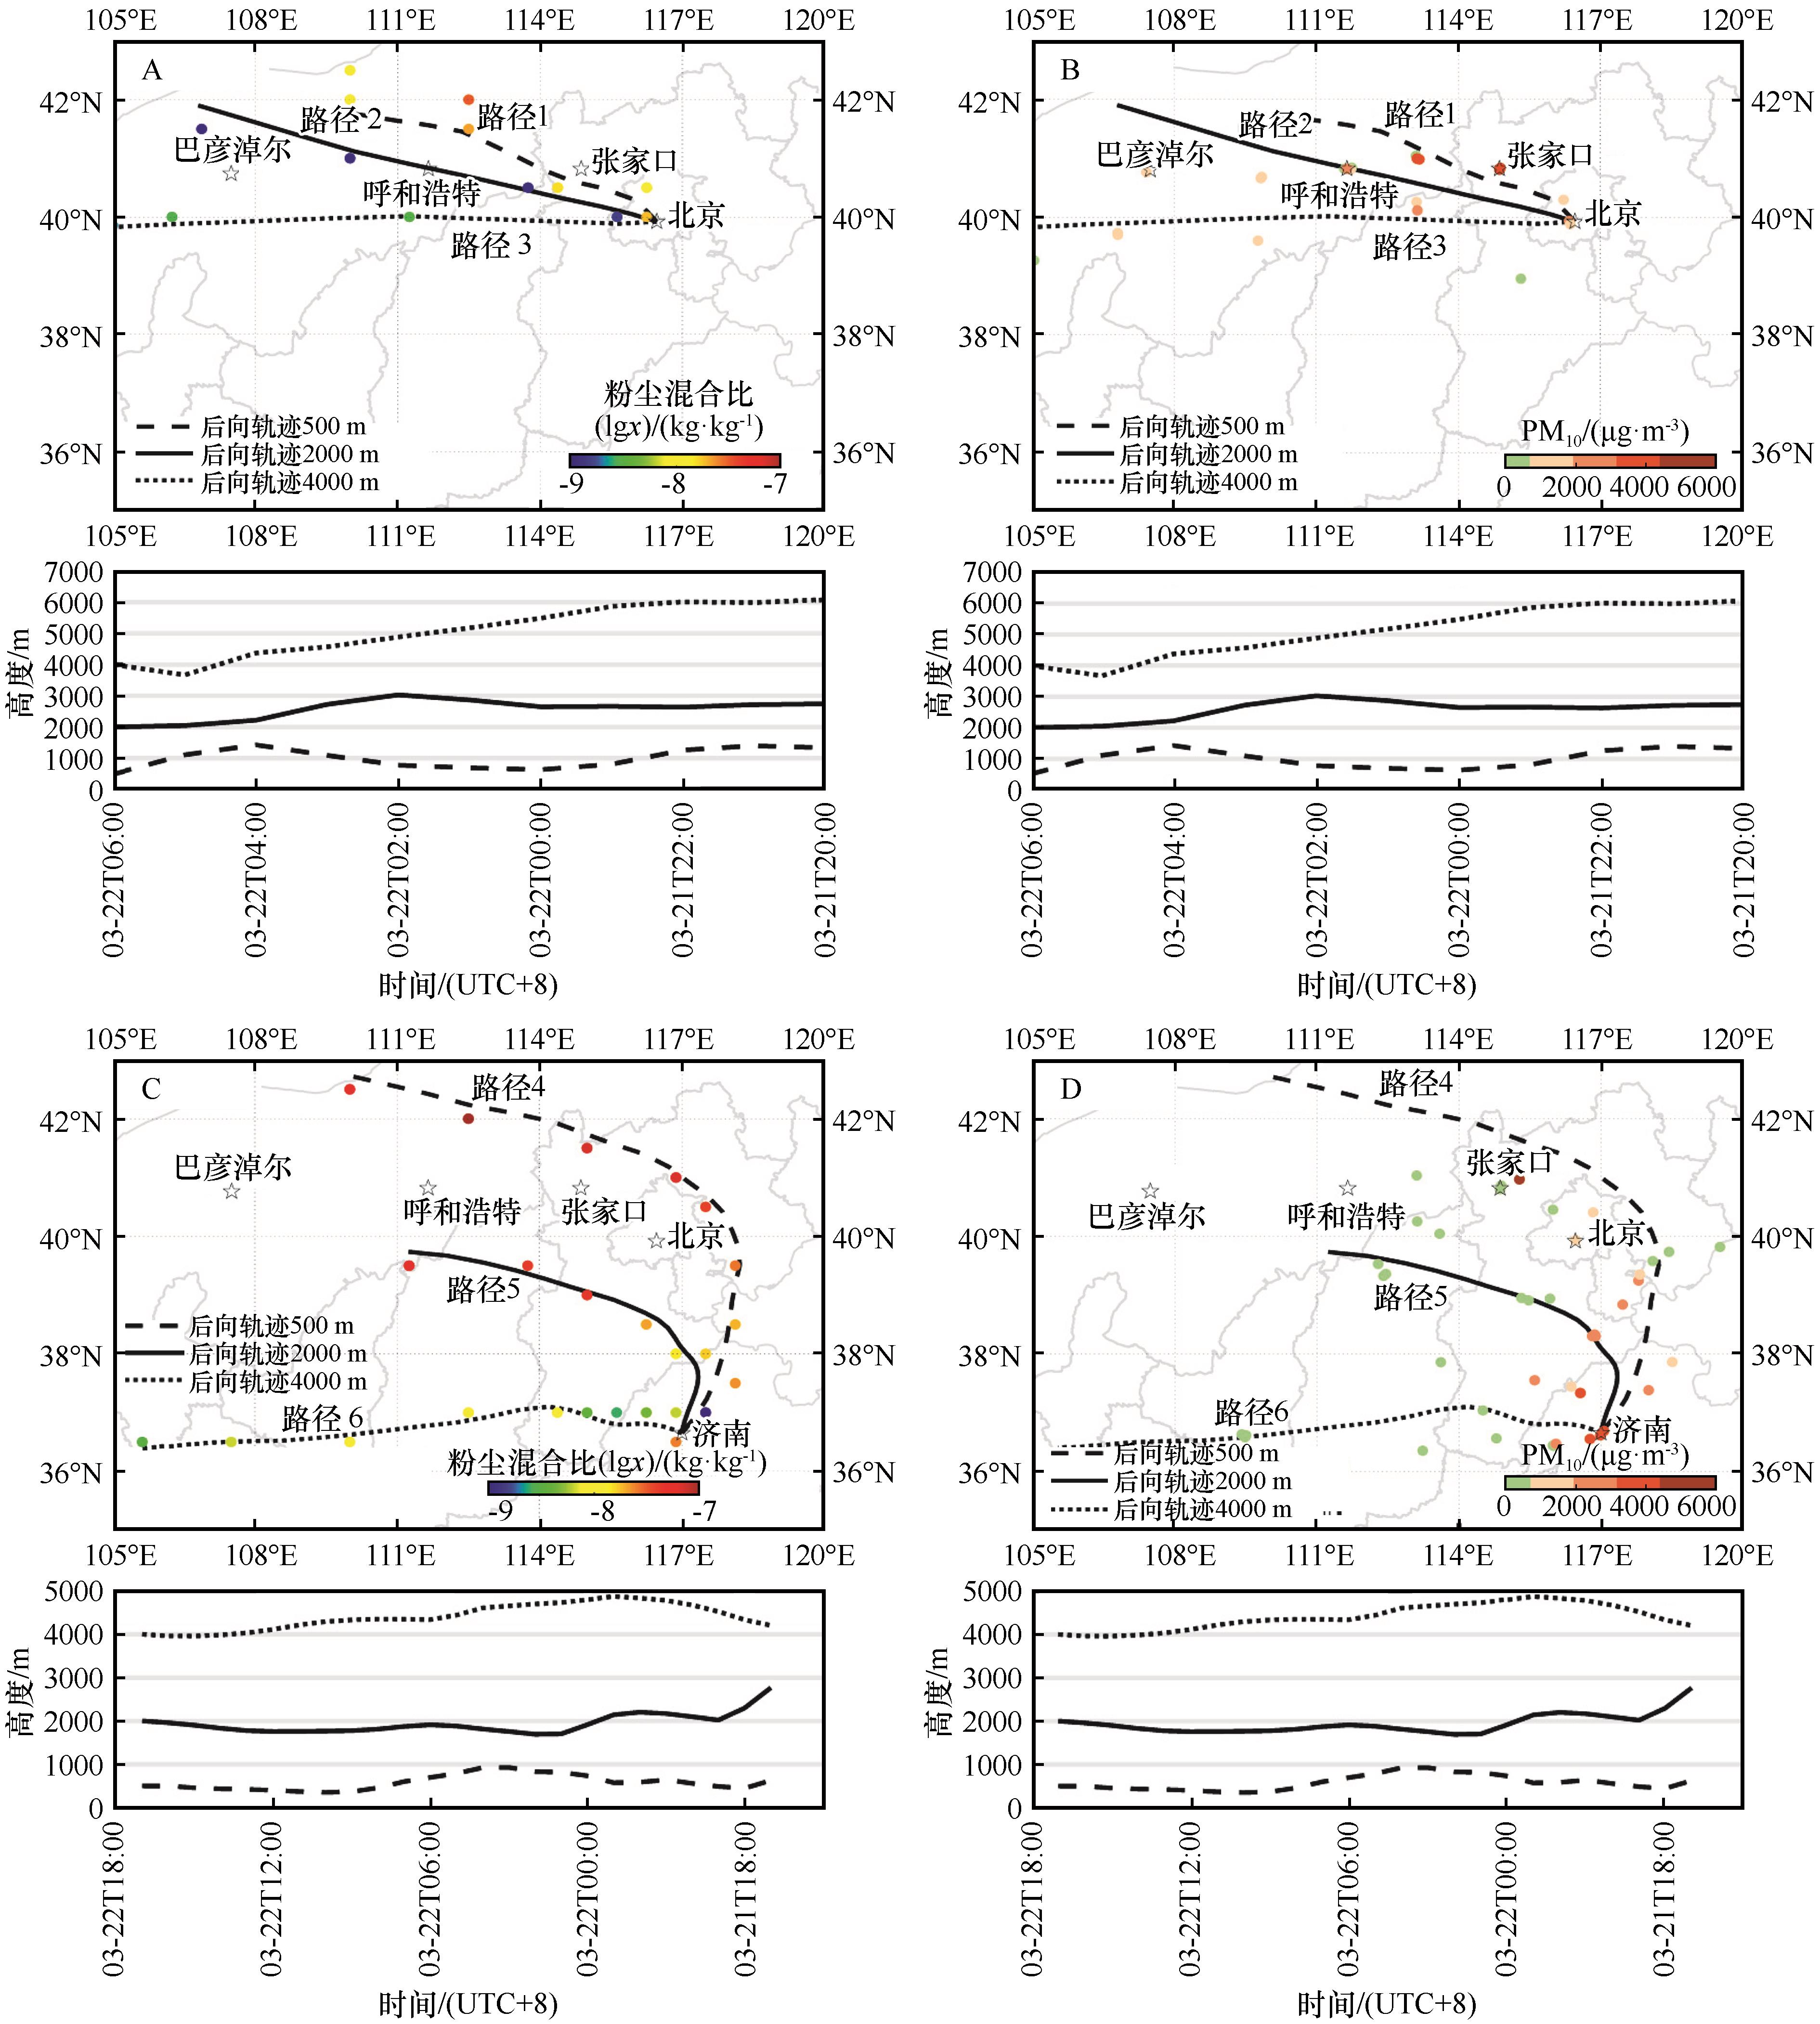
图9 沙尘天气后向轨迹。A,C图中轨迹上MERRA2 Dust Mixing Ratio浓度分布;B,D轨迹上地面PM10的浓度分布。虚线为500 m气团路径,实线为2 000 m气团路径,点线为4 000 m气团路径
Fig.9 Backward trajectory during dust pollution weather events. (A, C) spatial distribution of MERRA-2 Dust Mixing Ratio; (B, D) spatial distribution of ground PM10 concentration along the route of dust pollution weather event, respectively. The dashed line is the 500 m air mass path, the dashed line is the 2 000 m air mass path, and the dash dot line is the 4 000 m air mass path
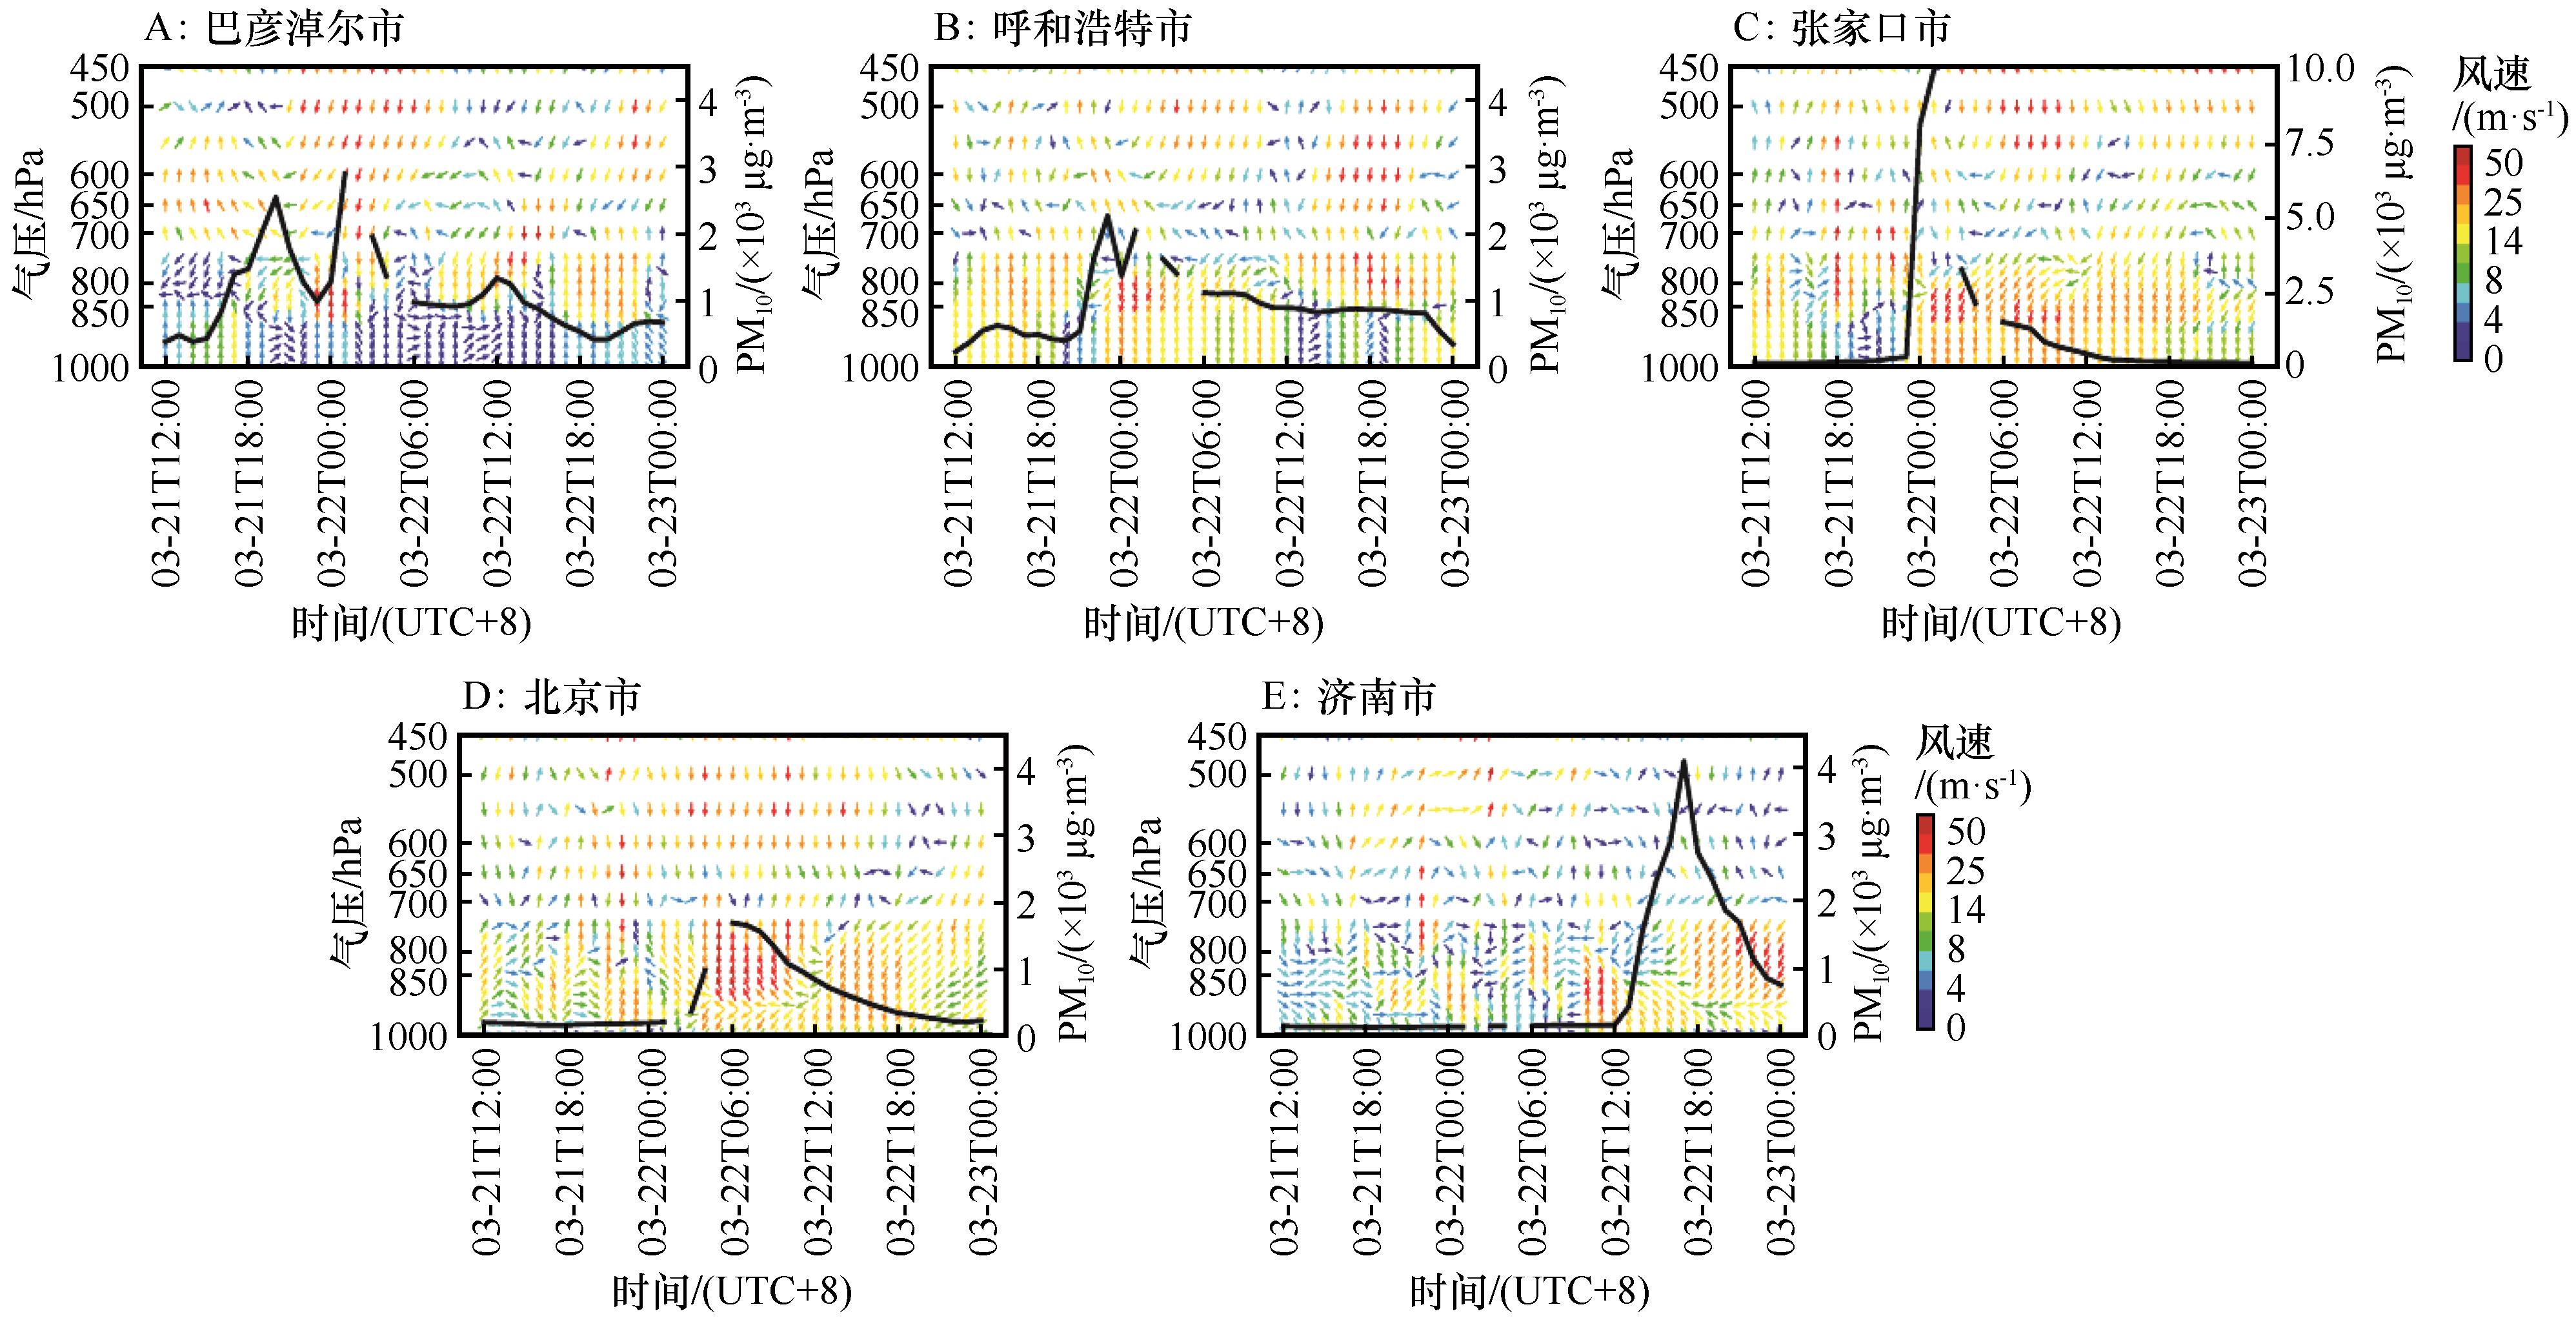
图10 2023年3月21日12:00—2023年3月23日00:00沙尘途经城市PM10和风场(v,w×(-50))时间变化(3月22日02:00和05:00的PM10值缺测)
Fig.10 The temporal changes of PM10 and wind field (v, w×(-50)) during sand and dust pollution weather events in cities along the route of dust pollution weather event from 12:00 BJT 21 to 00:00 BJT 23, March 2023 (Missing PM10 values at 02:00 and 05:00 on March 22)
| 1 | 魏巍,孙萌,王明丽.沙尘天气对青岛市空气质量的影响分析[J].科学技术创新,2019(17):54-55. |
| 2 | 邱海杰,周佺,周辉,等.2018年沙尘天气对随州空气质量的影响分析[J].环境科学与技术,2019,42():159-162. |
| 3 | 廖乾邑,罗彬,杜云松,等.北方沙尘对四川盆地环境空气质量影响和特征分析[J].中国环境监测,2016,32(5):51-55. |
| 4 | 马雁军,刘宁微,洪也,等.2011年春季辽宁一次沙尘天气过程及其对不同粒径颗粒物和空气质量的影响[J].环境科学学报,2012,32(5):1160-1167. |
| 5 | Wang J Y, Su S X, Yin Z L,et al.Quantitatively assessing the contributions of dust aerosols to direct radiative forcing based on remote sensing and numerical simulation[J].Remote Sensing,2022,14(3):660-668. |
| 6 | 陈洪武,王旭,马禹.塔里木盆地局地和区域性强沙尘暴天气过程研究[J].中国沙漠,2003,23(5):533-538. |
| 7 | Lu X, Mao F Y, Pan Z X,et al.Three-dimensional physical and optical characteristics of aerosols over central China from long-term CALIPSO and HYSPLIT data[J].Remote Sensing,2018,10(2):314-321. |
| 8 | Attiya A A, Jones B G.An extensive dust storm impact on air quality on 22 November 2018 in Sydney,Australia,using satellite remote sensing and ground data[J].Environmental Monitoring and Assessment,2022,194(6):432-439. |
| 9 | Peng Z R, Wang D S, Wang Z Y,et al.A study of vertical distribution patterns of PM2.5 concentrations based on ambient monitoring with unmanned aerial vehicles:a case in Hangzhou,China[J].Atmospheric Environment,2015,123:357-369. |
| 10 | Zhang S, Huang Z W, Li M S,et al.Vertical structure of dust aerosols observed by a ground-based Raman Lidar with polarization capabilities in the center of the Taklimakan Desert[J].Remote Sensing,2022,14(10):2461-2470. |
| 11 | Song M Q, Wang Y, Mamtimin A,et al.Applicability assessment of coherent Doppler Wind LiDAR for monitoring during dusty weather at the northern edge of the Tibetan Plateau[J].Remote Sensing,2022,14(20):5264-5273. |
| 12 | Wei T W, Xia H Y, Hu J J,et al.Simultaneous wind and rainfall detection by power spectrum analysis using a VAD scanning coherent Doppler lidar[J].Optics Express,2019,27(22):31235-31245. |
| 13 | Xia H Y, Chen Y X, Yuan J L,et al.Windshear detection in rain using a 30 km Radius Coherent Doppler Wind Lidar at mega airport in plateau[J].Remote Sensing,2024,16(5):924-935. |
| 14 | Wang L, Qiang W, Xia H Y,et al.Robust solution for boundary layer height detections with coherent Doppler wind lidar[J].Advances in Atmospheric Sciences,2021,38(11):1920-1928. |
| 15 | Yu S F, Zhang Z, Xia H Y,et al.Photon-counting distributed free-space spectroscopy[J].Light:Science Applications,2021,10:212-220. |
| 16 | Zhai X C, Wu S H, Liu B Y.Doppler lidar investigation of wind turbine wake characteristics and atmospheric turbulence under different surface roughness[J].Optics Express,2017,25(12):A515-A529. |
| 17 | Yuan J L, Wu Y B, Xia H Y,et al.Real‐time synchronous 3‐D detection of air pollution and wind using a Solo Coherent Doppler Wind Lidar[J].Remote Sensing,2022,14(12):2809-2817. |
| 18 | 吴占华,任国玉.我国北方区域沙尘天气的时间特征分析[J].气象科技,2007,35(1):96-100. |
| 19 | 唐杨,徐志方,韩贵琳.北京及其北部地区大气降尘时空分布特征[J].环境科学与技术,2011,34(2):115-119. |
| 20 | 马俊.北方今春为何风沙有点多[N/OL].环球时报,2023-03-24(3). |
| 21 | 徐文帅,张大伟,李云婷,等.北京两次沙尘污染过程中PM2.5浓度变化特征[J].气候与环境研究,2016,21(1):78-86. |
| 22 | Filonchyk M.Characteristics of the severe March 2021 gobi desert dust storm and its impact on air pollution in China[J].Chemosphere,2022,287:132219. |
| 23 | Hammer M S, Martin R V, Li C,et al.Insight into global trends in aerosol composition from 2005 to 2015 inferred from the OMI ultraviolet aerosol index[J].Atmospheric Chemistry and Physics,2018,18(11):8097-8112. |
| 24 | Farooqui M, West J, Shankar U,et al.Assessment of dust emissions model and PM10 in the United Arab Emirates during dust storms using the CMAQ-WRF Modeling System[C]//American Geophysical Union,Fall Meeting,2013,abstract id.A41G-0138. |
| 25 | 霍文,智协飞,杨莲梅,等.沙漠气象若干问题研究进展[J].大气科学学报,2019,42(3):469-480. |
| 26 | Rizza U, Barnaba F, Miglietta M,et al.WRF-Chem model simulations of a dust outbreak over the central Mediterranean and comparison with multi-sensor desert dust observations[J].Atmospheric Chemistry and Physics,2017,17(1):93-115. |
| 27 | Chen S Y, Zhao D, Huang J P,et al.Mongolia contributed more than 42% of the dust concentrations in northern China in March and April 2023[J].Advances in Atmospheric Sciences,2023,40:1549-1557. |
| 28 | 陈思宇,黄建平,李景鑫,等.塔克拉玛干沙漠和戈壁沙尘起沙、传输和沉降的对比研究[J].中国科学:地球科学,2017,47(8):939-957. |
| 29 | 顿耀权,罗万银,邵梅,等.干旱区内陆湖盆沙尘水平通量及粒度特征[J].中国沙漠,2023,43(6):166-175. |
| 30 | 秦豪君,杨晓军,马莉,等.2000-2020年中国西北地区区域性沙尘暴特征及成因[J].中国沙漠,2022,42(6):53-64. |
| 31 | Sun E W, Xu X F, Che H Z,et al.Variation in MERRA-2 aerosol optical depth and absorption aerosol optical depth over China from 1980 to 2017[J].Journal of Atmospheric and Solar-Terrestrial Physics,2019,186:8-19. |
| 32 | Gueymard C A, Yang D Z.Worldwide validation of CAMS and MERRA-2 reanalysis aerosol optical depth products using 15 years of AERONET observations[J].Atmospheric Environment,2020,225:117216. |
| 33 | Yao W R, Che H Z, Gui K,et al.Can MERRA-2 reanalysis data reproduce the three-dimensional evolution characteristics of a typical dust process in East Asia?a case study of the dust event in May 2017[J].Remote Sensing,2020,12(6):902-911. |
| 34 | Rui W Y, Ke G, Q Wang Ya,et al.Identifying the dominant local factors of 2000-2019 changes in dust loading over East Asia[J].Science of The Total Environment,2021,777:146064. |
| 35 | Fang G C, Chang C N, Wu Y S,et al.Concentration of atmospheric particulates during a dust storm period in central Taiwan,Taichung[J].Science of The Total Environment,2002,287(1/2):141-145. |
| 36 | 林葳.你不可不知的2500条地理常识[M],内蒙古呼伦贝尔:内蒙古文化出版社,2011:306. |
| 37 | Lyu Y L, Qu Z Q, Liu L Y,et al.Characterization of dustfall in rural and urban sites during three dust storms in northern China,2010[J].Aeolian Research,2017,28:29-37. |
| 38 | 王式功,董光荣,陈惠忠,等.沙尘暴研究的进展[J].中国沙漠,2000,20(4):349-356. |
| 39 | Chan Y C, Mctainsh G, Leys J,et al.Influence of the 23 October 2002 dust storm on the air quality of four Australian cities[J].Water Air Soil Pollution,2005,164:329-348. |
| 40 | Liu C M, Young C Y, Lee Y C.Influence of Asian dust storms on air quality in Taiwan[J].Science of the Total Environment,2006,368(2/3):884-897. |
| 41 | 陈跃浩,高庆先,高文康,等.沙尘天气对大气环境质量影响的量化研究[J].环境科学研究,2013,26(4):364-369. |
| 42 | 杨青,杨莲梅,张广兴,等.能见度与空气质量的关系研究[J].中国沙漠,2006,26(2):278-282. |
| 43 | 孙兆彬,安兴琴,崔甍甍,等.北京地区颗粒物健康效应研究:沙尘天气、非沙尘天气下颗粒物(PM2.5、PM10)对心血管疾病入院人次的影响[J].中国环境科学,2016,36(8):2536-2544. |
| 44 | 袁瑞瑞,王建英,张卫红,等.不同路径冷空气导致的宁夏沙尘重污染天气特征及传输规律[J].中国沙漠,2024,44(1):209-217. |
| 45 | 盛慧,颜为军,孟鑫鑫,等.一次典型沙尘过程对我国热带地区空气质量影响分析[J].环境科学学报,2024,44(2):310-319. |
| 46 | Xie S, Qi Y Z L, Tang X.Characteristics of air pollution in Beijing during sand-dust storm periods[J].Water Air Soil Pollution:Focus,2005,5(3):217-229. |
| 47 | 魏巍,皮冬勤,晏平仲,等.2017年春季华北地区一次典型沙尘重污染天气过程研究[J].环境科学学报,2018,38(5):1699-1707. |
| 48 | 陈辉,赵琳娜,赵鲁强,等.沙尘天气过程对北京空气质量的影响[J].环境科学研究,2012,25(6):609-614. |
| [1] | 张浪, 党国锋, 鱼腾飞, 韩拓, 殷一丹, 陈勇. 基于无人机激光雷达的额济纳绿洲植被覆盖度监测及变化分析[J]. 中国沙漠, 2024, 44(5): 170-181. |
| [2] | 鲍莉莉, 李锦荣, 韩兆恩, 刘悦, 单浩东. 基于无人机多源数据的梭梭( Holoxylon ammodendron )地上生物量估算[J]. 中国沙漠, 2024, 44(5): 50-59. |
| [3] | 贾晓鹏, 马启民, 龙银平, 王海兵. 以中型蒸渗仪监测的库布齐沙漠人工林土壤蒸发量[J]. 中国沙漠, 2022, 42(1): 211-222. |
| [4] | 王姣月, 秦树高, 张宇清. 毛乌素沙地植被水分利用效率的时空格局[J]. 中国沙漠, 2020, 40(5): 120-129. |
| [5] | 杨燕萍, 王莉娜, 杨丽丽, 陶会杰, 蒋琳. 兰州市沙尘天气污染特征及潜在源区[J]. 中国沙漠, 2020, 40(3): 60-66. |
| [6] | 李霞, 刘廷玺, 段利民, 王冠丽, 童新, 周亚军, 杨晓君. 科尔沁湿草甸参考作物蒸散发模拟分析[J]. 中国沙漠, 2020, 40(2): 134-143. |
| [7] | 岳喜元, 左小安, 常学礼, 徐翀, 吕朋, 张晶, 赵生龙, 程清平. 内蒙古典型草原与荒漠草原NDVI对气象因子的响应[J]. 中国沙漠, 2019, 39(3): 25-33. |
| [8] | 李璠, 肖建设, 祁栋林, 李林. 柴达木盆地沙尘暴天气影响因素[J]. 中国沙漠, 2019, 39(2): 144-150. |
| [9] | 罗凤敏, 高君亮, 辛智鸣, 郝玉光, 王丽娜, 李帅. 乌兰布和沙漠东北缘地温变化特征及其影响因子[J]. 中国沙漠, 2019, 39(1): 179-186. |
| [10] | 黄海涛, 常学礼, 岳喜元, 吕德燕. 科尔沁沙地不同沙地景观区植被指数对水热因素响应[J]. 中国沙漠, 2016, 36(1): 40-49. |
| [11] | 方静, 丁永建. 干旱荒漠区沙土凝结水与微气象因子关系[J]. 中国沙漠, 2015, 35(5): 1200-1205. |
| [12] | 张晓艳, 褚建民, 孟平, 张天一, 高明远, 李得禄. 民勤绿洲荒漠梭梭(Haloxylon ammodendron)土壤水分特征[J]. 中国沙漠, 2015, 35(5): 1206-1216. |
| [13] | 胡广录, 王德金, 廖亚鑫, 樊立娟, 张宏伟. 气象因子对黑河中游荒漠-绿洲过渡带斑块植被区风沙活动的影响[J]. 中国沙漠, 2015, 35(4): 865-873. |
| [14] | 宋嘉尧, 张京朋, 曲宗希, 张文煜. 微脉冲激光雷达反演半干旱区气溶胶消光系数方法[J]. 中国沙漠, 2015, 35(4): 971-976. |
| [15] | 杨晓玲, 丁文魁, 殷玉春, 兰晓波. 1961-2010年武威市气温日较差变化趋势及影响因子分析[J]. 中国沙漠, 2014, 34(1): 225-232. |
| 阅读次数 | ||||||
|
全文 |
|
|||||
|
摘要 |
|
|||||
©2018中国沙漠 编辑部
地址: 兰州市天水中路8号 (730000)
电话:0931-8267545
Email:caiedit@lzb.ac.cn;desert@lzb.ac.cn

 甘公网安备 62010202000688号