img

官方微信

高级检索

中国沙漠 ›› 2022, Vol. 42 ›› Issue (3): 31-40.DOI: 10.7522/j.issn.1000-694X.2021.00162

• • 上一篇    下一篇

黄河流域城乡融合发展时空演变和动力机制

谢磊1,2(), 何仁伟2, 史文涛3(), 蒲红铮4   

  1. 1.芦溪中学,江西 芦溪 337200
    2.北京市社会科学院 市情调查研究中心,北京 100101
    3.遵义师范学院 管理学院,贵州 遵义 563006
    4.重庆理工大学 管理学院,重庆 400054
  • 收稿日期:2021-08-16 修回日期:2021-11-09 出版日期:2022-05-20 发布日期:2022-06-01
  • 通讯作者: 史文涛
  • 作者简介:史文涛(E-mail: 3074677546@qq.com
    谢磊(1987—),男,江西萍乡人,硕士,讲师,主要从事城乡融合发展、城市与区域规划研究。E-mail: xielei0409@163.com
  • 基金资助:
    贵州省科技计划项目(黔科合LH字【2017】7078号);遵义师范学院博士科研启动基金项目(【2019】01号)

Spatio-temporal evolution and dynamic mechanism of urban-rural integration development in the Yellow River Basin

Lei Xie1,2(), Renwei He2, Wentao Shi3(), Hongzheng Pu4   

  1. 1.Luxi Middle School in Jiangxi Province,Luxi 337200,Jiangxi,China
    2.City Situation Survey Research Center,Beijing Academy of Social Sciences,Beijing 100101,China
    3.School of Management,Zunyi Normal University,Zunyi 563006,Guizhou,China
    4.School of Management,Chongqing University of Technology,Chongqing 400054,China
  • Received:2021-08-16 Revised:2021-11-09 Online:2022-05-20 Published:2022-06-01
  • Contact: Wentao Shi

摘要:

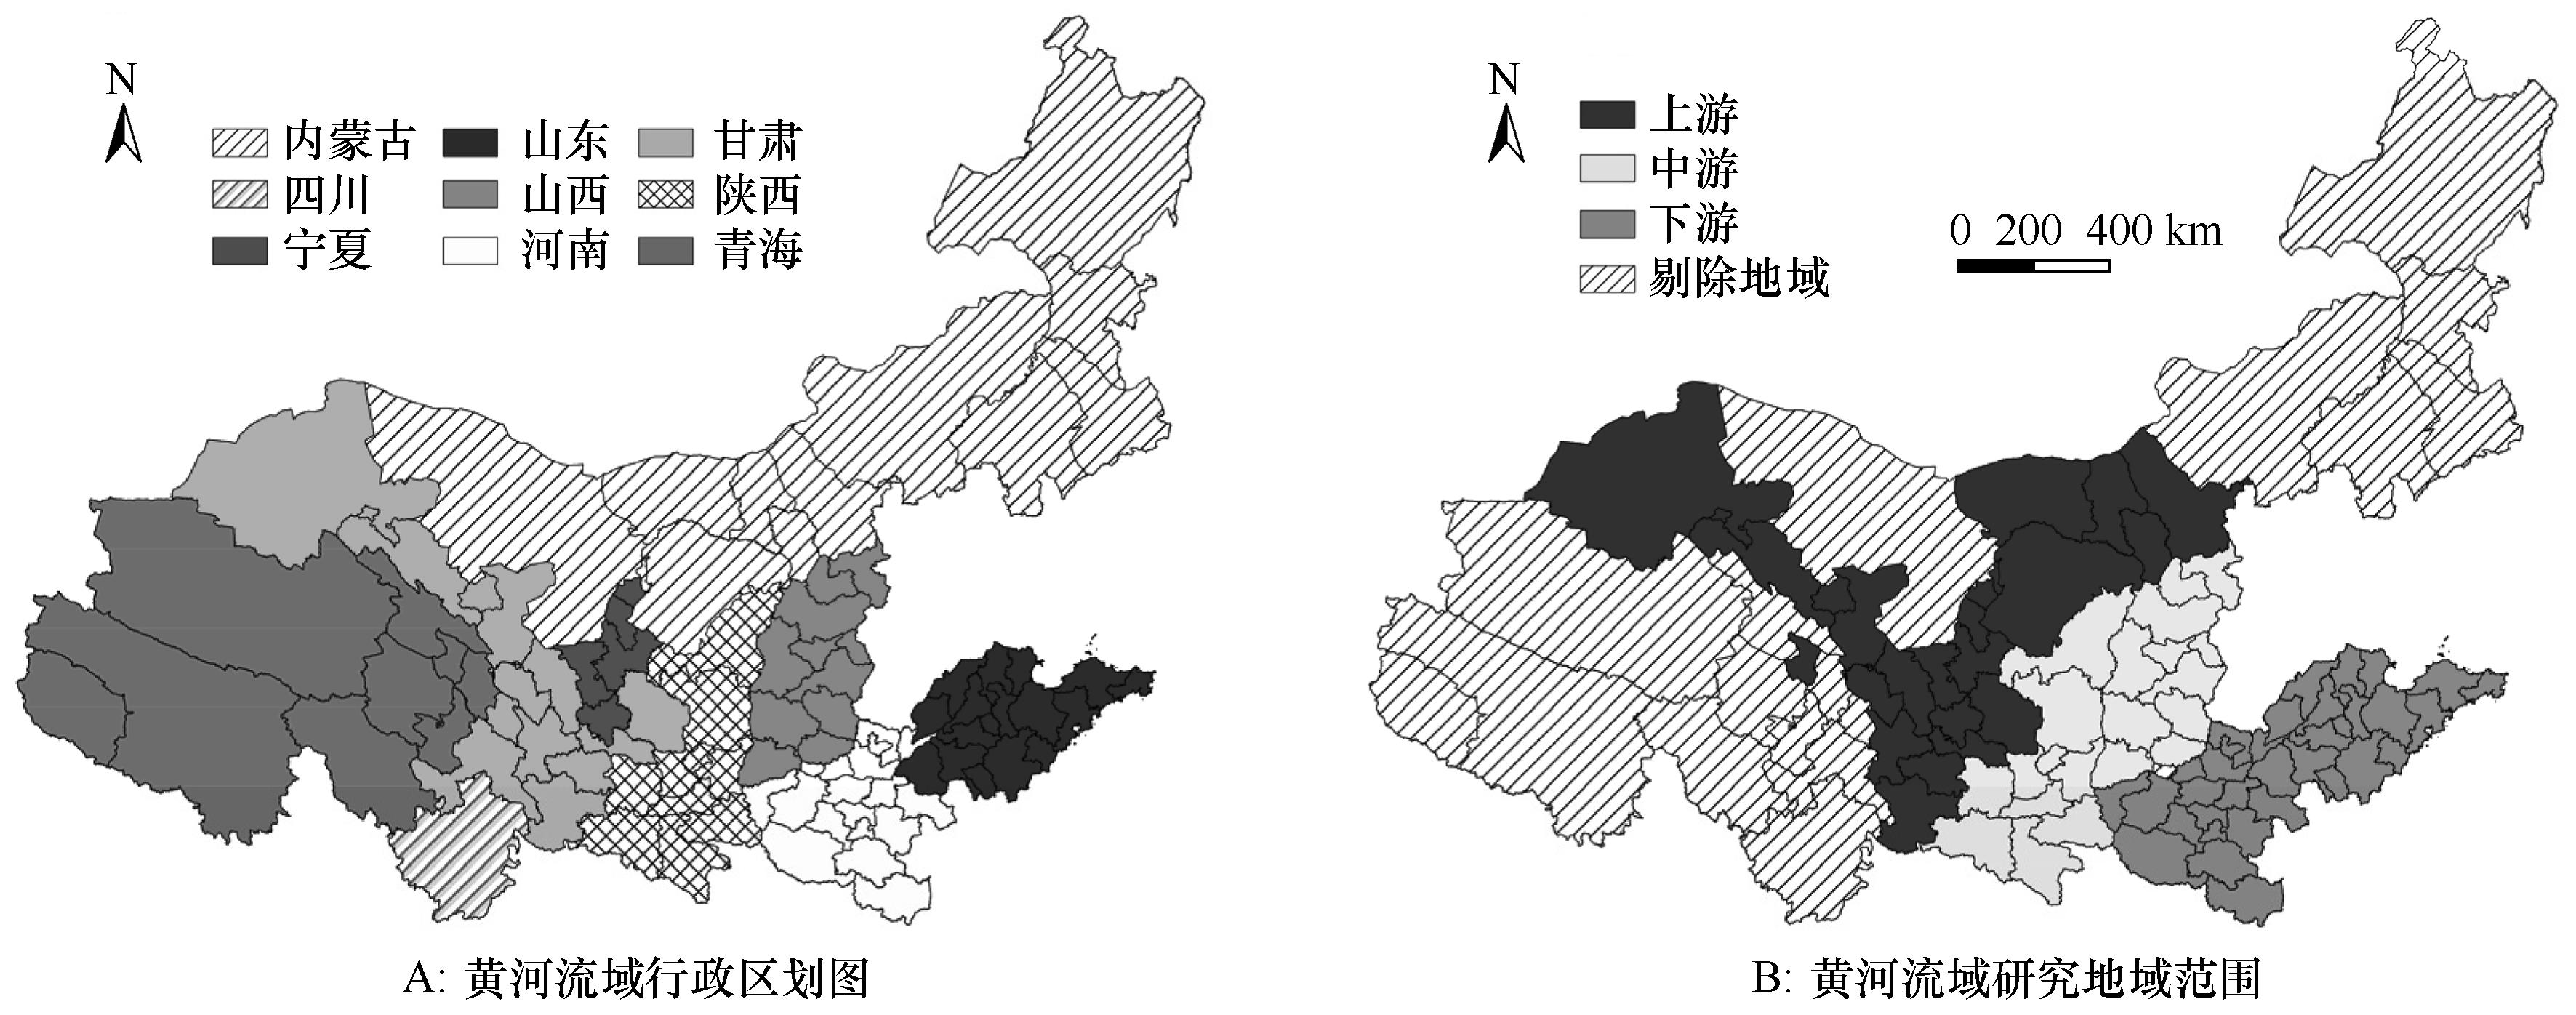
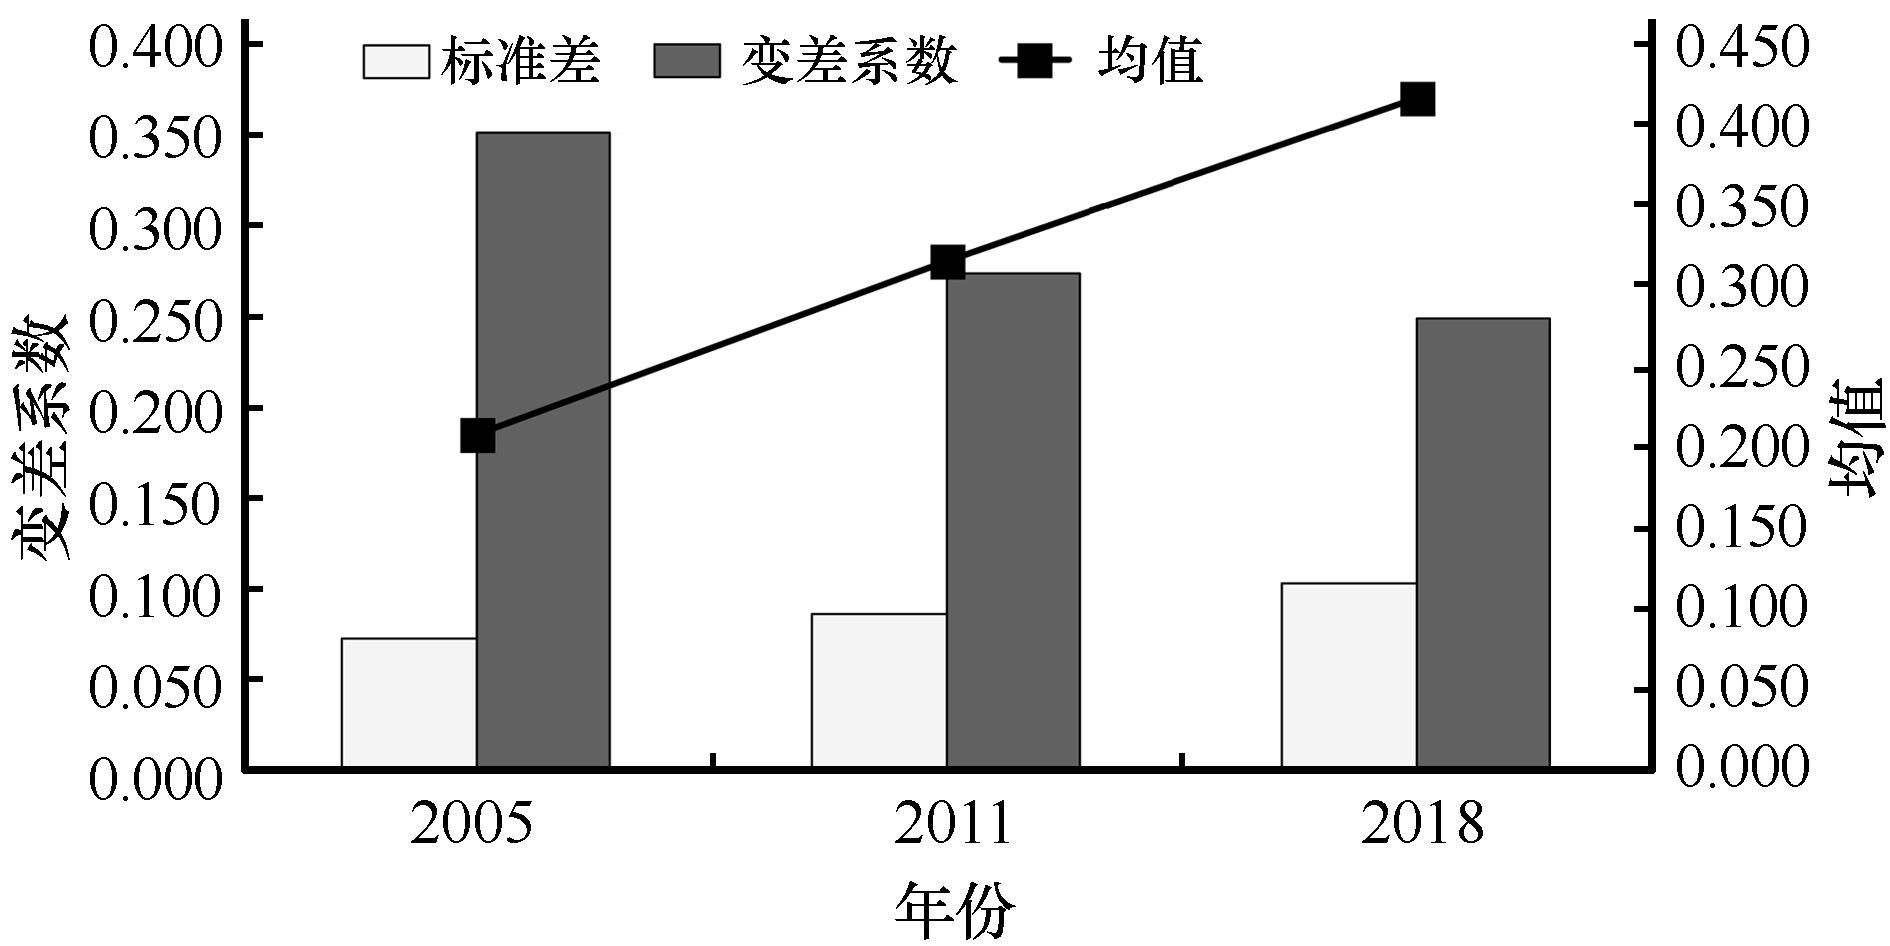
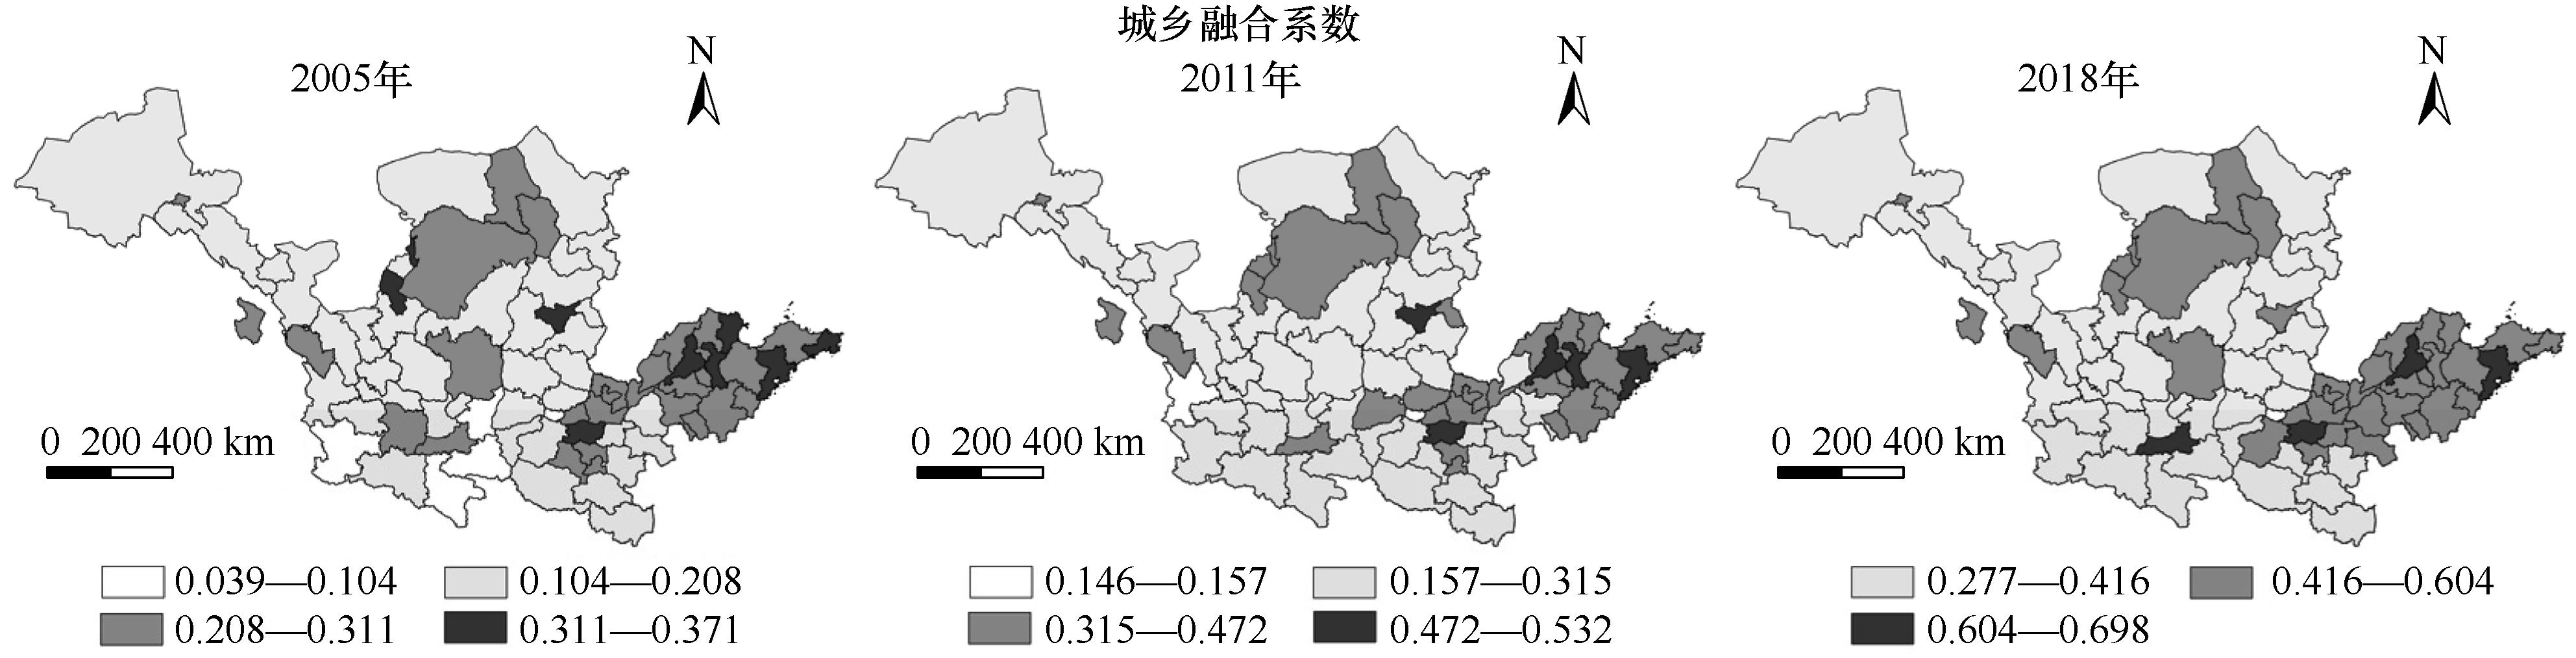
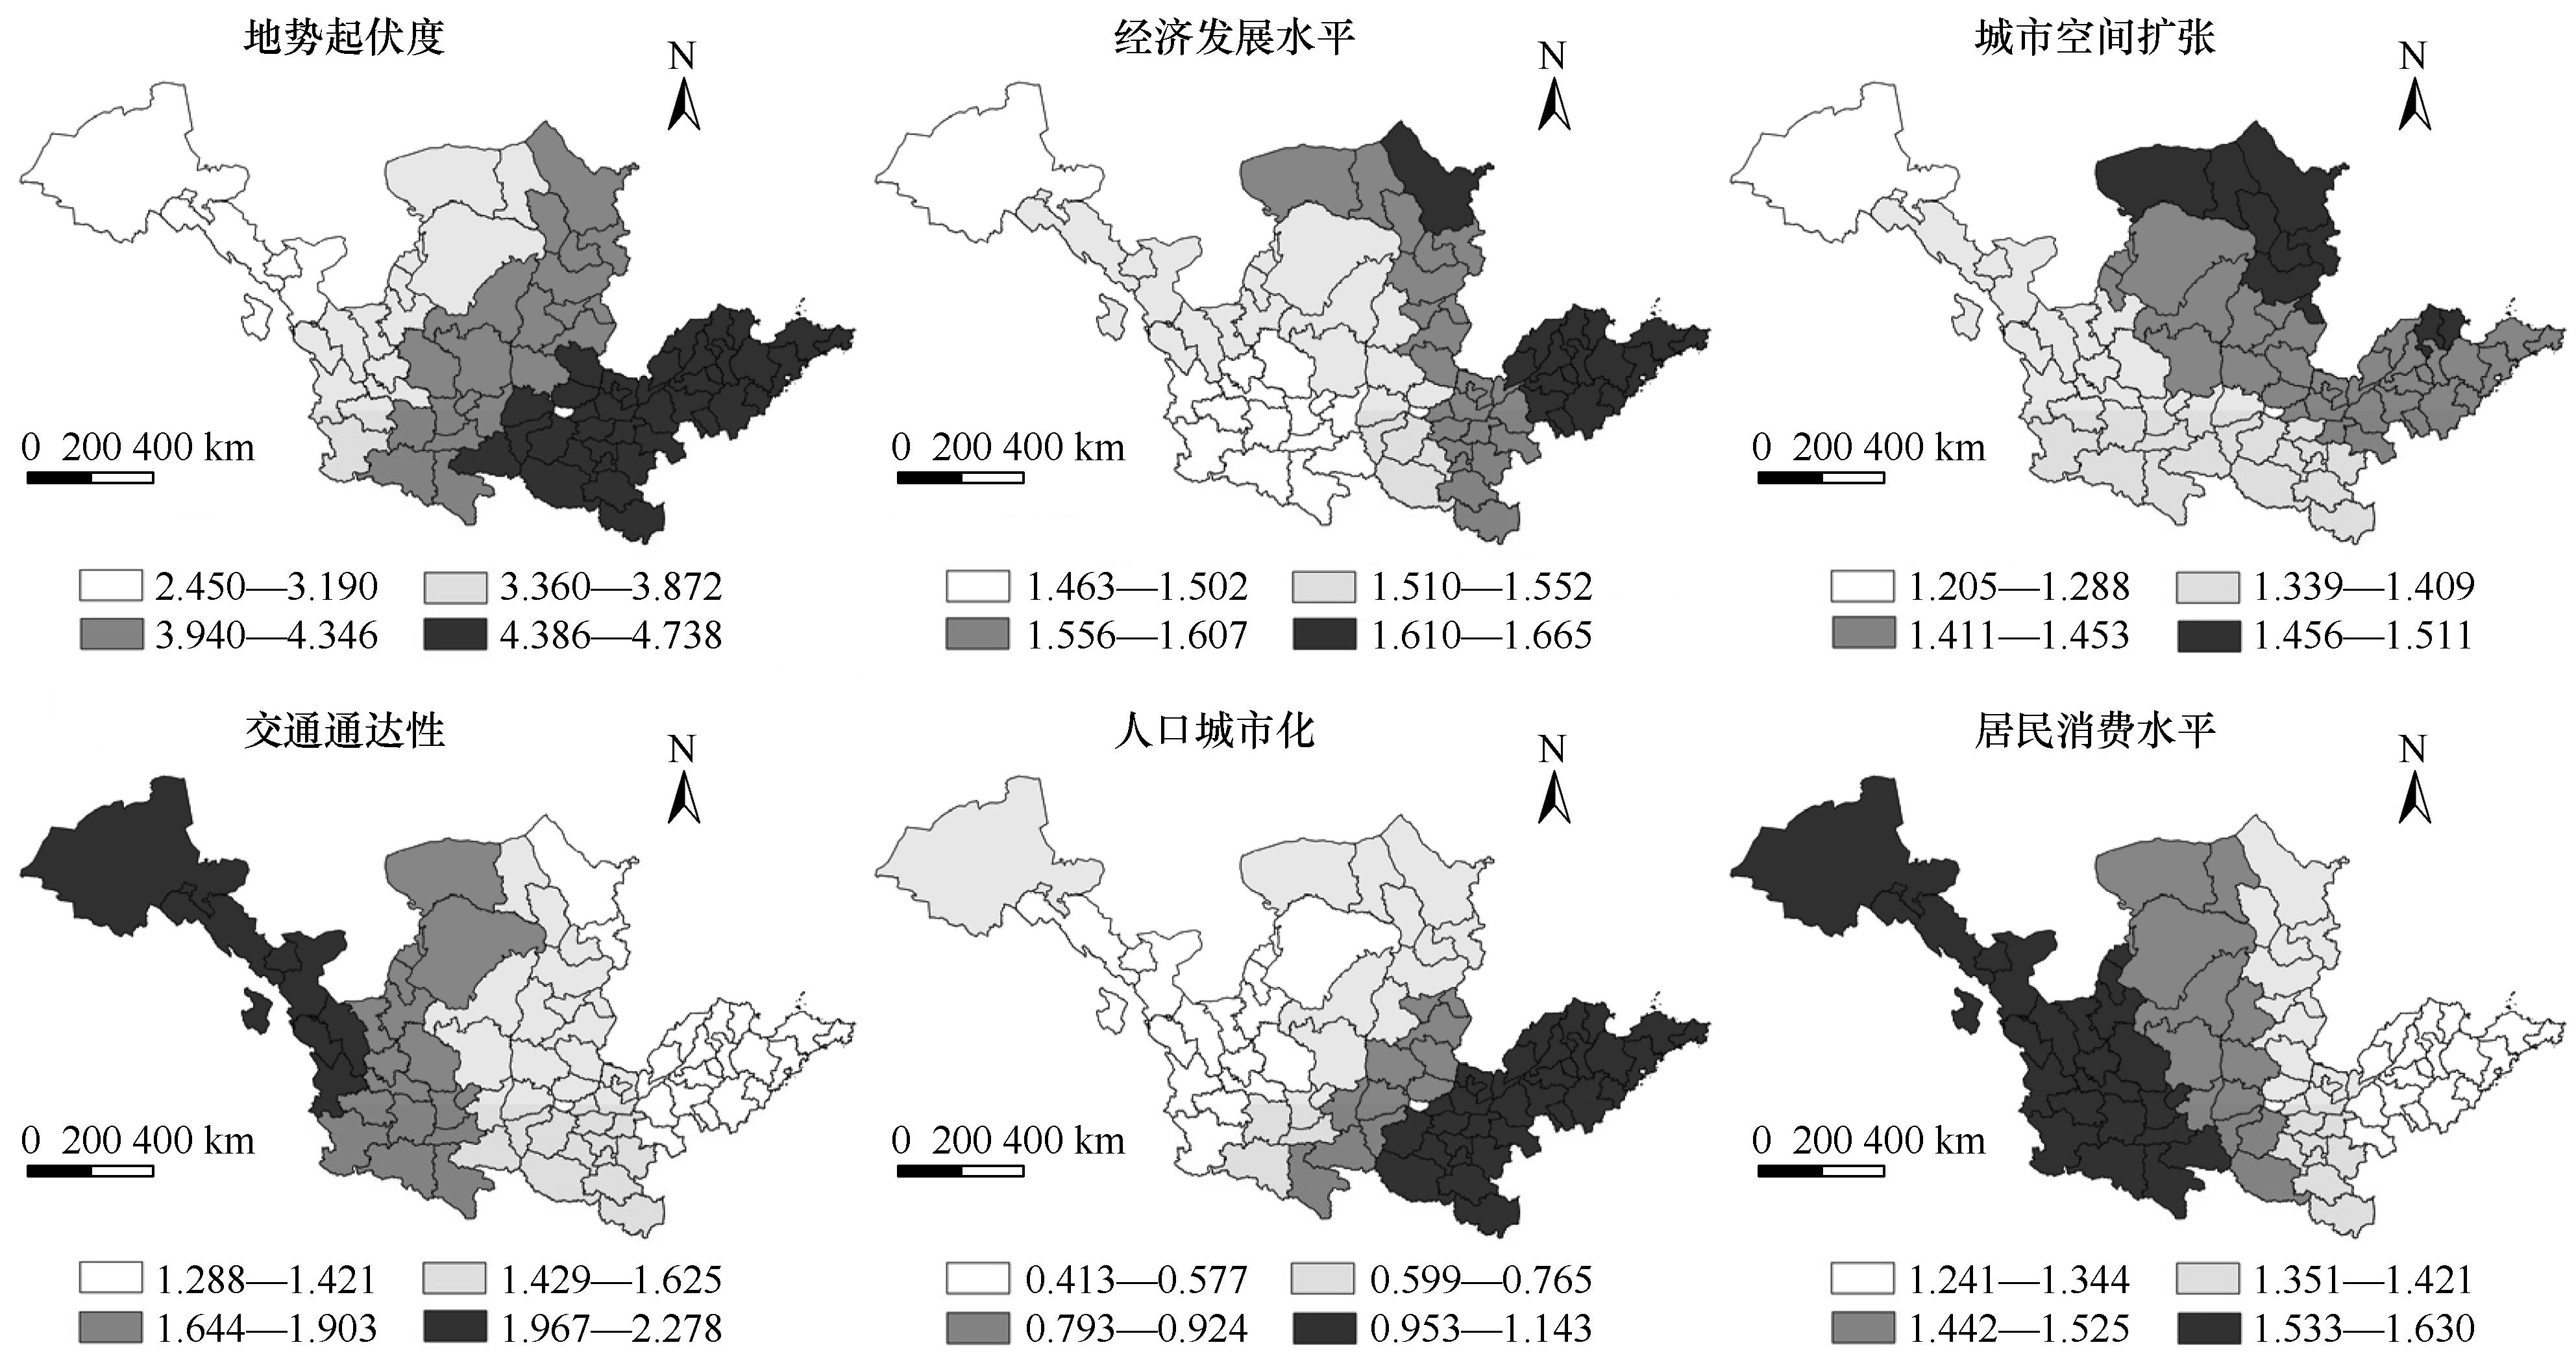
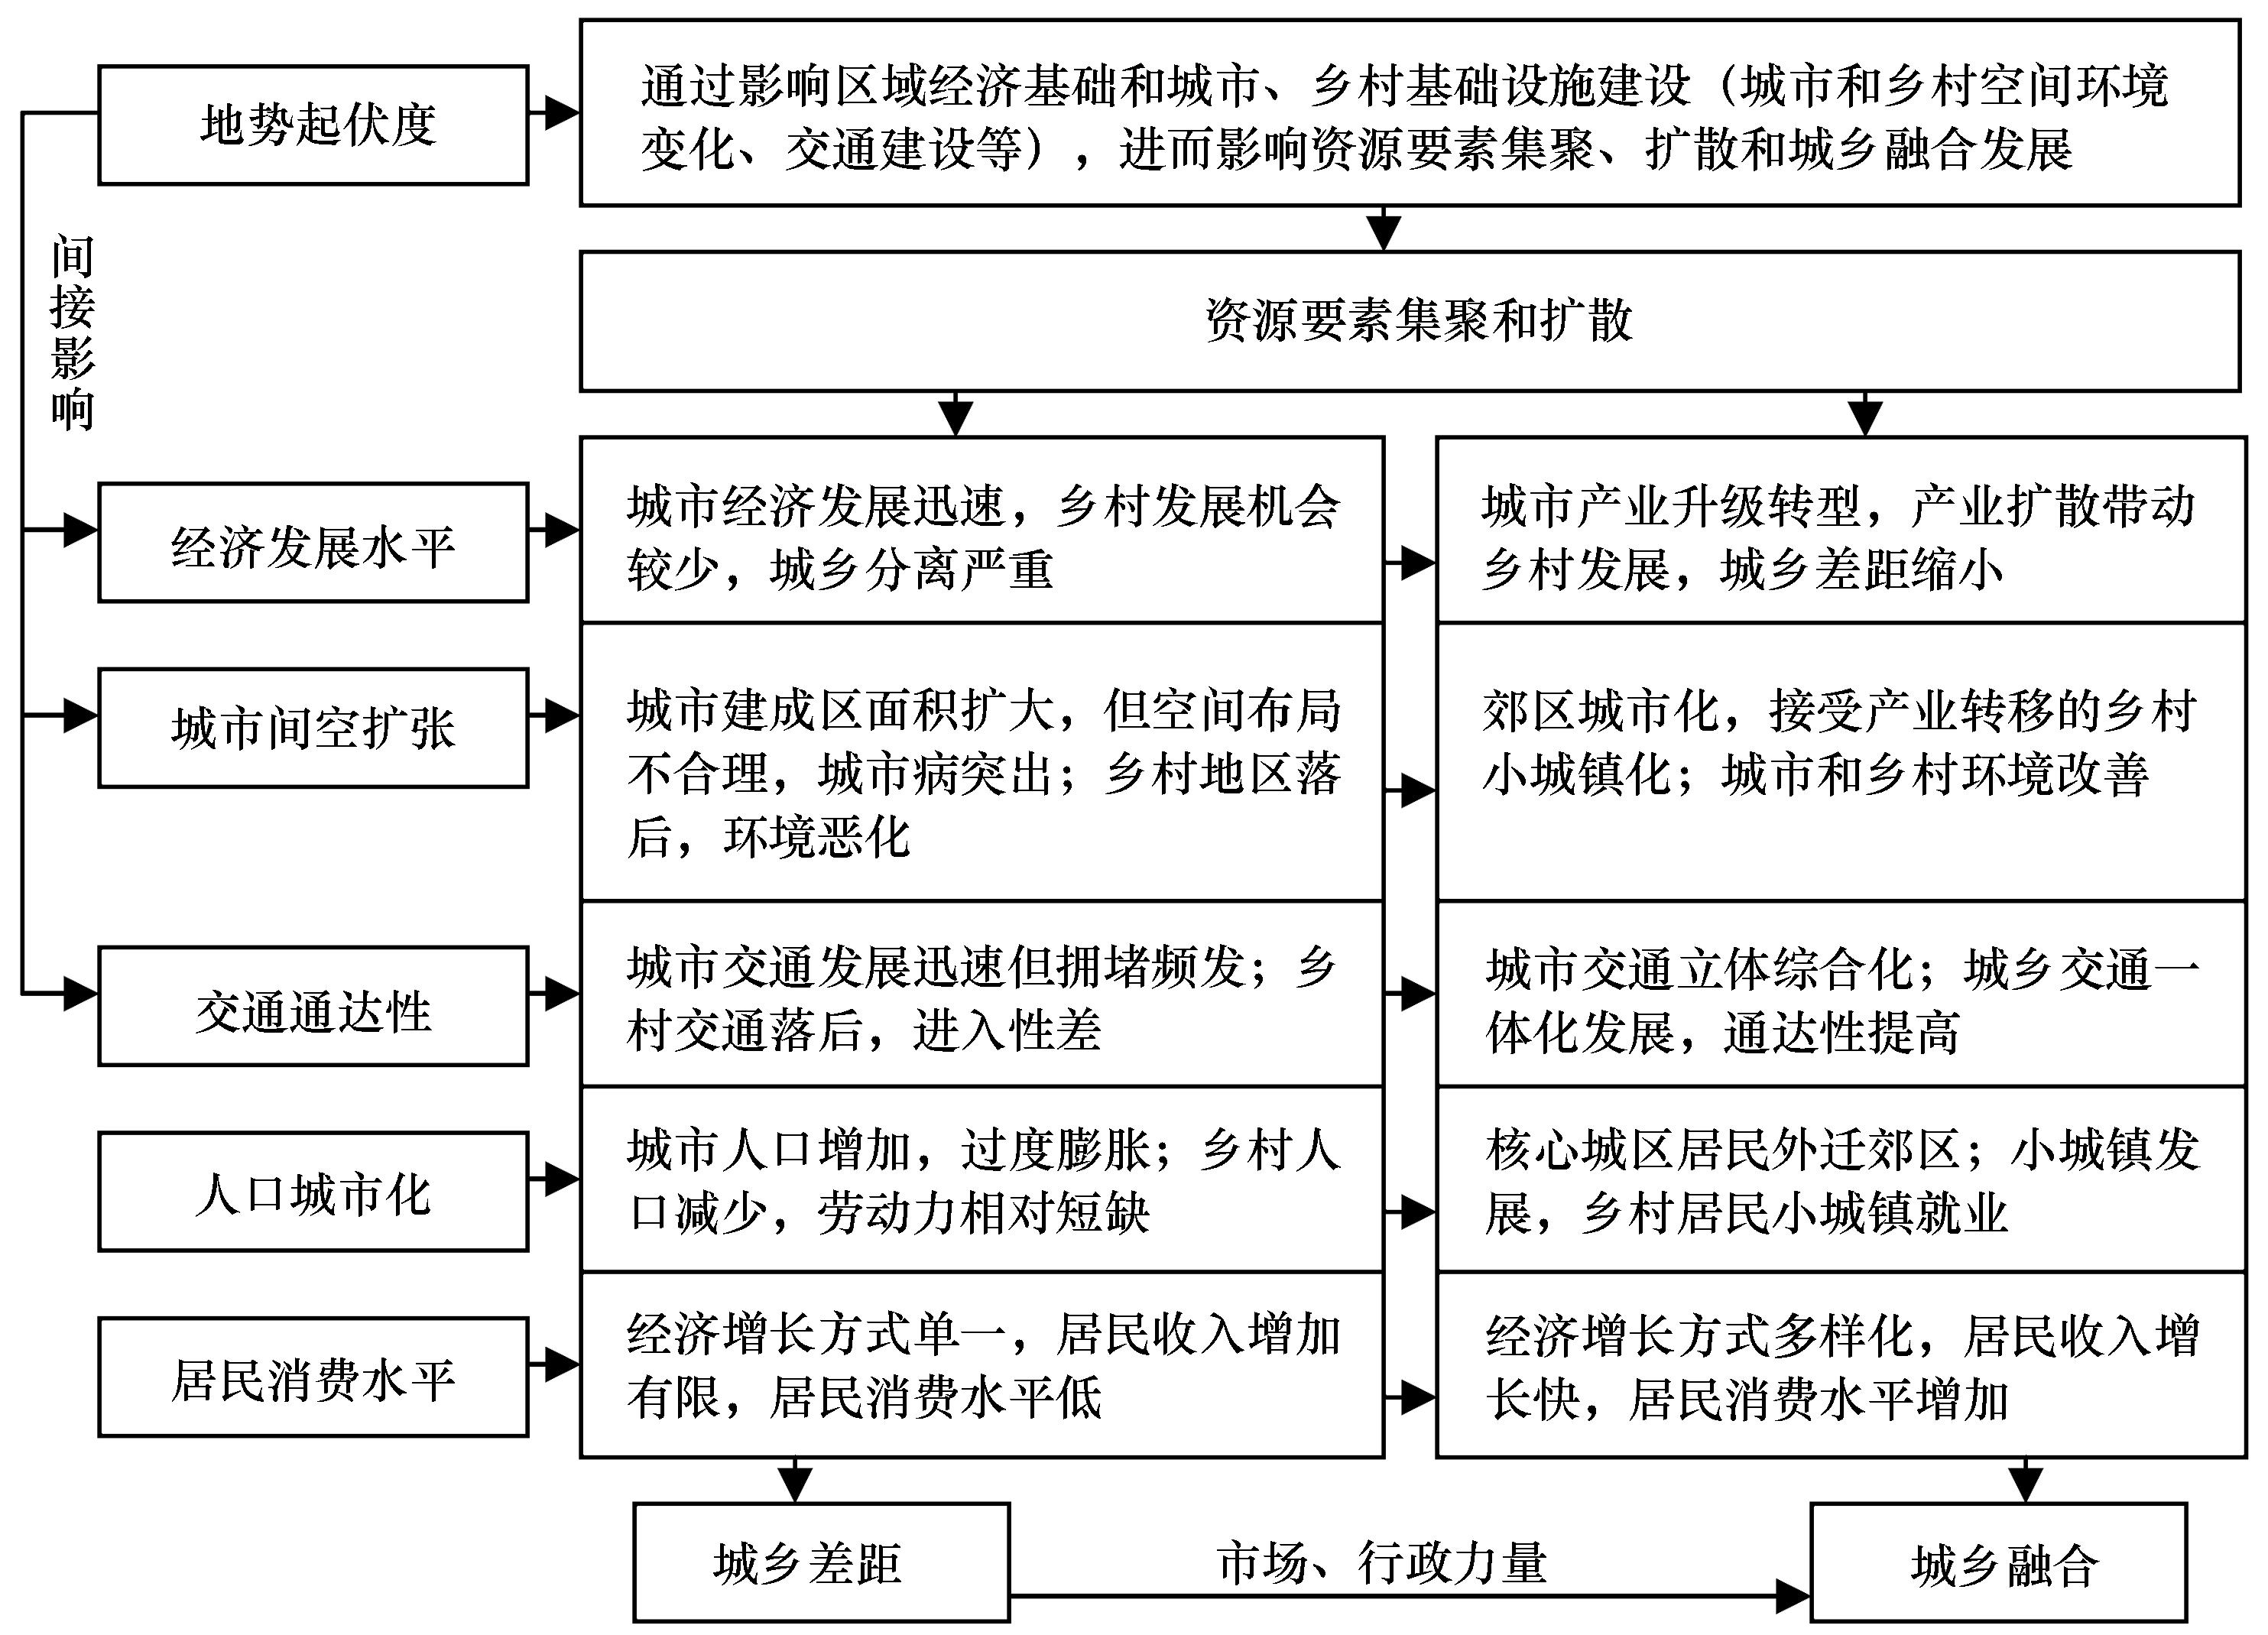
以黄河流域79个地市为研究对象,构建城乡融合发展评价指标体系,使用熵值法、标准差和变差系数、ESDA空间探索性数据分析方法和地理加权回归分析法(GWR),分析了2005—2018年黄河流域城乡融合发展的时空演变特征和动力机制。结果表明:(1)时序演变特征方面,城乡融合系数均值由2005年的0.208提高到2018年的0.416,表明城乡融合水平持续提升,但下游地区均值一直高于中游、上游地区。标准差测度的城乡融合绝对差异由0.073升为0.103,不断缓慢上升;变差系数衡量的相对差异由0.350降为0.248,呈下降趋势。全局莫兰指数表明高于流域城乡融合系数均值的地市倾向于在空间上集聚。(2)空间演变特征方面,黄河流域东部、北部形成高于流域城乡融合系数均值的集中分布区。低于流域城乡融合系数均值的地市呈地域锁定分布。黄河流域地市城乡融合发展水平形成3层次的“核心-边缘”空间结构。(3)地势起伏度、经济发展水平、城市空间扩张、交通通达性、人口城市化、居民消费水平为黄河流域城乡融合发展时空演变主要动力因子。

关键词: 黄河流域, 城乡融合发展, 时空演变, 地理加权回归分析

Abstract:

By taking 79 prefecture-level cities in the Yellow River Basin as the research object, constructing an urban-rural integration development evaluation index system and using entropy method, standard deviation and coefficient of variation, ESDA spatial exploratory data analysis method and geographic weighted regression analysis (GWR), this paper analyzed urban-rural integration development's spatio-temporal evolution characteristics and dynamic mechanism from 2005 to 2018 in the Yellow River Basin. The results showed that: (1)The average urban-rural integration coefficient increased from 0.208 in 2005 to 0.416 in 2018, indicating that the level of urban-rural integration continued to increase, but the average value of downstream areas has always been higher than that of midstream and upstream areas; the absolute difference in urban-rural integration measured by standard deviation rose slowly from 0.073 to 0.103; and the relative difference measured by variation coefficient fell from 0.350 to 0.248, showing a downward trend; Global Moran's I showed that that prefecture level cities higher than the basin's urban-rural integration coefficient average tended to cluster in space. (2)In terms of spatial evolution characteristics: the eastern and northern parts of the Yellow River Basin formed a concentrated distribution area higher than the urban-rural integration coefficient average; The prefecture level cities lower than the basin's urban-rural integration coefficient average showed a regional locking distribution; the urban-rural integration development level in the Yellow River Basin prefecture-level cities formed 3 hierarchical "core-periphery" spatial structure. (3)Geographically weighted regression analysis showed that: terrain undulations, economic development level, urban spatial expansion, traffic accessibility, population urbanization, residents consumption level were the main driving factors for the urban-rural integration's spatio-temporal evolution in the Yellow River Basin.

Key words: Yellow River Basin, urban-rural integration development, spatio-temporal evolution, geographically weighted regression analysis

中图分类号: