img

官方微信

高级检索

中国沙漠 ›› 2022, Vol. 42 ›› Issue (4): 71-80.DOI: 10.7522/j.issn.1000-694X.2022.00002

• • 上一篇    下一篇

基于标准化降水蒸散指数(SPEI)的毛乌素沙地19812020年干旱特征研究

廉泓林1(), 韩雪莹1, 刘雅莉2, 韩雨晴2, 杨文斌2, 熊伟2()   

  1. 1.内蒙古农业大学 沙漠治理学院,内蒙古 呼和浩特 010019
    2.中国林业科学研究院 生态保护与修复研究所/荒漠化研究所,北京 100091
  • 收稿日期:2021-12-14 修回日期:2022-01-12 出版日期:2022-07-20 发布日期:2022-08-29
  • 通讯作者: 熊伟
  • 作者简介:熊伟(E-mail: xwcaf@163.com
    廉泓林(1996—),男,内蒙古通辽人,硕士研究生,主要从事荒漠化防治研究。E-mail: lhl960716@163.com
  • 基金资助:
    中央级公益性科研院所基本科研业务费专项资金项目(CAFYBB2020ZB007);内蒙古自治区科技重大专项(2019ZD00301-02);国家重点研发计划项目(2018YFC0507103);国家自然科学基金项目(41771306)

Study on spatiotemporal characteristics of atmospheric drought from 1981 to 2020 in the Mu Us Sandy Land of China based on SPEI index

Honglin Lian1(), Xueying Han1, Yali Liu2, Yuqing Han2, Wenbin Yang2, Wei Xiong2()   

  1. 1.College of Desert Control Science and Engineering,Inner Mongolia Agricultural University,Hohhot 010019,China
    2.Institute of Ecological Protection and Restoration/Institute of Desertification Studies,Chinese Academy of Forestry,Beijing 100091,China
  • Received:2021-12-14 Revised:2022-01-12 Online:2022-07-20 Published:2022-08-29
  • Contact: Wei Xiong

摘要:

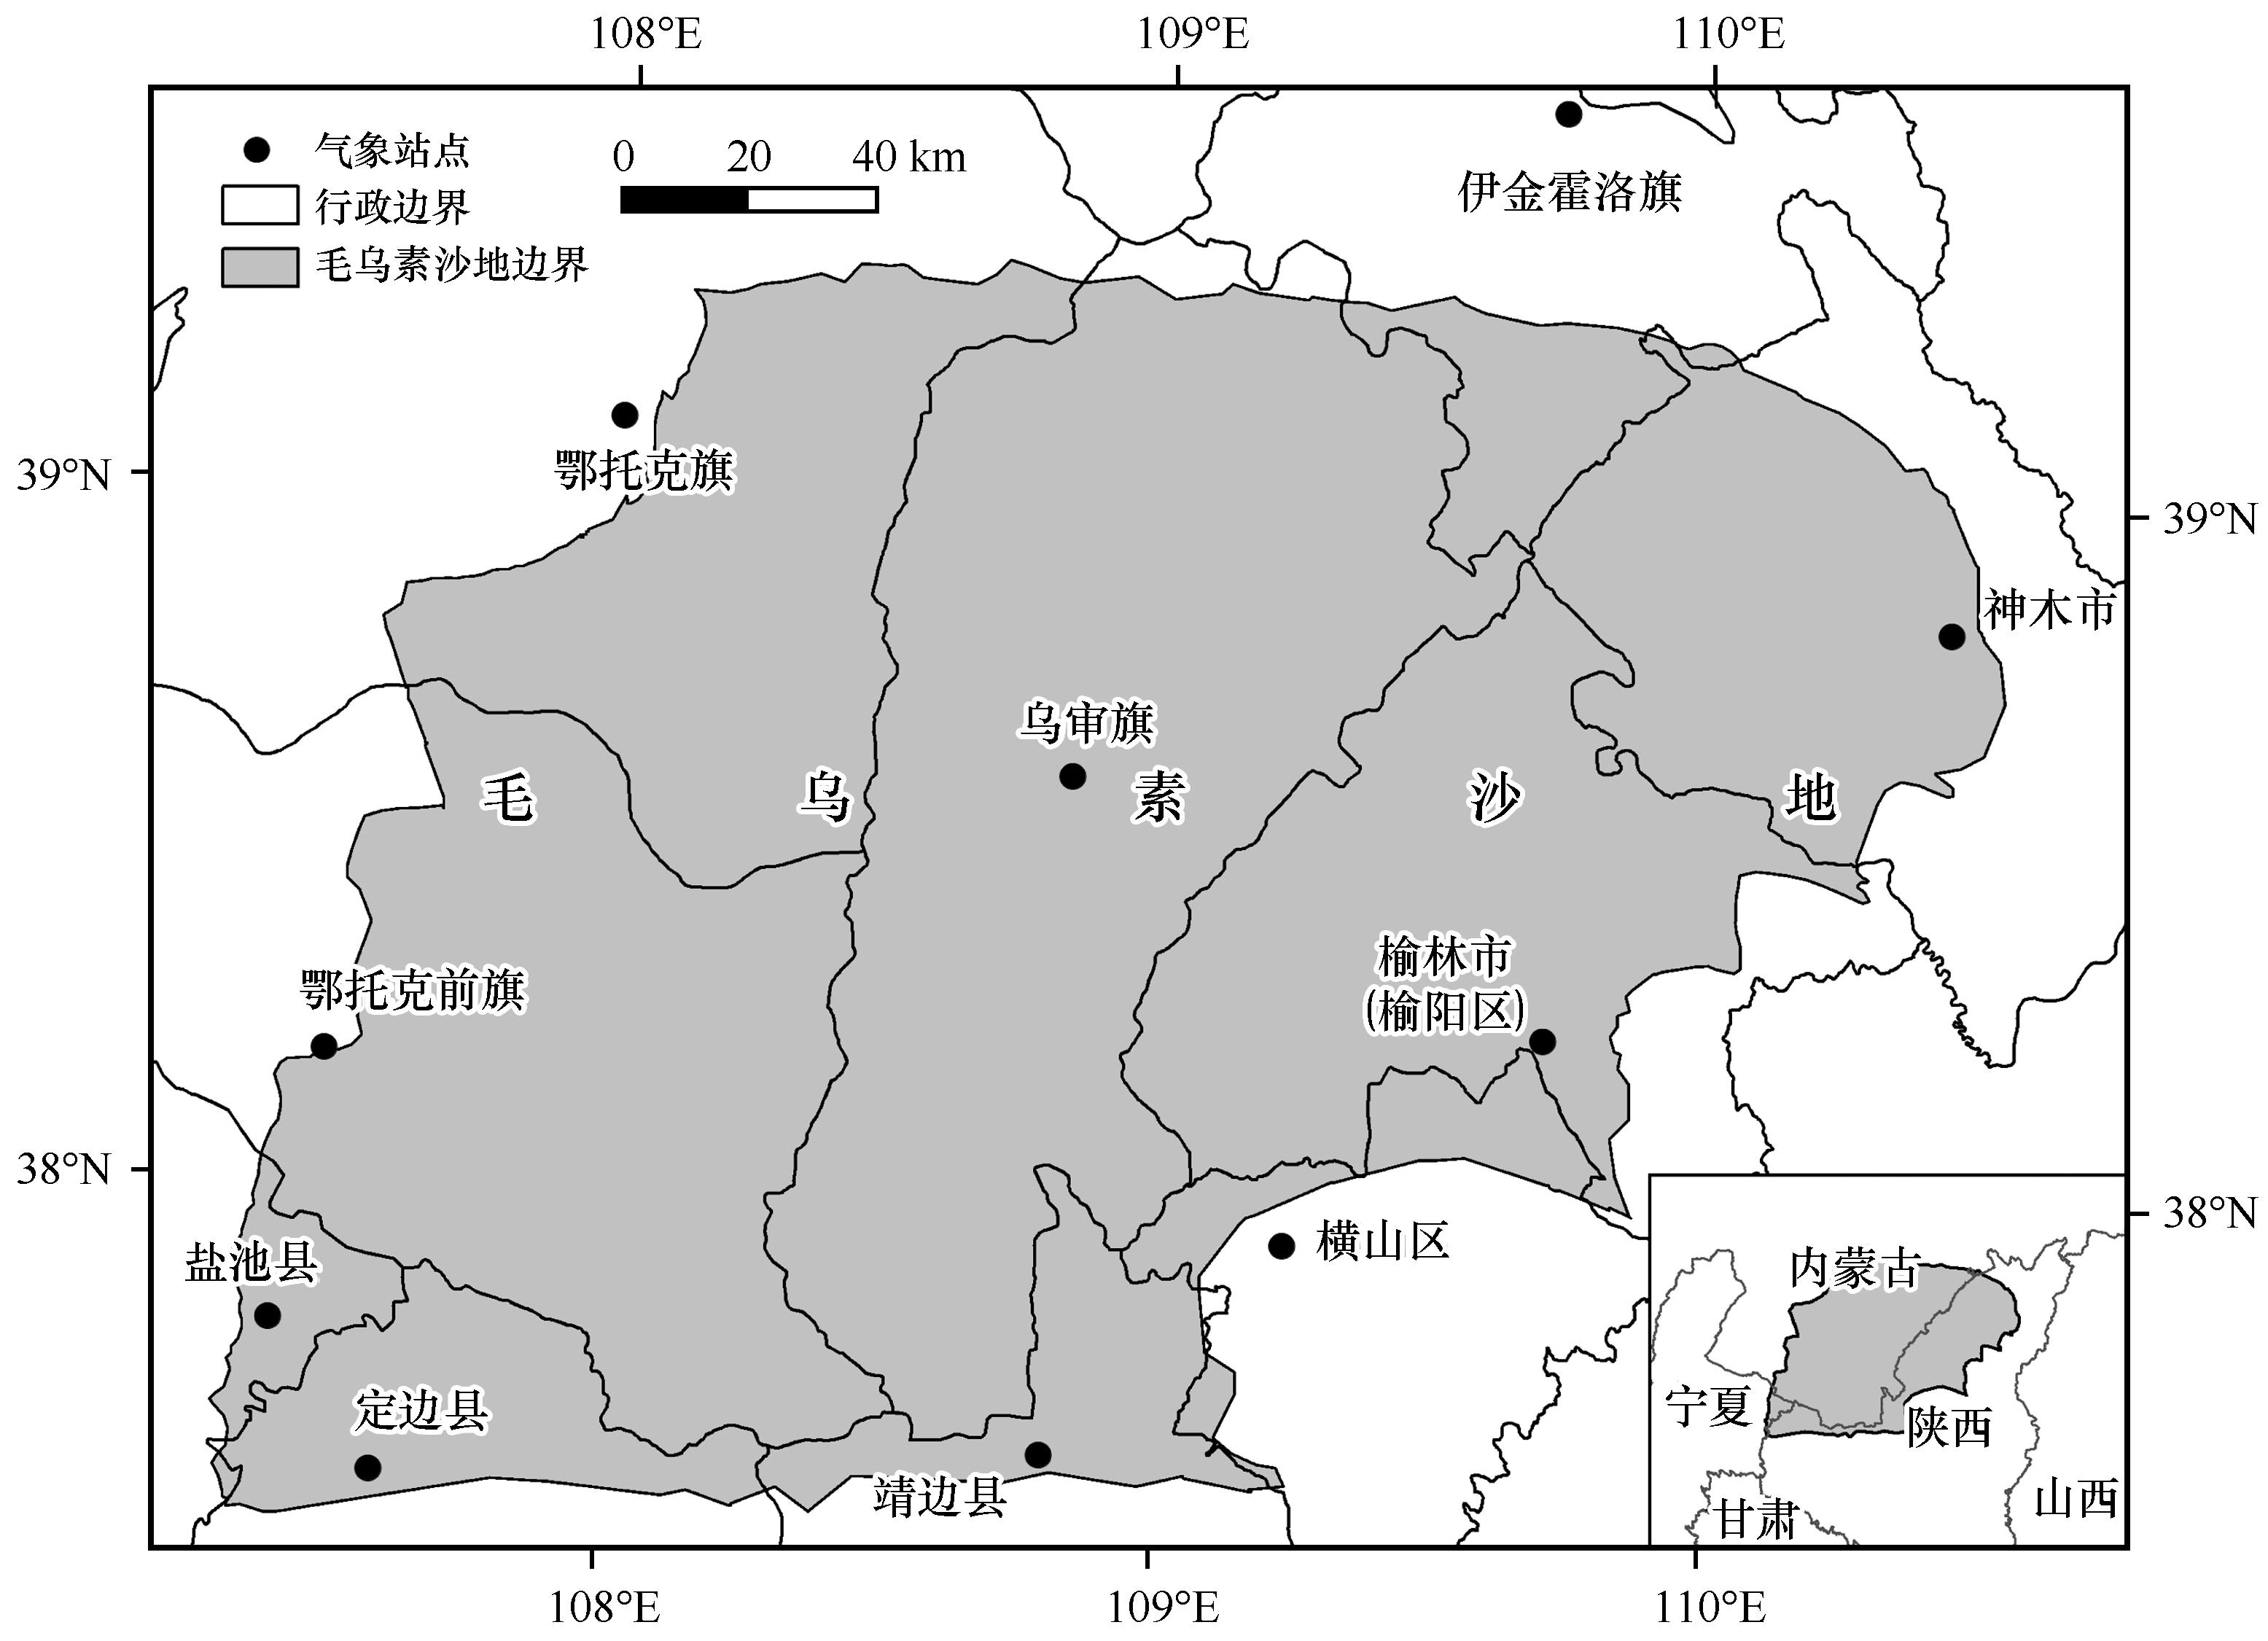
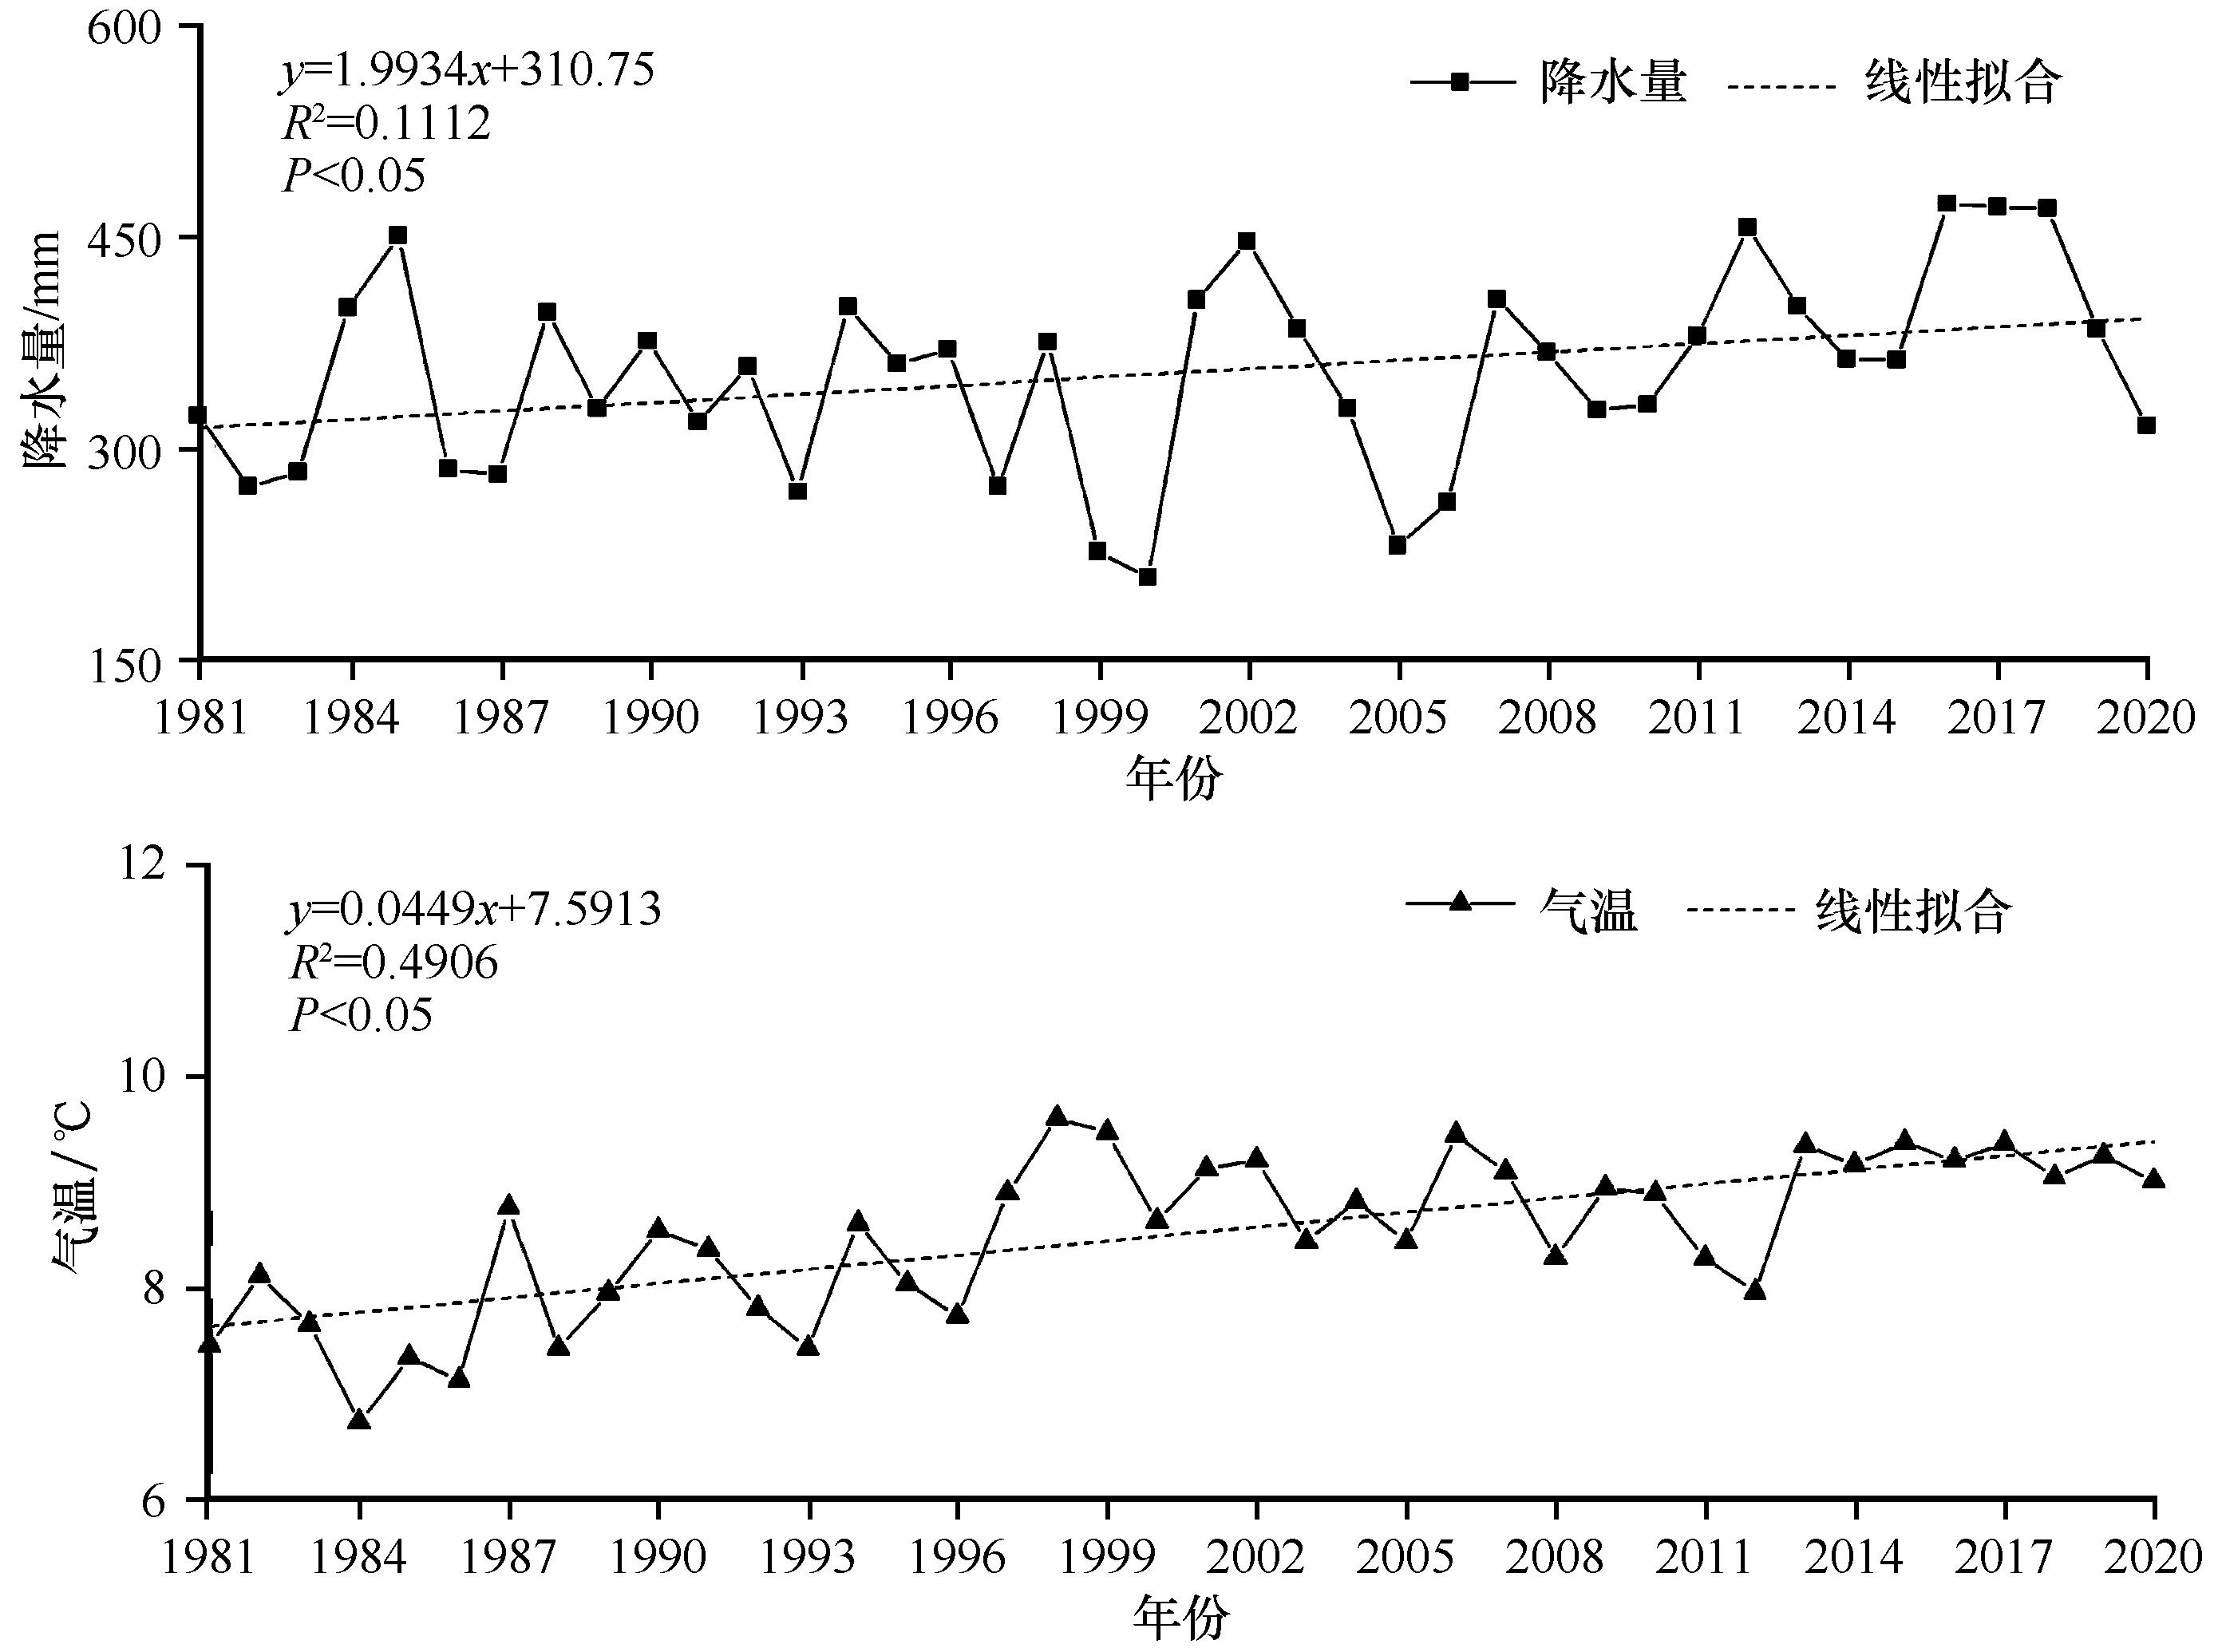
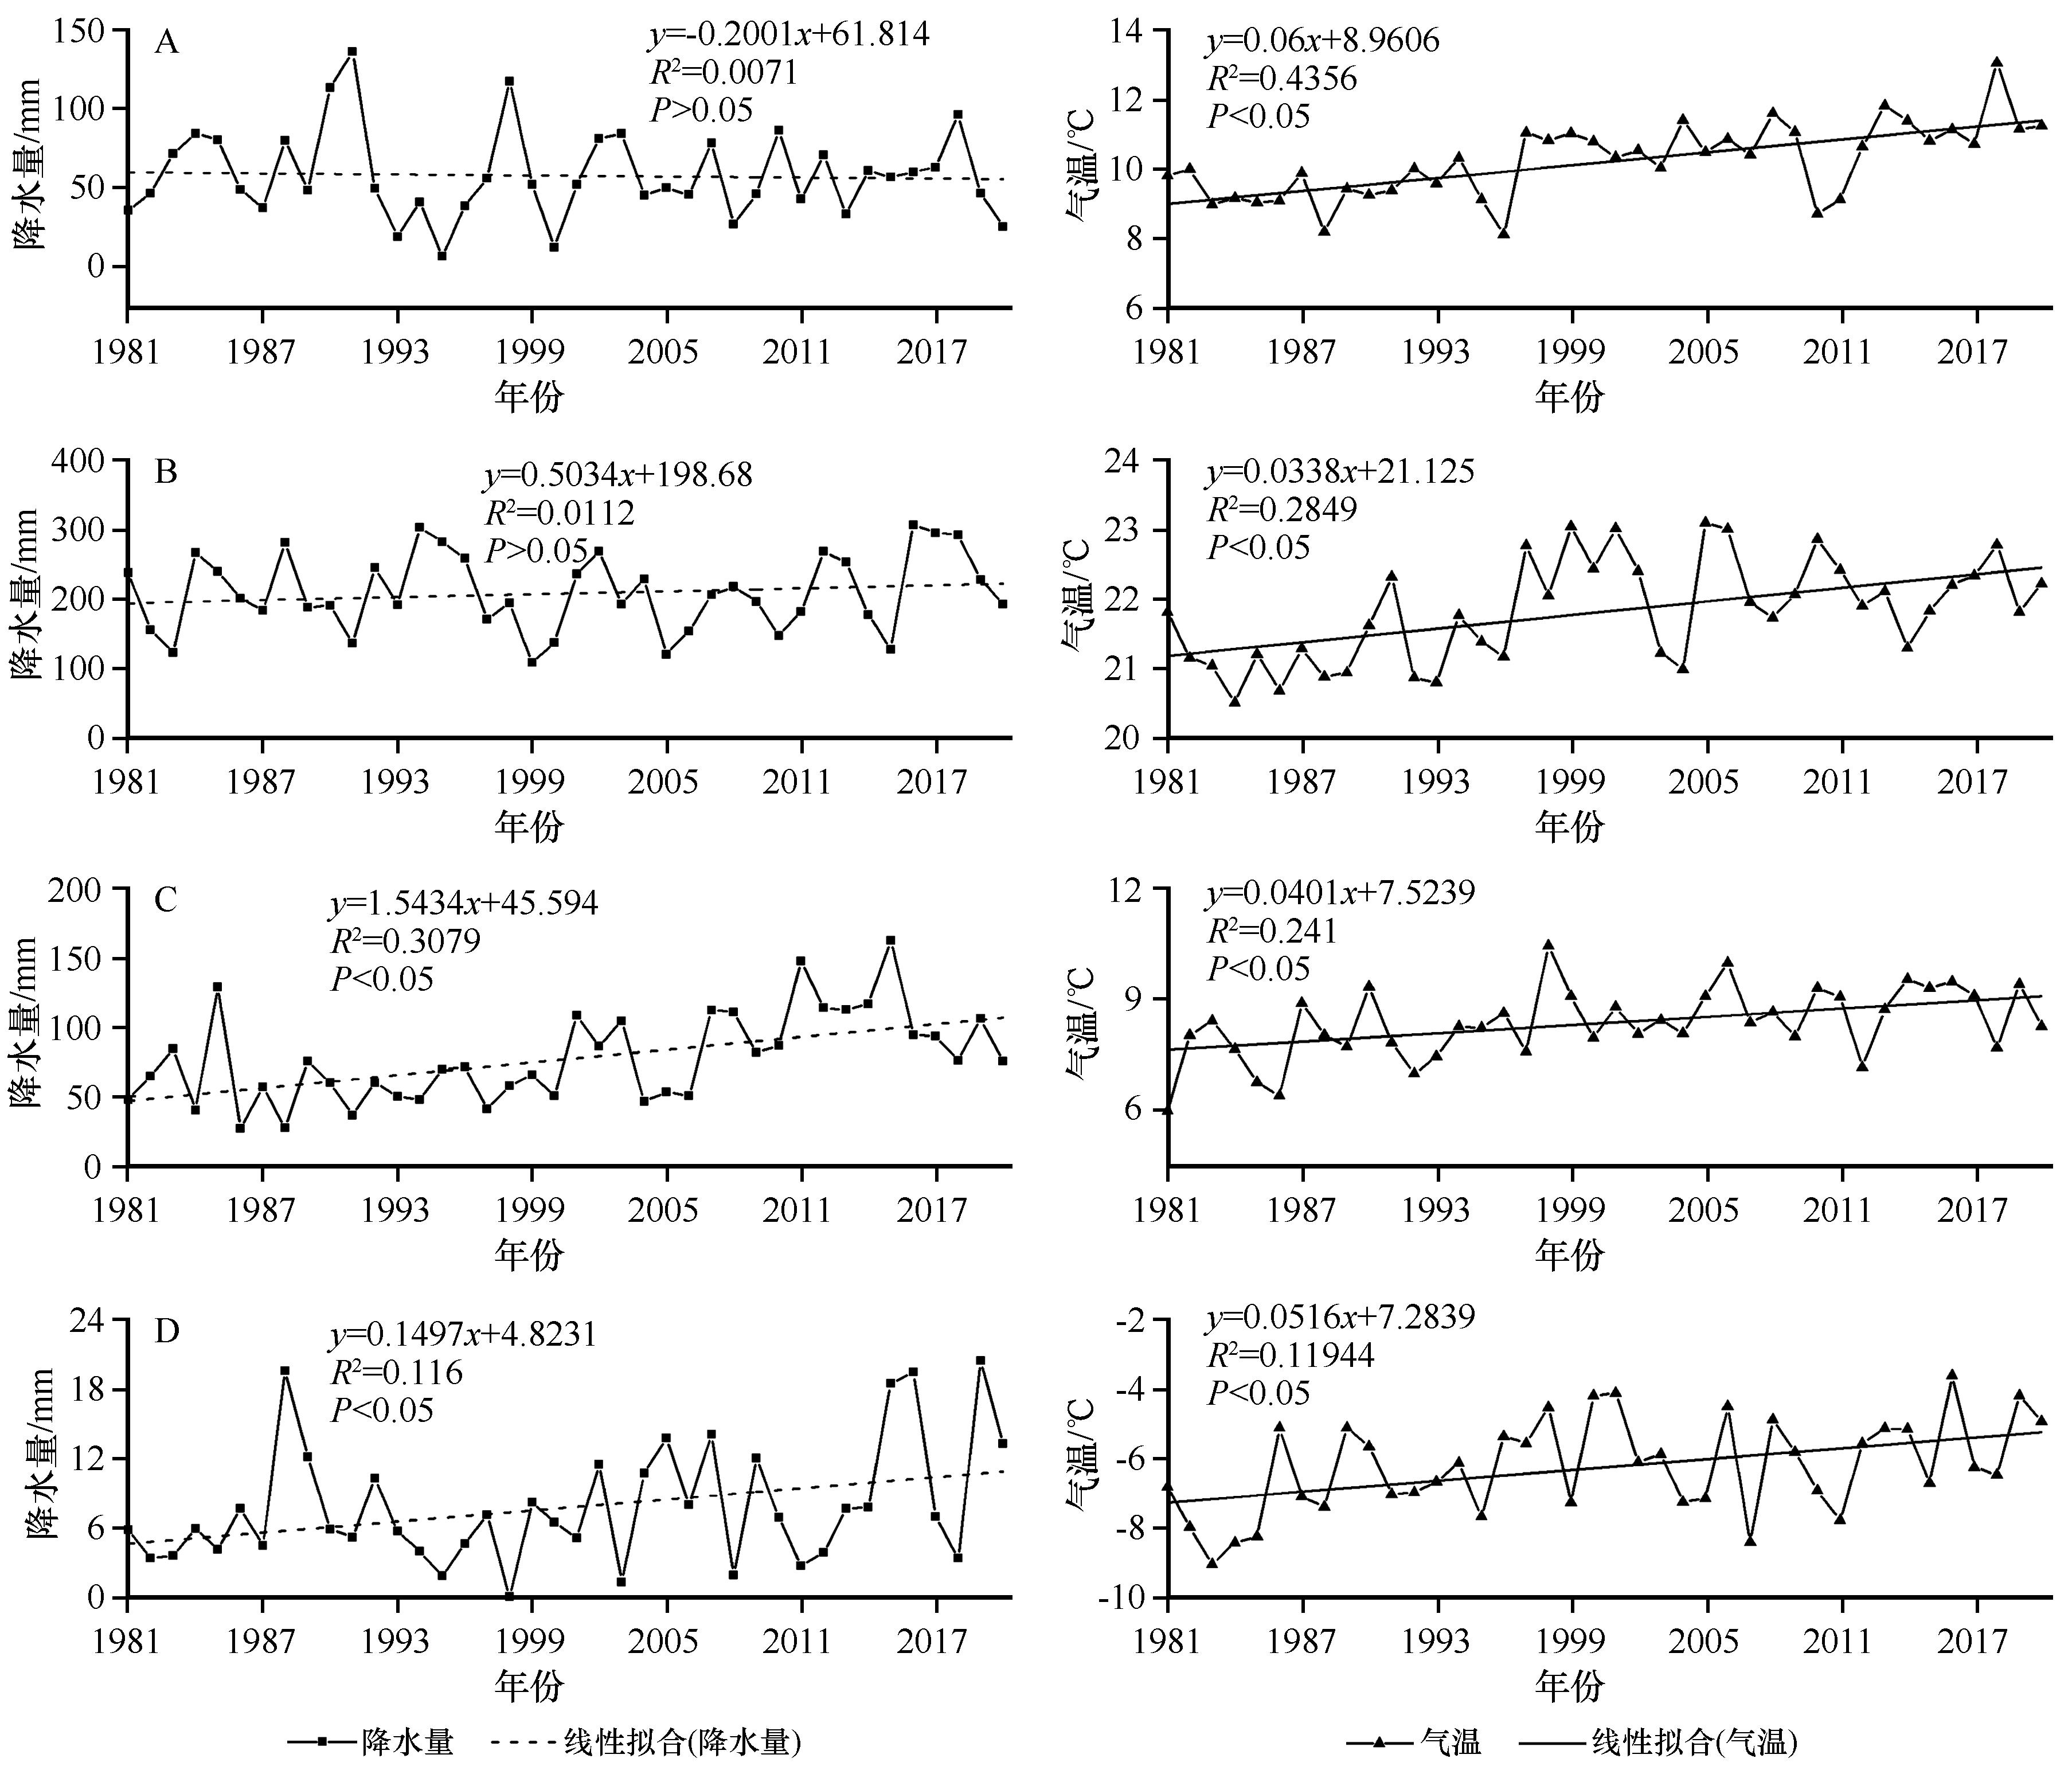
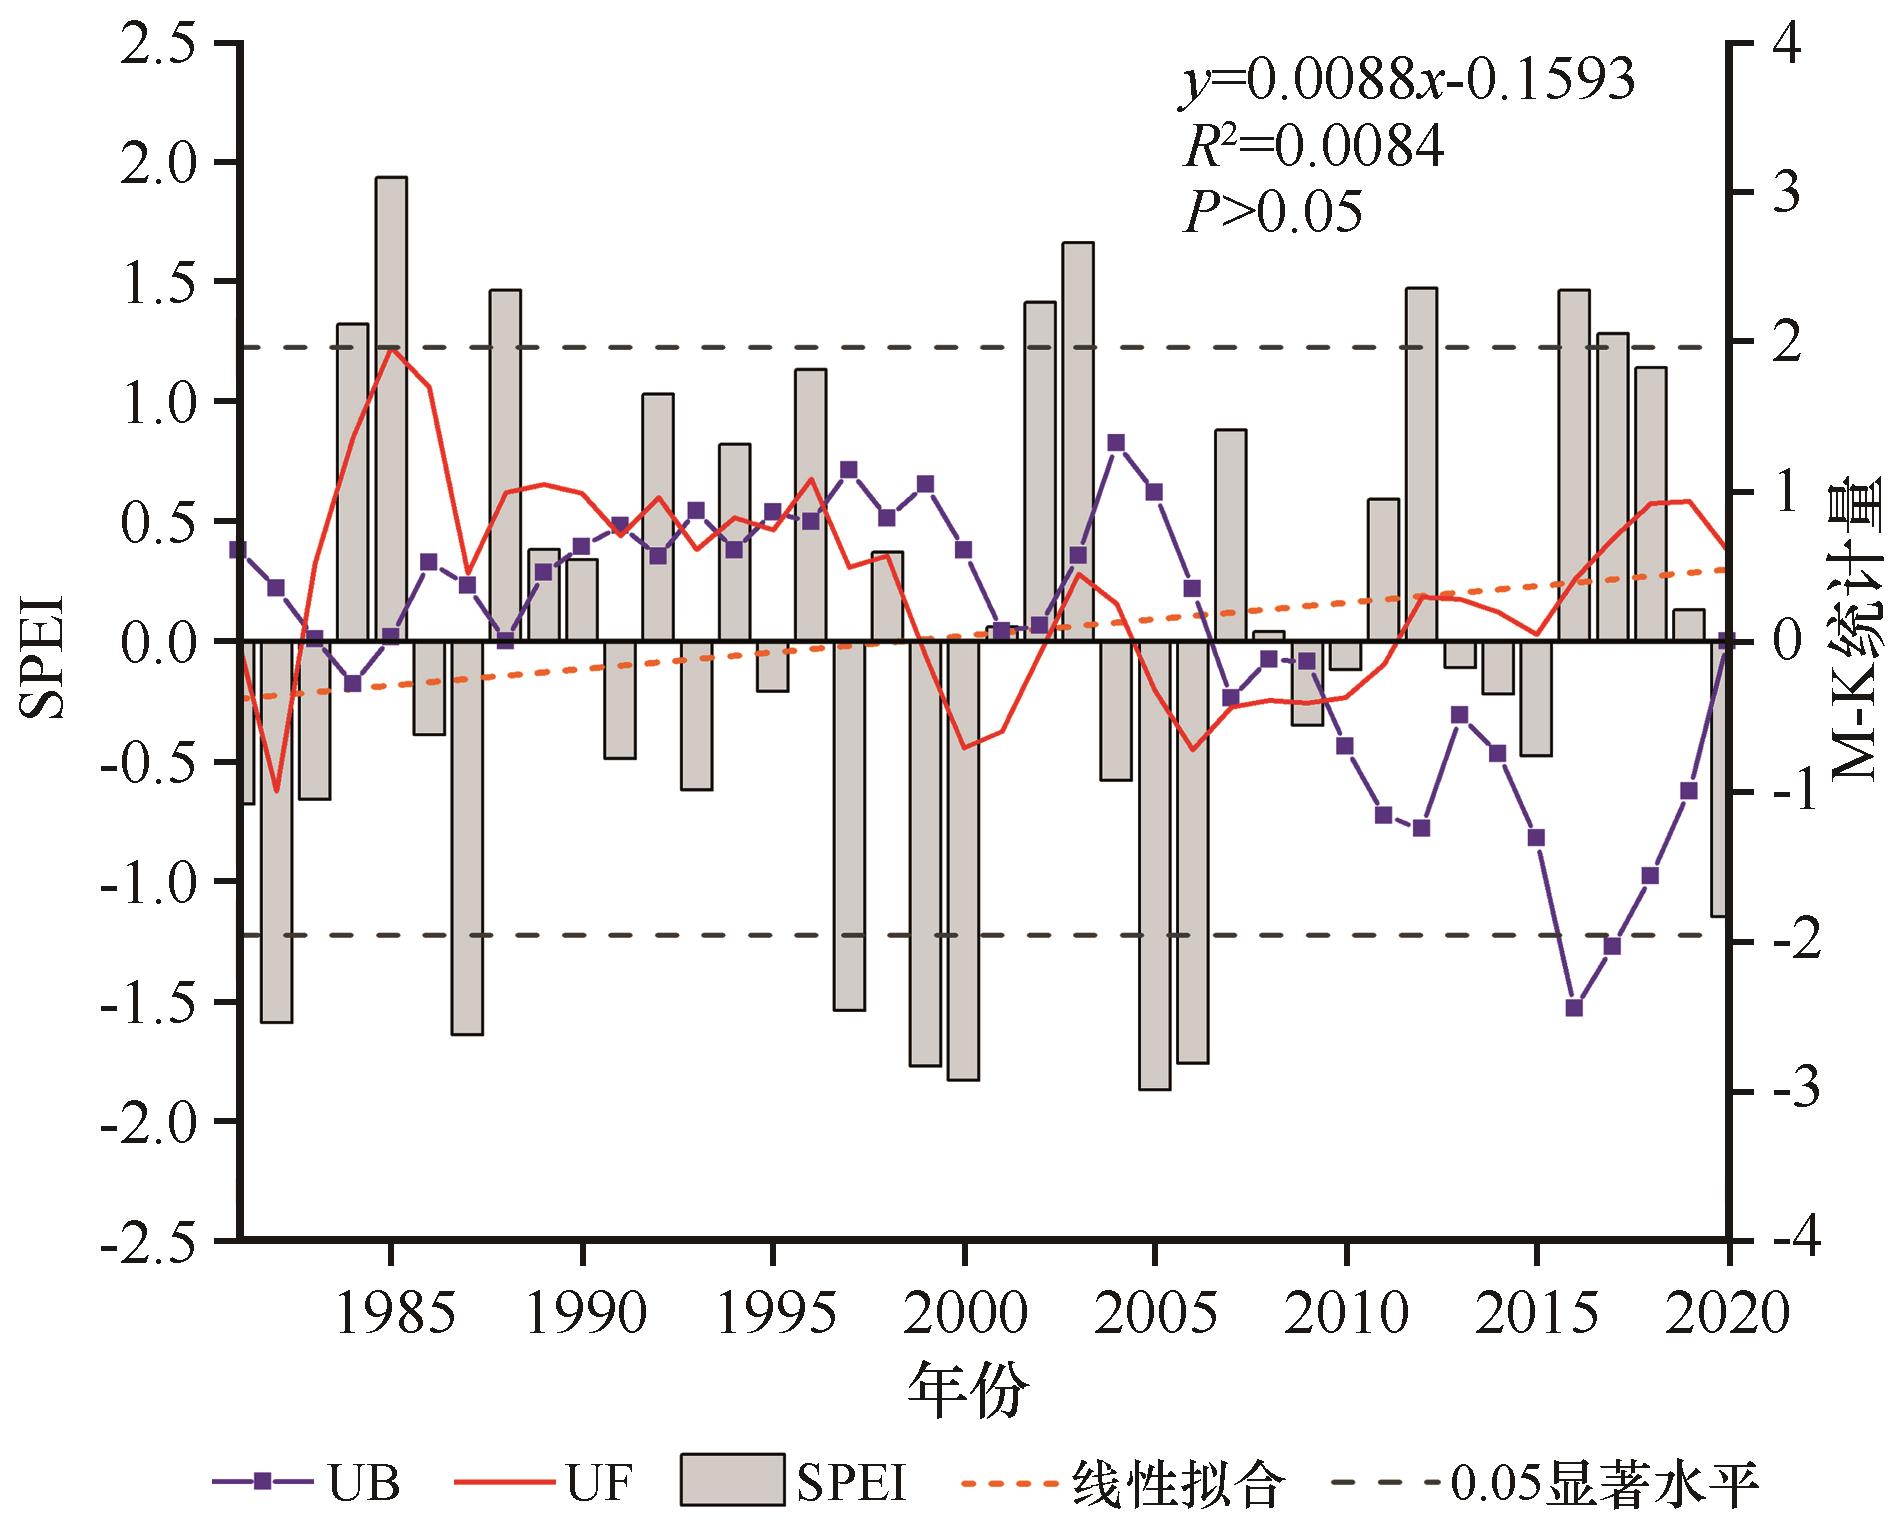
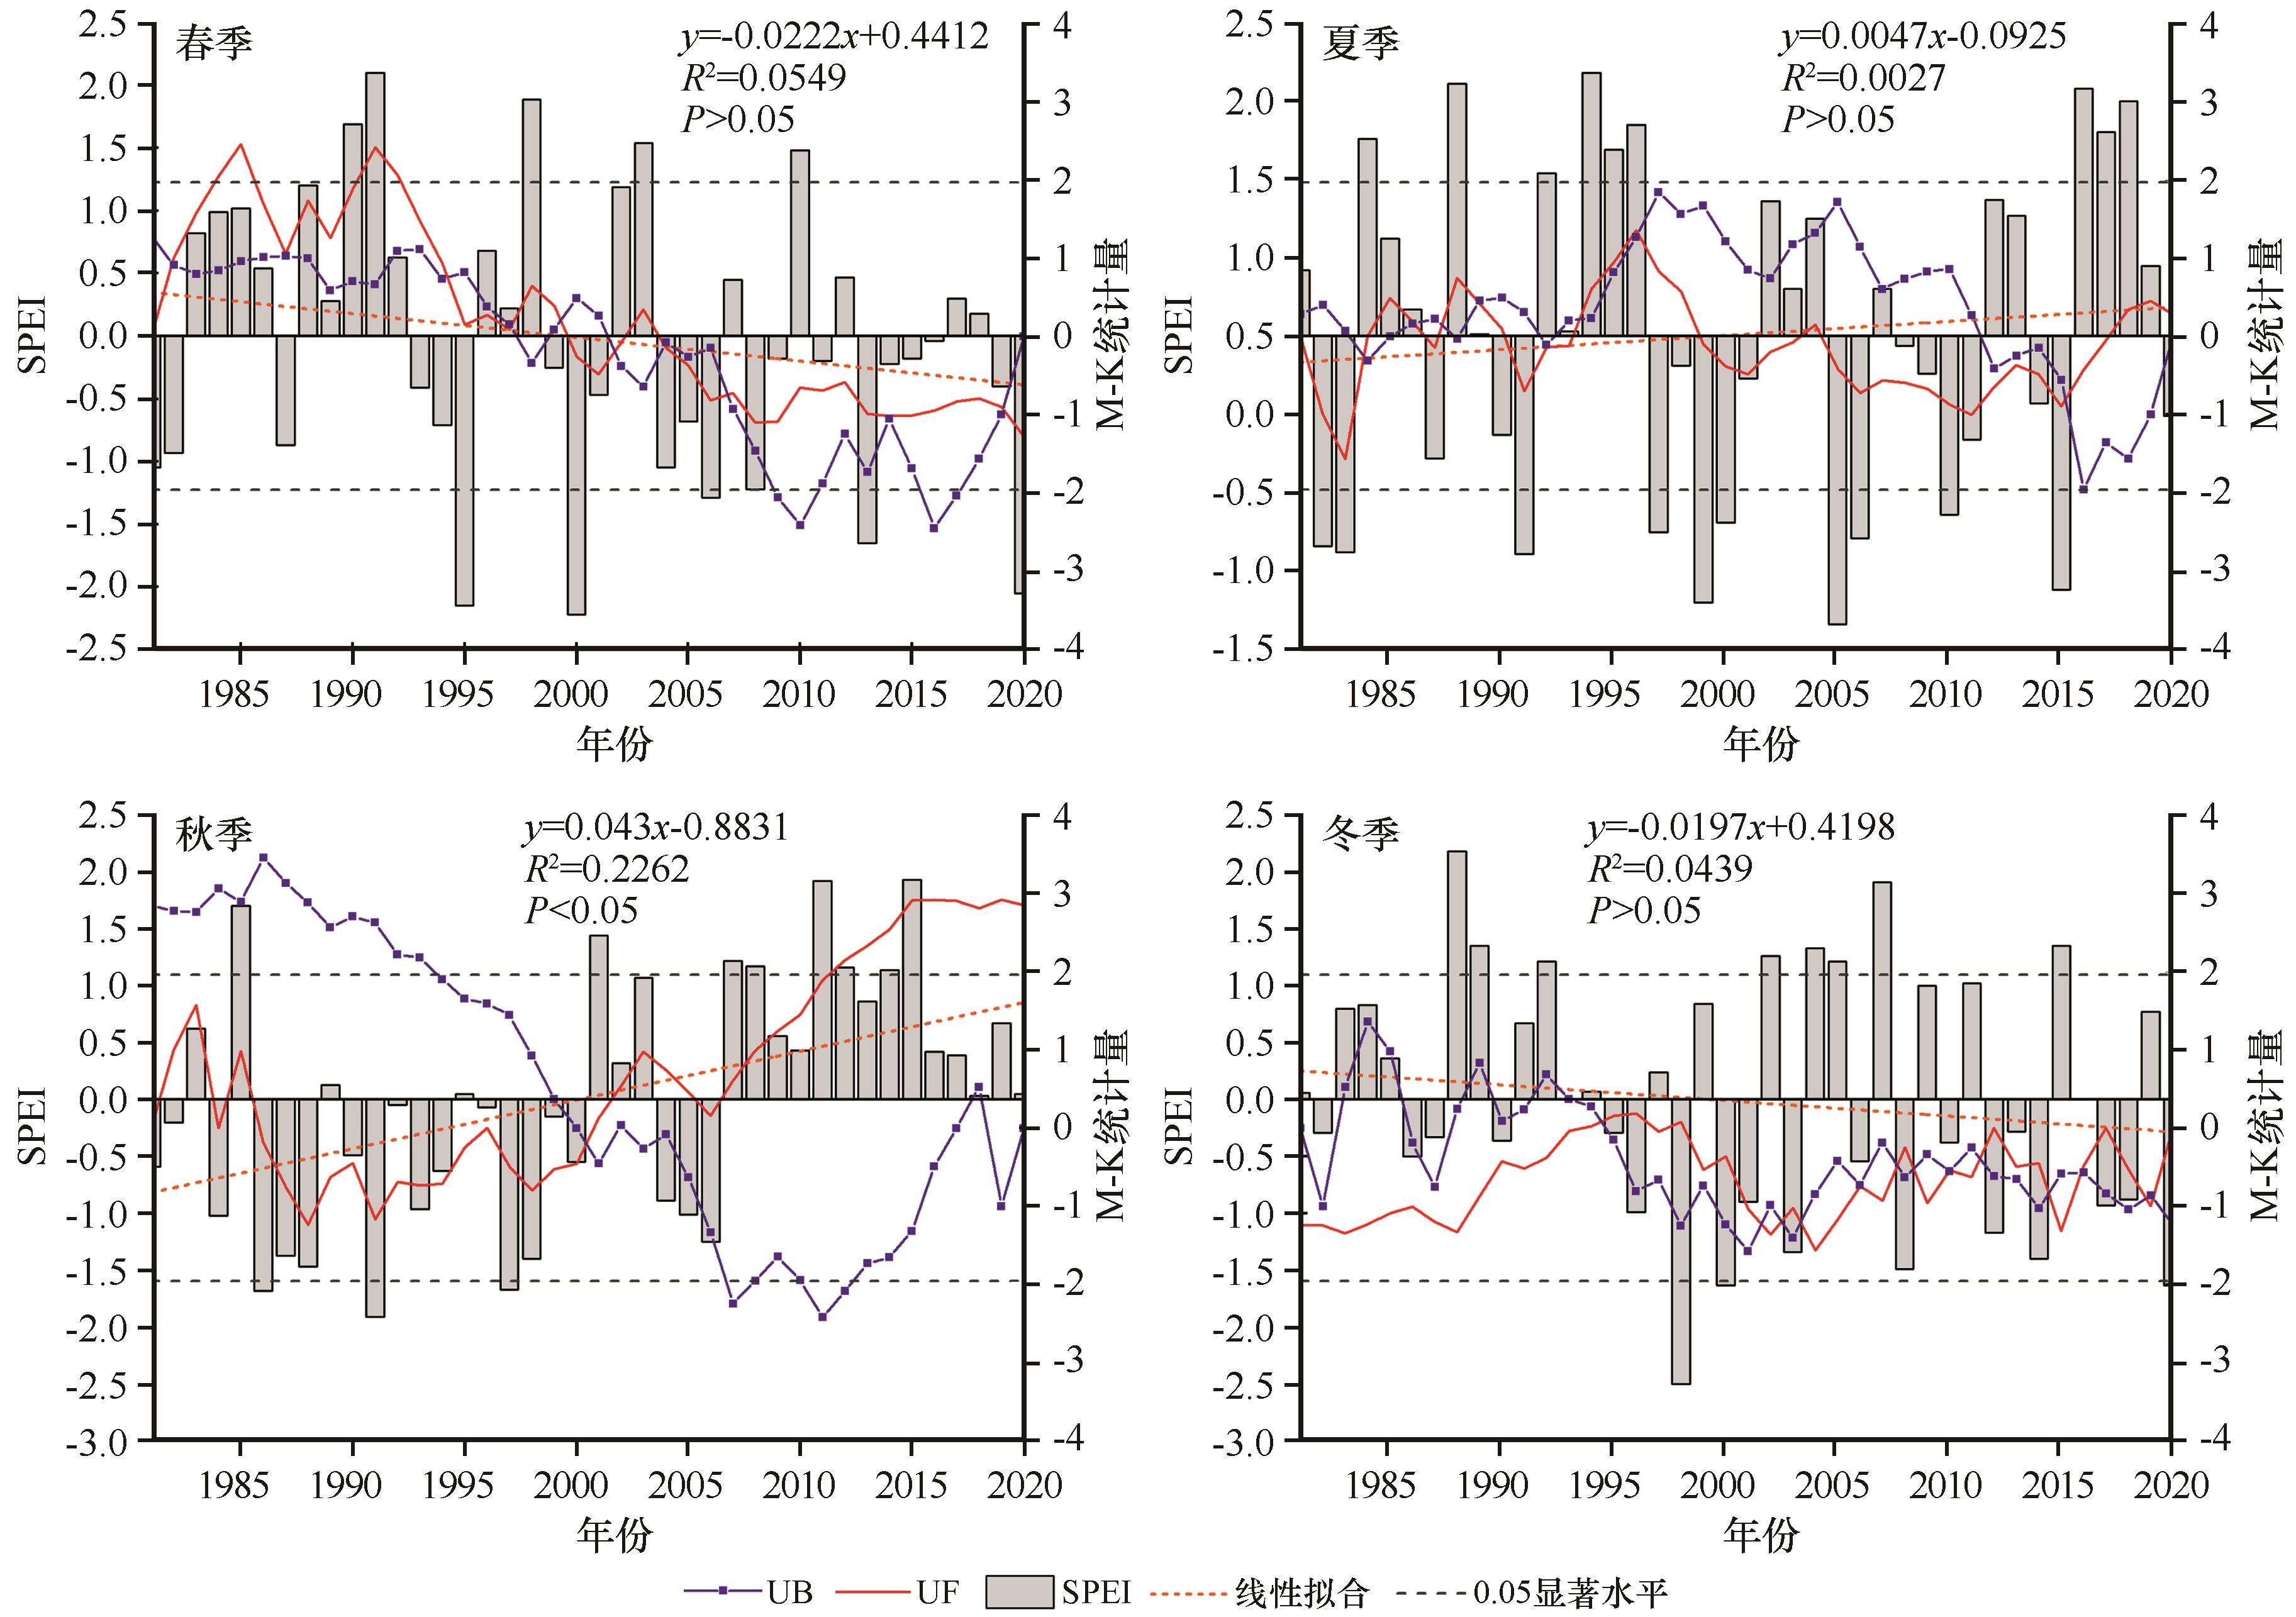
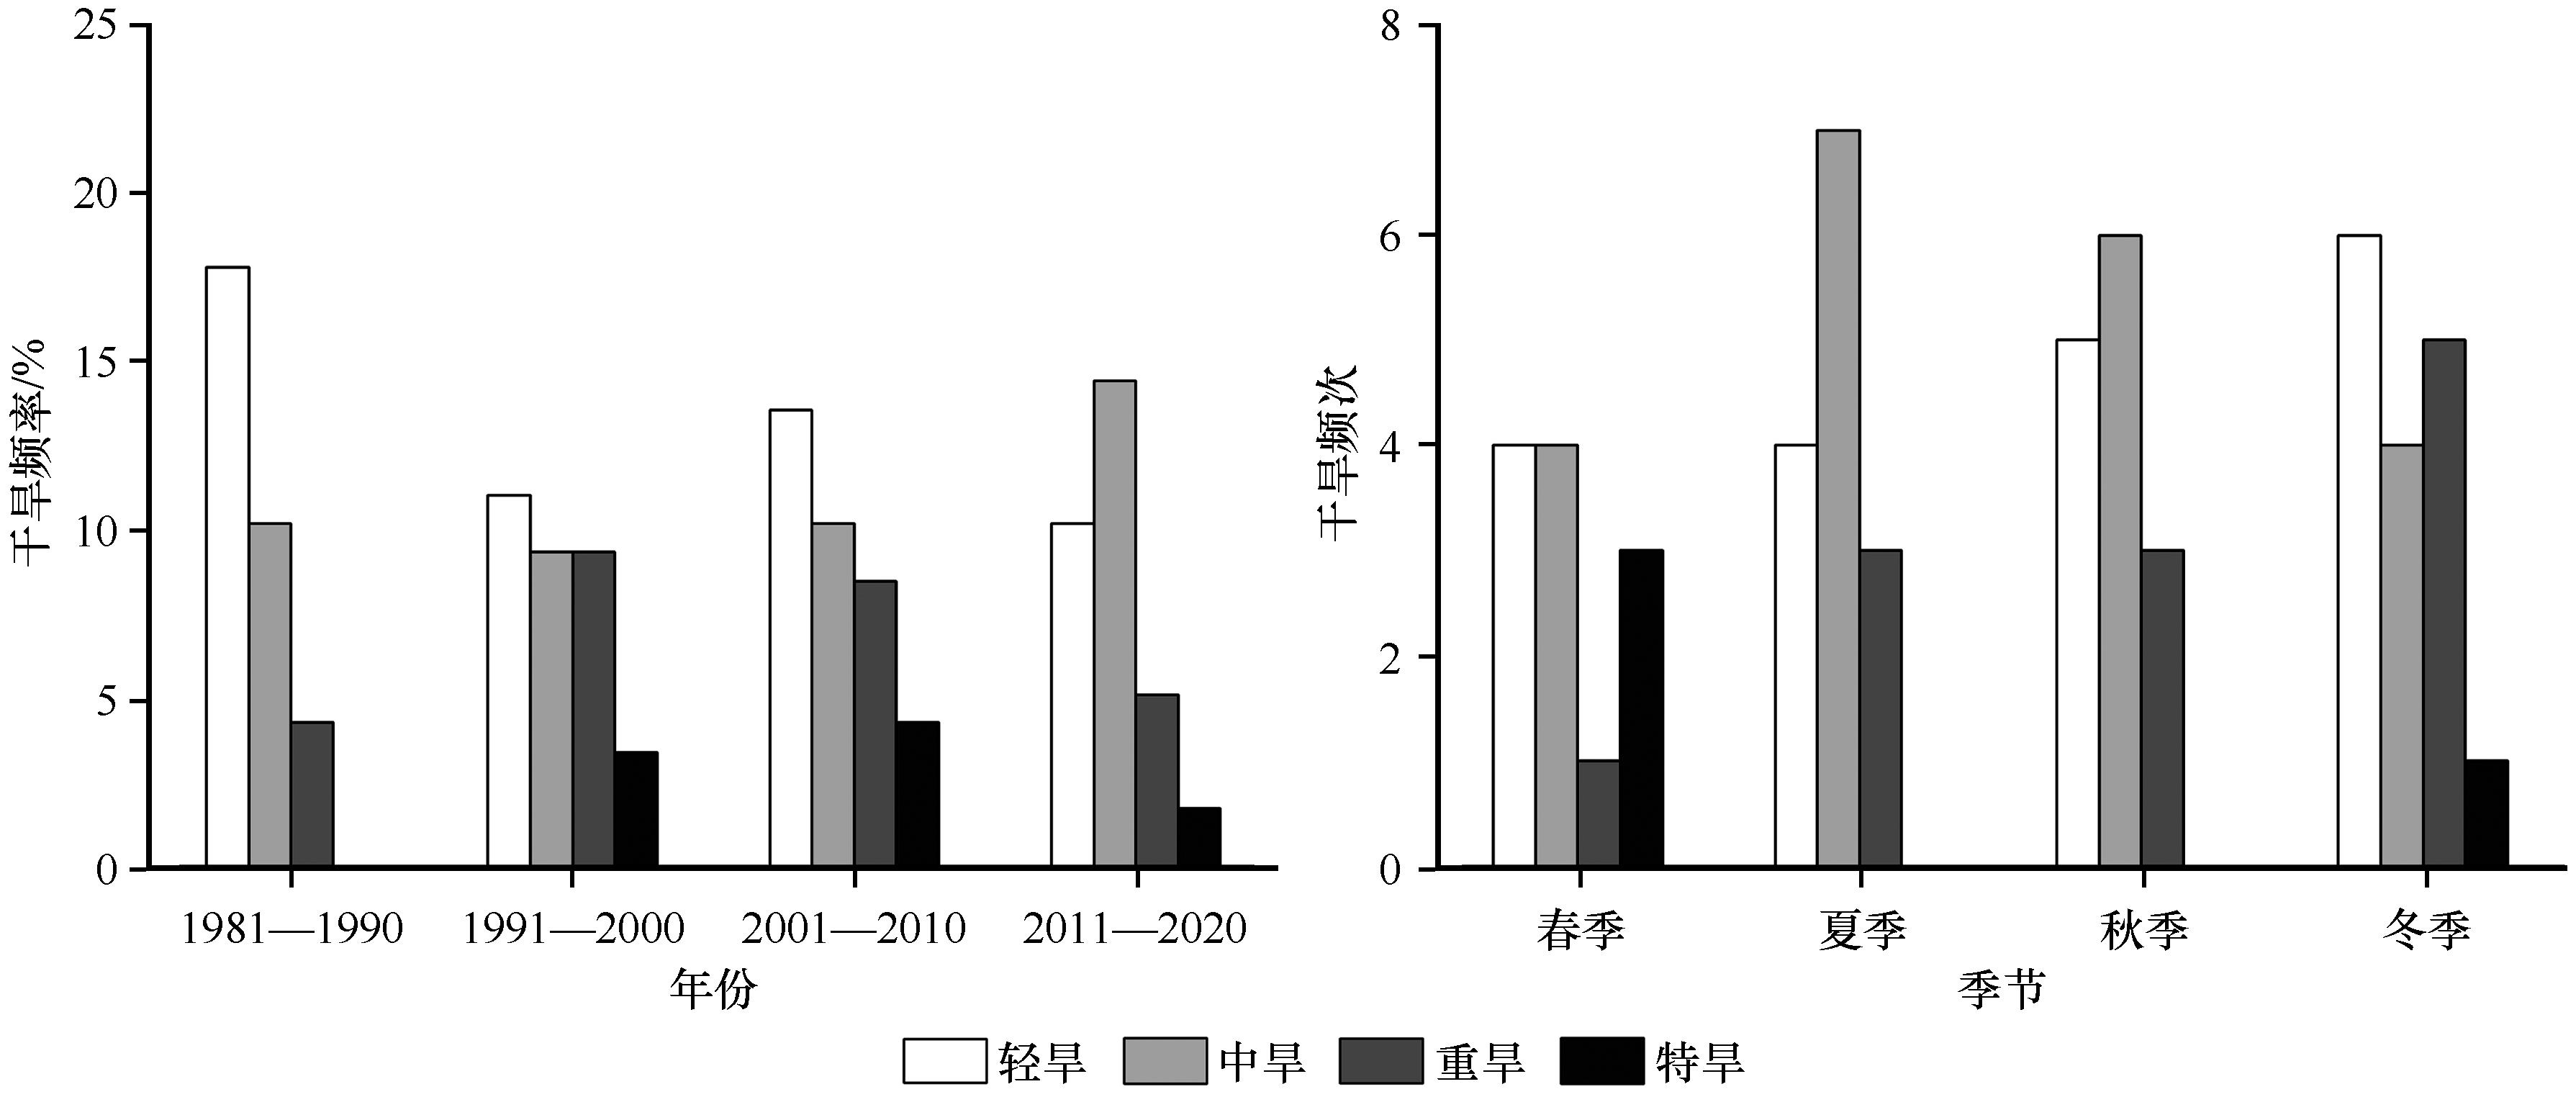
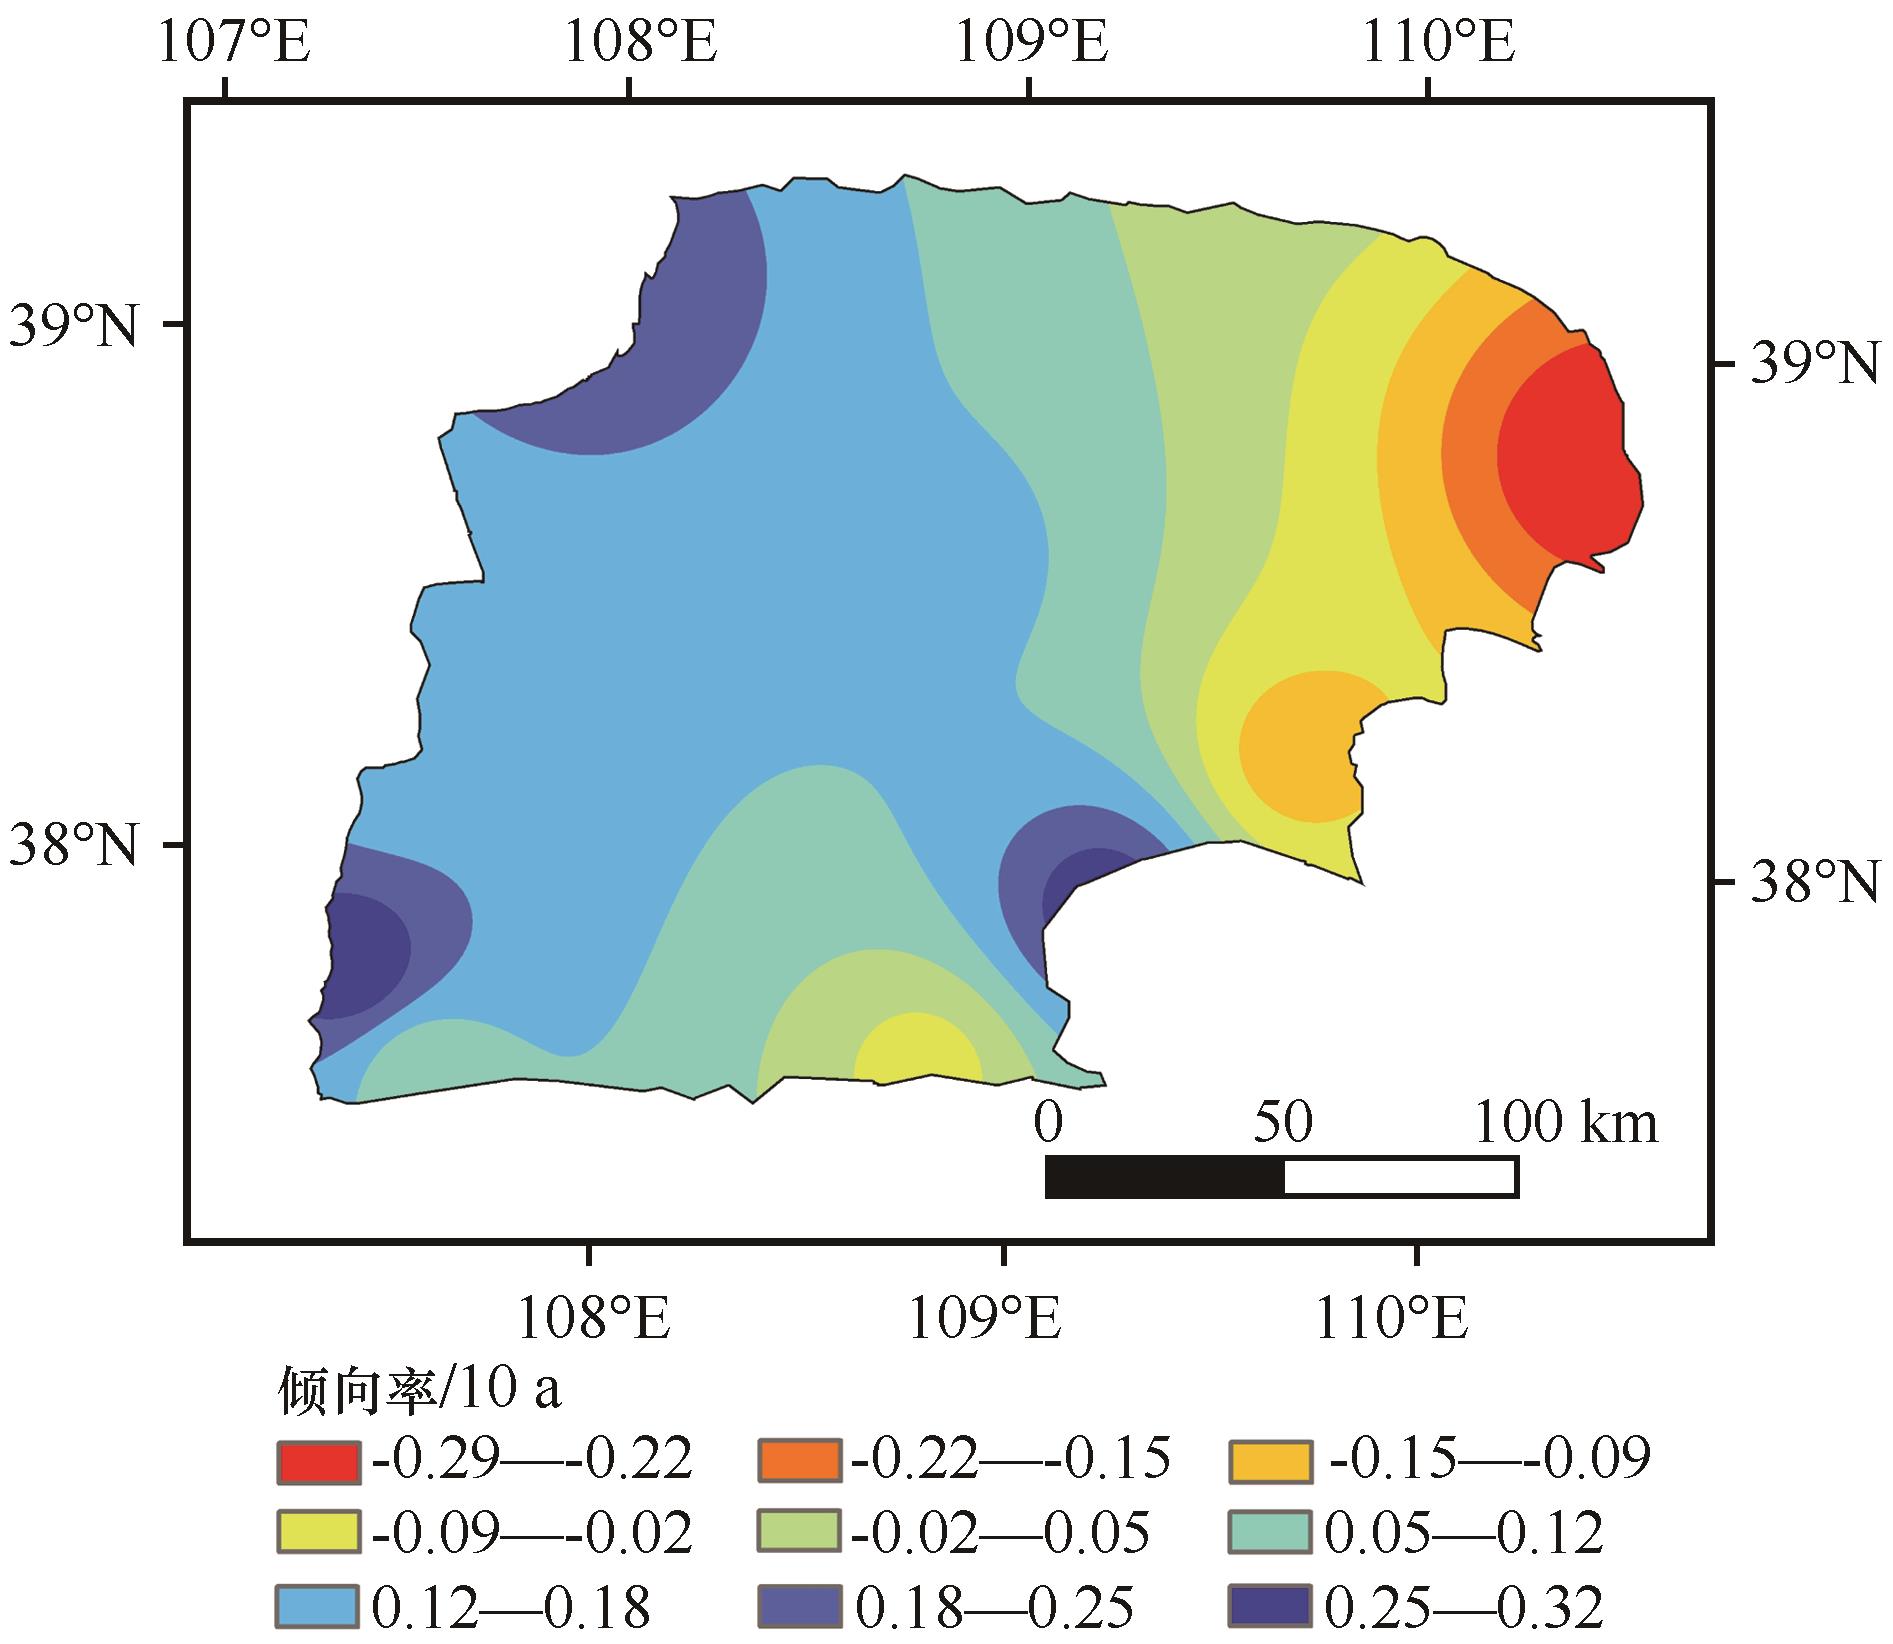
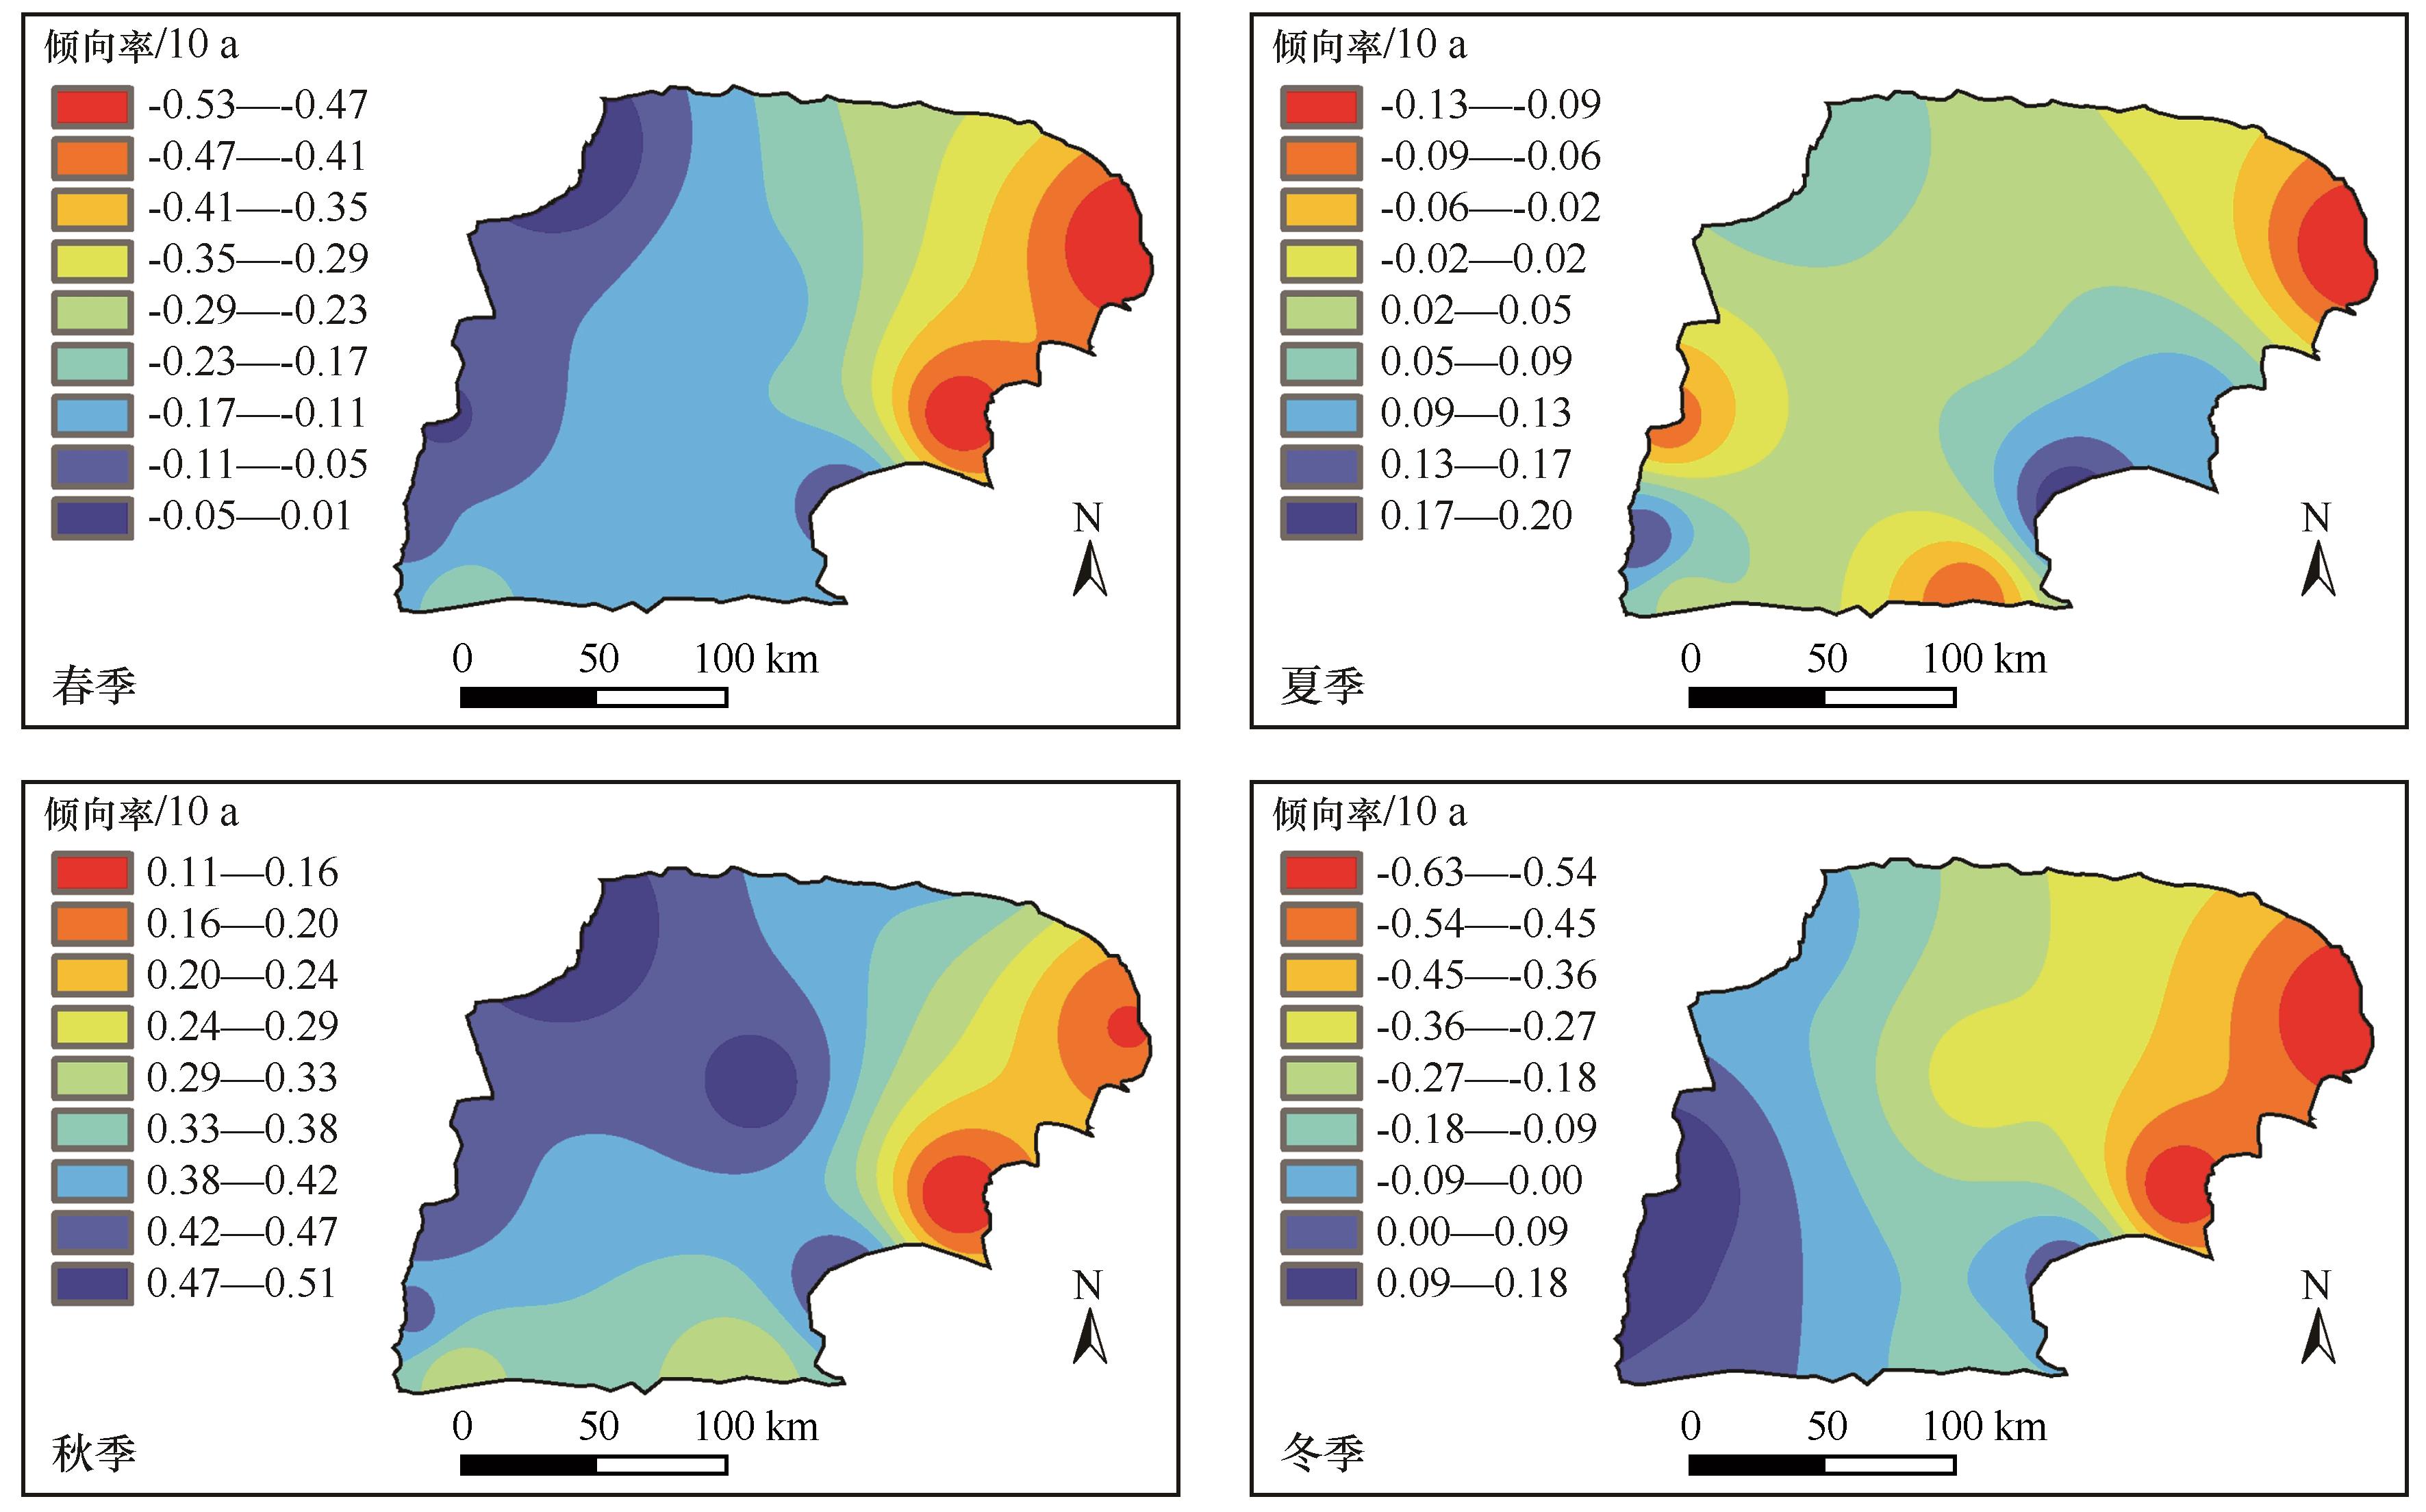
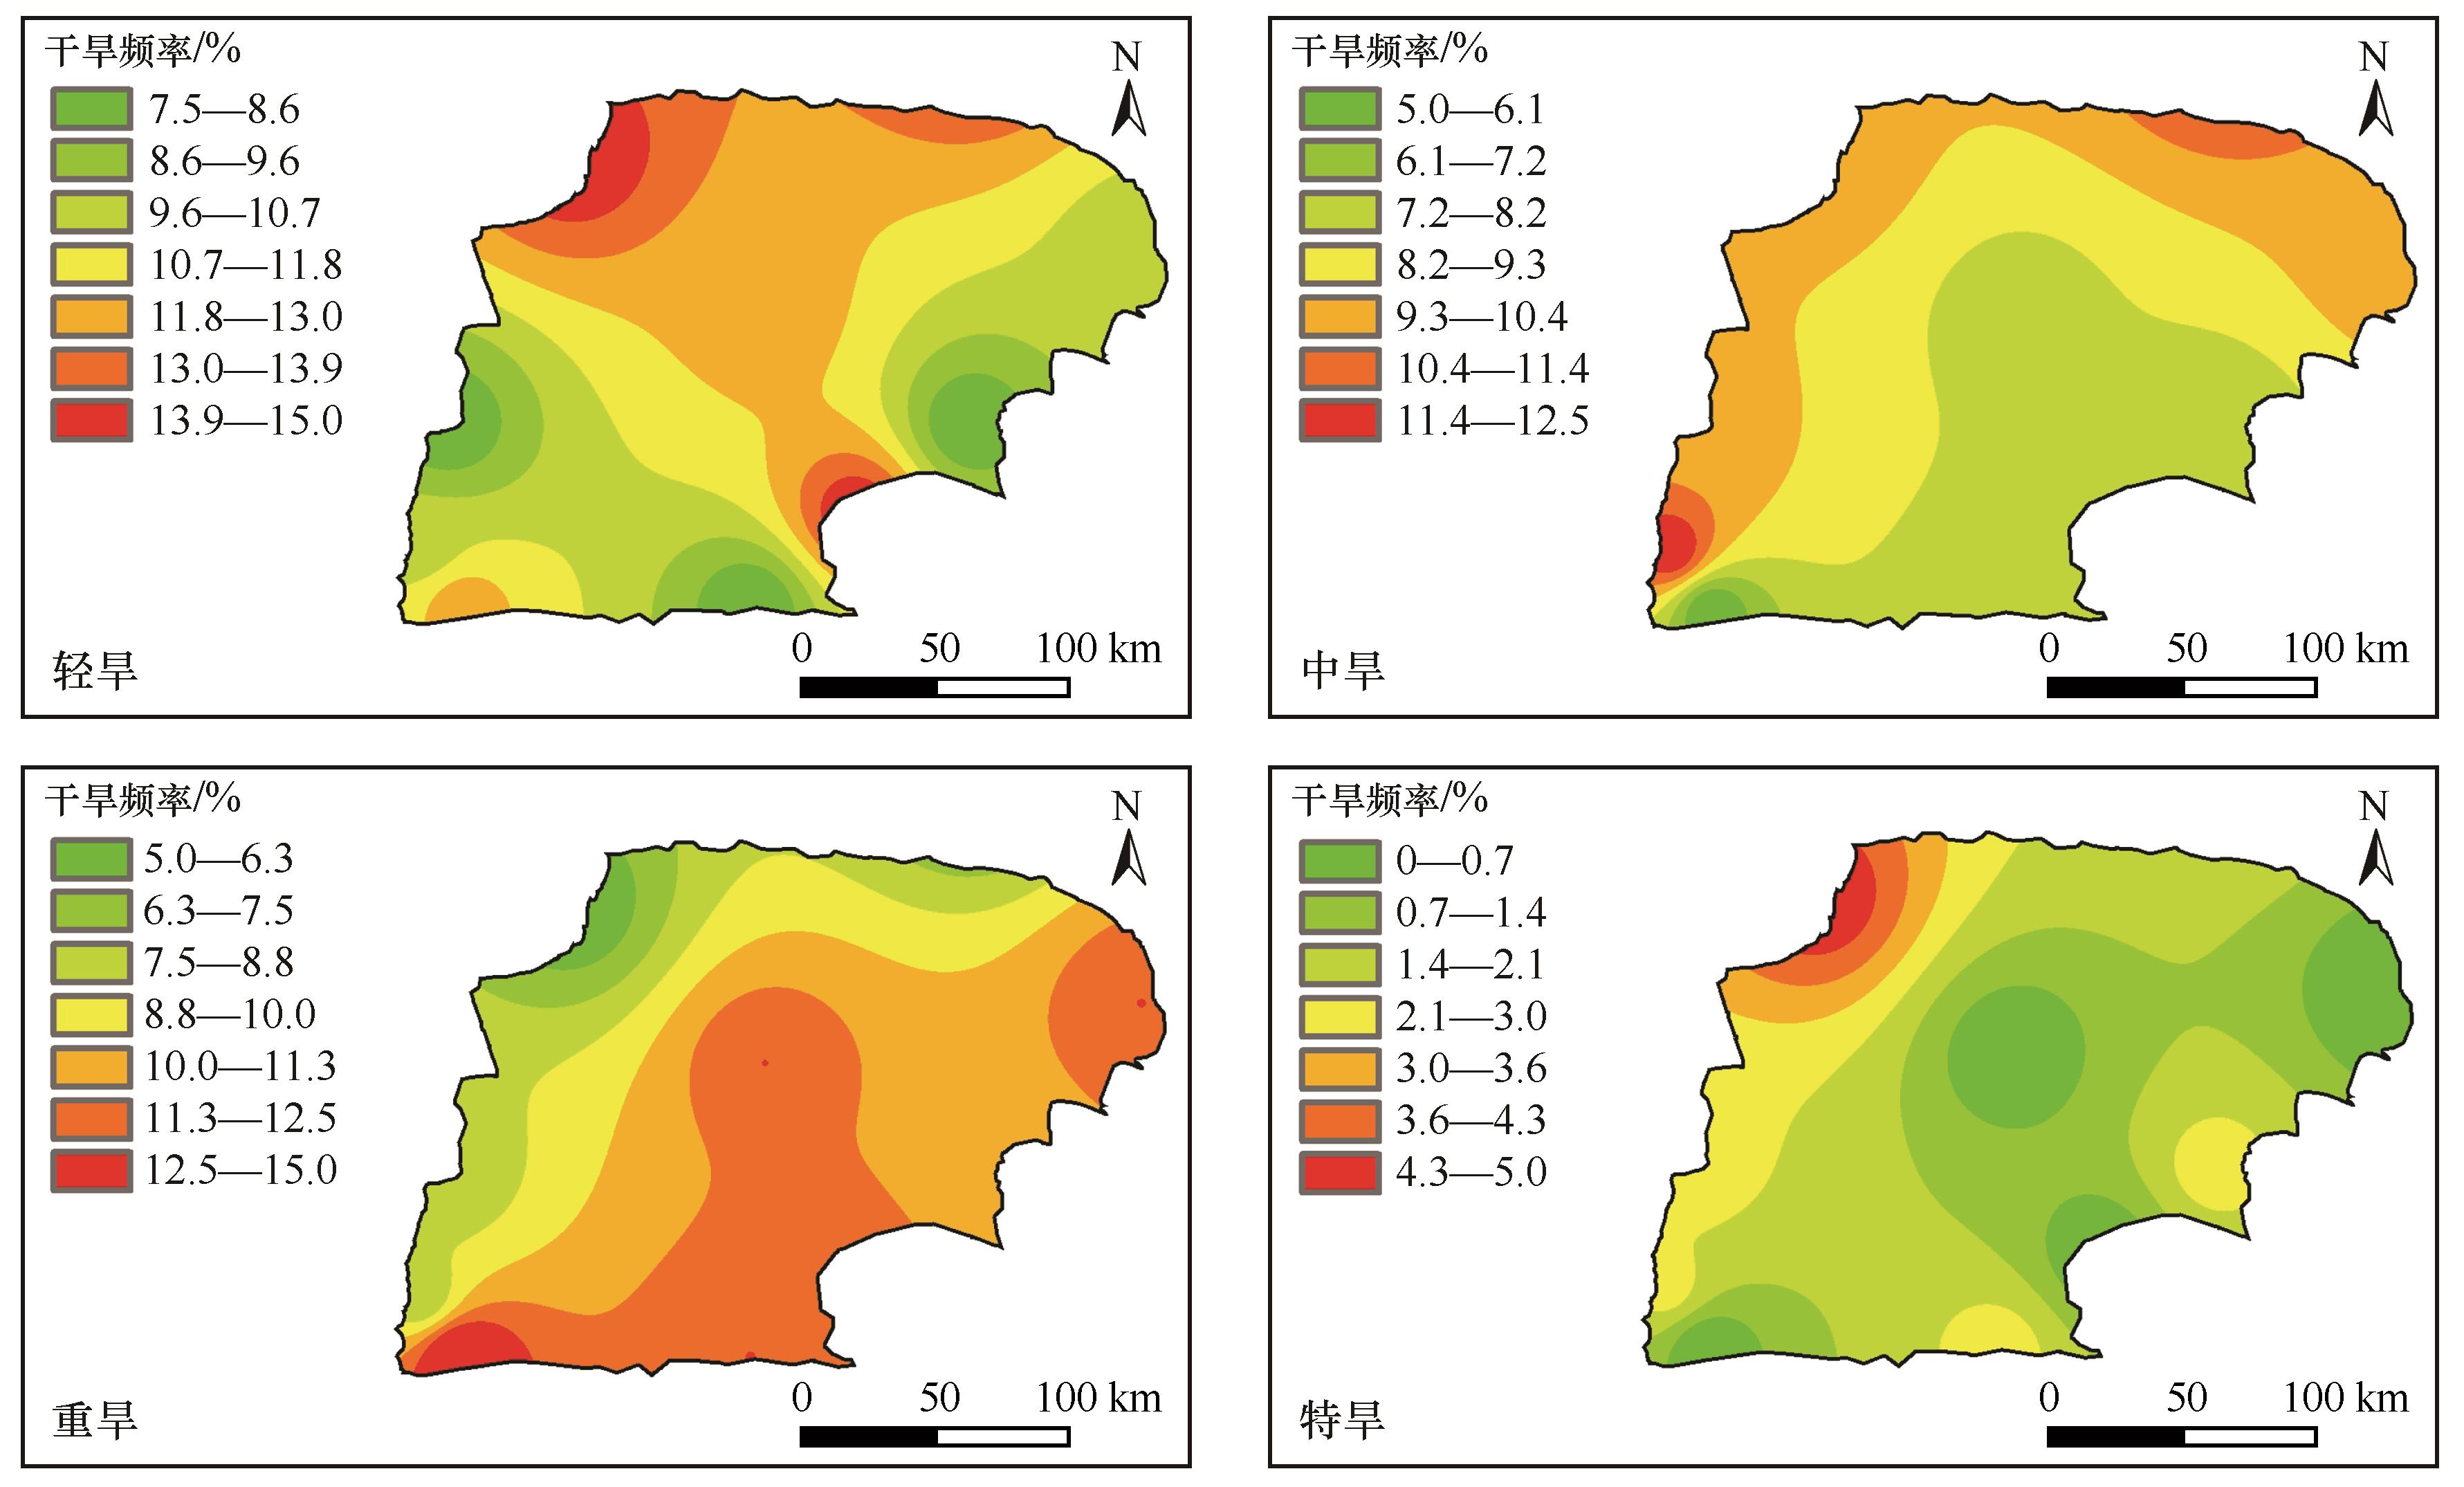
大气干旱是影响半干旱沙区植被建设、生态恢复及社会经济可持续发展的重要因素。基于1981—2020年毛乌素沙地10个气象站点的逐月气象资料,计算了月、季和年尺度的标准化降水蒸散指数(SPEI),分析了该沙区近40年降水和气温的变化趋势、干旱事件及其频率的时空特征。结果表明:(1)毛乌素沙地近40年降水量和气温均呈现显著的上升趋势(P<0.05);秋季和冬季降水量呈现显著的上升趋势(P<0.05),四季气温均呈现显著的上升趋势(P<0.05)。(2)毛乌素沙地总体上呈现出不显著的湿润化趋势(P>0.05),但秋季呈显著的湿润化趋势(P<0.05);中、西部地区呈现出湿润化趋势,而东部地区则呈现干旱化趋势。(3)近40年毛乌素沙地的月尺度下干旱总频率达32.71%,各等级发生频率为轻旱>中旱>重旱>特旱,季节发生频次为冬季>夏季、秋季>春季;轻旱主要发生在毛乌素沙地的北部、中部、东南和西南部,中旱在东部、北部和西部边缘,重旱在东部、中部以及南部地区,特旱在西北部、南部和东南部区域。

关键词: 毛乌素沙地, 标准化降水蒸散指数, 时空特征, 干旱频率

Abstract:

Atmospheric drought is an important factor affecting vegetation construction, ecological restoration and social-economically sustainable development in the semi-arid sand areas. To understand the spatiotemporal characteristics of drought events in the Mu Us Sandy Land during the past 40 years, this paper estimated the standardized precipitation evapotvanspiration index (SPEI) at monthly, seasonal and annual scales, based on the monthly meteorological data from 1981 to 2020. The results showed that: (1) The average annual precipitation (351.61 mm) and the temperature (8.49 ℃) in nearly 40a both showed a significant upward trend (P<0.05). Seasonal precipitation increased throughout the four seasons, of which precipitation showed a significant upward trend in autumn and winter (P<0.05). The average temperature in all four seasons showed a significant upward trend (P<0.05). (2) Based on the SPEI index, it generally showed an insignificant wetting trend in the Mu Us Sandy Land (P>0.05) and a significant wetting trend in autumn (P<0.05). Meanwhile, it showed a trend of wetting both in the central and western regions, while it showed a drying trend in the eastern region of the Mu Us Sandy Land. (3) In the past 40 years, the total drought frequency in Mu Us Sandy Land reached 31.9%. The order of the drought frequency was following as: light drought>moderate drought>severe drought>very severe drought; and the drought frequency had an order of winter>summer, autumn>spring. The light drought mainly occurred in the north, central, southeast and southwest regions; the middle drought occurred mainly in the eastern, northern and western edges regions; the severe drought mainly occurred in the eastern, central and southern regions; while the very severe drought events mainly occurred in the northwest, south and southeast regions of Mu Us Sandy Land. These results will contribute to the water resources planning, ecological restoration, disaster prevention and mitigation in the Mu Us Sandy Land.

Key words: Mu Us Sandy Land, standardized precipitation evapotranspiration index, spatiotemporal characteristics, drought frequency

中图分类号: