img

官方微信

高级检索

中国沙漠 ›› 2020, Vol. 40 ›› Issue (5): 20-24.DOI: 10.7522/j.issn.1000-694X.2020.00044

• • 上一篇    下一篇

若尔盖盆地起沙风风况与输沙势特征

胡光印1,2(), 董治宝1, 张正偲2, 周明3, 尚伦宇2   

  1. 1.陕西师范大学 地理科学与旅游学院,陕西 西安 710119
    2.中国科学院西北生态环境资源研究院,甘肃 兰州 730000
    3.中国葛洲坝集团股份有限公司,湖北 武汉 430000
  • 收稿日期:2020-04-09 修回日期:2020-04-28 出版日期:2020-09-28 发布日期:2020-09-28
  • 作者简介:胡光印(1980—),男,贵州遵义人,副教授,博士,主要从事青藏高原地区沙漠化与风沙活动研究。E-mail: guangyinhu@snnu.edu.cn
  • 基金资助:
    第二次青藏高原综合科学考察研究项目(2019QZKK0403);国家自然科学基金项目(41875016);中国科学院寒旱区陆面过程与气候变化重点实验室开放基金项目(LPCC2017008)

The regime of sand driving wind and sand drift potential in Zoige Basin

Guangyin Hu1,2(), Zhibao Dong1, Zhengcai Zhang2, Ming Zhou3, Lunyu Shang2   

  1. 1.School of Geography and Tourism,Shaanxi Normal University,Xi'an 710119,China
    2.Northwest Institute of Eco-Environment and Resources,Chinese Academy of Sciences,Lanzhou 730000,China
    3.China Gezhouba Group Company Limited,Wuhan 430000,China
  • Received:2020-04-09 Revised:2020-04-28 Online:2020-09-28 Published:2020-09-28

摘要:

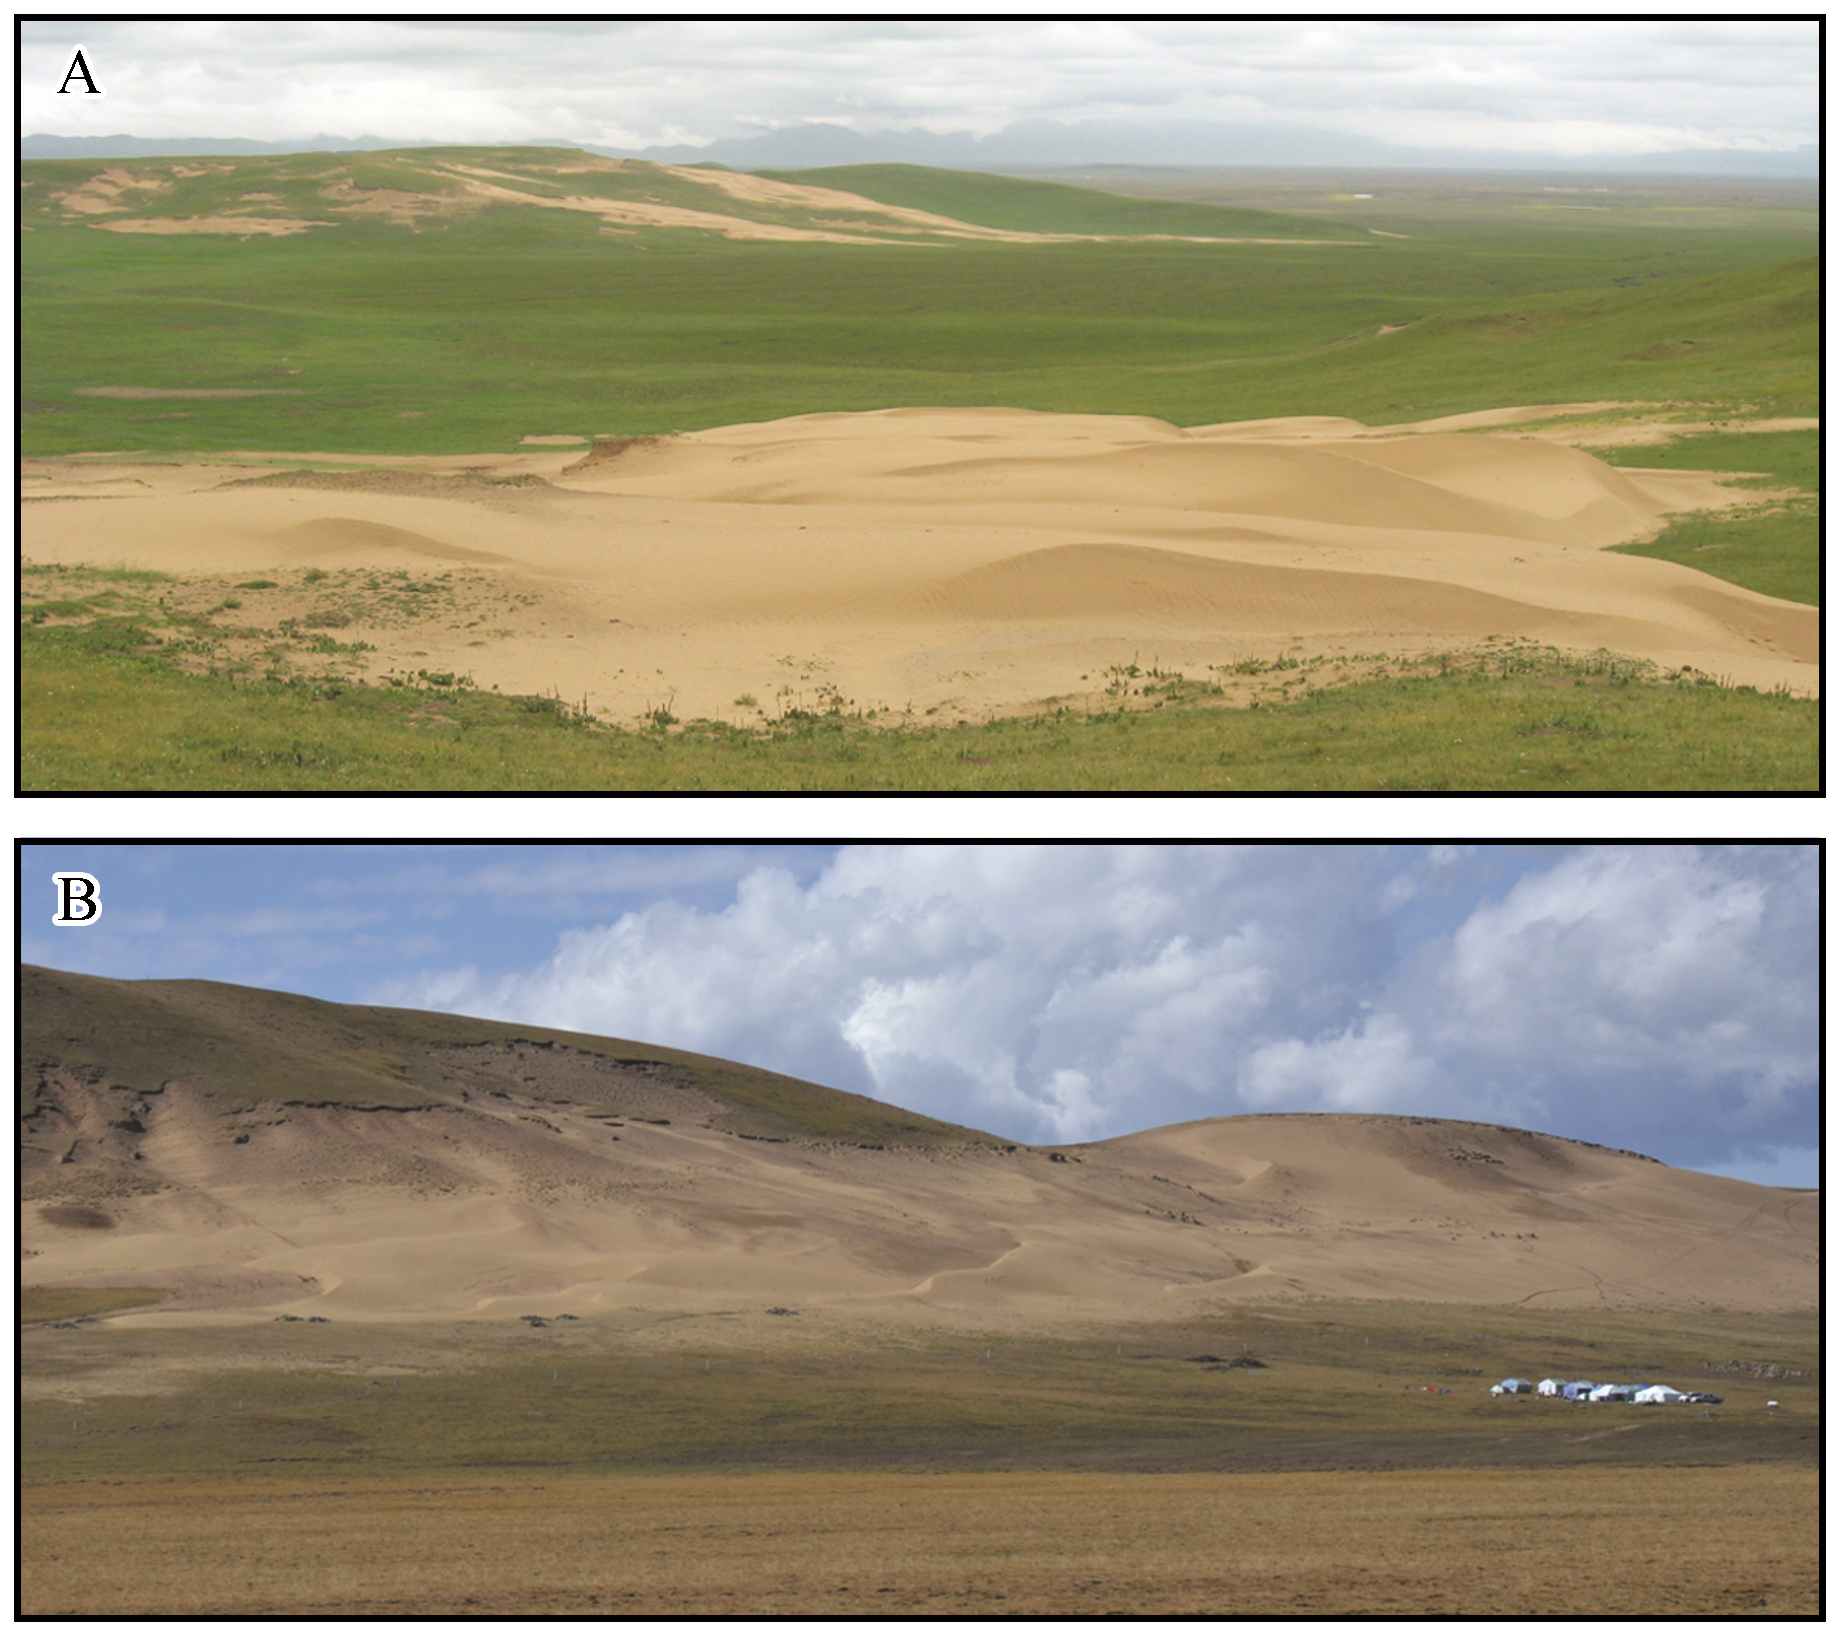
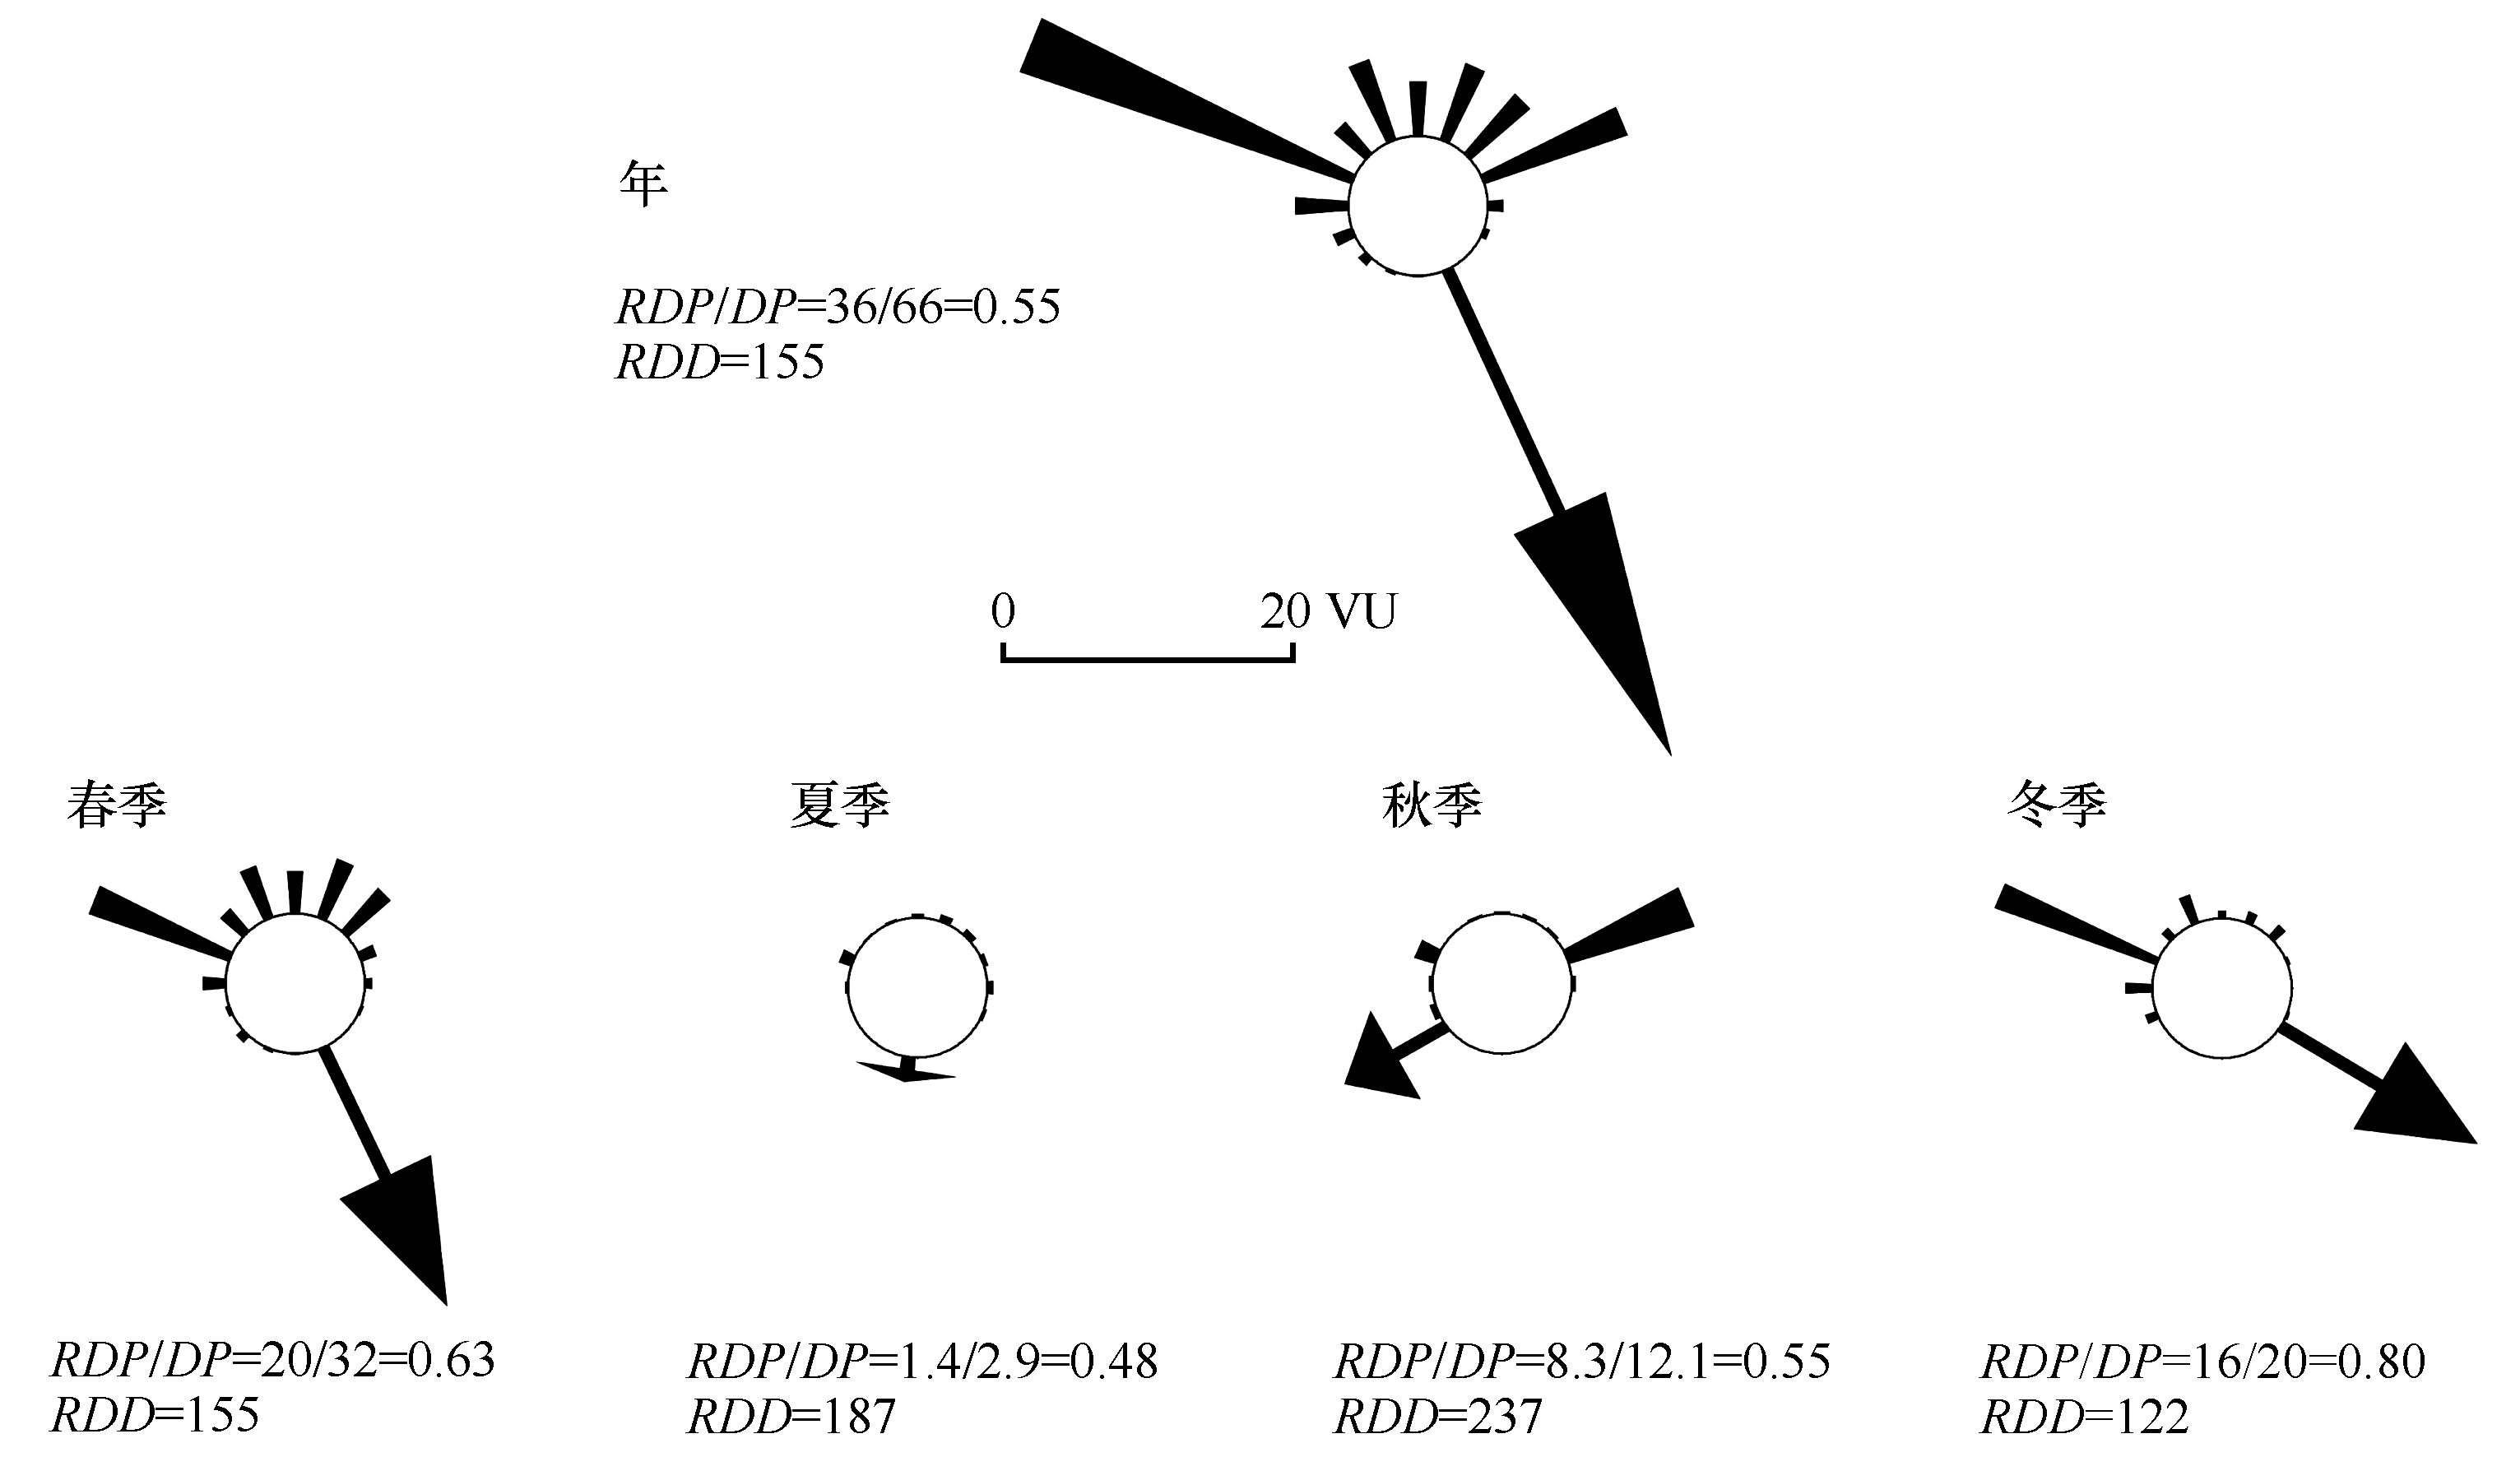
采用中国科学院西北生态环境资源研究院若尔盖高原湿地生态系统研究站实测的风速、风向数据(每小时记录),对若尔盖盆地起沙风风况与输沙势进行了分析。结果表明:若尔盖盆地年平均风速为2.59 m·s-1,春季平均风速3.14 m·s-1,夏季、秋季、冬季的风速较小且相差不大,平均风速分别为2.45、2.24、2.53 m·s-1。起沙风占全年风速记录的8.75%,主要来自WNW、NE和NNE方向,分别占起沙风的26.23%、16.70%和15.27%。若尔盖盆地的年输沙势为66.44 VU,属于低风能环境(≤200 VU);年合成输沙势为36.22 VU,合成方向为155°(SSE);年输沙势的方向变率指数(RDP/DP)为0.55,属于中变率(0.3~0.8);从方向上来看,年输沙势主要来自于WNW,占年输沙势的37.36%;其次为ENE,占16.08%。该地区的输沙势还存在明显的季节变化特征:春季输沙势最大,为31.58 VU,占年输沙势的47.54%;其次是冬季,输沙势为19.91 VU,占全年的29.96%。春季和冬季合成输沙势的方向分别为155°(SSE)和122°(ESE),该地区的风沙运移方向与年合成输沙势的方向(SSE)基本一致。

关键词: 若尔盖盆地, 起沙风, 输沙势, 沙漠化, 黄河源区, 青藏高原

Abstract:

Based on hourly recorded wind data (wind speed and direction), we analyzed the regime of sand driving wind and sand drift potential in the Zoige Basin. It shows that the annual wind speed is 2.59 m·s-1. The wind speed in spring is maximum (3.14 m·s-1), and the speed in summer, autumn and winter are relatively light with a speed of 2.45, 2.24 and 2.53 m·s-1, respectively. Sand driving winds account for 8.75% of annual wind speed records, mainly coming from WNW, NE and NNE, accounting for 26.23%, 16.70% and 15.27% of the total sand driving wind records. The calculated drift potential (DP) according to Fryberger’s method shows that the annual drift potential is 66.44 VU, belonging to low wind energy environment (≤200 VU), and the annual resultant drift potential (RDP) is 36.22 VU with resultant direction of 155°(SSE). Directional variability index (RDP/DP) is 0.55, which belongs to intermediate directional variability (0.3<RDP/DP<0.8). The annual drift potential mainly comes from WNW and ENE, accounting for 37.36% and 16.08% of the annual total, respectively. The drift potential in this region shows obvious seasonal characteristics: which is highest in spring (31.58 VU) and followed by winter (19.91 VU), accounting for 47.54% and 29.96% of the annual value, respectively. The resultant direction of drift potential in spring and winter are 155°(SSE) and 122°(ESE), respectively. The direction of sand migration in this the Zoige Basin is basically consistent with the annual resultant drift direction (SSE).

Key words: Zoige Basin, sand driving wind, sand drift potential, aeolian desertification, source region of the Yellow River, Tibetan Plateau

中图分类号: